1. Introduction
In the mid to late 20th century, as the global population multiplied, the global urbanization rate increased. The urbanization rate rose particularly rapidly in developing countries. However, population expansion and growth are no longer only relevant to cities. Urban shrinkage, characterized by population decline, has become a worldwide phenomenon [
1,
2]. In 2008, United Nations-Habitat released a report entitled “State of the World’s Cities 2008/2009: Harmonious Cities.” Chapter 1,
Section 4 was entitled “Shrinking Cities.” This chapter indicated that cities do not only grow but also experience rising and falling cycles; recessions and population shrinkage lead to permanent changes in urban structures. Evidence has revealed that several cities in all regions of the world, both in developed and developing countries, shrank from 1990 to 2000 [
3]. Since the beginning of the 21st century, several cities across Europe and North America have experienced population decline, an increase in vacant space, and the underutilization of urban infrastructure [
4]. Since then, the phenomenon of city shrinkage also began to appear in China [
5,
6,
7], Japan [
8,
9], and South Korea [
10,
11,
12].
The concept of shrinking cities was first developed to describe the hollowing out of a city due to massive population loss [
13,
14]. The term “shrinking city” comes from the German phrase
Schrumpfende Städte, coined by Häußermann and Siebe [
15]. It describes the phenomena of deindustrialization, population decline, and economic recession in German cities. Urban shrinkage usually manifests as population decline, increases in unemployment, and decreases in a neighborhood’s quality of life [
16,
17]. Urban shrinkage does not refer to a decrease in the physical area of metropolitan jurisdictions or developed areas. Rather, the term denotes a decrease in average population density [
18].
In 2004, 30 scholars and experts from 14 countries established the Shrinking Cities International Research Network (SCIRN) at the Institute of Urban and Regional Development of the University of California, Berkeley. The network defined shrinking cities as densely populated urban areas with at least 10,000 inhabitants that have experienced population decline across most areas for more than two years and are undergoing an economic transformation characterized by an inevitable structural crisis [
19]. This definition is used not only in empirical research but in the academic community. When Hollander et al. [
20] examined the basic theory of planning shrinking cities, they cited the SCIRN report in their definition of shrinking cities. In terms of the core issue, the majority of researchers agree that population decline is the best criterion for determining whether a city is shrinking [
21]. Population growth is used as the primary indicator of the trajectory of urban development in part because of the availability of data, and in part for the sake of consistency with previous research [
1]. However, because of the substantial differences in urban development among countries and regions, researchers have not reached a consensus regarding the criteria for determining whether a city is shrinking [
22].
Shrinking cities is a neutral term. In the discourse surrounding urban population decline, economic recession, and the phenomena they cause, derogatory terms such as urban decline and ghost towns are often used. Shrinking cities connotes population decline and the issues it causes. By contrast, urban decline connotes economic issues and the social, material, and environmental problems caused by economic downturns. Although economic recessions can lead to population decline, no absolute causal relationship has been established between them [
1]. A city with a declining population can maintain economic growth by improving production efficiency and through industrial upgrades, and a decline in population can also improve problems of crowding in urban environments. Residents of a city in a recession may continue to thrive [
23]. The term ghost town carries a strong derogatory connotation and represents an extreme result of urban shrinkage. The term shrinking city, as used in this study, refers to a municipality that has experienced sustained population decline over a certain period of time and changes in its resources for urban development.
Taiwan’s urbanization rate accelerated along with the rapid population growth of the mid-20th century. Under the definition of urbanization as the proportion of people living in towns with more than 50,000 residents, the degree of urbanization in Taiwan increased from 33% in 1956 to 78% in 2000 [
24]. According to the United Nations definition, in which 20,000 residents is the standard for urban, the degree of urbanization in Taiwan in 2000 was nearly 95% [
25]. Urban development usually involves four stages: urbanization, suburbanization, counter-urbanization, and re-urbanization [
26]. An empirical study by Liu et al. [
24] revealed that the first three stages of urban development in Taiwan from 1950 to 2000 followed those of modern European countries, as defined by Van den Berg et al. [
27]. The period between 1950 and 1970 represents the urbanization stage. The period between 1970 and 1990 represents the end of the urbanization stage and the beginning of suburbanization. The period between 1990 and 2000 represents the suburbanization stage. Suburbanization is one of the main causes of urban population decline [
17,
28]. During the 1950s and 1960s in the United States, the center of urban areas shrank, whereas the suburbs grew. The early shrinking process was triggered by suburbanization, and suburban sprawl led to a sharp decline in the populations of city centers [
29]. Because Taiwan has been following a similar pattern to that of some European countries and the United States, Taiwan, too, will likely face the fourth stage of shrinkage.
However, growth is still considered in the traditional paradigm of thought as a core element of Taiwan’s urban development. Various problems caused by city shrinkage have been investigated in Taiwan. However, the concept of city shrinkage has not yet been acknowledged by the Taiwanese Government, academia, or society. As in many parts of the world, the concept of shrinking cities has been permanently stigmatized in the field of urban planning in Taiwan [
30]. During Kaohsiung City’s mayoral election in 2017, the mayor-elect promised to increase Kaohsiung’s population from 2.78 million to 5 million [
31]. Taiwan’s most revised
Spatial Planning Act was released in April 2020. According to
Article 3, of Chapter I, General Provisions, the term “growth management” was added to the terminology in the law, but “urban shrinkage,” “shrinking city,” or “smart decline” were not added [
32]. Their inclusion in towns’ laws is imperative because the actual size of Taiwan’s towns is vastly different from that which is estimated by urban planning, and therefore, continuous population growth and urban expansion without incorporation of analyses of urban shrinkage is not feasible. Taiwan has implemented plans for 433 nationwide urban development sites, with a total planned area of 4815 km
2, accounting for 13% of Taiwan’s land area. In 2019, the population of the areas in the nationwide urban development plan was 18.517 million, only 73.3% of the planned population of 25.241 million. Taiwan’s total population peaked at 23.603 million in December 2019 and has since exhibited negative growth. In addition, Taiwan has faced the issues of a declining birthrate and an aging population [
33], which represent challenges to the sustainable development of cities and are causes of urban shrinkage. Continuous population growth and urban expansion are not sustainable development models.
Academics and policymakers must adroitly address the phenomenon of urban shrinkage and the problems caused by the incongruous combination of Taiwan’s population decline and the push for urban development. Academic research in Taiwan had not addressed urban shrinkage until ten years ago. In empirical studies on Taiwan’s urban shrinkage, the data used to ascertain shrinkage has been one-sided, and no shrinkage identification has been conducted for the counties and towns on Taiwan’s main island. A 2014 study identified 295 shrinking towns based on population registers and employment surveys [
34]. A 2017 study identified shrinking towns in 19 counties based on census data [
35]. A 2018 study identified 175 shrinking towns based on population registers [
36]. Determining population based on census data or population registers without nuance in Taiwan constitutes a hindrance that may lead to inaccurate assessments. Pallagst [
37] indicated that the unemployed population should not be considered in the evaluation of urban shrinkage. Changes in the unemployed population are closely related to macroeconomic factors. Although the unemployed population in cities increases during economic downturns, this does not necessarily mean that cities will also experience population decline. Therefore, the choice of population data is crucial in the evaluation of shrinkage.
This study used census data and population registers to examine Taiwan’s urban shrinkage and nonurban shrinkage. The shrinking city phenomenon in Taiwan’s counties and towns was identified through an analysis of population variation, time trajectories, and spatial patterns. In addition, changes in spatial demographics and their causes were explored. Finally, cluster analysis was used to explore the relationship between urbanization and shrinkage.
4. Discussion
4.1. Shrinkage and Urbanization
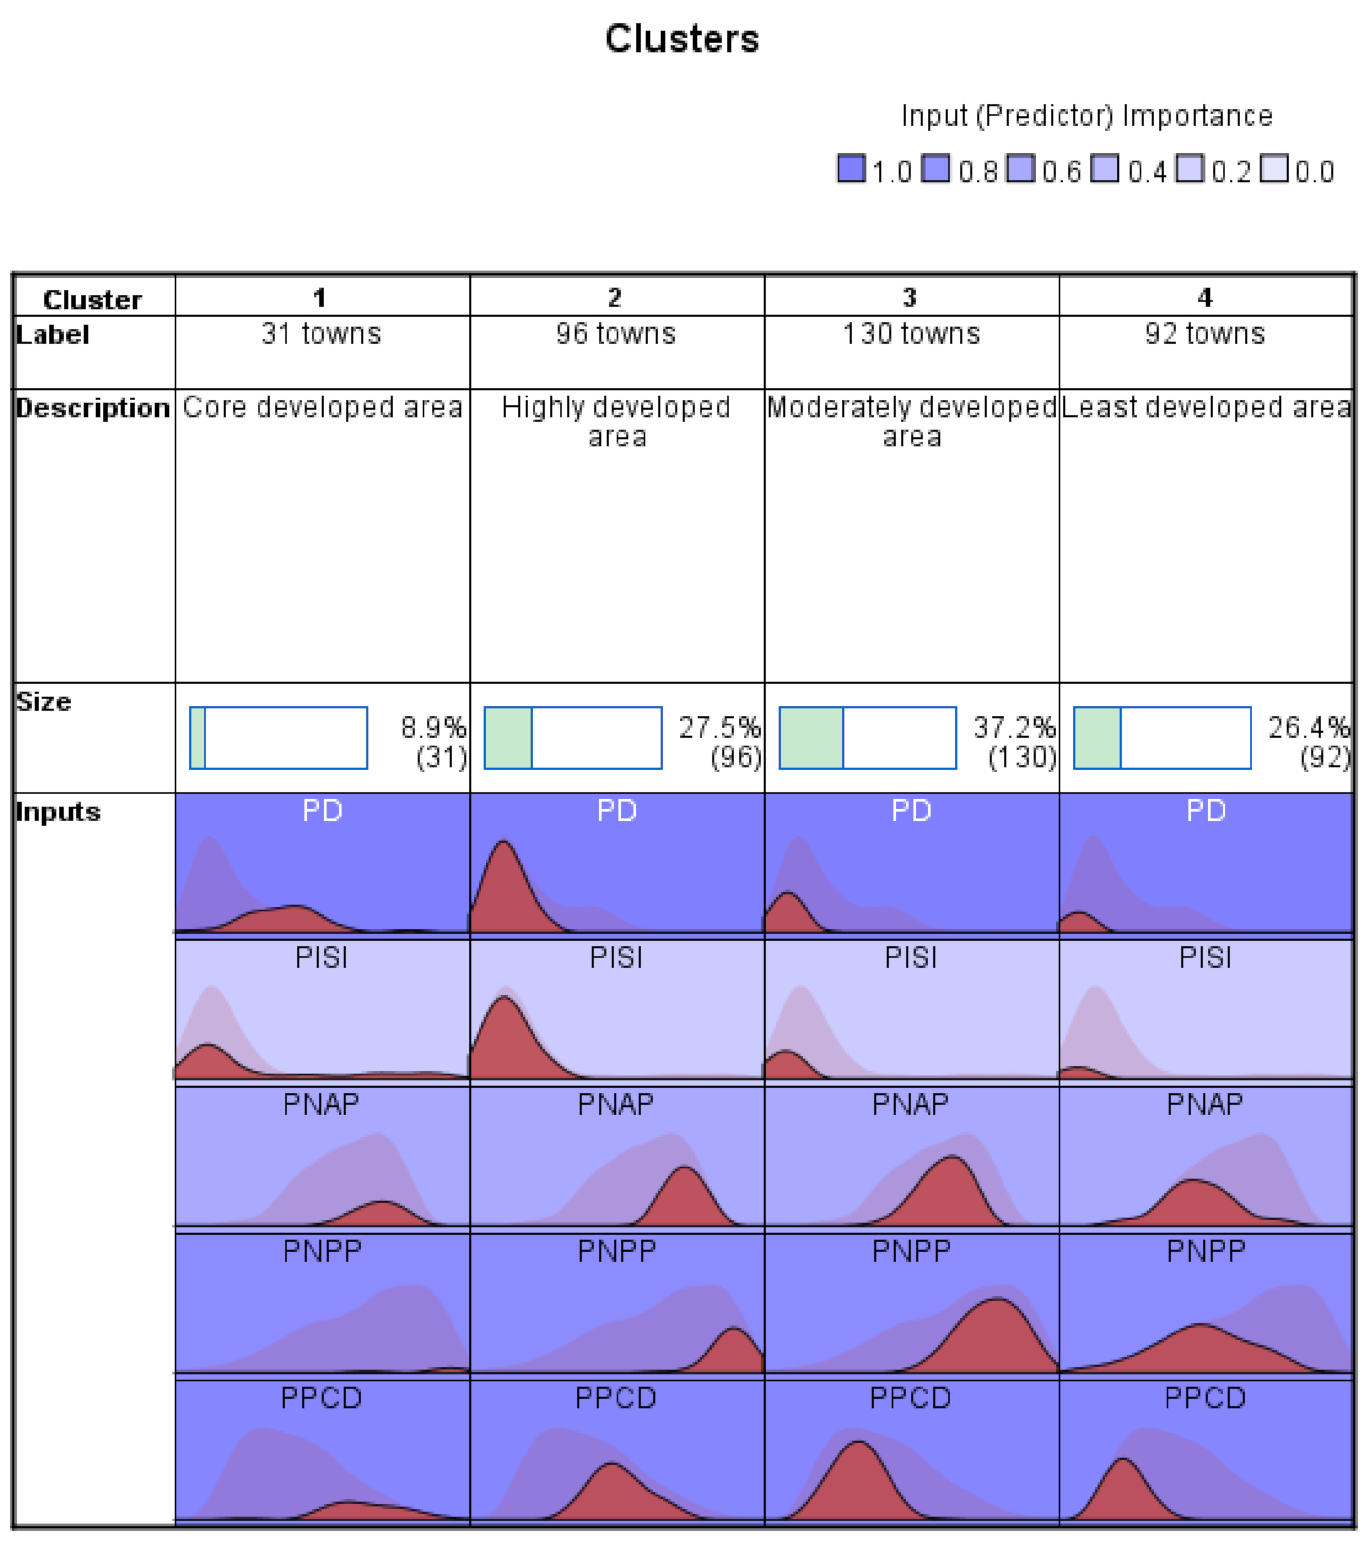
The LISA cluster analysis map of the registered population changes in towns (
Figure 8) and the shrinkage in the four areas (
Figure 10b) jointly indicate that the difference in shrinkage was explained by urbanization.
For the least developed area, 92.39% of the towns were considered shrinking towns, and this designation indicates that the shrinkage of the urban and rural areas is severe. The least developed areas are scattered throughout the main island of Taiwan and are not concentrated in a specific region. In the LISA cluster map, the registered population of most towns in the least developed areas had no considerable changes throughout four periods. Among the four areas, the least developed area had the oldest population and the advanced age area had a generally low fertility rate. Additionally, the urbanization of other areas has attracted some people who originally belonged to the least developed area. The combined effect of these factors has led to a general shrinkage in the least developed area.
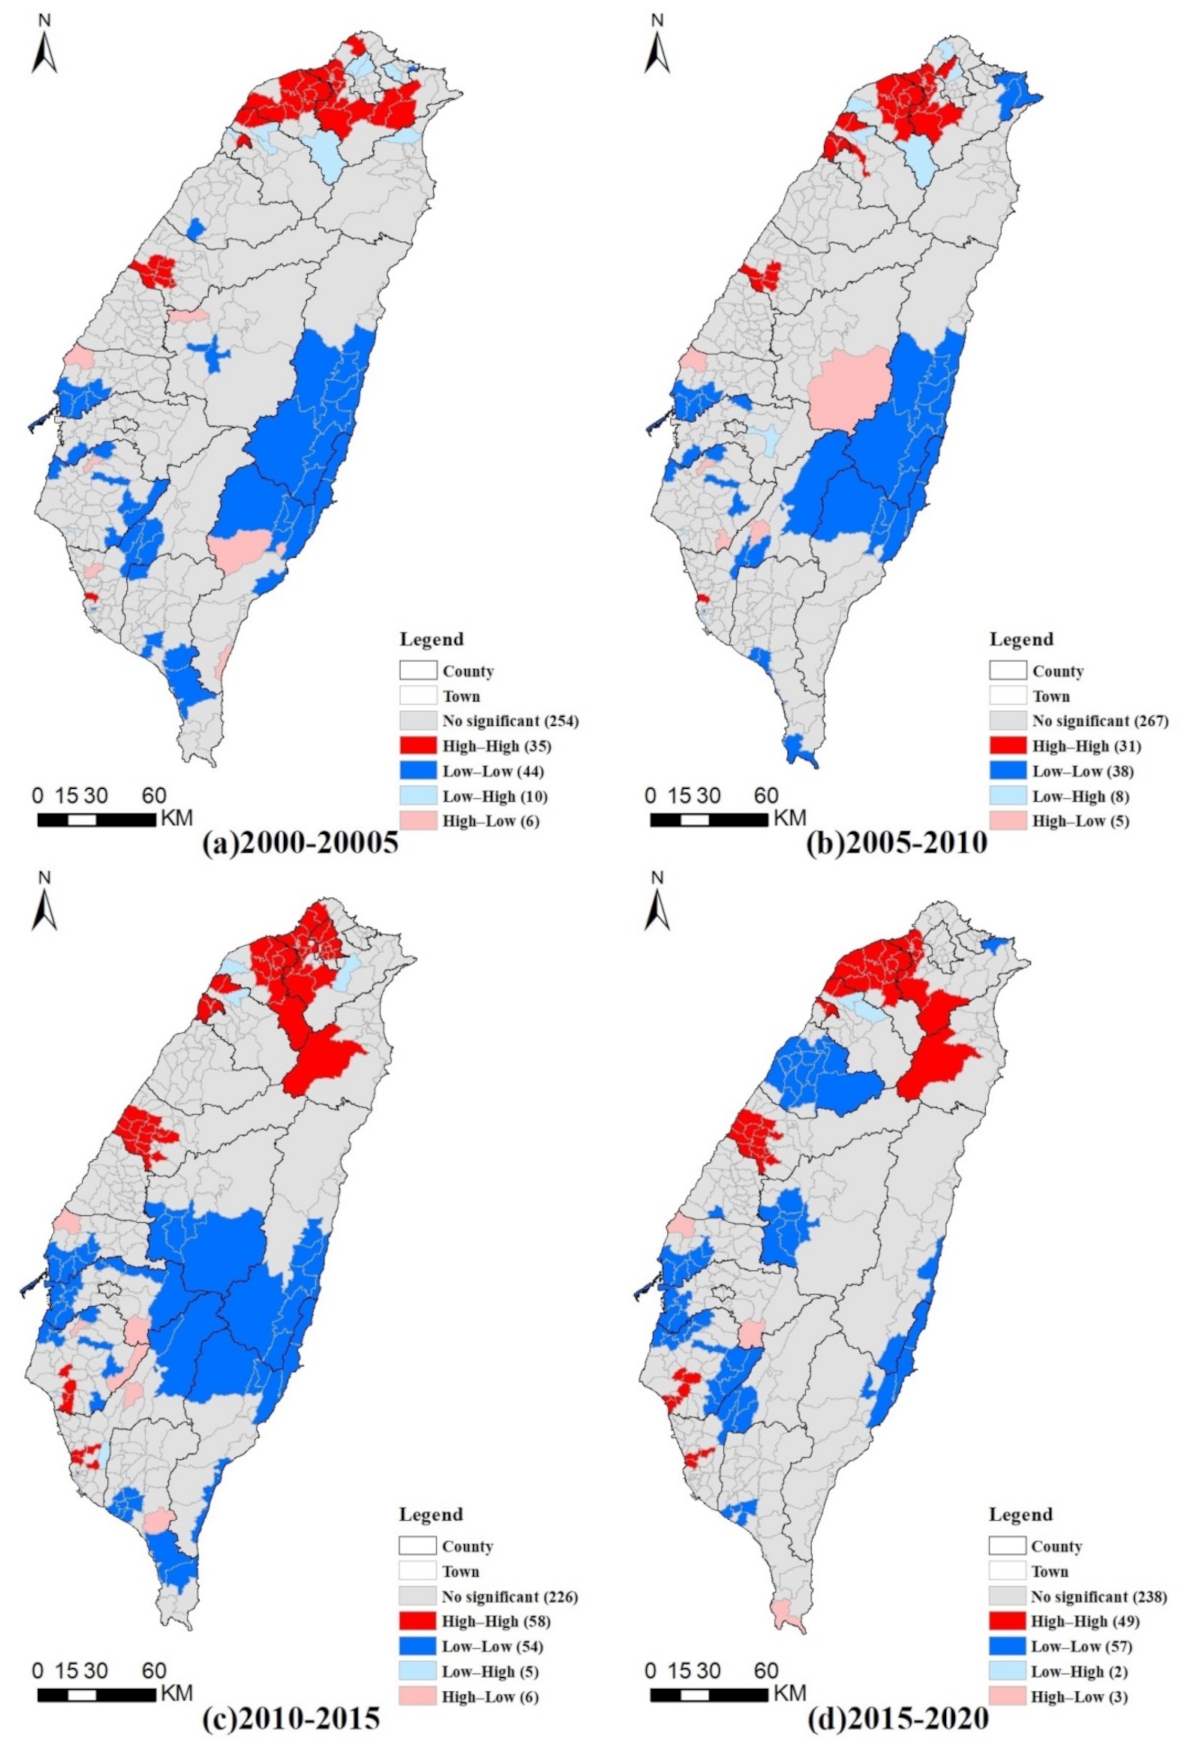
With regard to the moderately developed area, 66.92% of the towns were considered shrinking towns, and this designation indicates that the urban periphery has been shrinking substantially. The least developed areas have a higher shrinkage proportion; the population in the moderately developed areas flow to the core developed areas and the highly developed areas, as corroborated by the local spatial autocorrelation analysis. In the LISA cluster map, the changes of the registered population in most of the moderately developed areas belonged to high–low clusters in the four periods. Regarding the severity of population decline, governing the shrinkage of moderately developed areas is the most complex and urgent task at hand. The relatively low urbanization is the main reason for the shrinkage of the moderately developed areas.
In the LISA cluster map, most of the registered population changes in the core developed areas were not considerable. Nevertheless, 45.16% of the towns in the core developed are shrinking towns, and the urban core also exhibits shrinkage. In the core developed areas, high–high clusters generally appear, and this fact indicates that the population attractiveness of the urban core is weakening. The shrinkage of the core developed area is caused by suburbanization.
The lowest proportion of shrinking towns is in the highly developed areas, and the proportion of 12.50% is substantially lower than other areas. In the LISA cluster map, high–high clusters are widespread and appear in the highly developed areas in four periods. At the same time, the population of the highly developed areas is the youngest. Therefore, in terms of geographical and spatial relations, the urban areas between the urban core and the urban periphery have substantial population attraction.
4.2. Spatial Pattern of Shrinkage in Relation to Urbanization
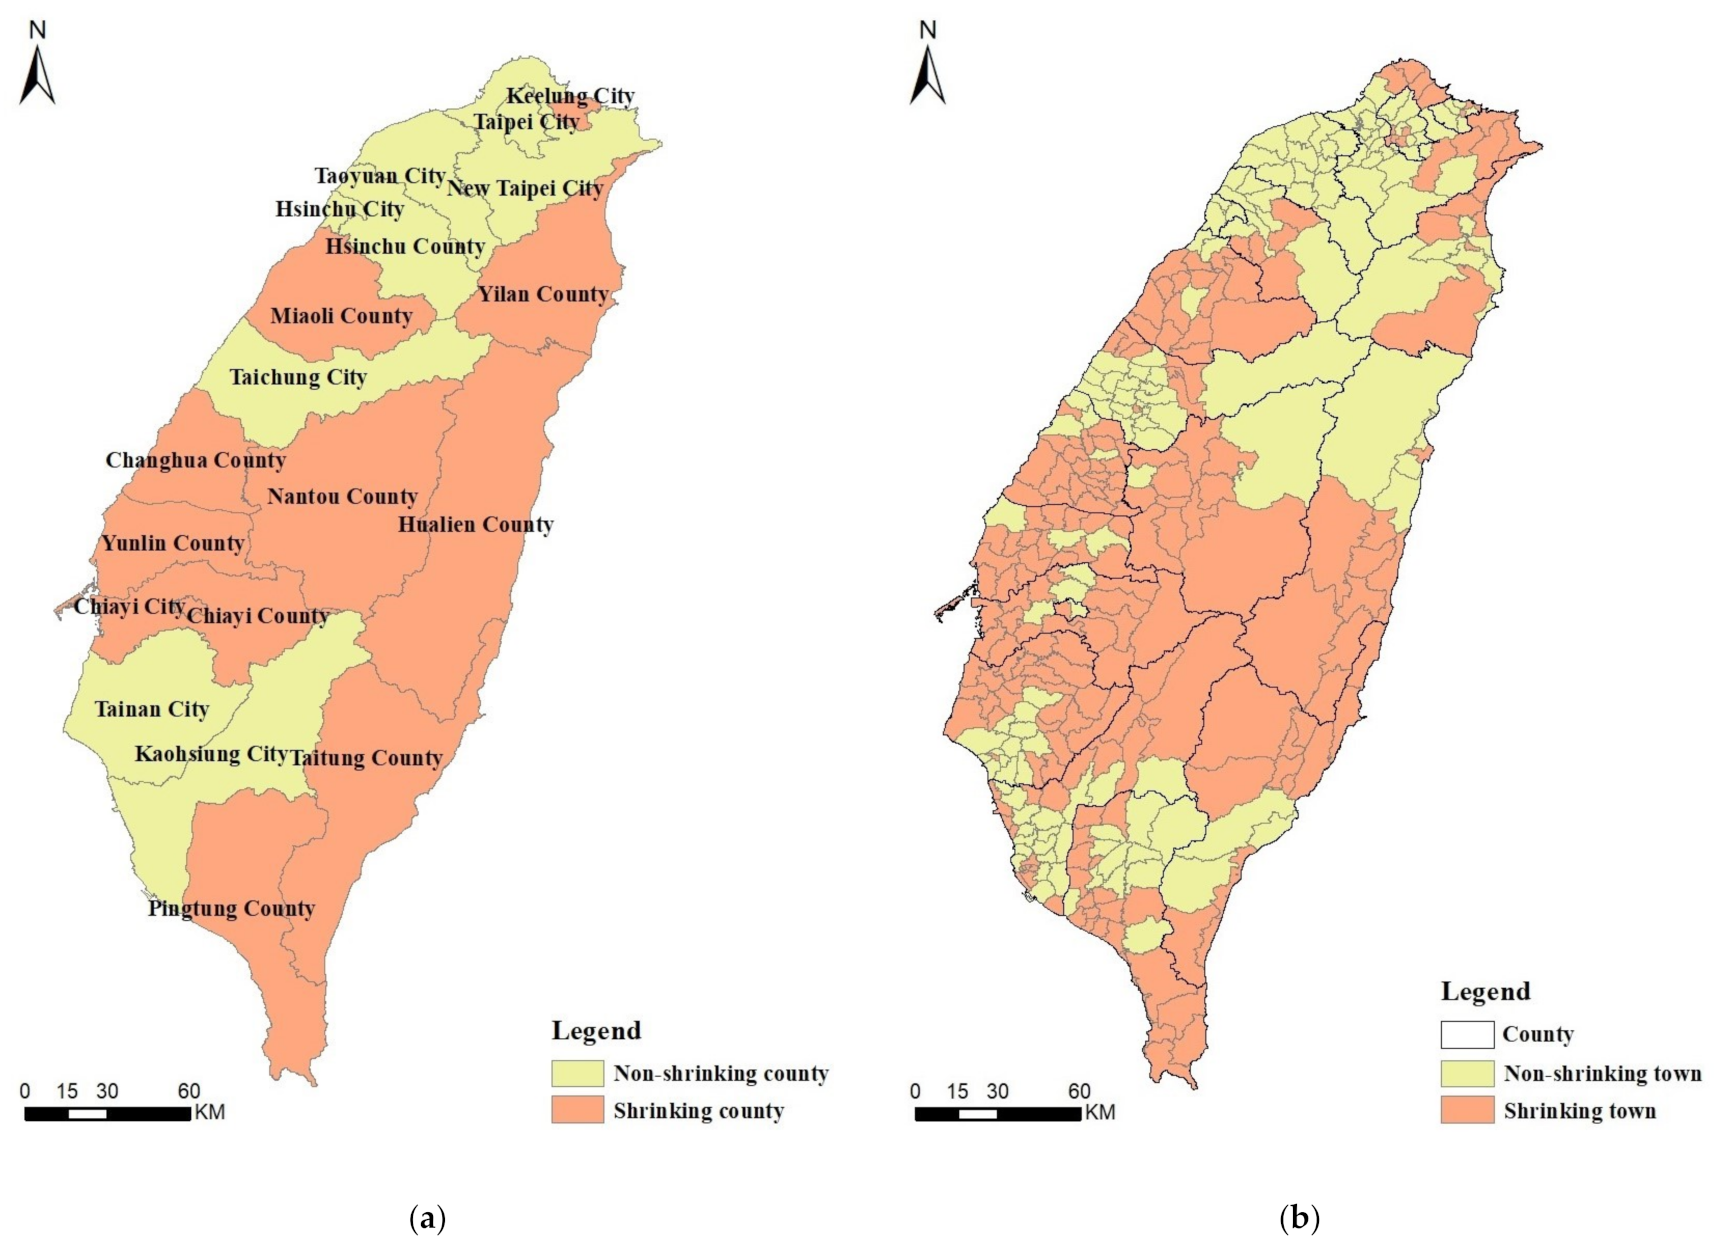
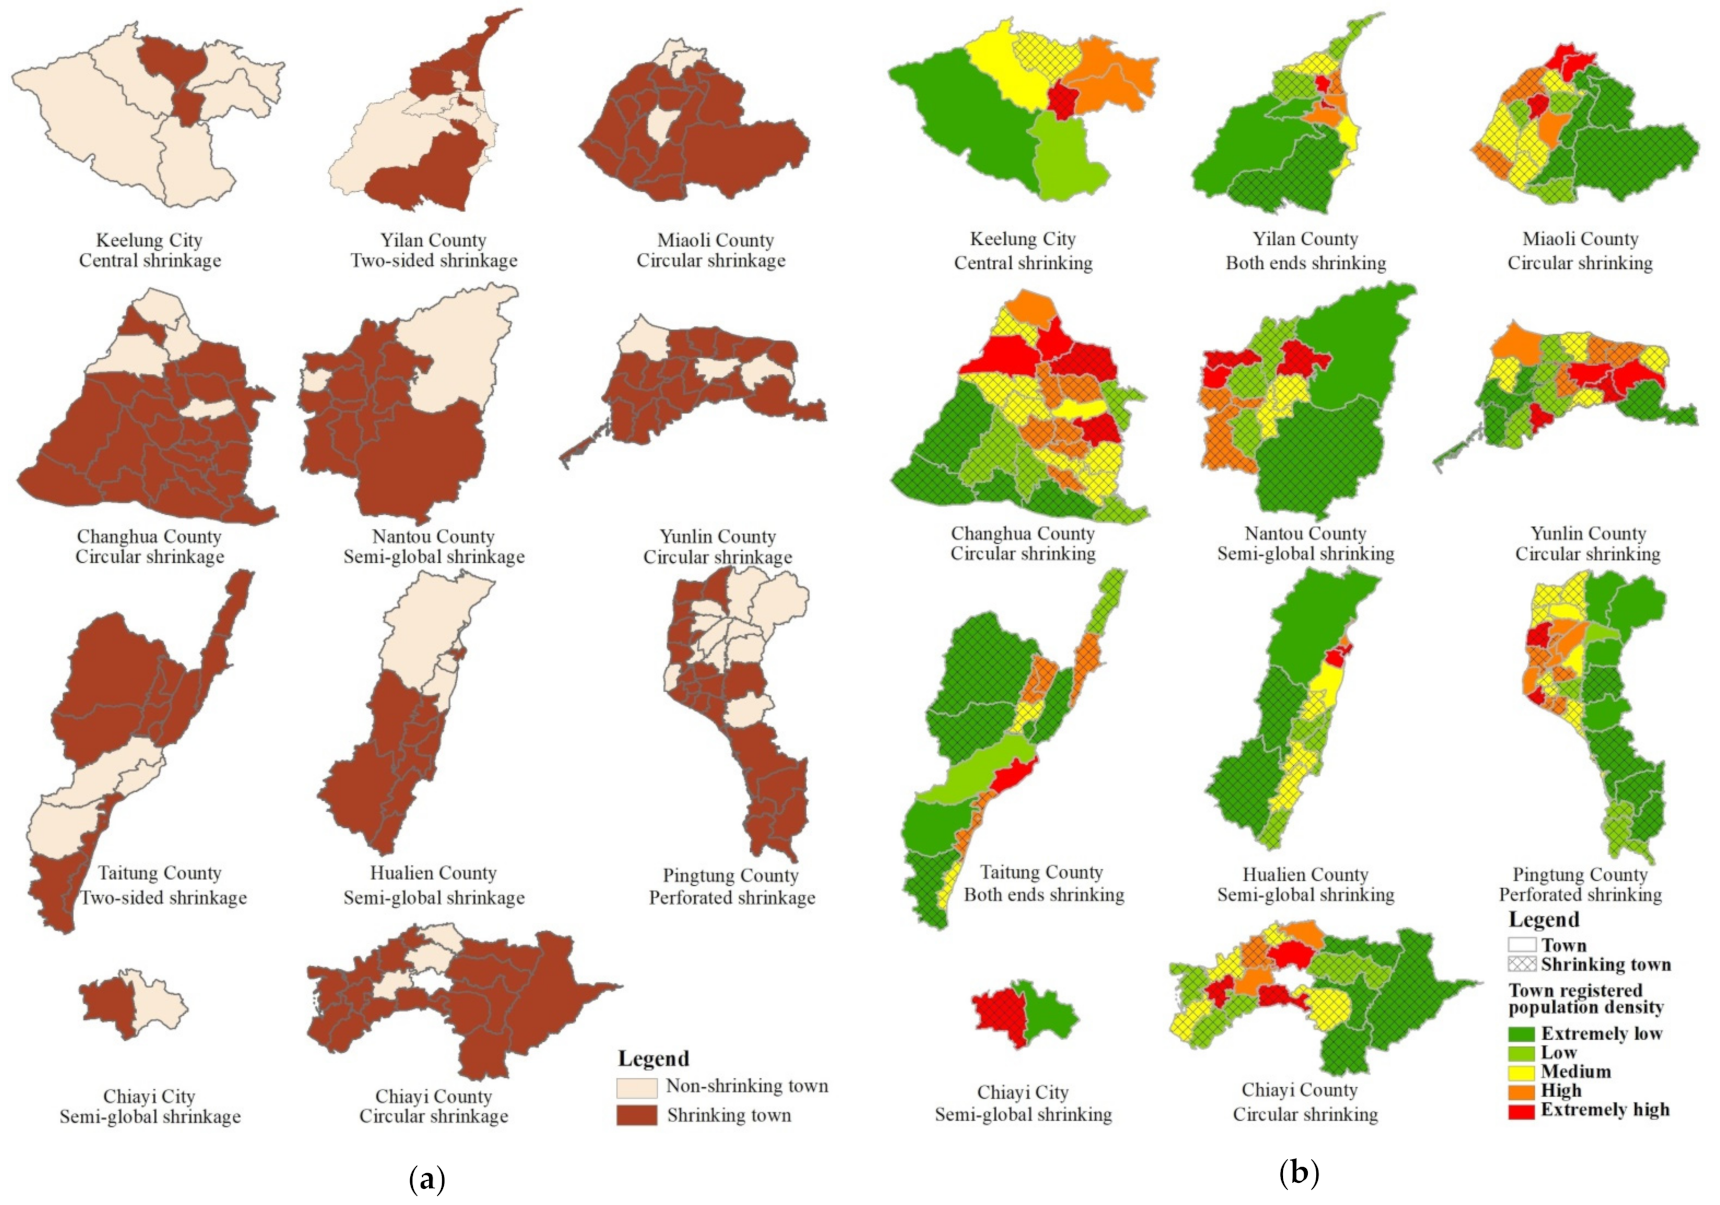
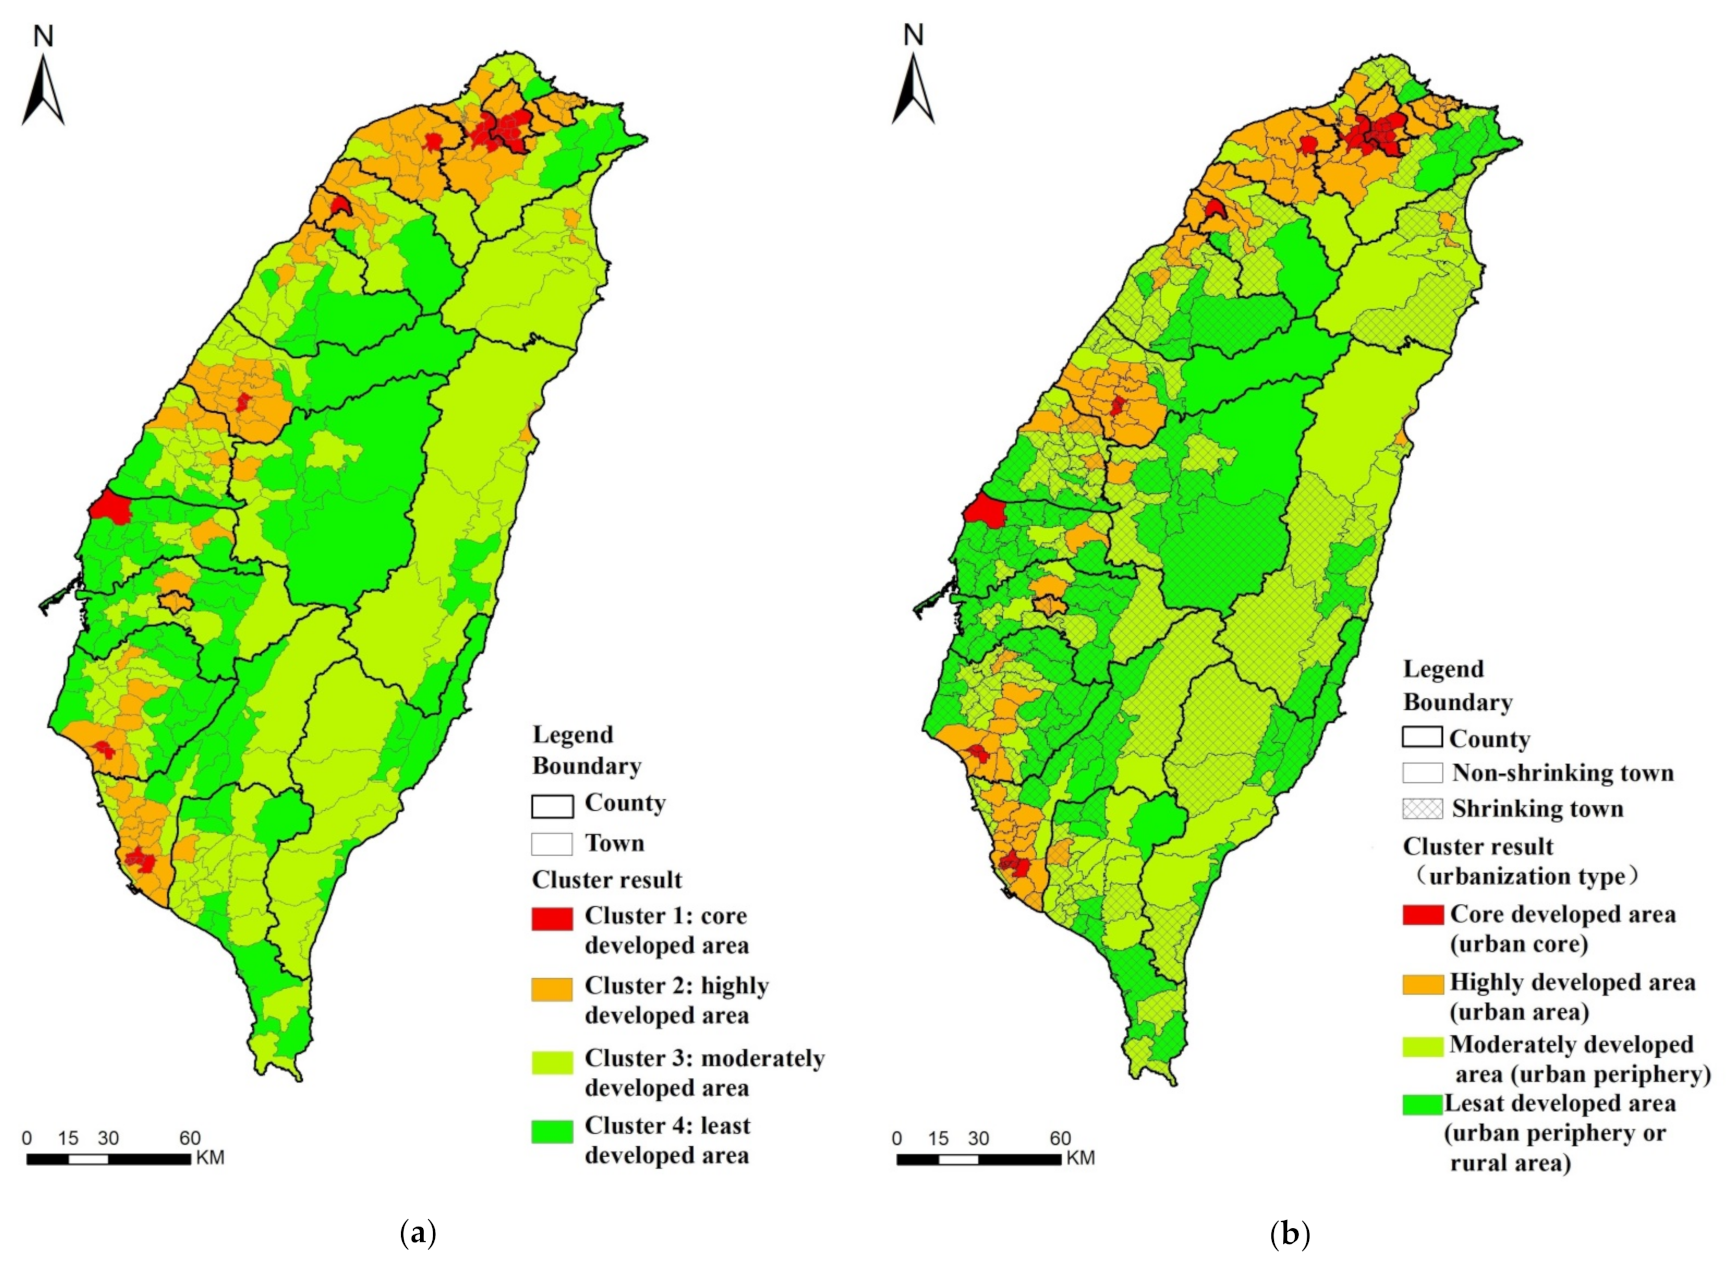
The cluster analysis results indicate that among the 11 shrinking counties, only towns in Yunlin County belong to the four categories; towns in Keelung City and Chiayi City belong to the highly developed area; towns in Taitung County belong to the moderately developed area or least developed area. In the other seven shrinking counties, towns in each shrinking county belong to the highly developed areas, moderately developed areas, or least developed areas (
Figure 10a).
Keelung City and Chiayi City have areas that belong to only one category; thus, the formation of shrinking spatial patterns is unrelated to urbanization. In the other nine shrinking counties, the urbanization of non-shrinking towns is considerably higher than that of shrinking towns. Therefore, the spatial pattern of these nine shrinking counties is related to overall urbanization. Overall, the spatial pattern of most shrinking counties is related to urbanization.
4.3. Shrinkage Characteristics and Governance
Among the 11 Shrinking counties, only the shrinkage spatial patterns in Keelung City and Chiayi City are not related to their urbanization types. The two shrinking counties have the most potential to reverse shrinkage because they break the relationship between the spatial pattern and shrinkage. Measured by the overall development of 349 towns on Taiwan’s main island, all towns in these two counties belong to highly developed areas (urban areas). Taiwan’s shrinking situation shows that the proportion of shrinking towns in highly developed regions (urban areas) is much lower than in other regions.
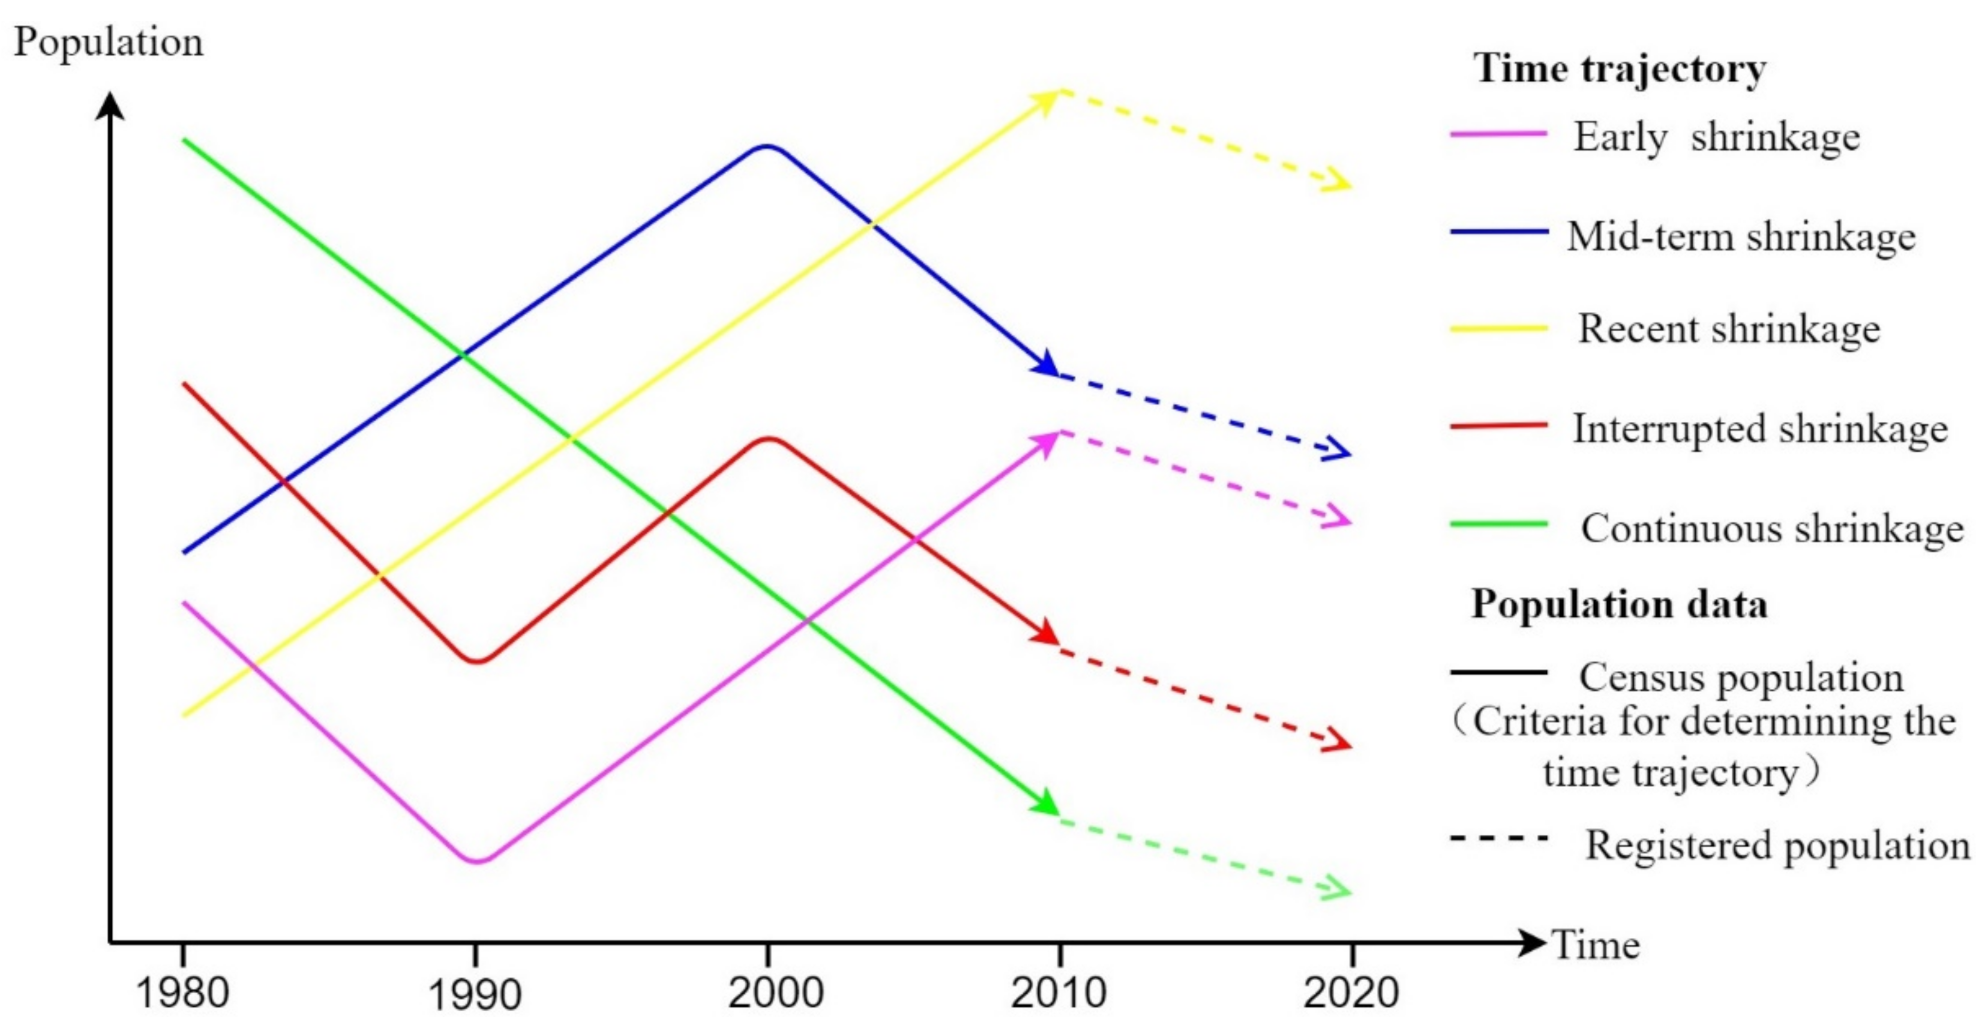
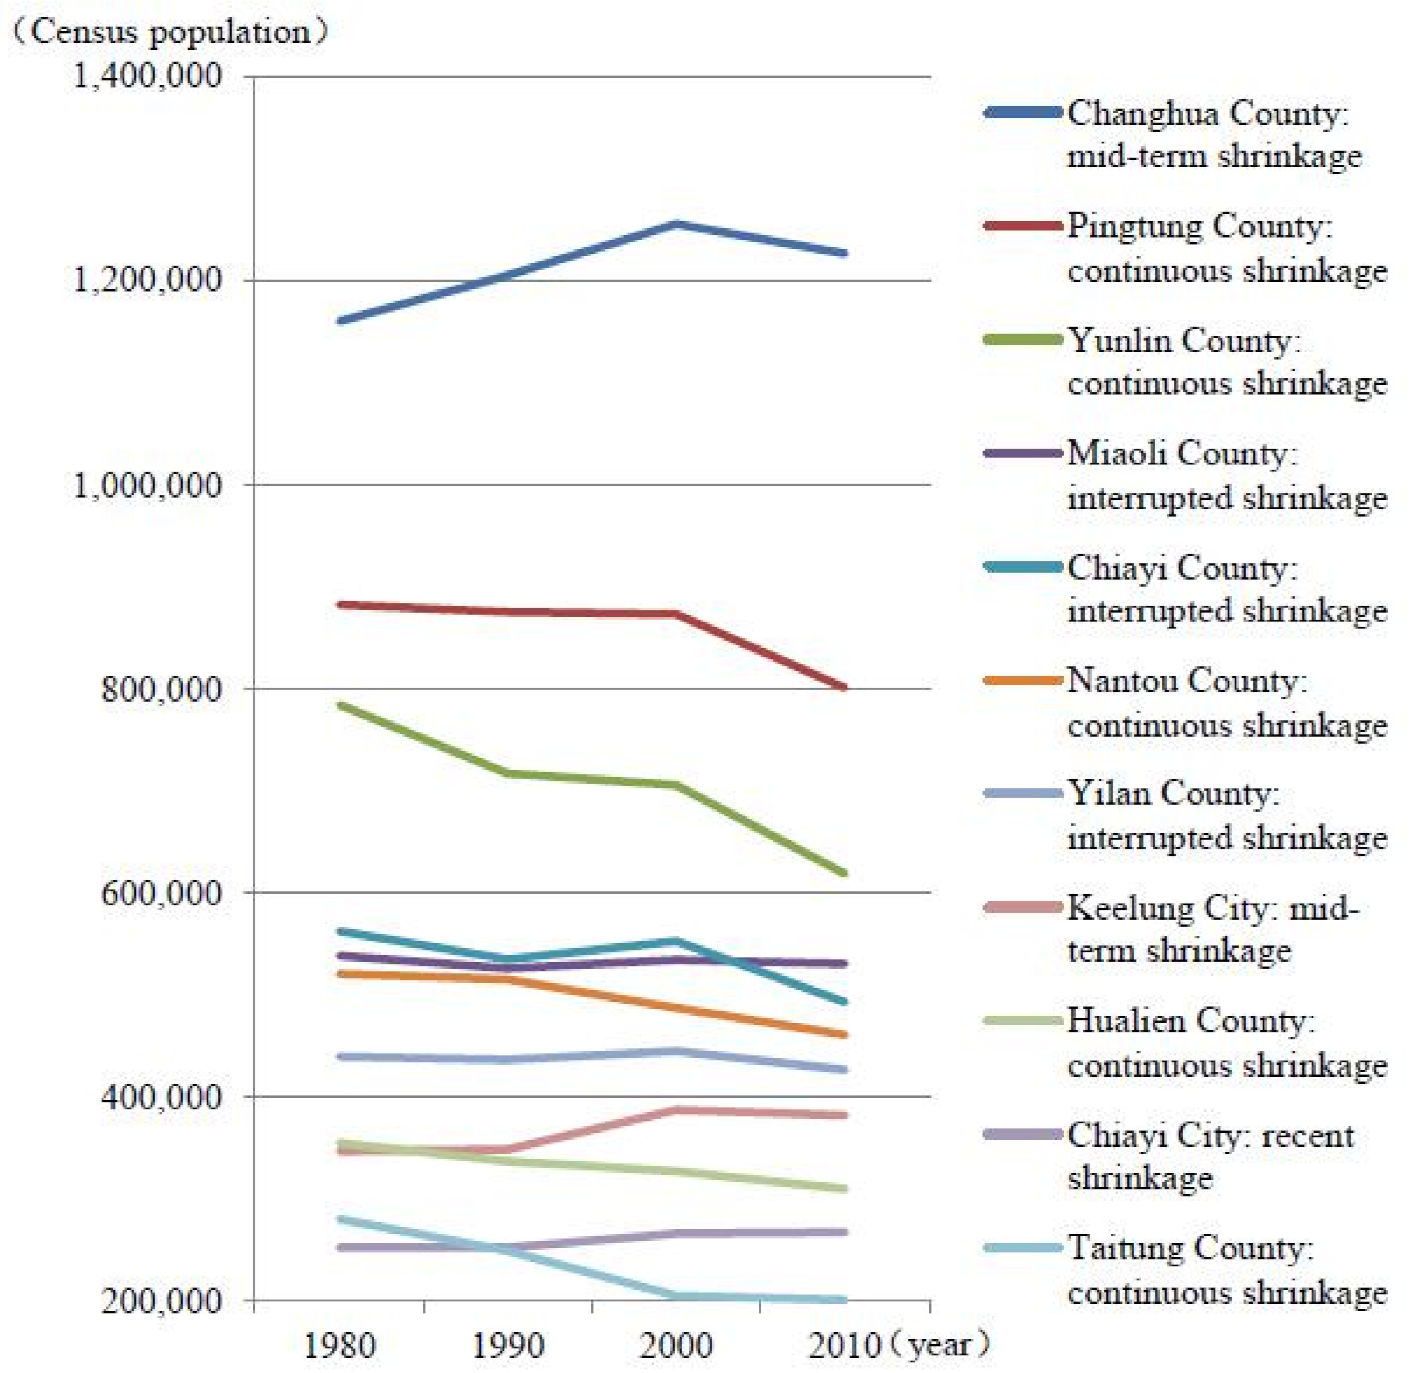
The two shrinking counties also have some characteristics that are conducive to shrinking governance. Regarding time characteristics (
Figure 5), Keelung City is a mid-term shrinkage county, and Chiayi City is a recent shrinkage county. Neither belongs to continuous shrinkage. The longer the shrinkage lasts, the harder it will be to reverse. In terms of spatial characteristics (
Figure 6a), Chiayi City is a semi-global shrinkage with one shrinking town and one non-shrinking town. Keelung City belongs to the central shrinkage, the two shrinking towns are adjacent, and the area composed of these two towns is directly adjacent to five non-shrinking towns. In addition, the shrinking towns in Keelung City and Chiayi City belong to the towns with the highest population density in the county (
Figure 6b). Generally, areas with high population density can attract more people. The LISA cluster map (
Figure 8) shows that the registered population of Keelung City and Chiayi City has not changed significantly after 2005. In summary, if appropriate resources are invested, Keelung City and Chiayi City may attract the population of other towns to reverse the contraction.
5. Conclusions
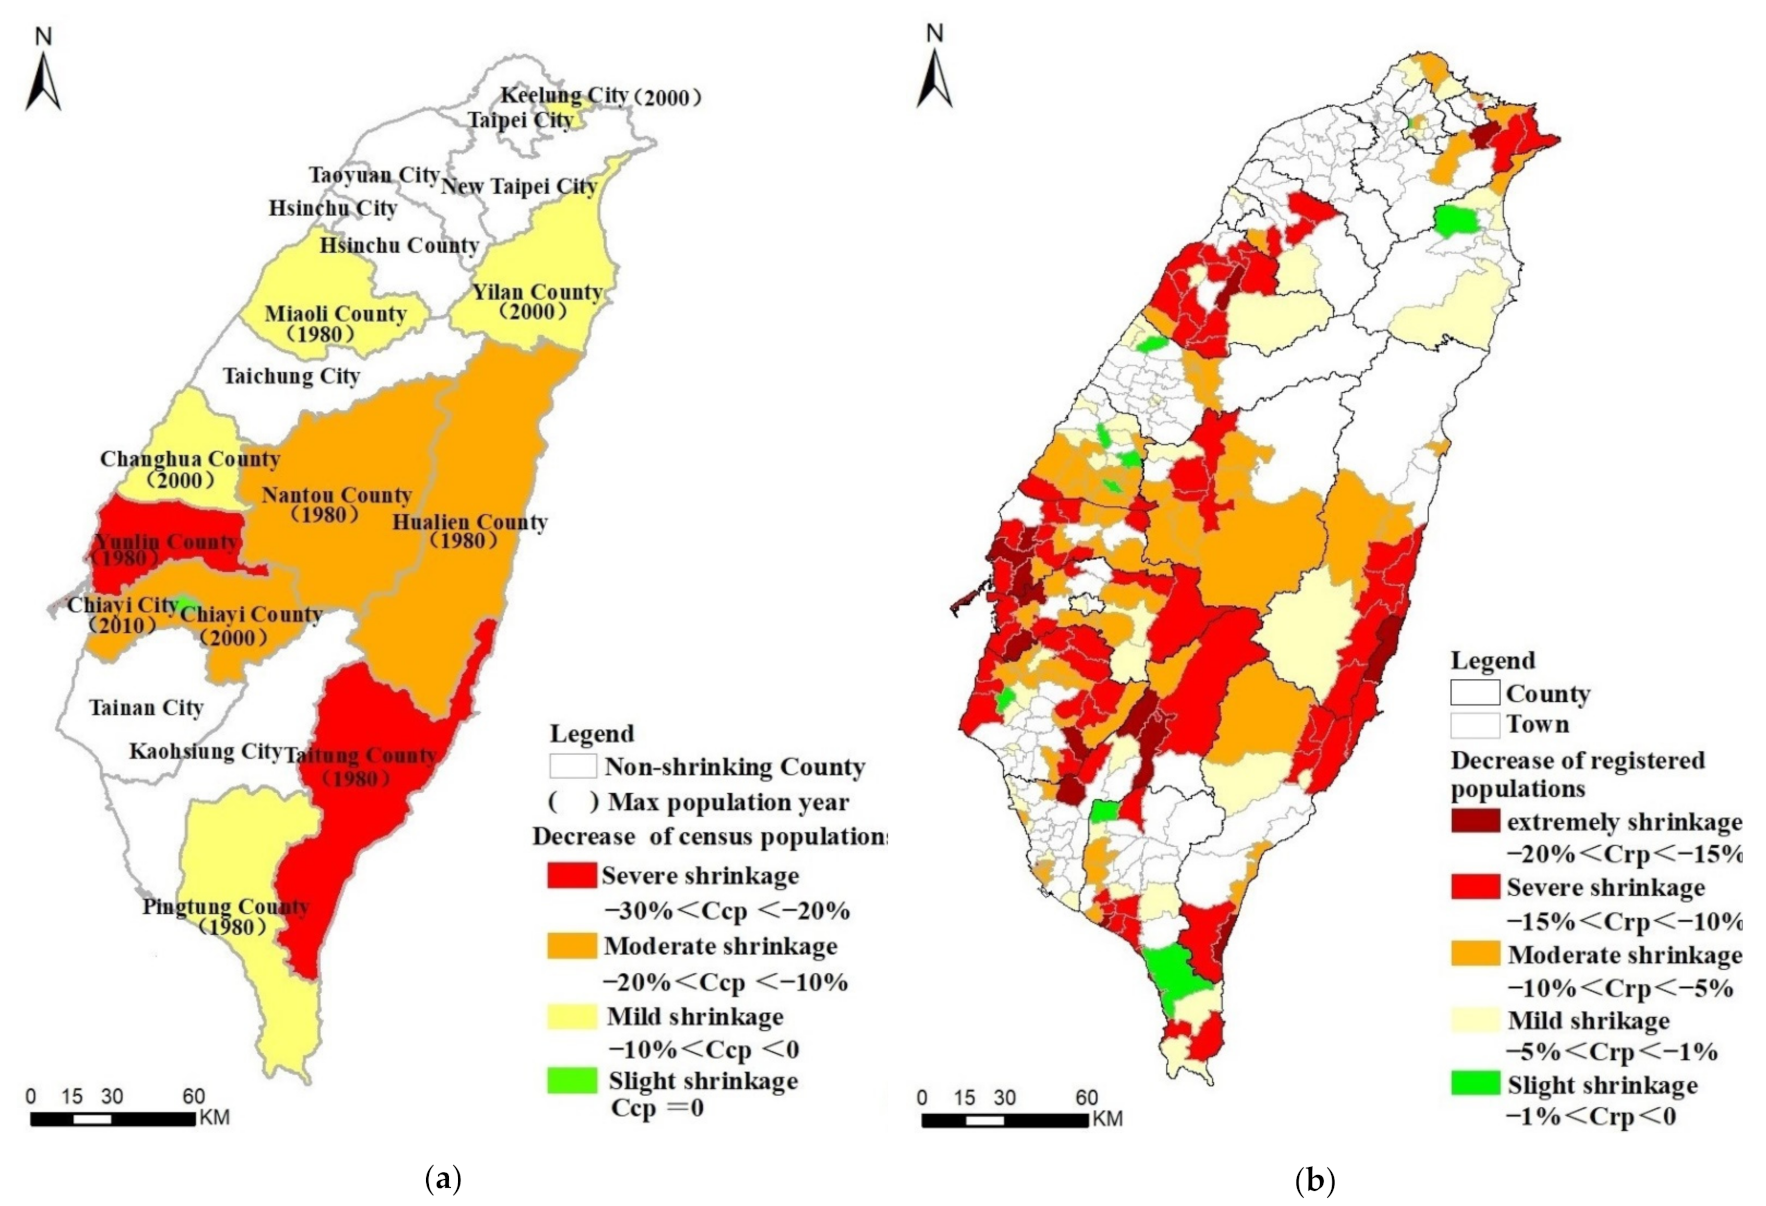
From 1980 to 2020, Taiwan’s total population increased from 17.97 million to 23.57 million, and the shrinkage of counties and towns was hidden by 40 years of population growth. Among Taiwan’s 19 counties and 349 towns, 11 counties and 202 towns were identified as shrinking in this study. The populations of the 11 shrinking counties exhibited various time trajectories and spatial patterns. Six counties had continuous shrinkage, with their census populations decreasing from 1980. An analysis of the spatial pattern of shrinkage revealed that towns with high population densities were unable to avoid shrinkage.
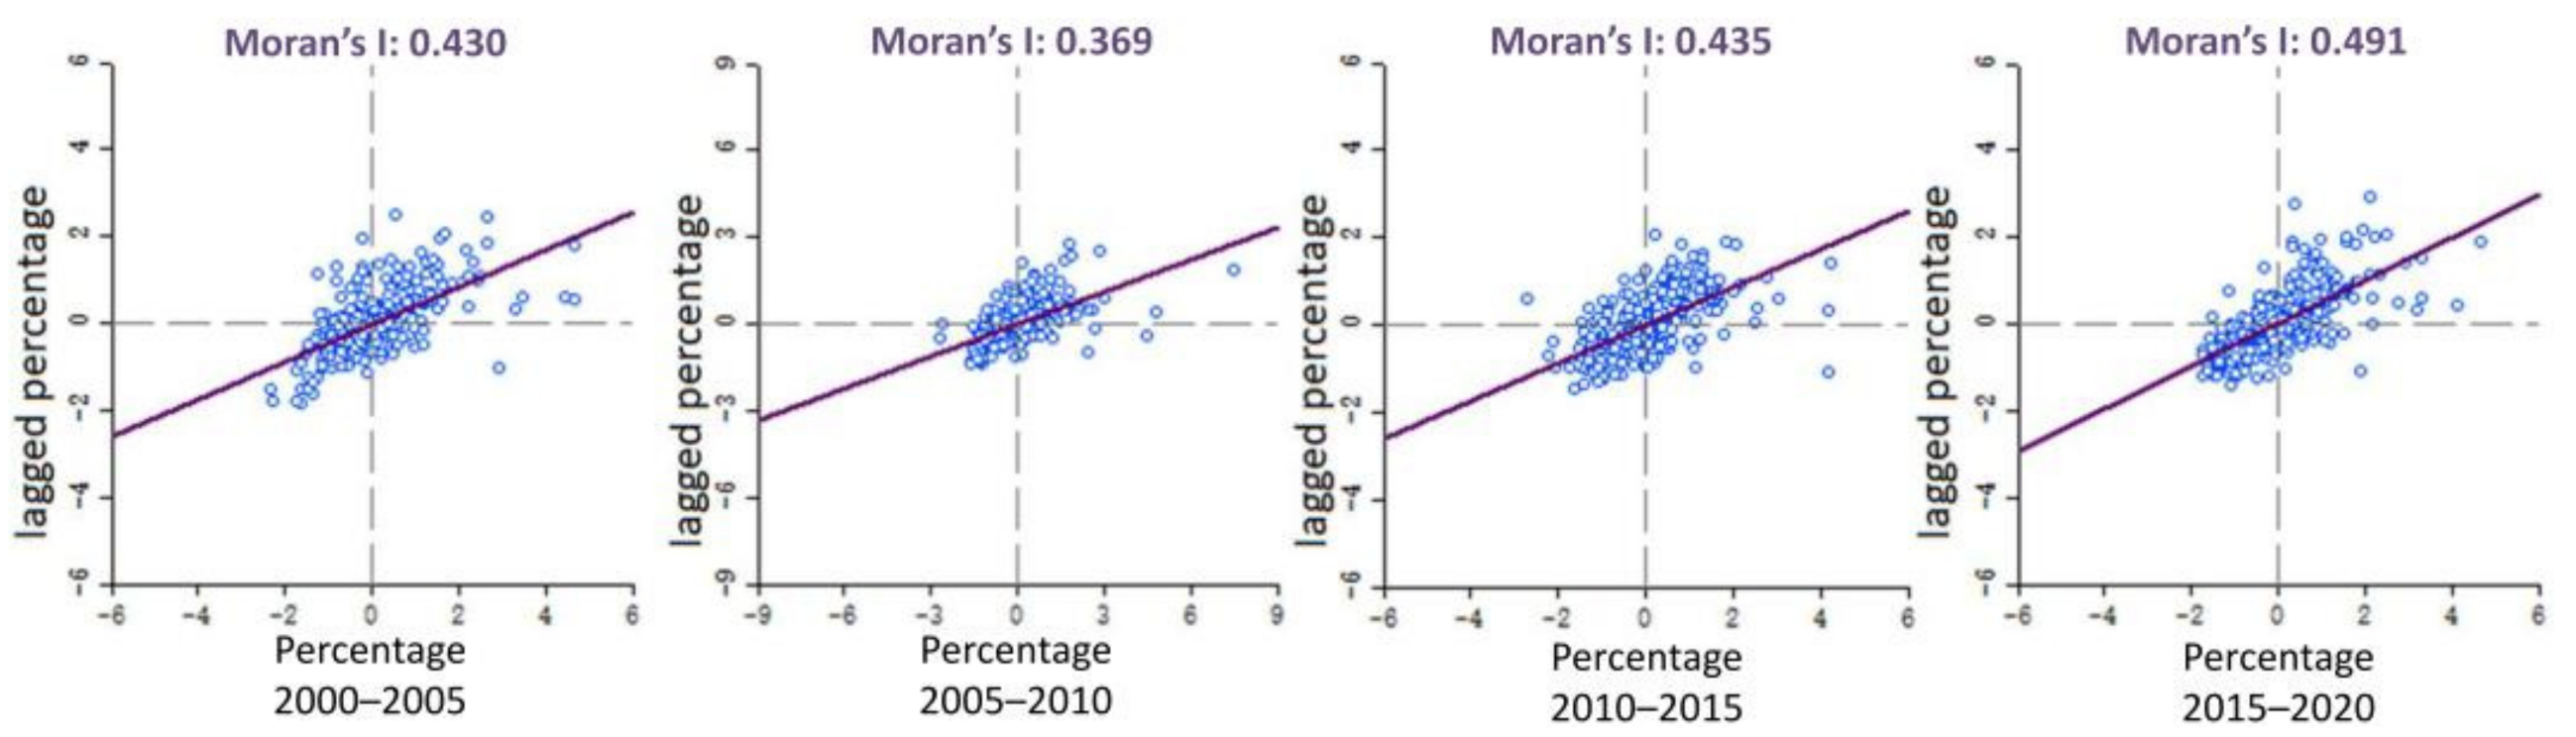
An ESDA revealed a positive spatial autocorrelation in the changes in a town’s registered population between 2000 and 2020. The Global Moran’s I increased after 2005; this increase indicates that shrinkage and non-shrinkage in towns has become more widespread after 2005. The LISA cluster map revealed that the six special municipalities, Hsinchu County, and Hsinchu City have continued to draw in residents. The areas of population decline were not limited to the southern and eastern regions of Taiwan; many areas in northern and central Taiwan exhibited population decline. In the cluster analysis, all towns were divided into four clusters. Shrinking towns exist in all area categories, but the proportions of each area substantially differ. Urbanization and suburbanization have led to the shrinking of Taiwan, but they play opposite roles in different areas. Suburbanization is the reason that the shrinkage of the core developed areas belongs to the urban core. Urbanization is the reason that the shrinkage of the moderately developed area belongs to the urban periphery. The highly developed area is geographically located between the urban core and the urban periphery, areas which have a much lower proportion of shrinking towns than other areas. The shrinking spatial pattern of most shrinking counties is related to urbanization.
In response to the decline of the Taiwanese population as a whole, the overconcentration of metropolitan populations, and the imbalance in urban–rural development, regional revitalization has become a prominent government policy. This policy was introduced in 2019. However, the annual investment in regional revitalization is only US
$470 million, and the effects of the regional revitalization policy still require assessment. Various systems and cultural backgrounds have shaped spatial planning systems with similar characteristics, and these systems have been adapted to specific cultures, norms, and spatial conditions [
30]. Therefore, urban shrinkage is difficult to reverse. However, this study found that among the 11 shrinking counties, Keelung City and Chiayi City have the most potential to reverse the shrinkage. The impact of urban shrinkage is omnidirectional, and the change in population is not the only criterion that can be used to identify shrinkage. Follow-up research should identify urban shrinkage in Taiwan from the perspective of vacant housing and land use. Shrinking counties have distinct spatial patterns of shrinkage, and future research must regard each shrinking county as its own case study to analyze the specific reasons for its shrinking spatial pattern. The effects of shrinking governance in the regional revitalization policy and the development of a strategy for shrinking governance in Taiwan also represent worthwhile directions for future research.


