- Article

Enhancing Alarm Localization in Multi-Window Map Interfaces with Spatialized Auditory Cues: An Eye-Tracking Study
- Jing Zhang,
- Xiaoyu Zhu and
- Jing Li
- + 3 authors
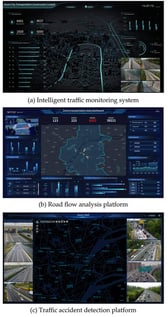
Modern geo-information platforms commonly adopt multi-window map interfaces that integrate heterogeneous data, such as dynamic maps and live camera feeds. These interfaces impose high cognitive load and slow spatial event detection. Operators must rapidly locate the source of visual alarms, a task often leading to delays under high visual workload. To address this challenge, this study investigated whether spatialized auditory cues can improve alarm localization in such complex monitoring interfaces. A controlled experiment with 24 participants used a within-subjects design to test factors of auditory spatial cueing (none, binaural, monaural), display dynamics (dynamic, static), and interface complexity (4, 8, 12 panes). Behavioral and eye-tracking data measured detection accuracy, efficiency, and gaze patterns. Results showed that dynamic displays and high interface complexity impaired performance, indicating increased cognitive load. In contrast, monaural lateralized auditory alarms substantially improved detection efficiency and mitigated visual overload. Interaction analyses revealed that binaural cues reduced the performance costs of dynamic displays, whereas monaural cues compensated for high-density layouts. These findings demonstrate that spatialized auditory alarms effectively support spatiotemporal situational awareness and improve operator performance in high-load geo-surveillance systems. The study offers empirical and practical implications for designing cognitively ergonomic, multimodal interfaces that move beyond purely visual alarm designs.
6 February 2026