According to the Polish legal regulations (The Act of the Polish Parliament of 15 January 2015 on the Protection of Animals Used for Scientific or Educational Purposes, Journal of Laws 2015, item 266), the consent of the ethics committee is not required for this type of research and no consent from the ethical committee is required for postmortem tissue use. All owners were informed about specific purpose of the study and the standard veterinary practice to examine patients using 2–3 types of ultrasound probes to obtain the best quality image or more details not visible with a single probe. All owners provided consent for the inclusion of their animals in the study. No animal was euthanized for the purpose of the above study. Animals that were euthanized at the request of the owners in order to withdraw from persistent therapy since they were diagnosed with malignant neoplasm, in a severe clinical condition, and did not respond to the treatment.
2.2. Ultrasound Examination and Classification of Patients
Two ultrasound devices were used: Mindray M7 with 4–2 s MHz phased array transducer and a L14-6ns MHz linear transducer, and GE Healthcare Logiq F6 with L6-12-RS MHz linear transducer and a 8C-RS MHz microconvex transducer. The imaging depth was set at 3–6 cm depending on the size of the animal and the focus position was set as close to the pleural line as possible. All examinations were performed in standing or sternal positions without clipping (hair was parted), after application of an appropriate amount of alcohol and coupling gel with the transducer placed directly on the chest. All transducers were positioned transverse to the ribs in order to visualize the “gator sign” (the pleural line and two ribs). Four regions were examined on each thoracic side (caudodorsal, perihilar, middle, and cranial) with one scan for each region, according to the Vet BLUE protocol [
6,
13]. The presence of A-lines with a lung sliding was considered to signify a physiological aerated lung. The interstitial-alveolar edema was recognized by the presence of B-lines. Additional ultrasound abnormalities were described according to Ward et al. [
2] following the descriptions used in human medicine as the shred sign, tissue-like sign or nodule sign [
1]. The shred sign is a manifestation of partial lung consolidation. The deeper border of the consolidated lung tissue connected with the aerated lung is shredded and irregular. The tissue-like sign is when the lung resembles the liver tissue and it results from translobar consolidation. The nodule sign is circumscribed, completely surrounded by the aerated lung. B-lines extend from the distal border of each type of consolidation downwards the screen [
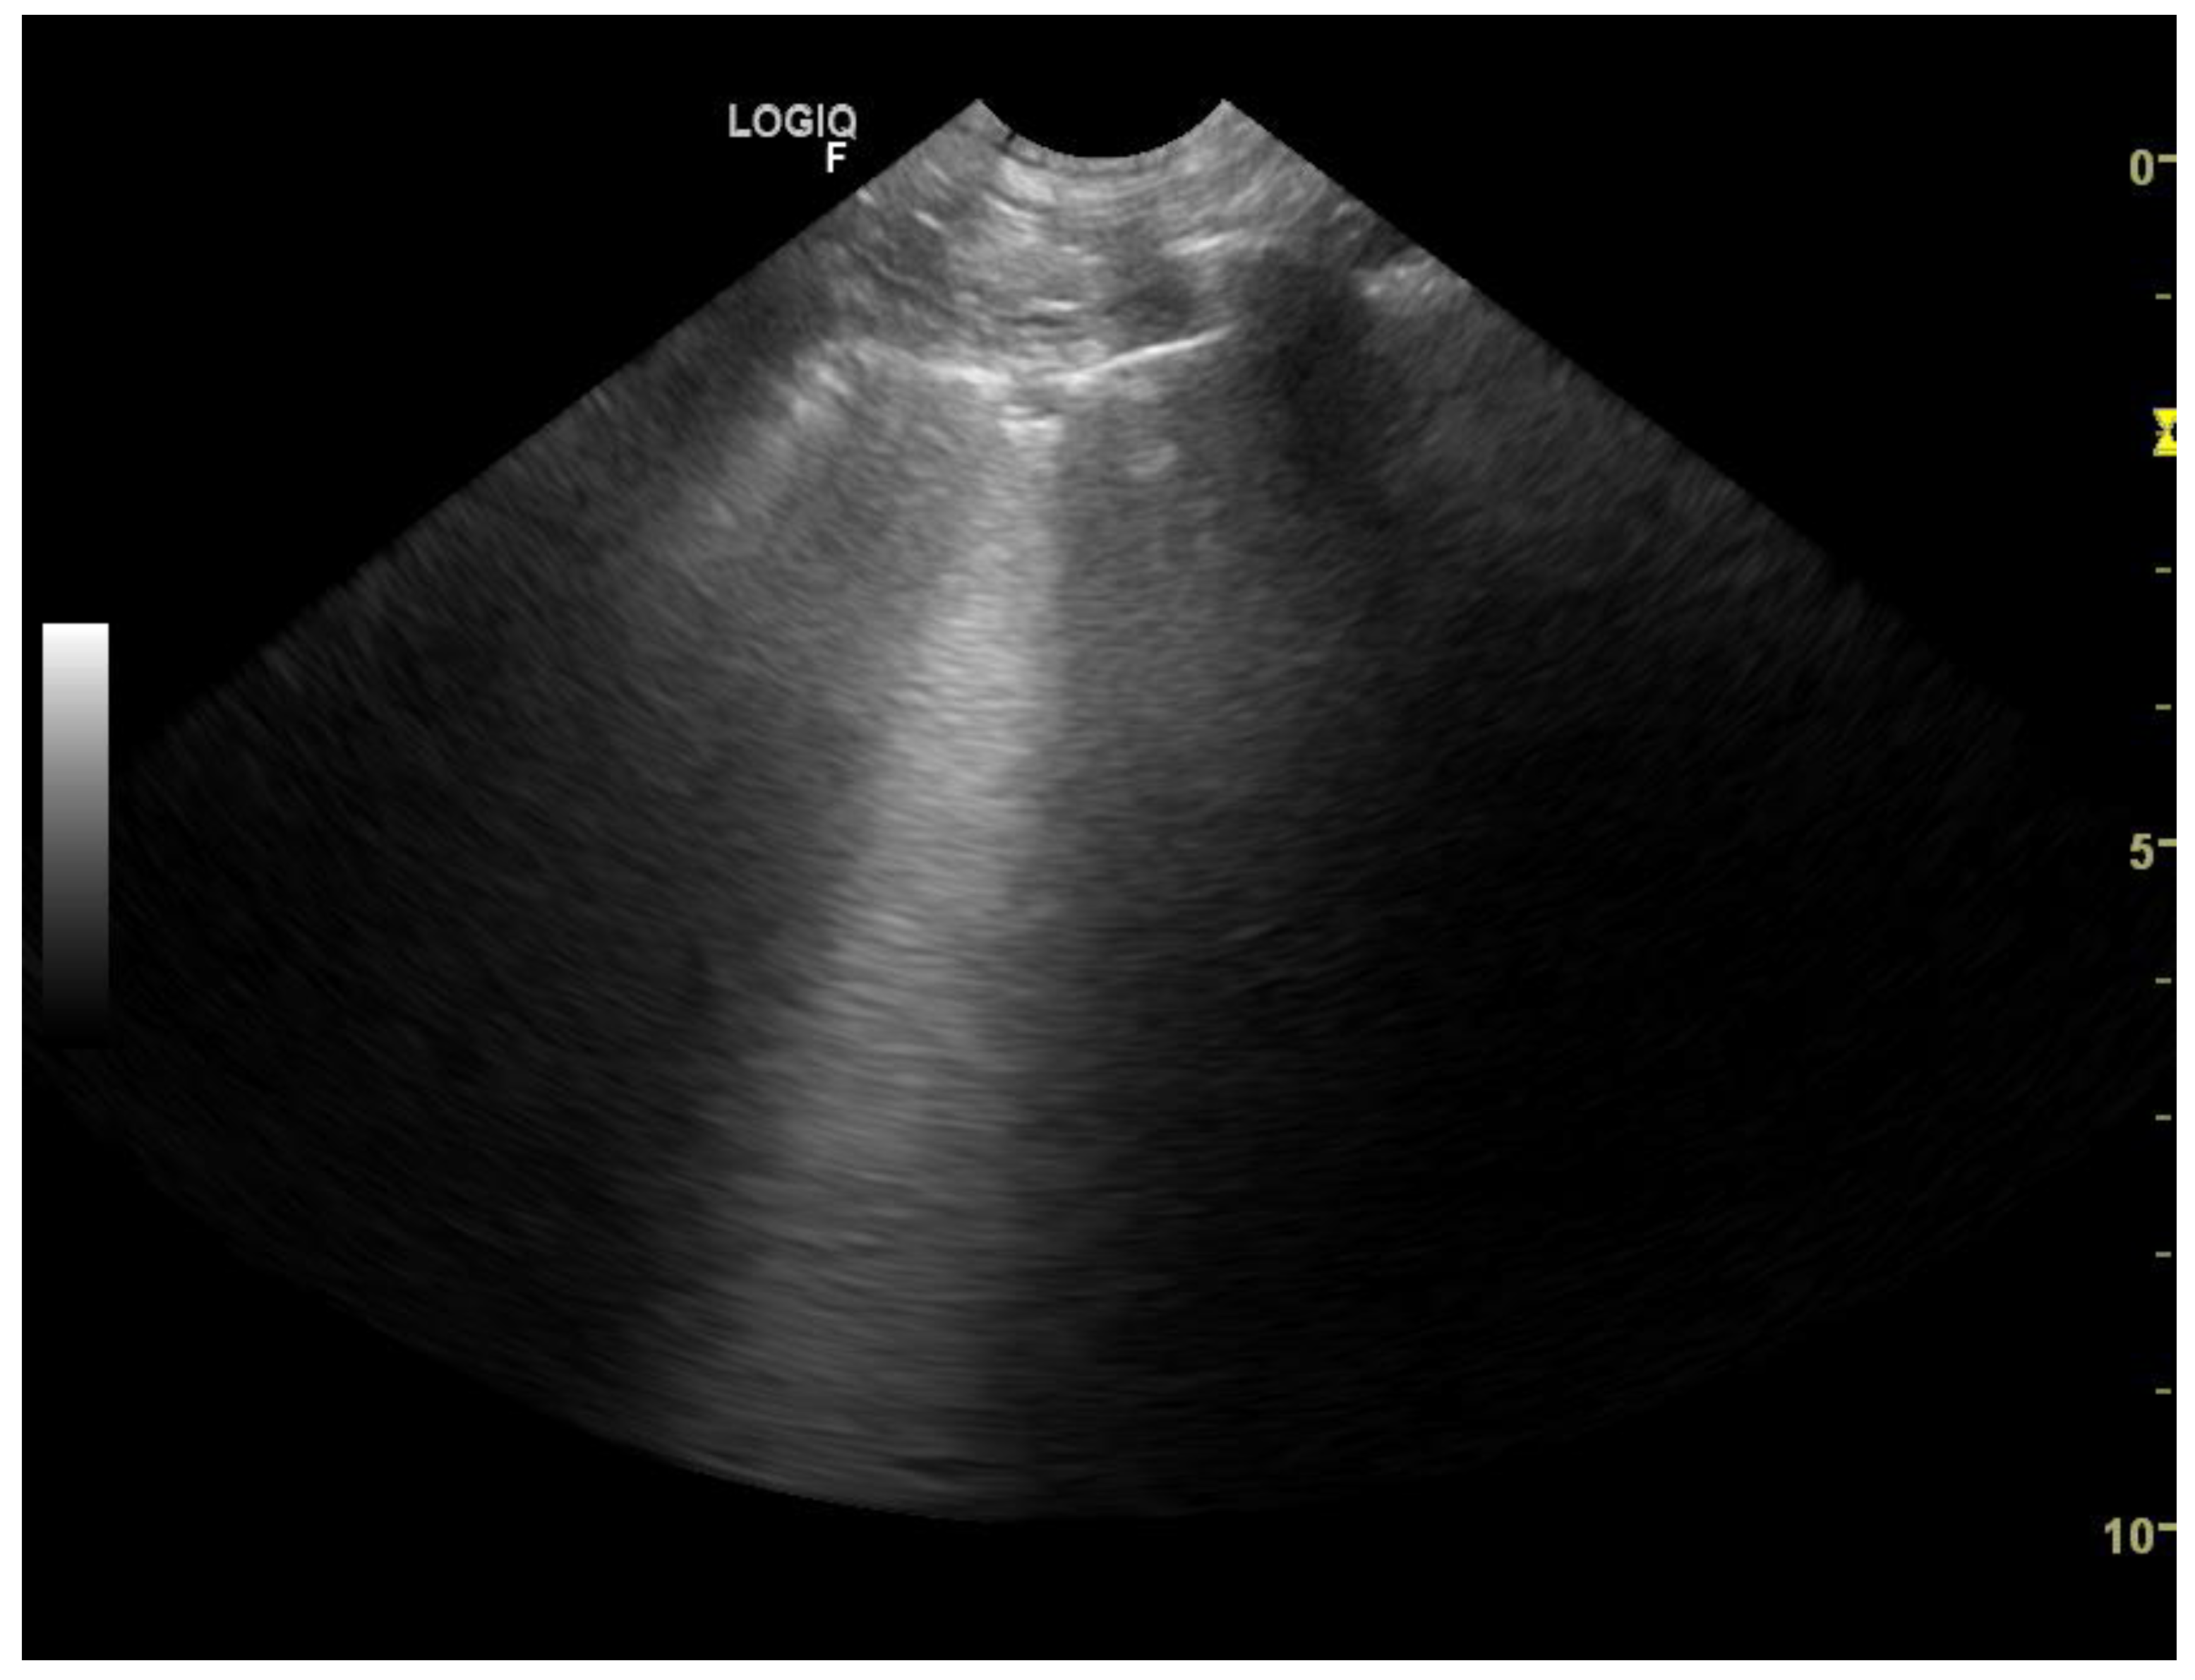
2]. The occurrence of B-lines was described according to the 5-point scale: no B lines—0 points (
Figure 1), a single B-line—1 point (
Figure 2), double B-line—2 points (
Figure 3), numerous discernible B-lines—3 points (
Figure 4), and numerous indiscernible B-lines—4 points (
Figure 5).
Ultrasonographic examinations were performed by two board-certified specialists in thoracic ultrasound (O.S.-J. and A.Ł.), each with 10-year experience in this field. A.Ł. used a GE Healthcare Logiq F6, and O.S.-J. a Mindray M7 device. Examinations with different transducers were performed immediately one after another at intervals shorter than 5 min. In order to place subsequent transducers to the same thoracic regions, they were applied to 8 places previously covered with gel. The B-lines were counted over a single intercostal space according to Lisciandro [
14]. In all patients, echocardiographic examination was also performed to rule out congenital or acquired heart defects, heart tumors, pericardial effusion and other cardiac diseases. It included right parasternal long and short axis view and left parasternal views with apical four-chamber and five-chamber views. The views were mainly aimed at obtaining measurements of the left atrium (LA), aorta (Ao), left and right ventricles, the left ventricular wall thickness (LVWT) as well as left and right ventricular outflow tract velocities.
The advanced myxomatous valvular degeneration (MVD) was considered highly probable when the left ventricular internal dimension in diastole (LVIDd) to Ao ratio (LVIDd/Ao) was >3 and LA/Ao was >2.4 [
15,
16].
Dilated cardiomyopathy (DCM) in dogs was diagnosed if the following abnormalities were found [
14,
16,
17]:
- -
left ventricular M-mode systolic or diastolic dimensions exceeding reference values for the given body weight,
- -
LA/Ao > 2.1,
- -
fractional shortening (FS) < 20%,
- -
left ventricular ejection fraction (LVEF) < 40
Myocarditis was confirmed by histopathological and microbiological examination [
18].
Hypertrophic cardiomyopathy (HCM) in cats was diagnosed if: LVWT was >10 mm in diastole and La/Ao was >2.0 [
14,
16,
17].
Restrictive cardiomyopathy (RCM) was diagnosed in cats if the dimensions of the LV walls and of the left chamber were in reference range and marked dilatation of the atria was detected.
DCM was diagnosed in cats when dilatation of the four cardiac cavities was visualized [
16,
17].
A preliminary diagnosis was made immediately after thoracic radiography and ultrasonographic examination. All lung scans and cine clips were saved and anonymized for further analysis to avoid the confounding effect resulting from the use of different transducers. Detailed analysis of all cine clips was performed after the examination had been completed by both examiners.
The clinical condition of each animal was monitored until its condition considerably improved or the animal died, and the sonographic diagnosis was confronted with the response to the treatment or autopsy findings, respectively. On this basis the patient was assigned to one of four diagnostic groups: cardiogenic pulmonary edema (CPE), pneumonia, lung neoplasm, or others. CPE was diagnosed based on chest radiography and the presence of B-lines combined with correct, smooth image of the pleural line in patients with advanced heart disease found in the echocardiographic examination. Good response to diuretic and oxygen therapy (disappearance of B-lines within 24 h and decrease of respiratory rate to <30 per minute) was considered to confirm the diagnosis of CPE.
In all patients with suspected pneumonia clinical examination, blood test, LUS and chest radiography were performed. In all animals dyspnea was observed. B-lines accompanied by subpleural consolidations or irregularly thickened, blurred pleural in ultrasound examination suggested pneumonia (
Figure 6). Broad spectrum antibiotics were administered for at least 2 weeks. After 2 weeks, a follow-up LUS was performed and if lung sliding and A-lines (normal filled with air lung image) were visualized and patient’s condition reverted to normal the patient was diagnosed with pneumonia. According to Hew (2016), clinical improvement after treatment confirmed the diagnosis [
19]. It is because patient-reported outcome is one of the main indicators of the treatment efficacy, since the main objective of medical care is to increase patient well-being.
Patients suspected of having neoplastic lesions underwent chest radiography (48 patients) or chest CT-scan (5 patients) together with LUS. To confirm the neoplastic disease, the patients underwent ultrasound-guided transthoracic fine needle aspiration lung biopsy (25 patient) or, if euthanized, anatomopathological and histopathological examination of the lung (10 patients). The remaining 18 patients had been diagnosed with primary malignant neoplasm, confirmed by histopathological examination within preceding 12 months. During the visit with dyspnea chest radiographs showed uniform in density, with smooth, well-margined borders round nodules. LUS showed subpleural nodulus (
Figure 7,
Figure 8 and
Figure 9). Treatment with broad-spectrum antibiotics and steroids was ineffective.
2.3. Statistical Analysis
The agreement beyond chance between three types of ultrasound transducers (microconvex, linear [two linear probes were treated as one type], and phased array) at 8 standardized locations (caudodorsal, perihilar, middle, and cranial lung lobe on each side) was assessed using the weighted Cohen’s kappa (κ
w), with 95% confidence interval (CI 95%) calculated according to the formula of Fleiss [
20]. Weights were set as numbers between 1 and 0 so that distances between categories reflected the importance of the difference between results, with the weight of 1 for fully consistent results and 0 for the most distant results (
Table 1). Values of κ
w of ≤0.40 indicated low, 0.41–0.60—moderate, 0.61–0.80—high, 0.81–0.90—very high, and >0.90—almost perfect agreement. Agreement beyond chance was determined for the entire study population as well as separately for dogs and cats.
Then, the 5-point classification of the occurrence of B-lines was used for developing the numerical score (lung ultrasound score, LUSscore) combining the number of B lines with the locations in which they were observed. LUSscore was calculated as the sum of points (n) at each of 8 standardized location (i), on the basis of the following equation: . Given that n = {0,1,2,3,4}, and i = {1,2,3,4,5,6,7,8}, LUSscore could take integer values from 0 to 32 points.
In the agreement analysis the LUSscore was presented as the arithmetic mean and standard deviation (±SD), and compared between the three transducers using the paired-sample Student’s t-test and the line of equality plot. The magnitude of differences between the LUSscore measurements expected in 95% of examinations was demonstrated for the three pairs of ultrasound transducers using the Bland-Altman limits of agreement (LoAs), for the entire study population as well as separately for patients with three main pathological conditions: CPE, pneumonia, and lung neoplasm.
In the accuracy analysis the LUS
score was presented as the median, interquartile range (IQR), and range, and compared between animal species and three main pathological conditions using the Mann-Whitney U test and the Kruskal-Wallis H test, respectively. Accuracy was presented as the area under receiver operating characteristic (ROC) curve (AUROC) and assessed as follows: >90%—a highly accurate test, >80% to 90%—a moderately accurate test, >70% to 80%—a fairly accurate test, ≤70%—a poorly accurate test [
21,
22]. Then, the optimal cut-off value was determined using the maximum Youden’s index (J) criterion. and diagnostic sensitivity (Se), specificity (Sp) and positive/negative likelihood ratio (LR+/−) were computed at the optimal cut-off value. Proportions were compared between groups using the Pearson’s χ
2 test and CI 95% for proportions were calculated using the Wilson score method. A significance level (α) was set at 0.05. Statistical analysis was performed in TIBCO Statistica 13.3 (TIBCO Software Inc., Palo Alto, CA, USA).


 ,
, 


