
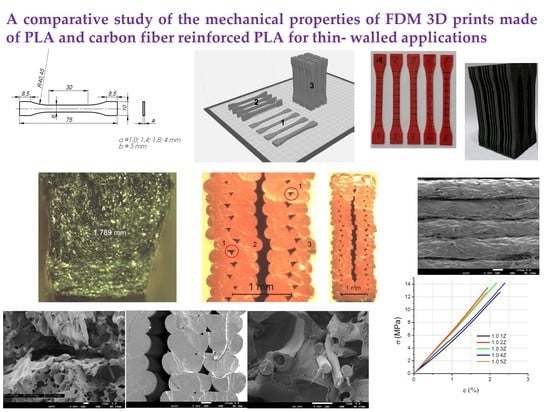
A Comparative Study of the Mechanical Properties of FDM 3D Prints Made of PLA and Carbon Fiber-Reinforced PLA for Thin-Walled Applications


Abstract
:
1. Introduction
2. Materials and Methods
2.1. Materials
2.2. Methods
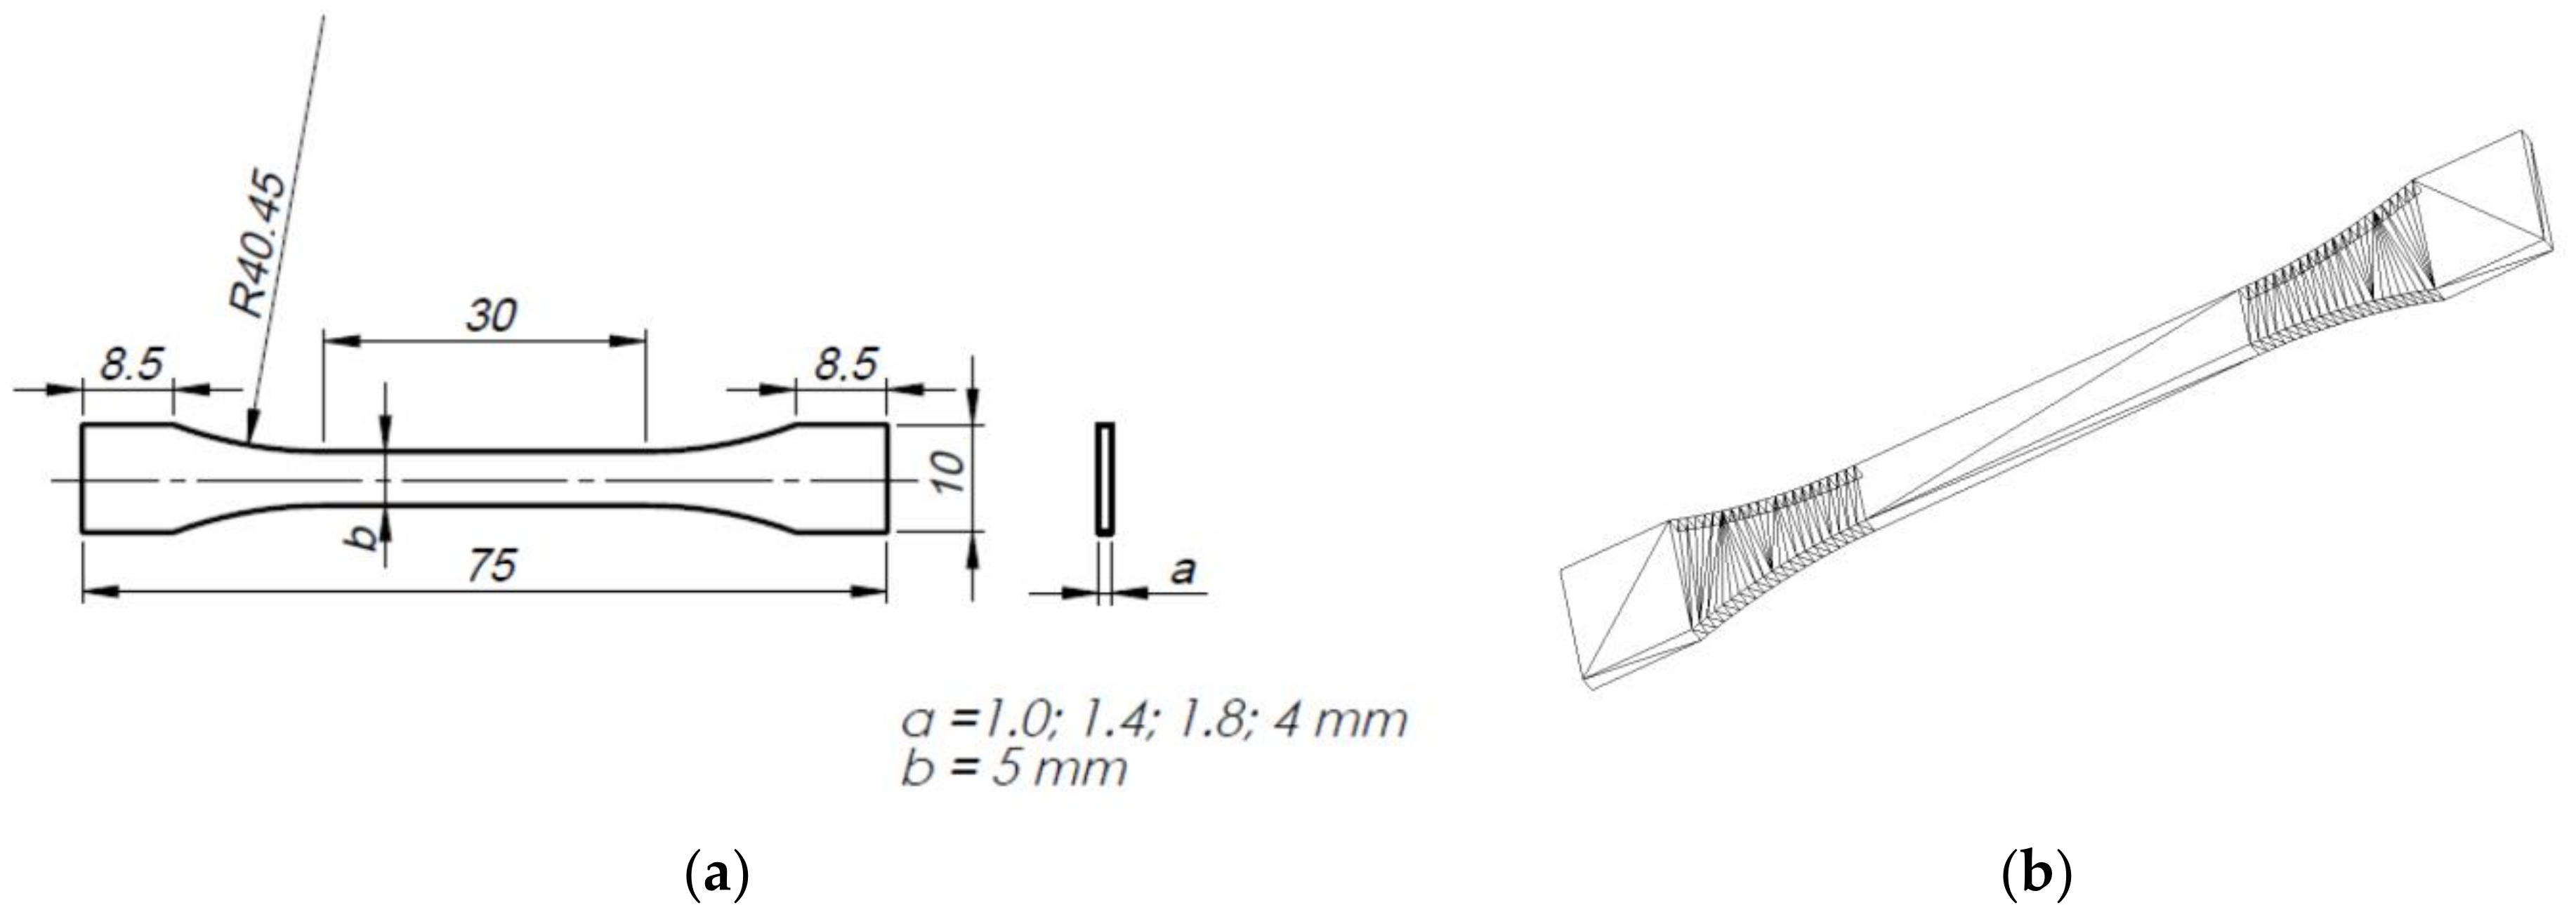
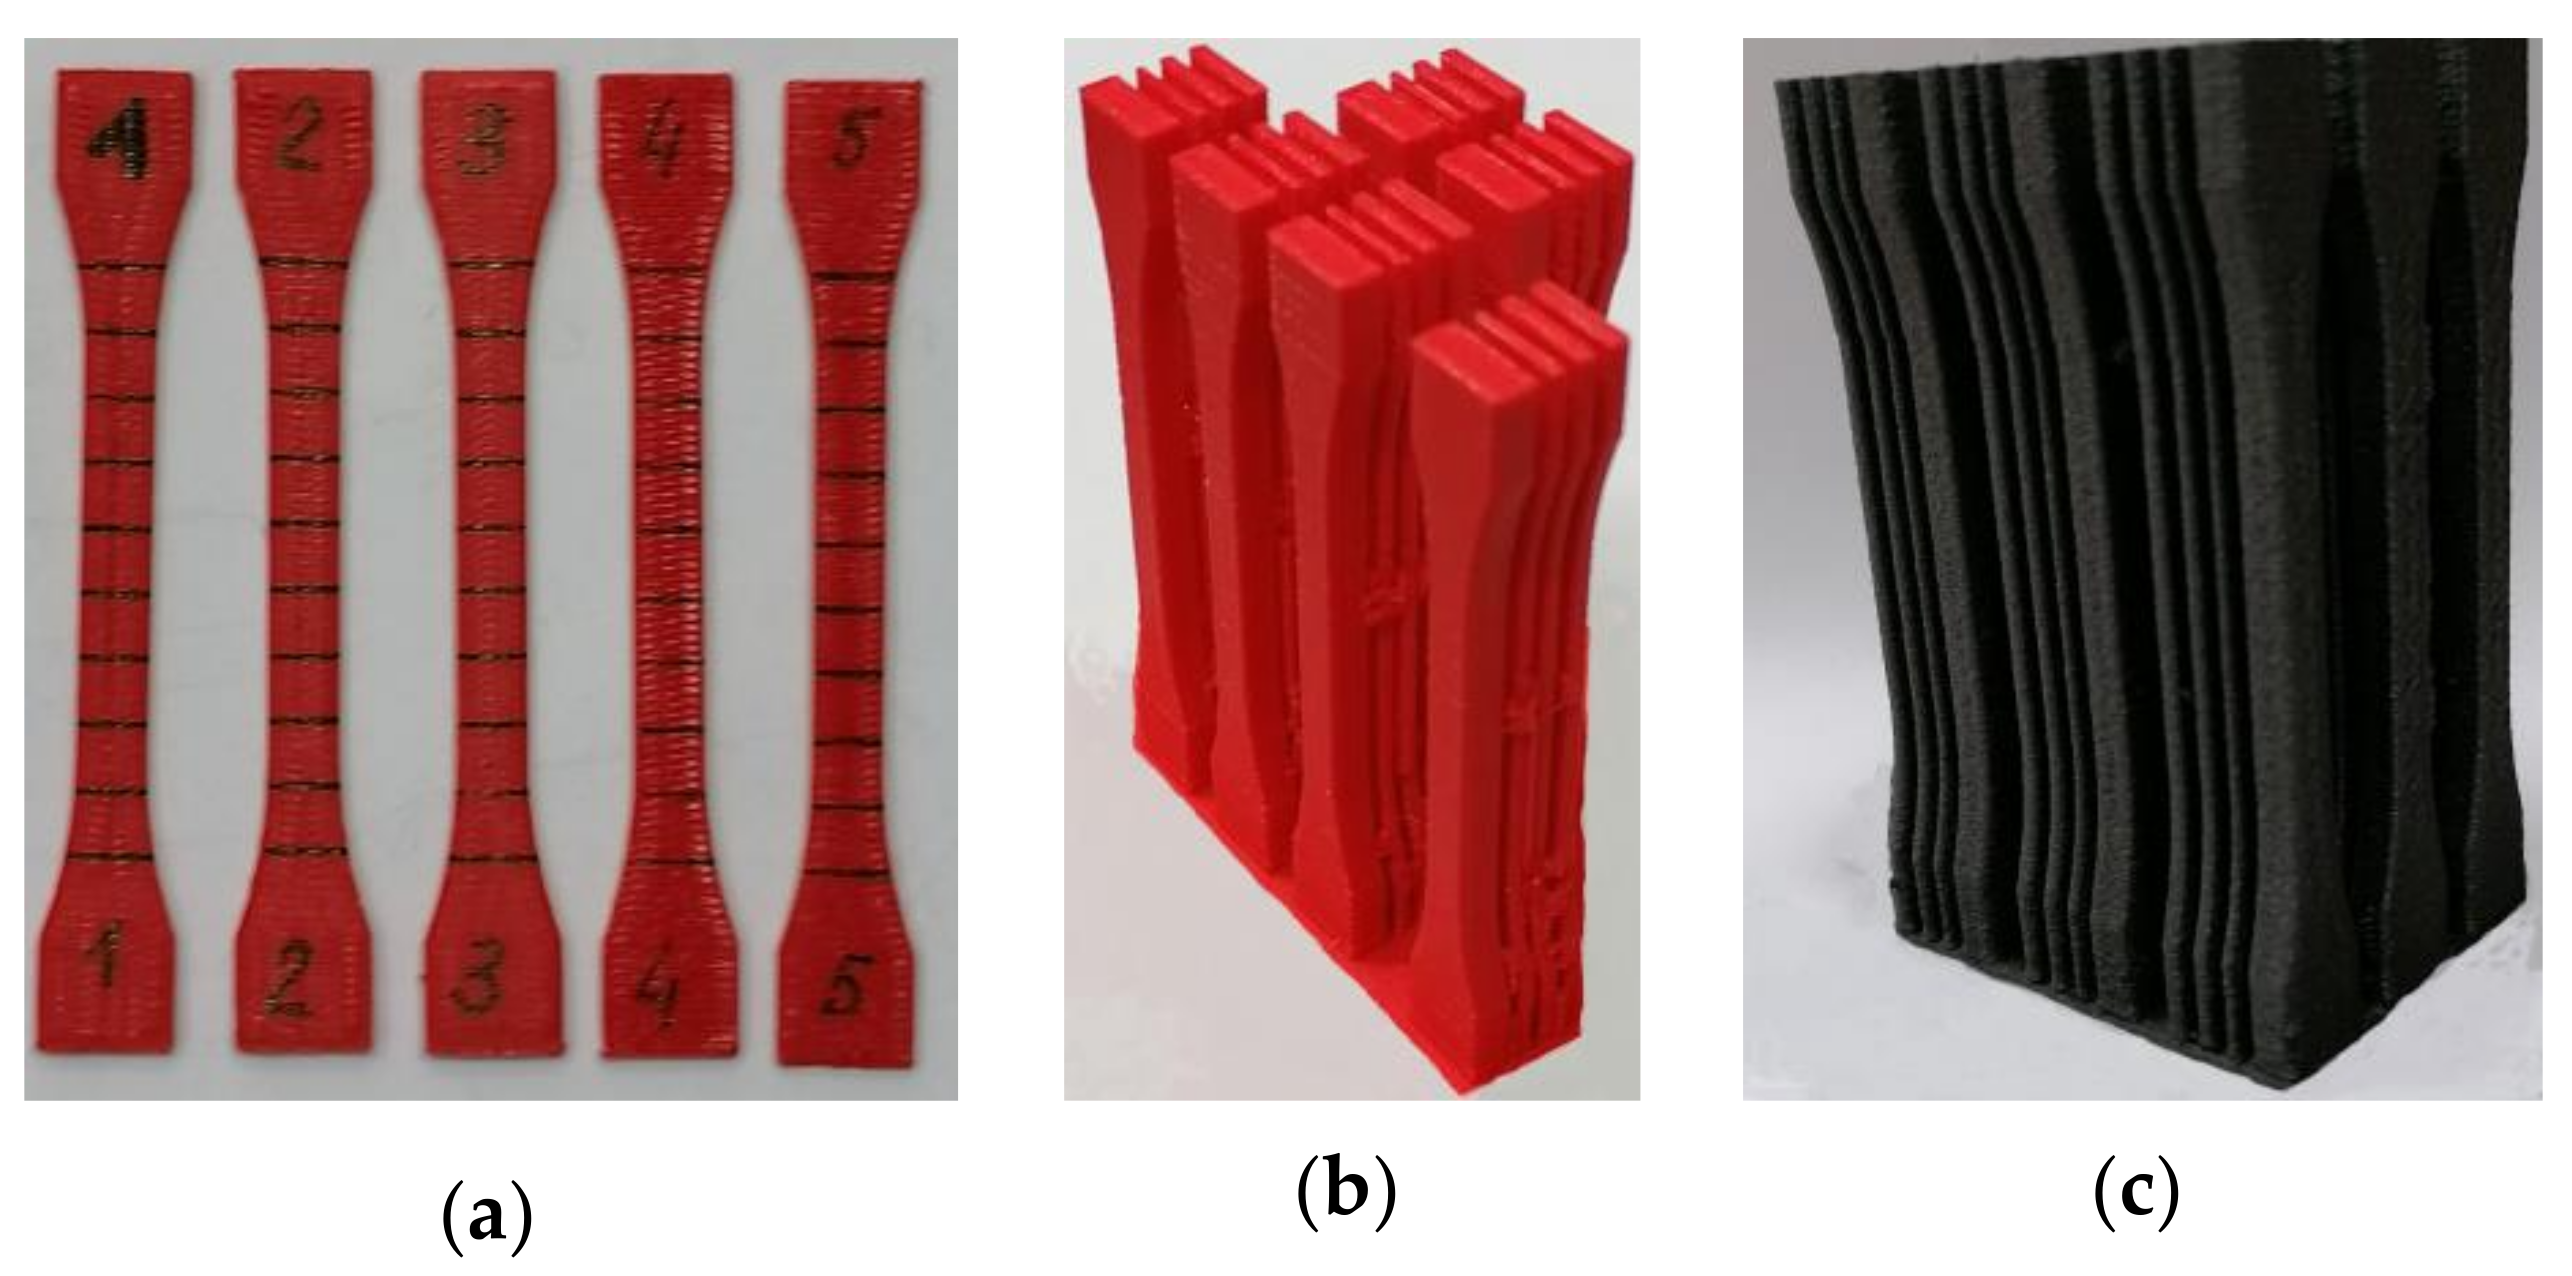
2.3. Preparation of the Fused Deposition Modelling (FDM) Specimens
- ✓
- Layer height: 0.2 mm;
- ✓
- Infill density: 95% (maximum possible value in 3D printer software);
- ✓
- extruder temperature: 230 °C for PLA and 250 °C for PLA-CF;
- ✓
- nozzle diameter: 0.4 mm.
3. Results
3.1. Metrology
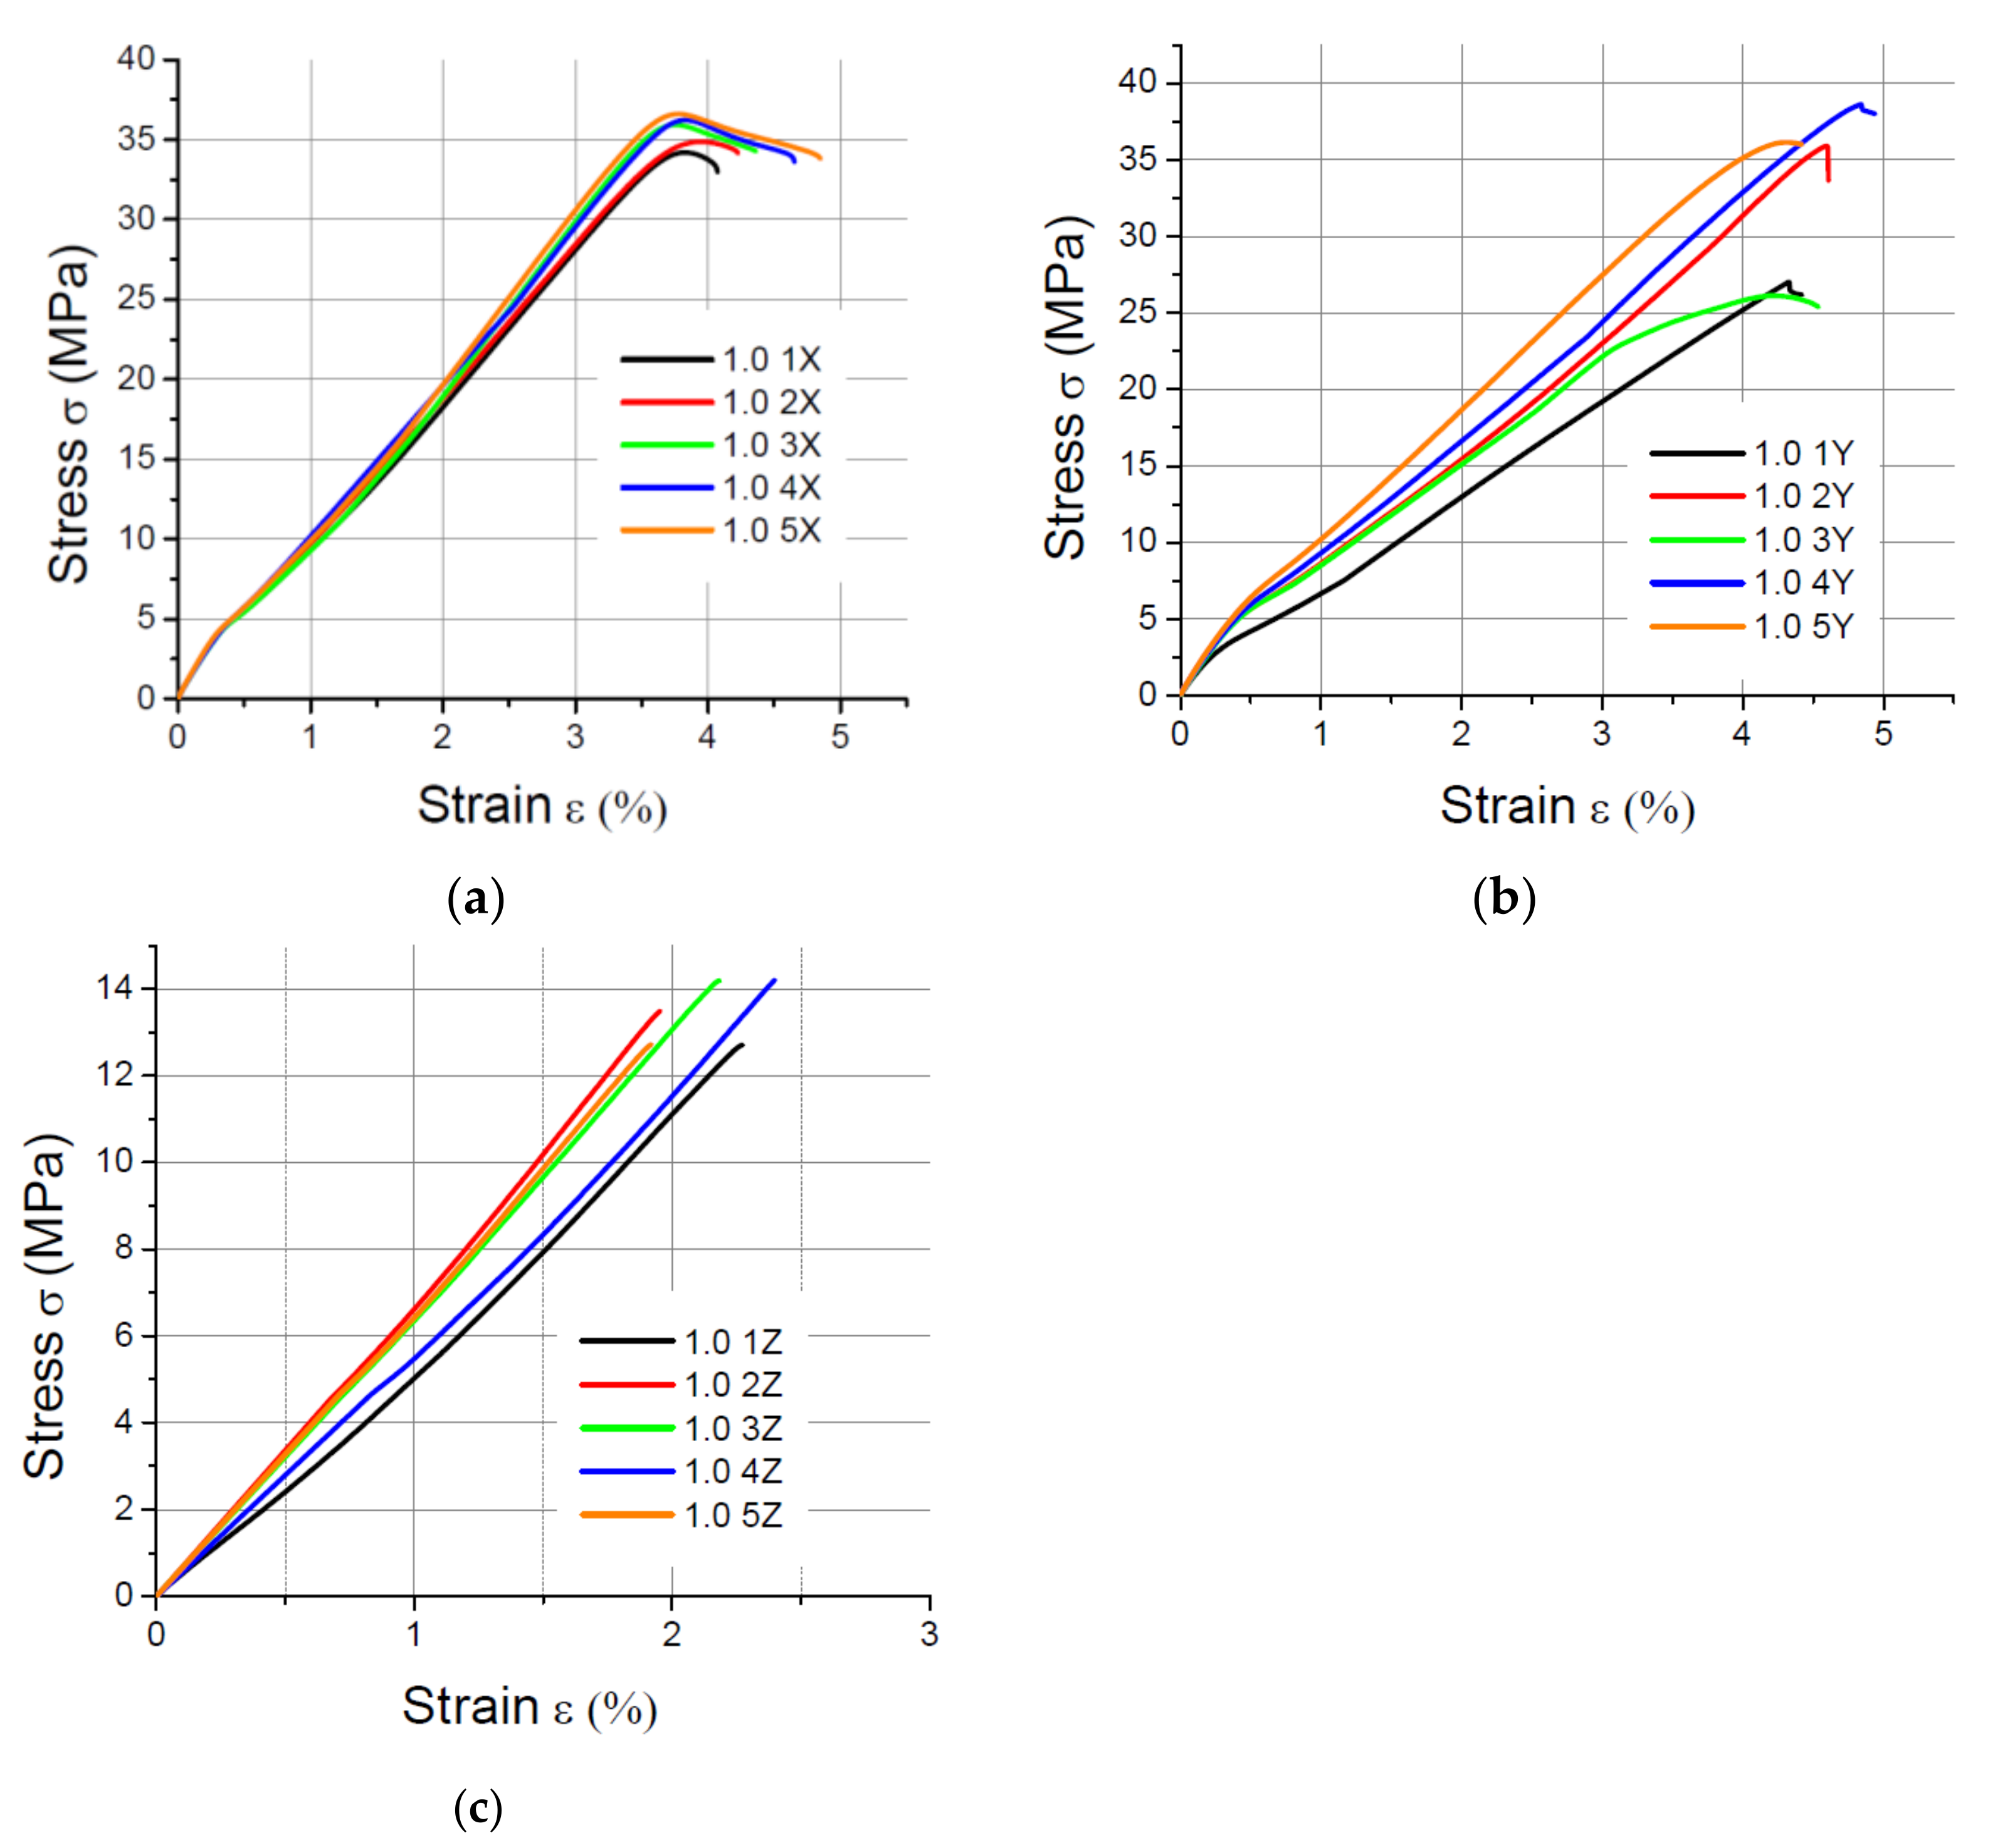
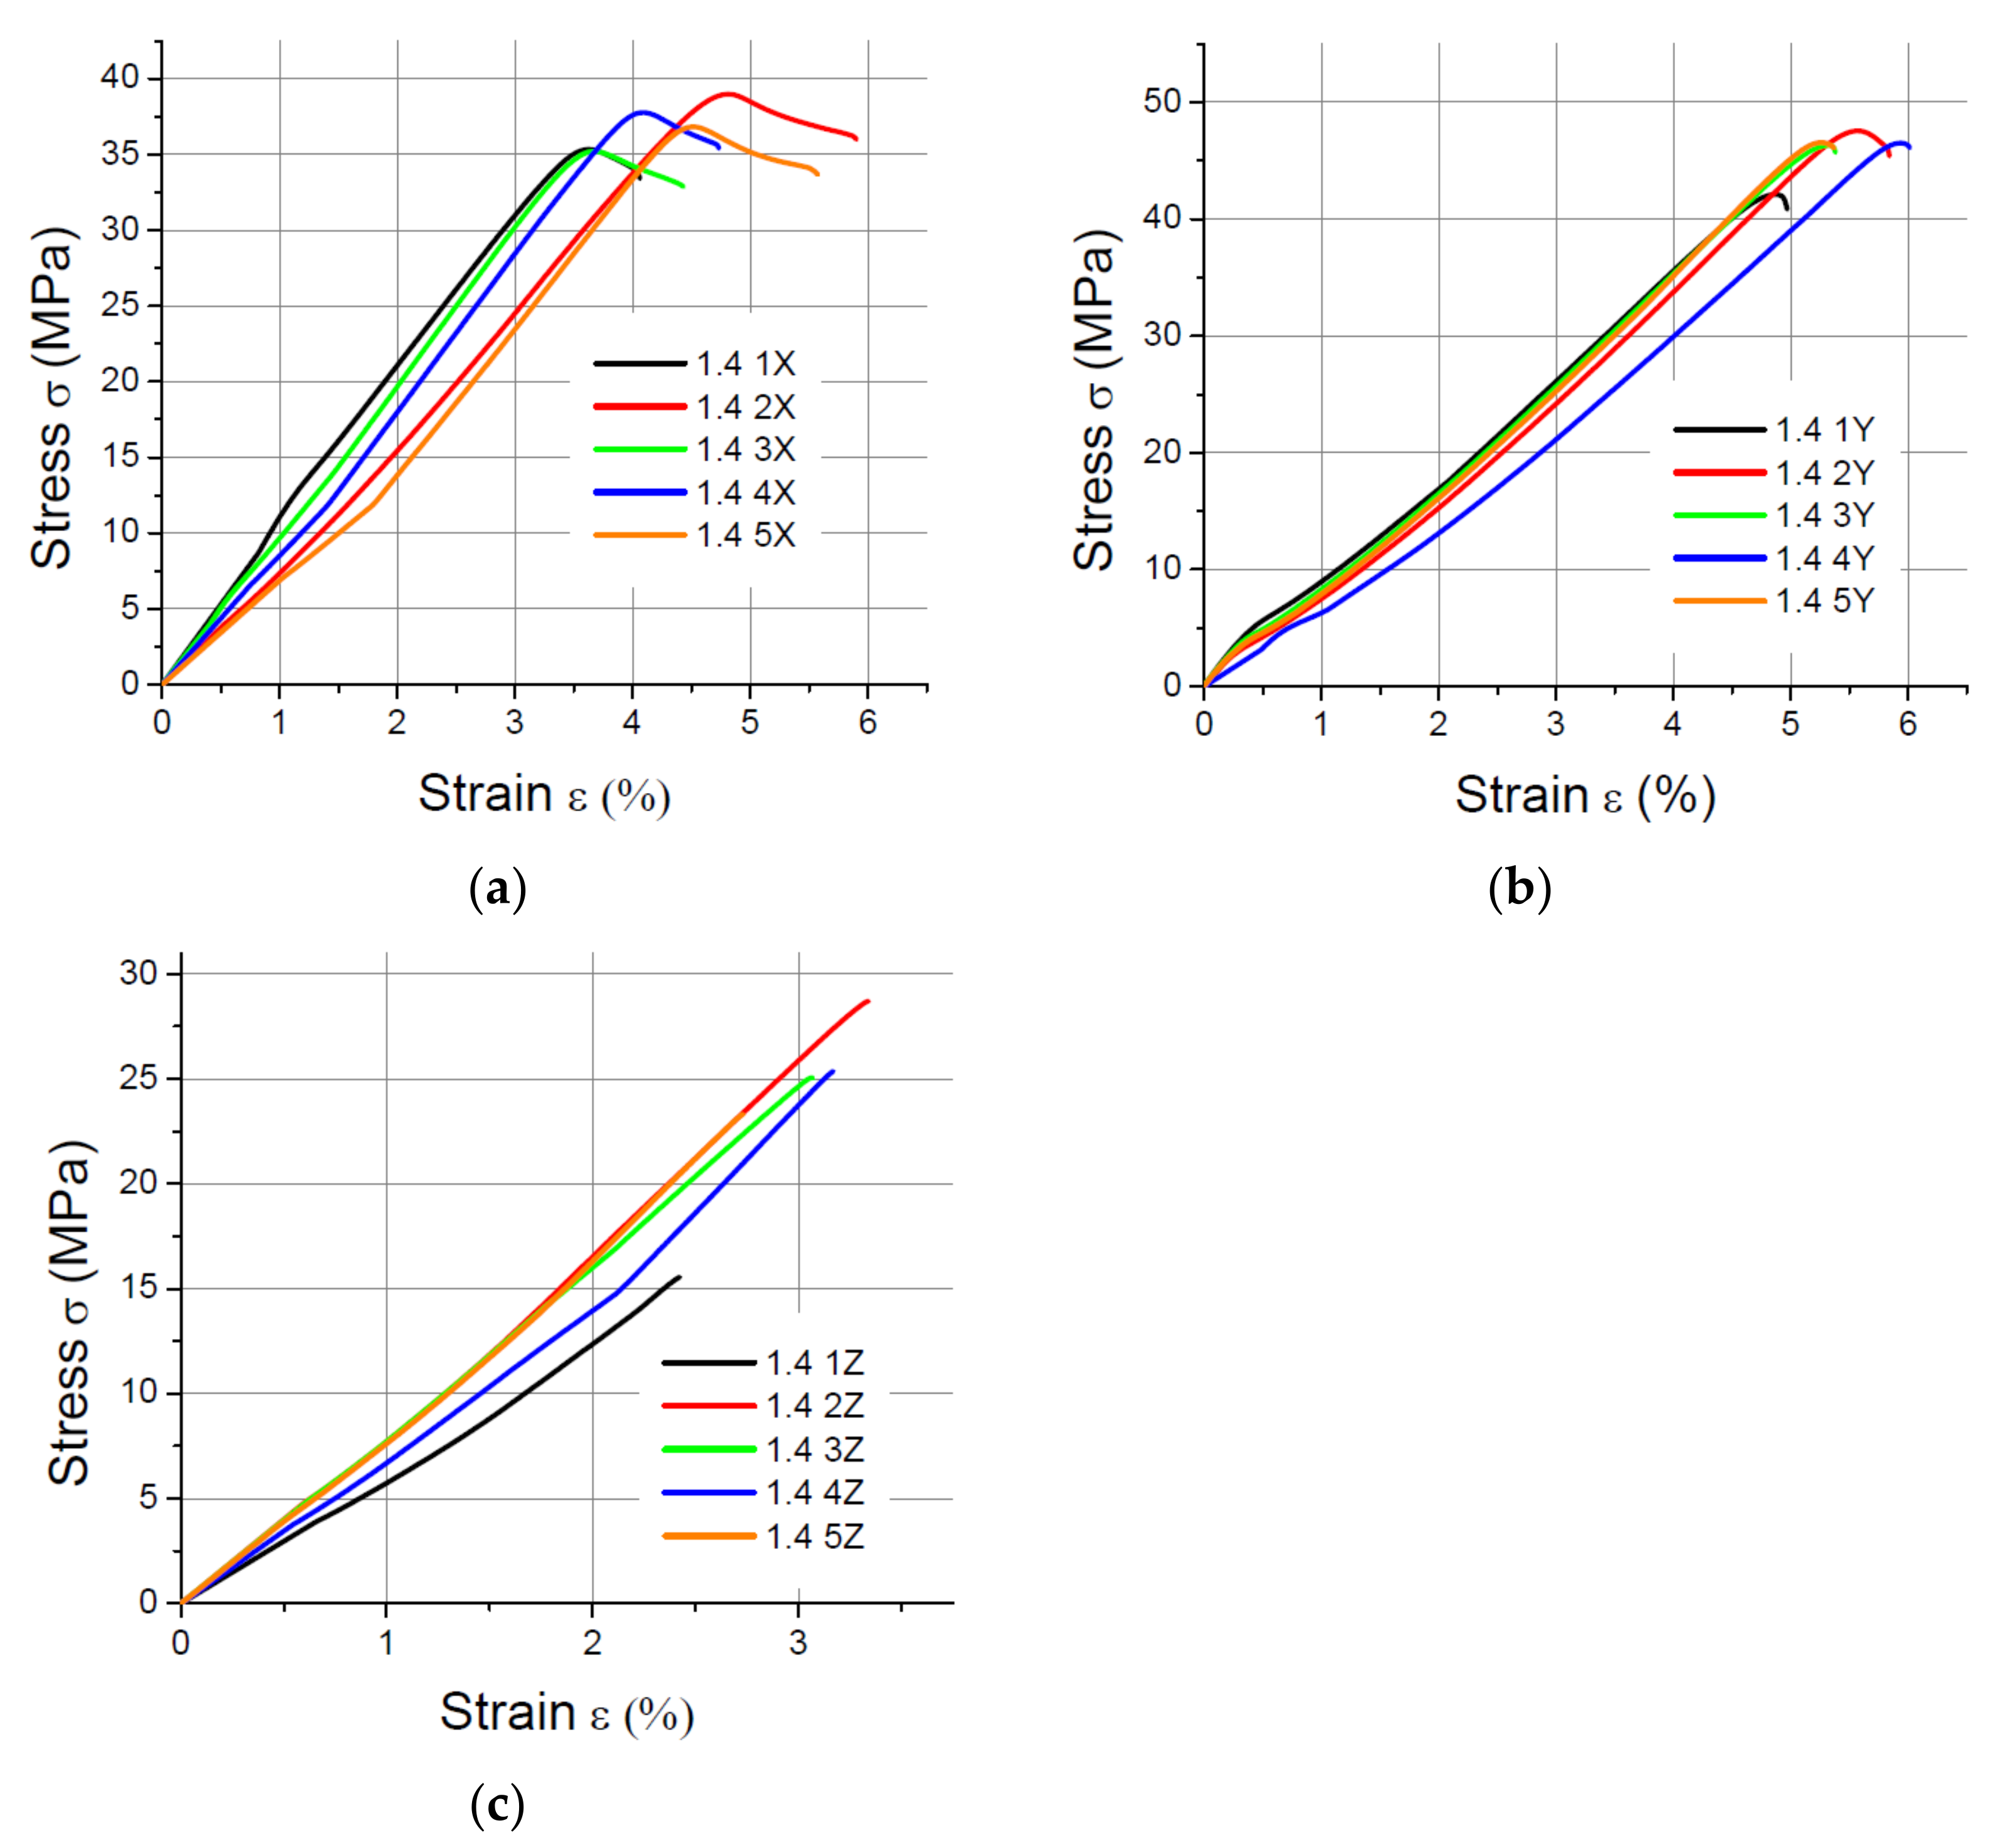
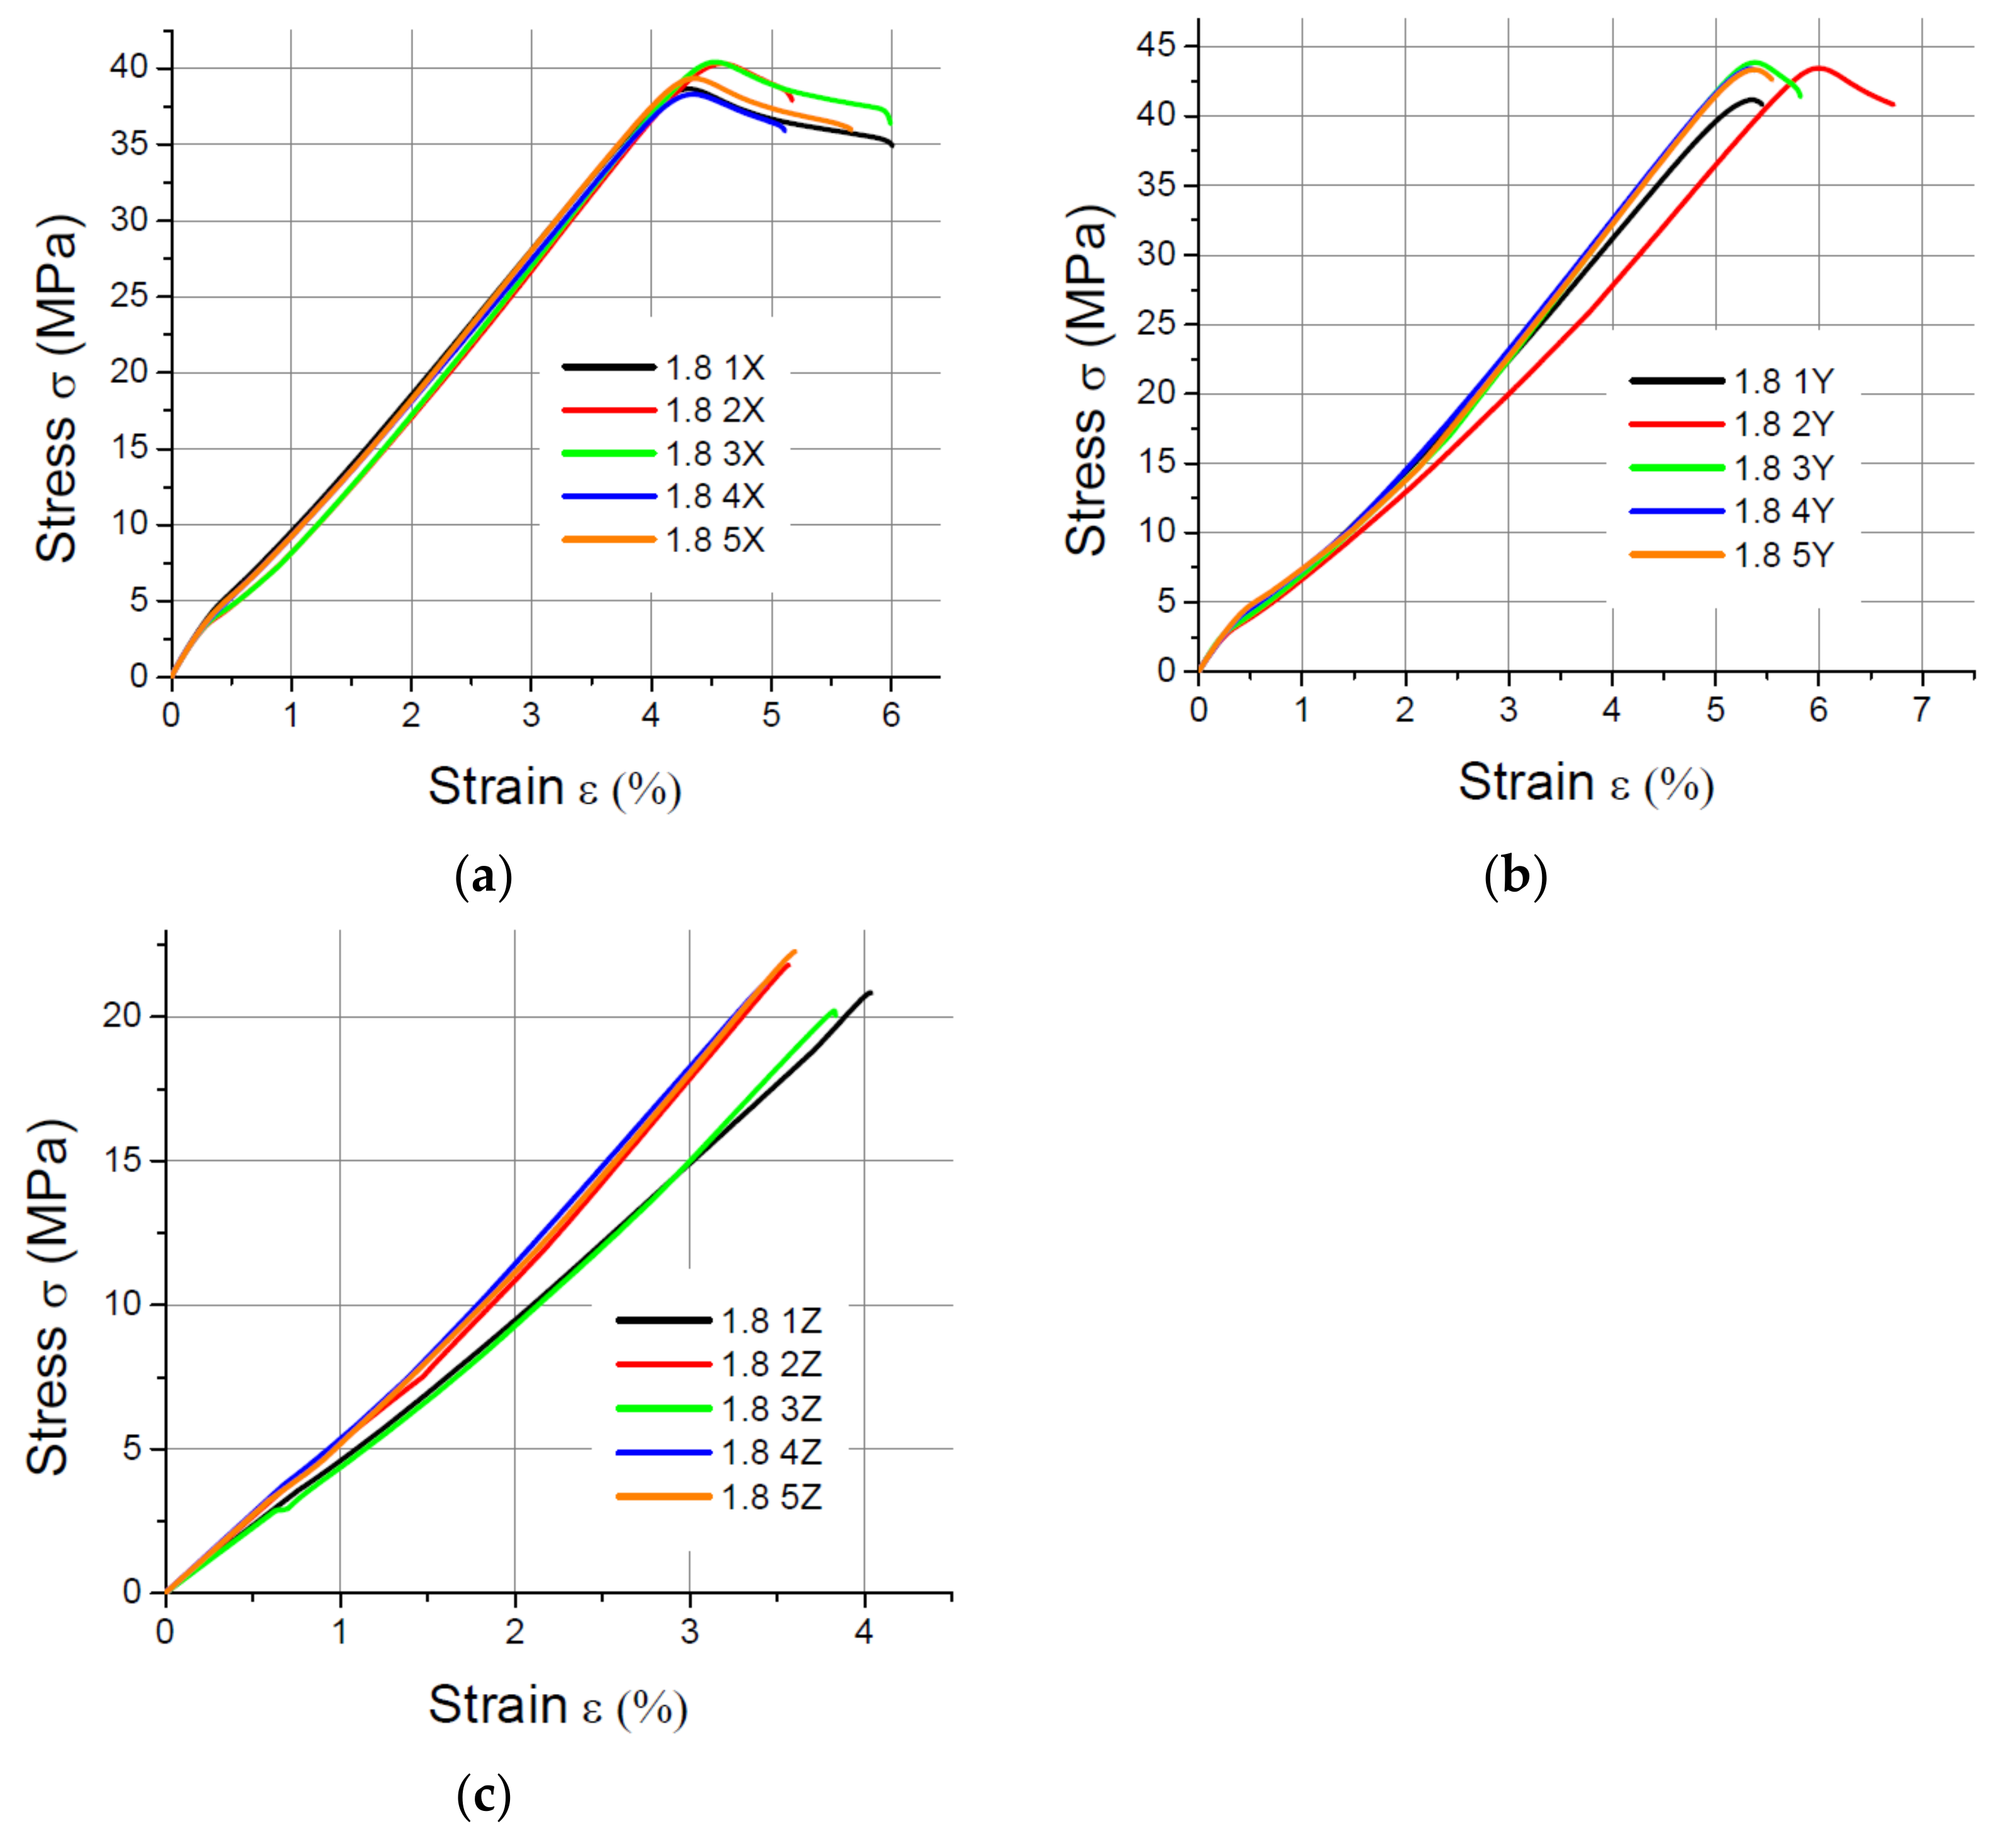
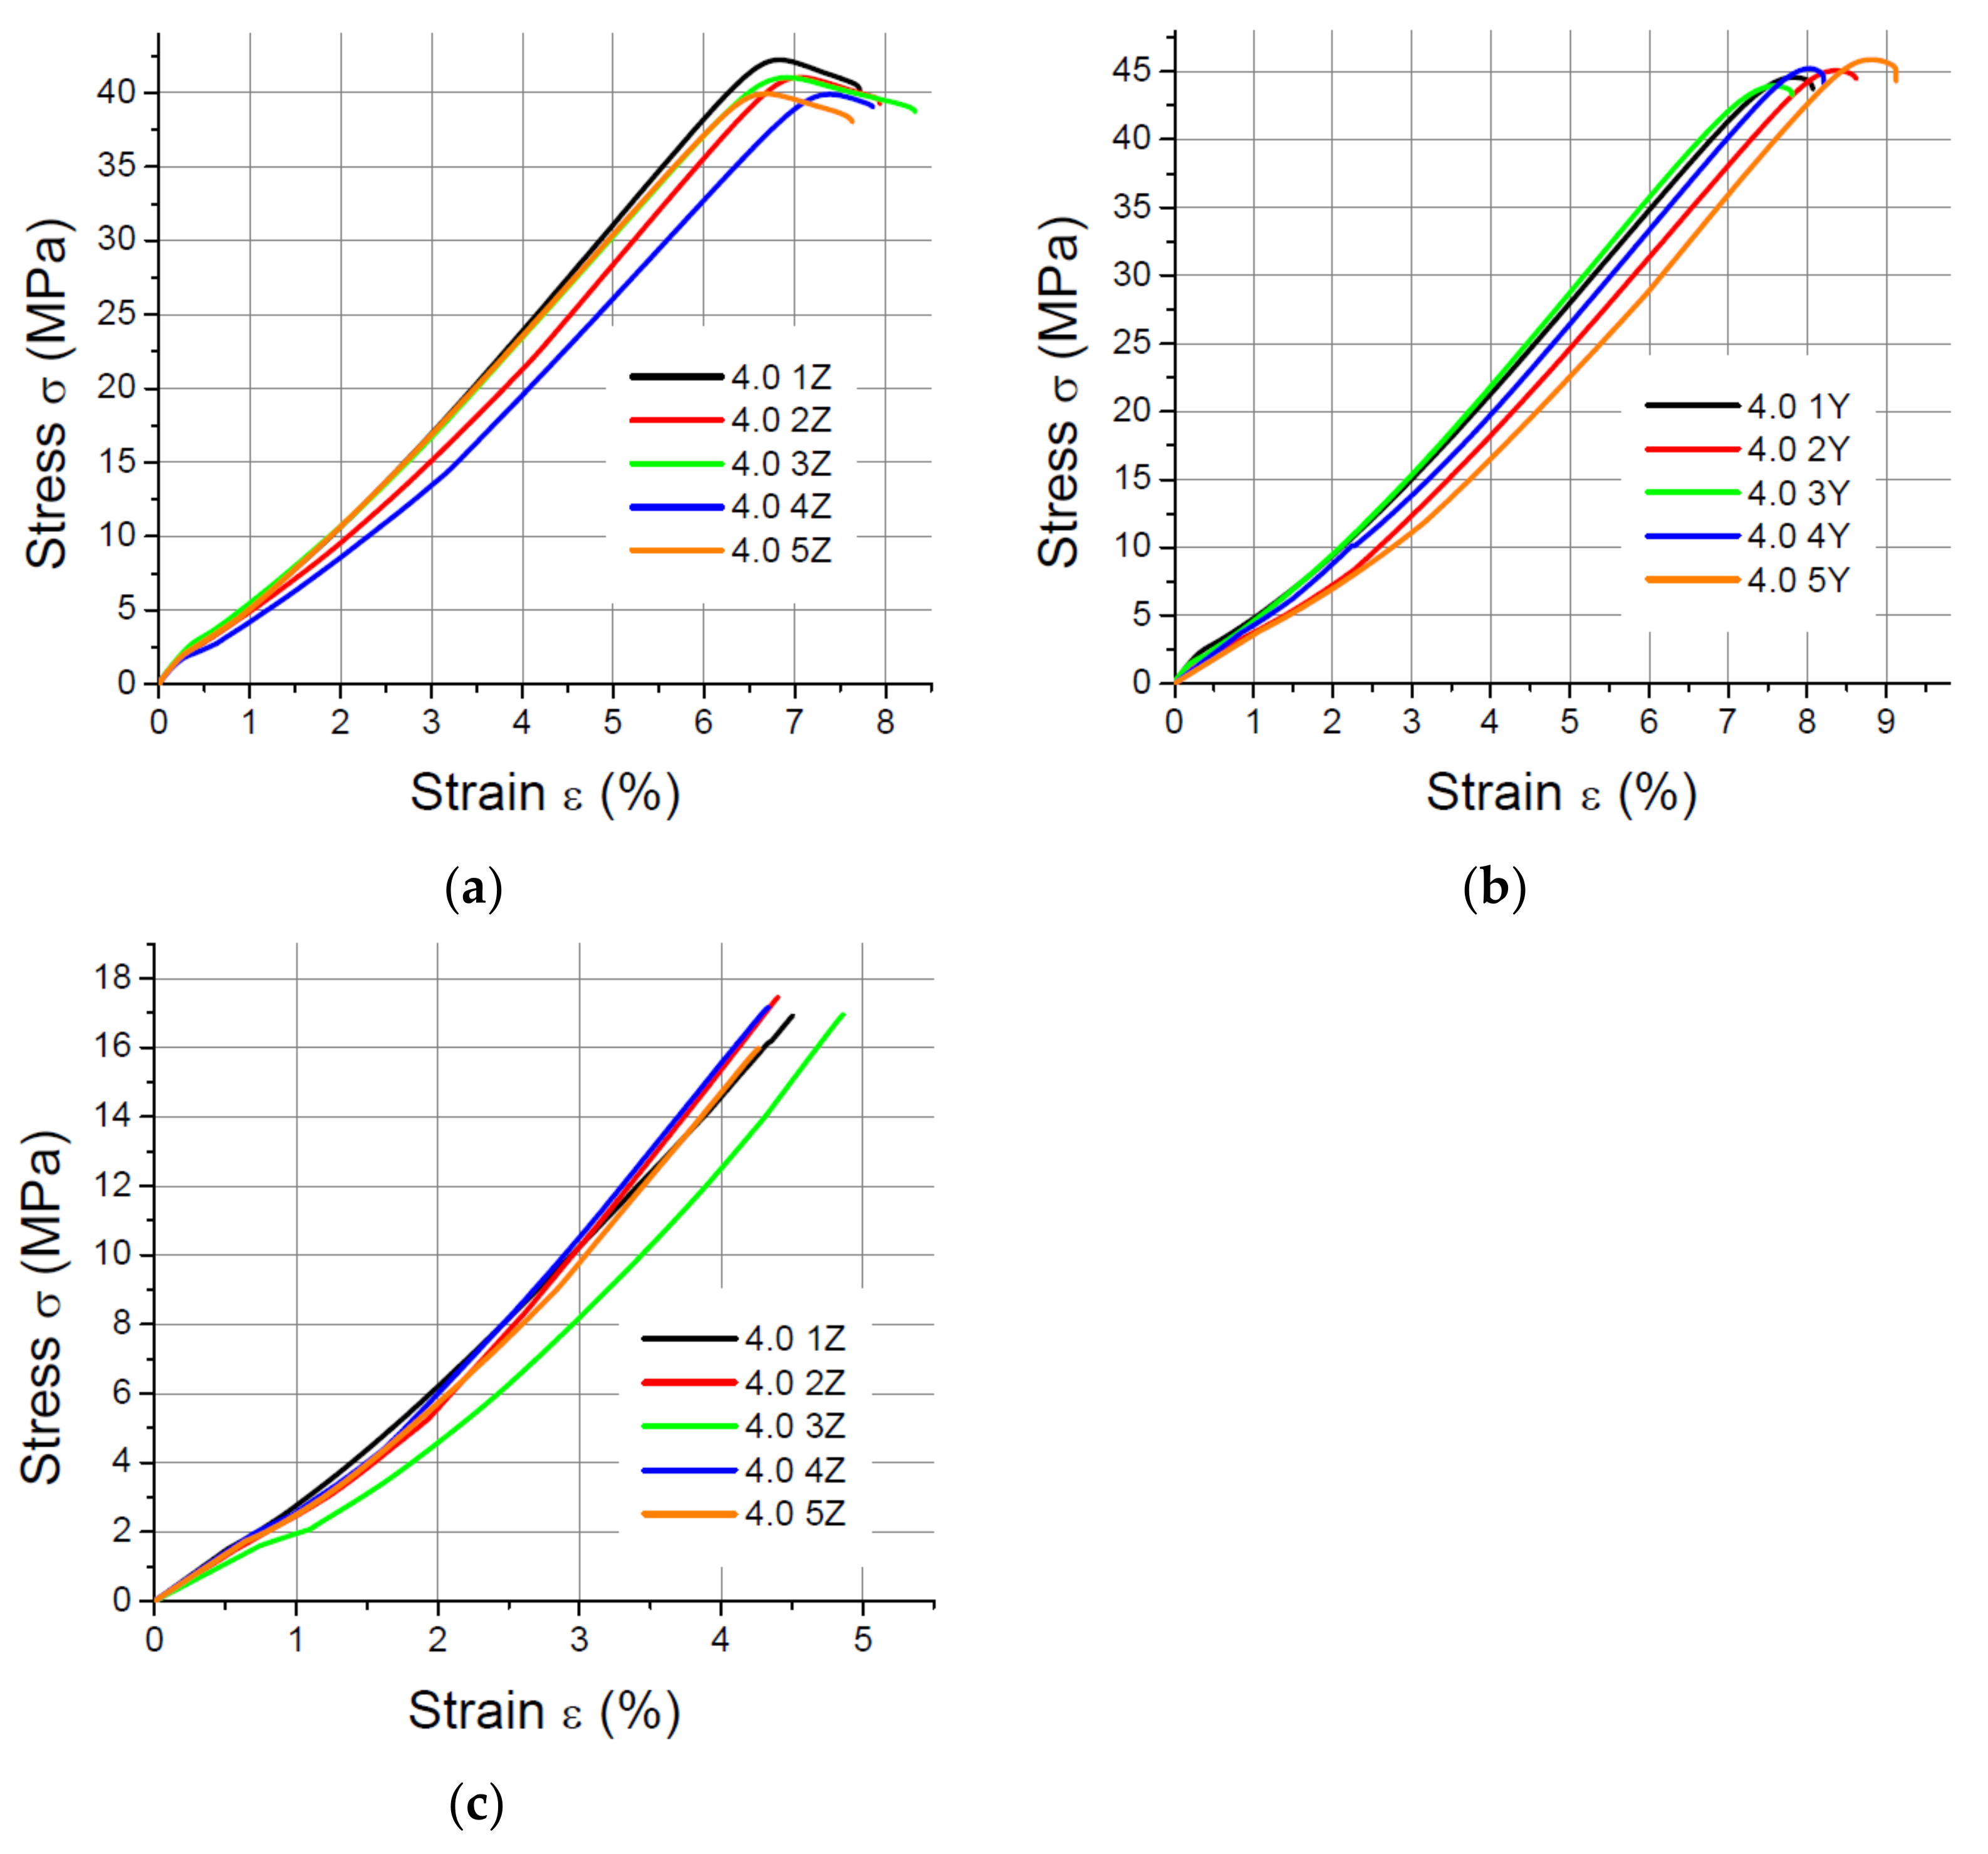
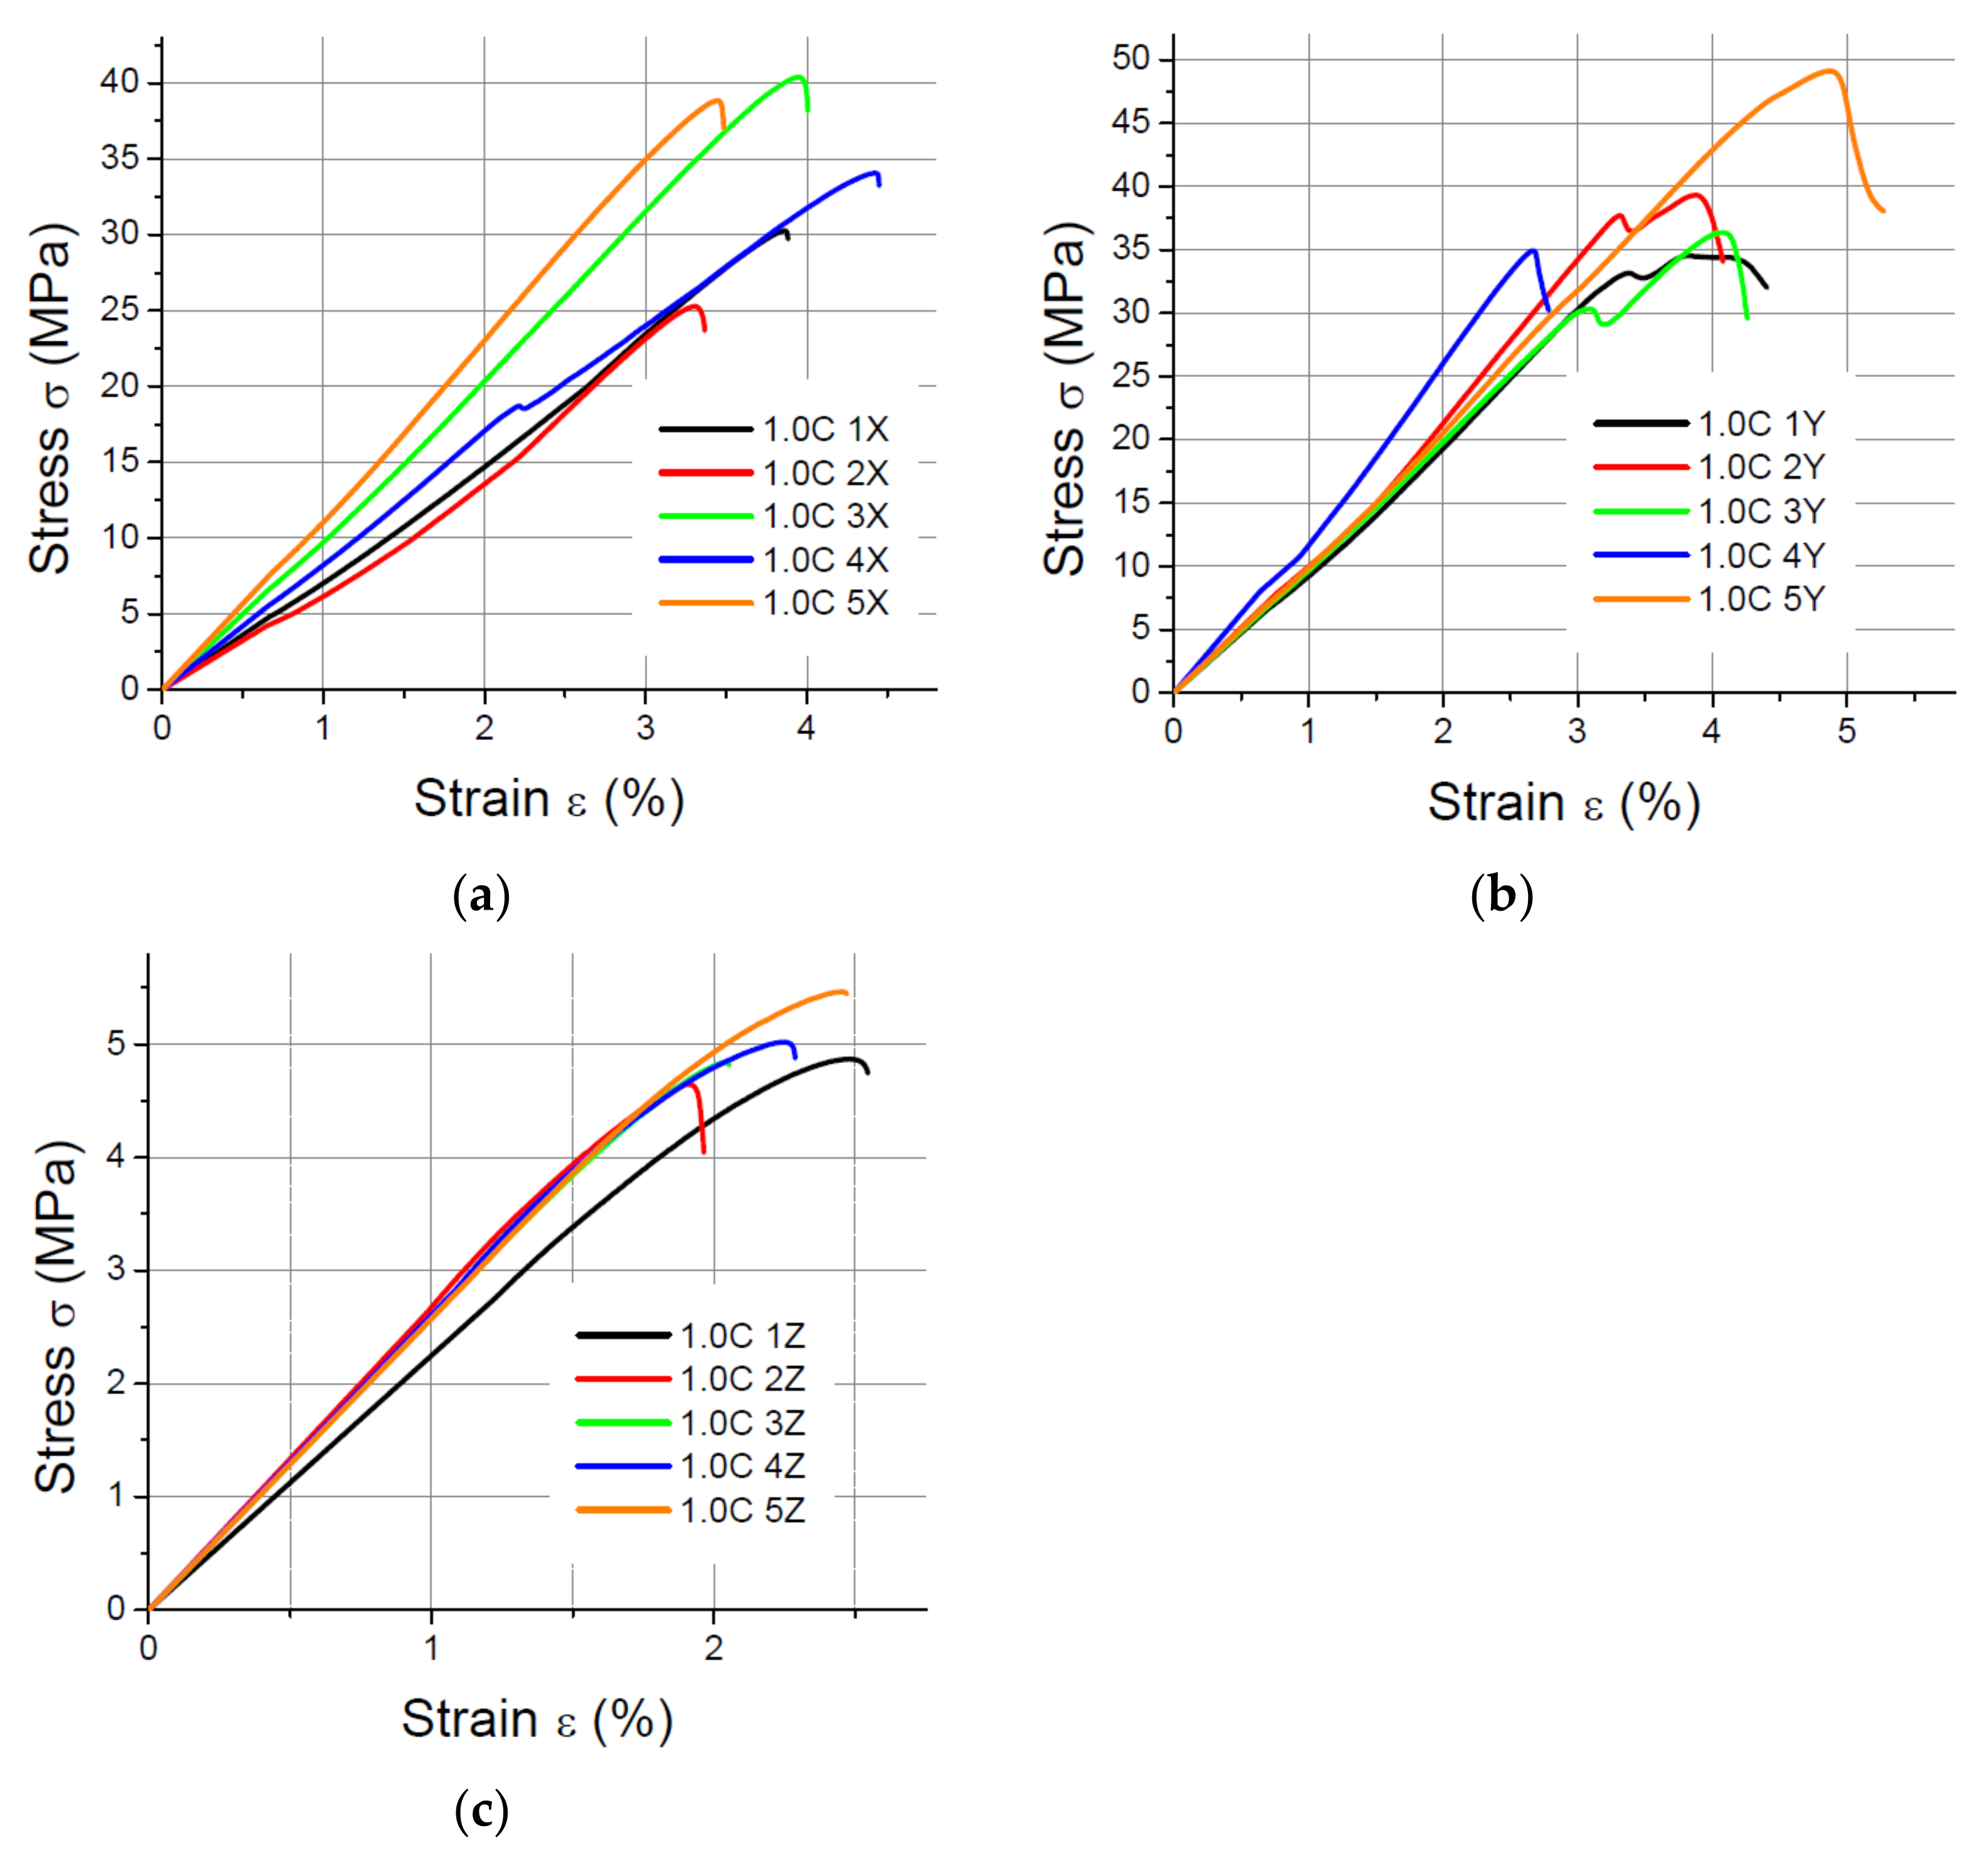
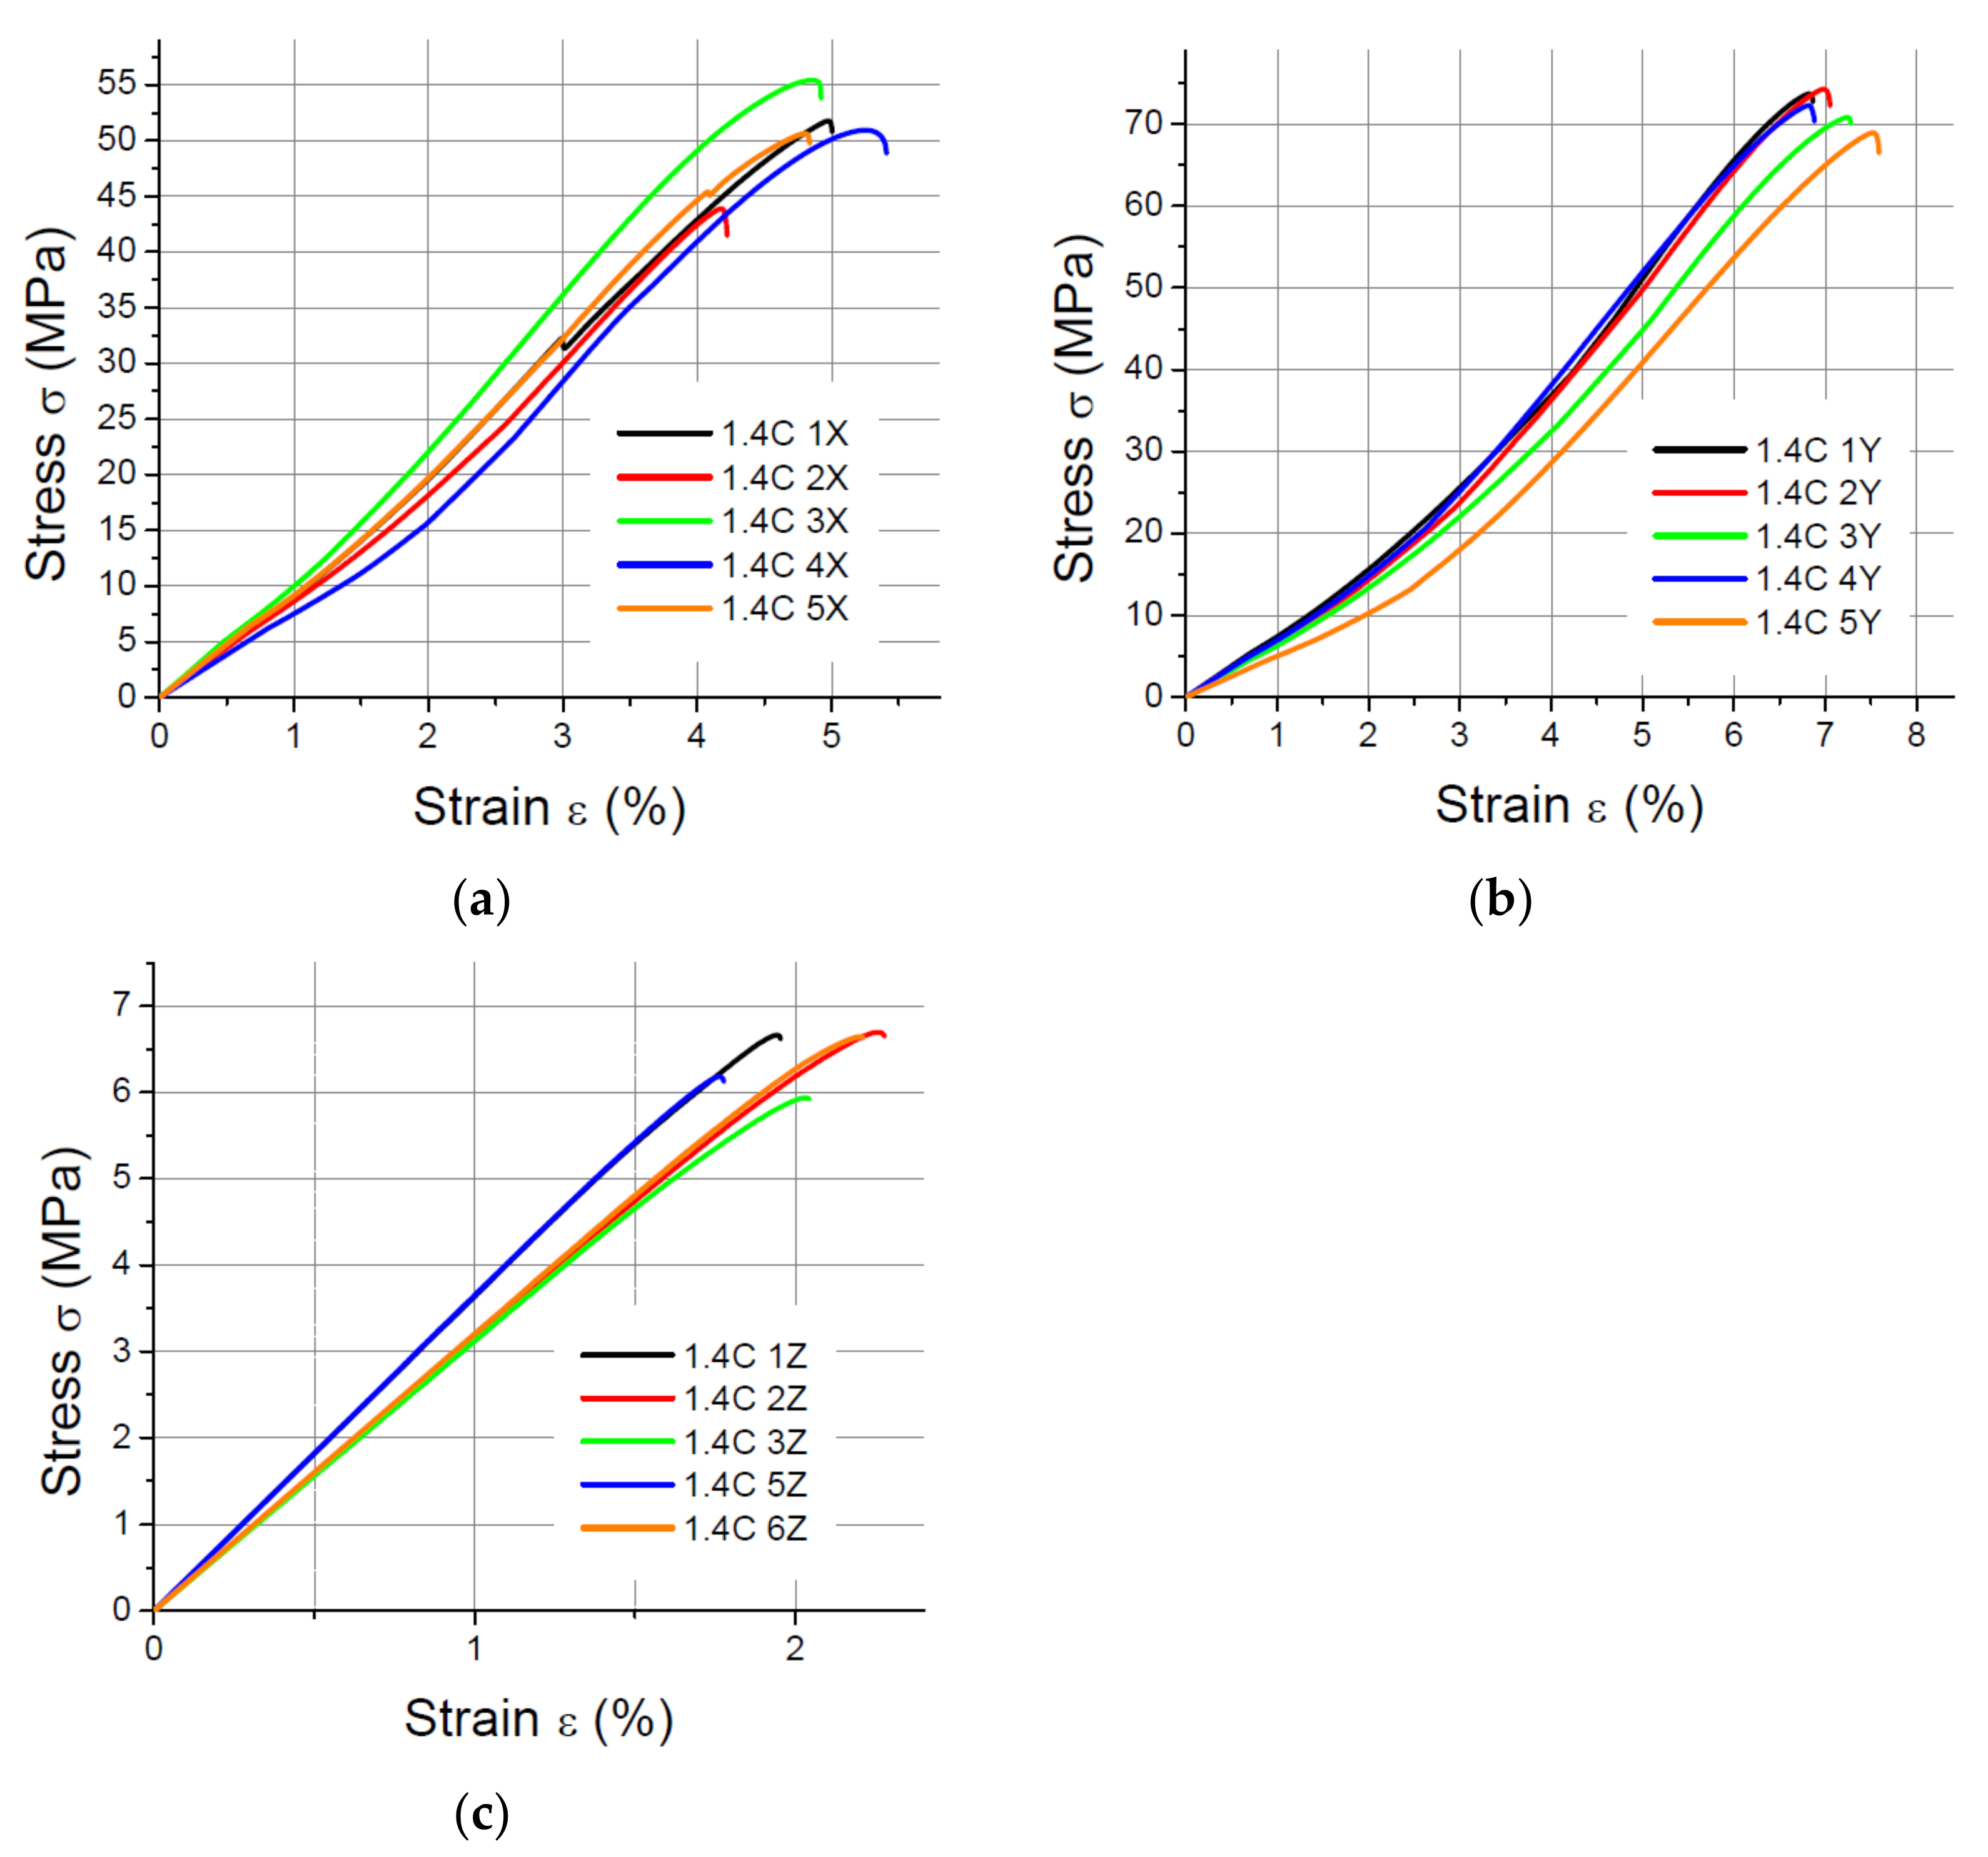
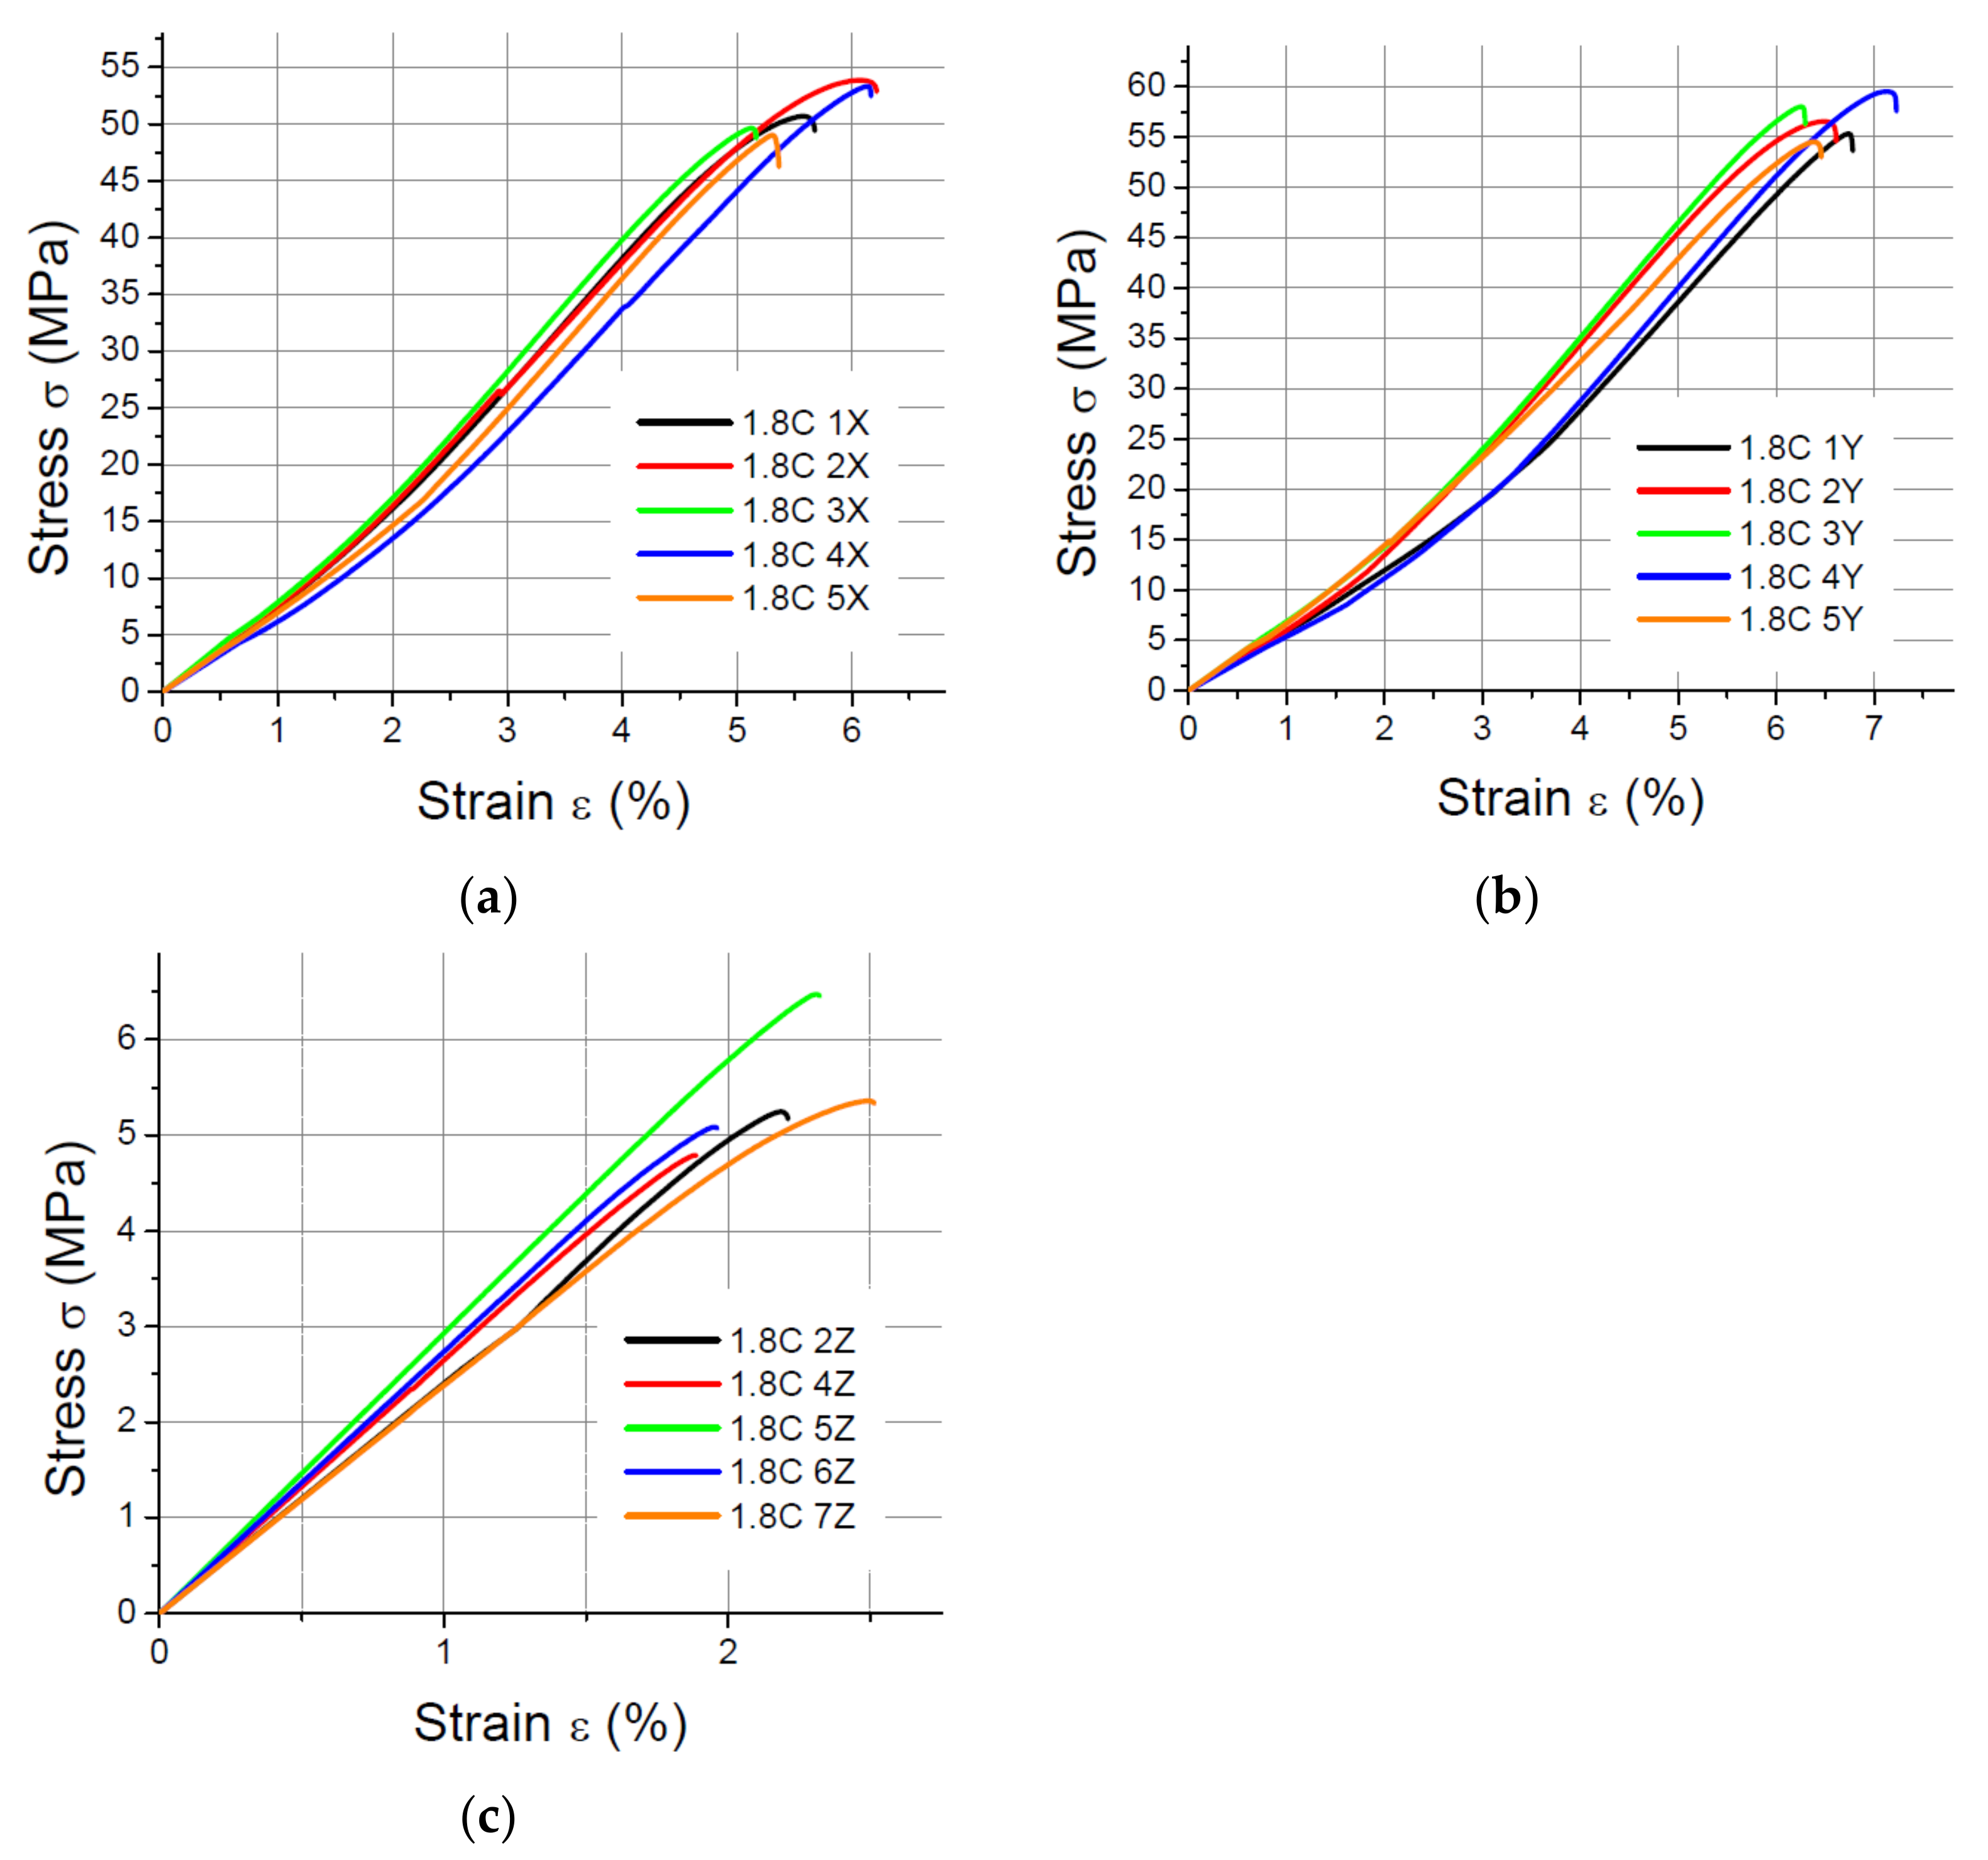
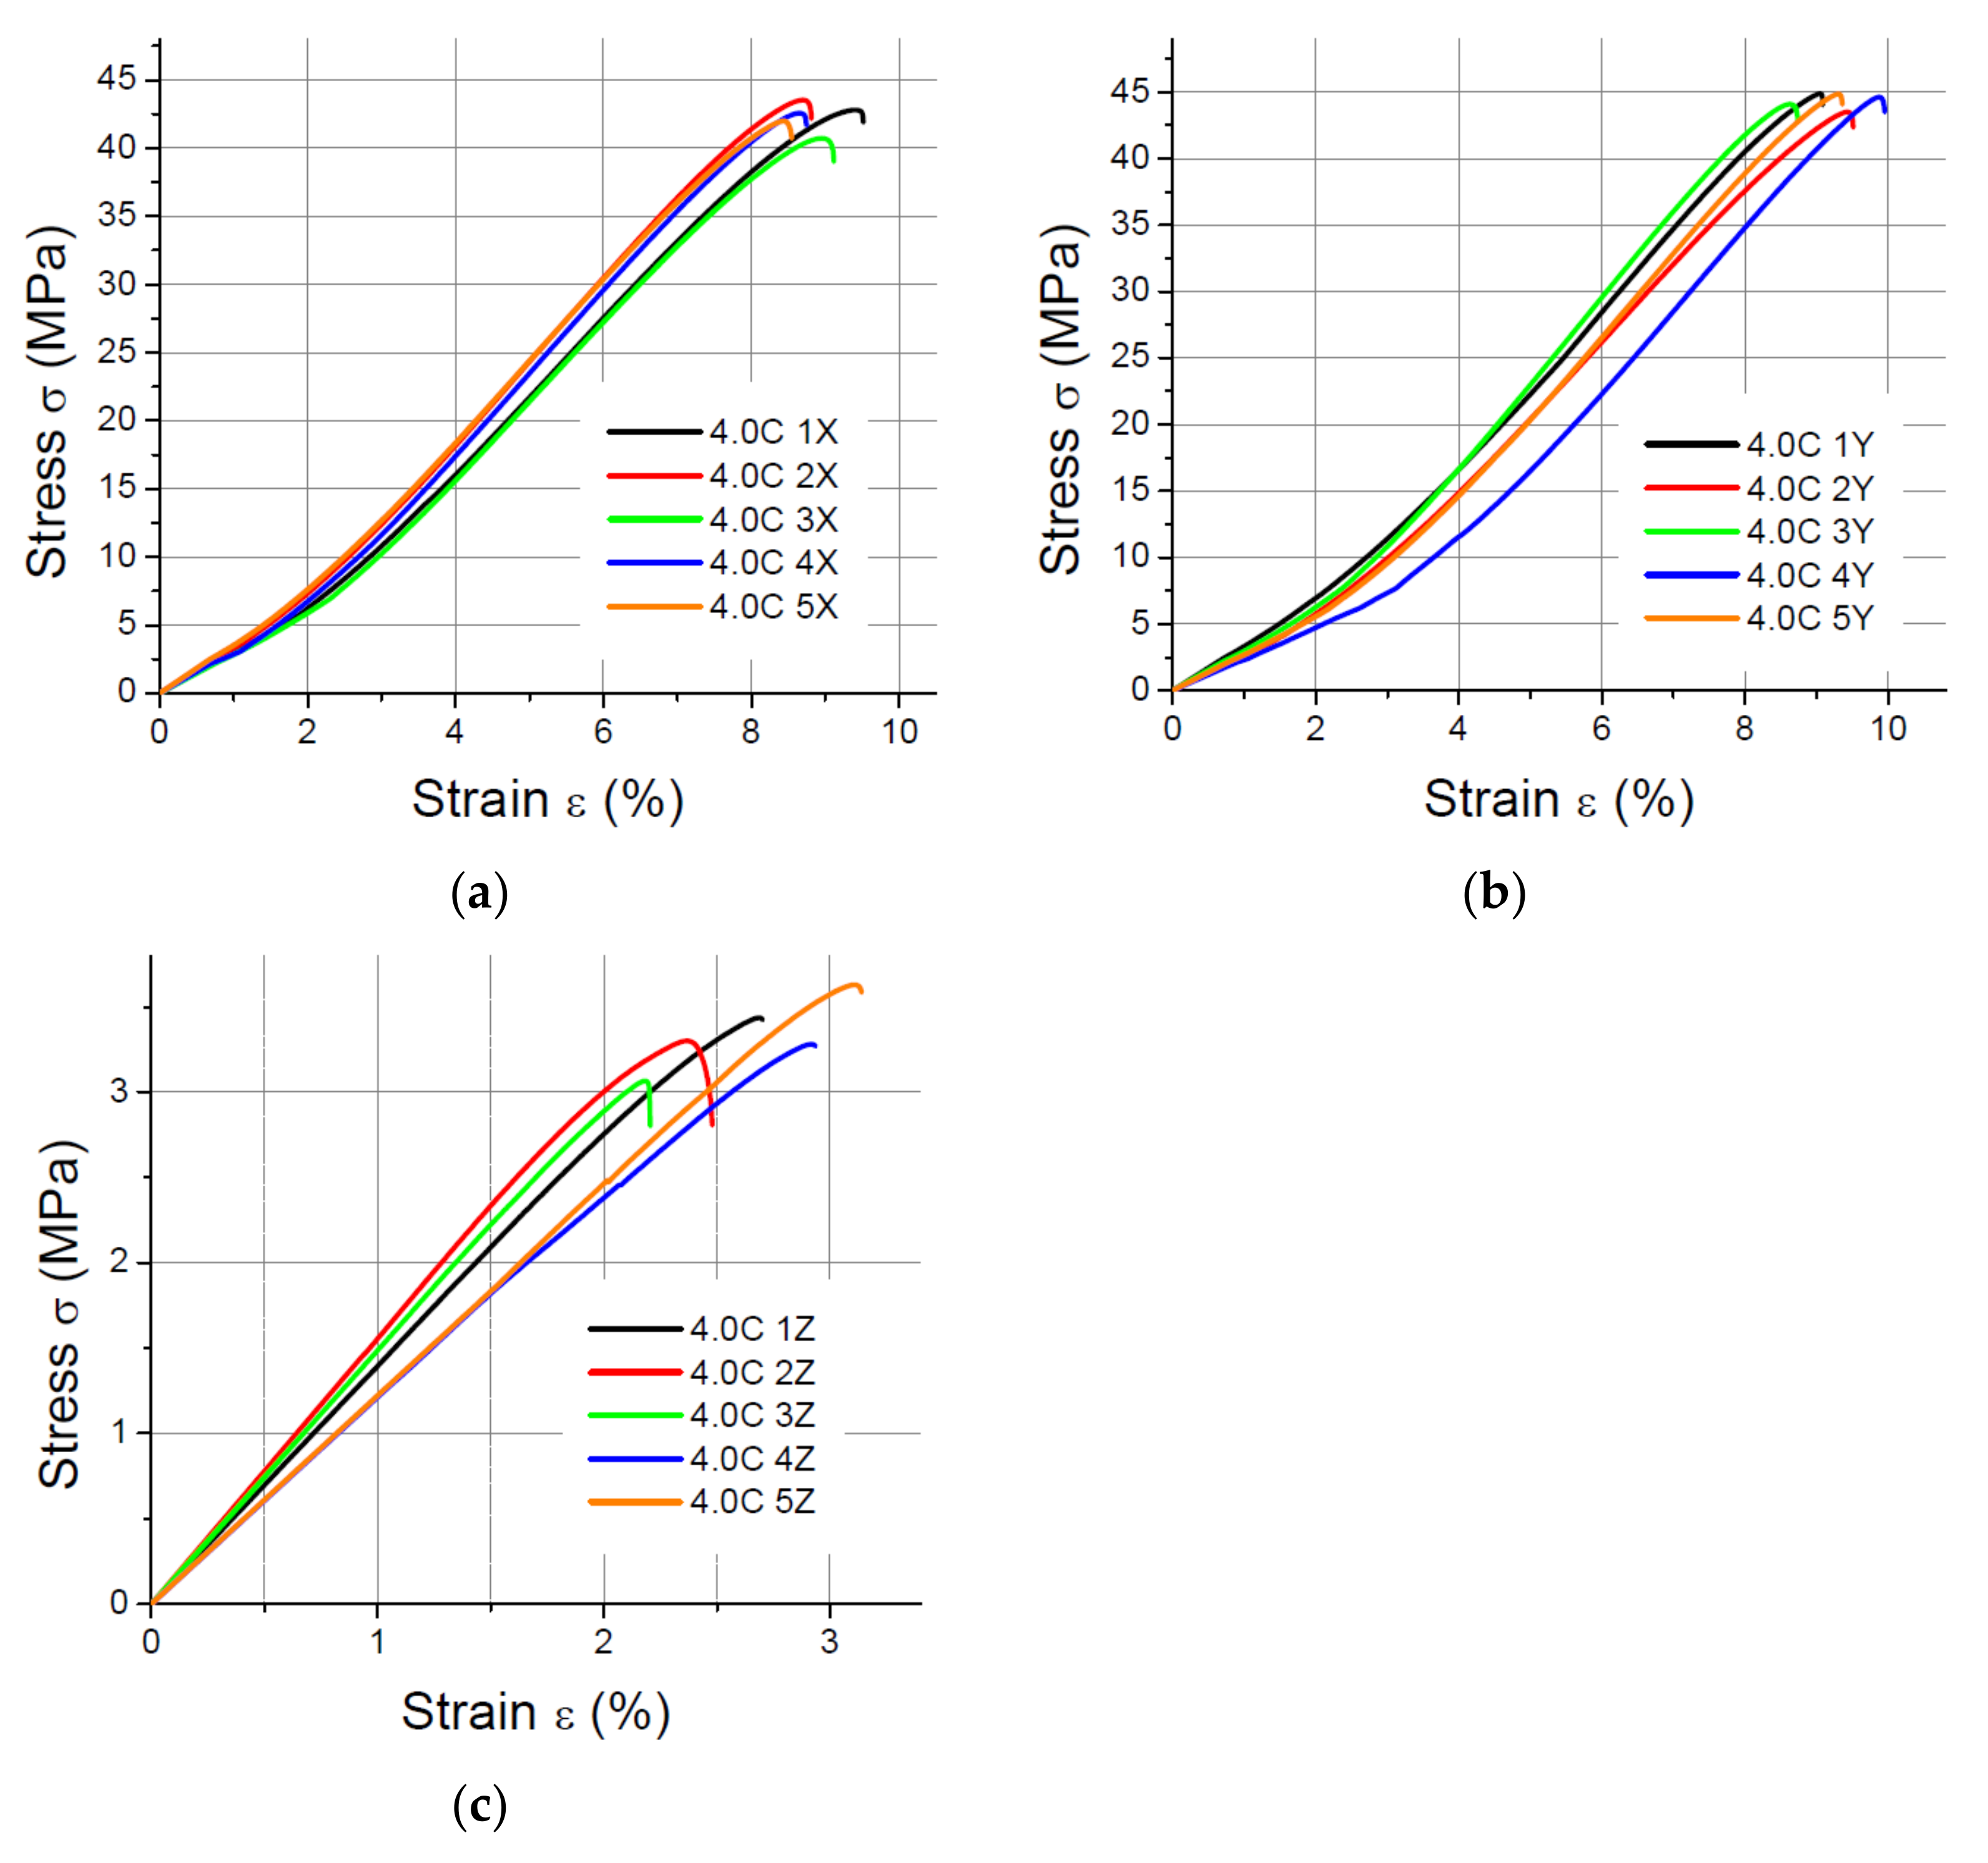
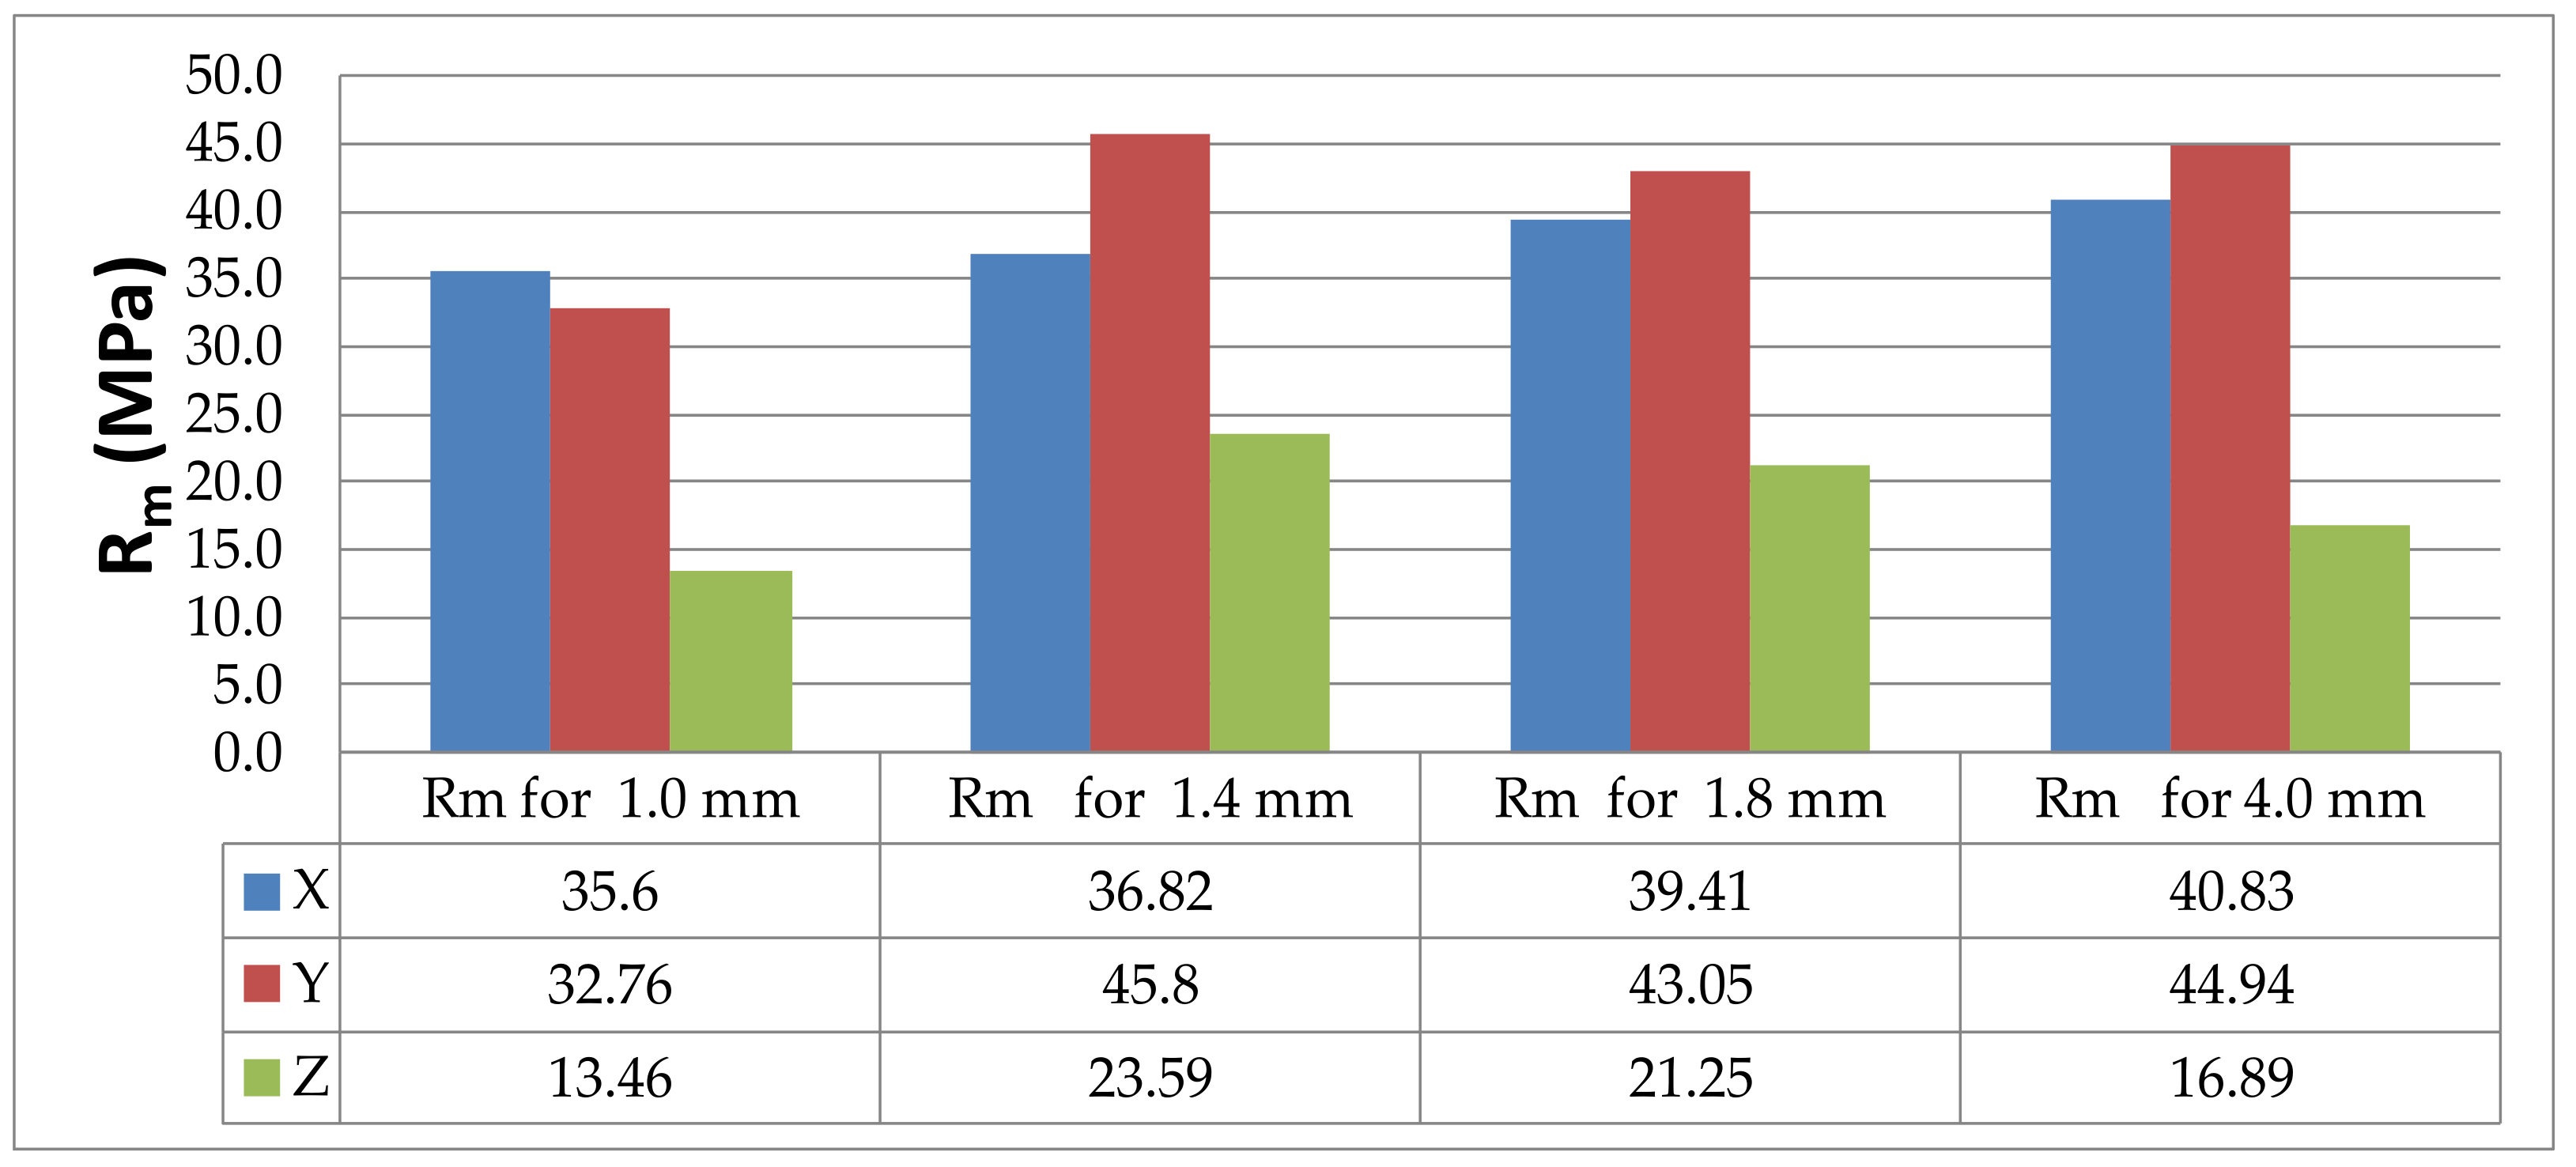
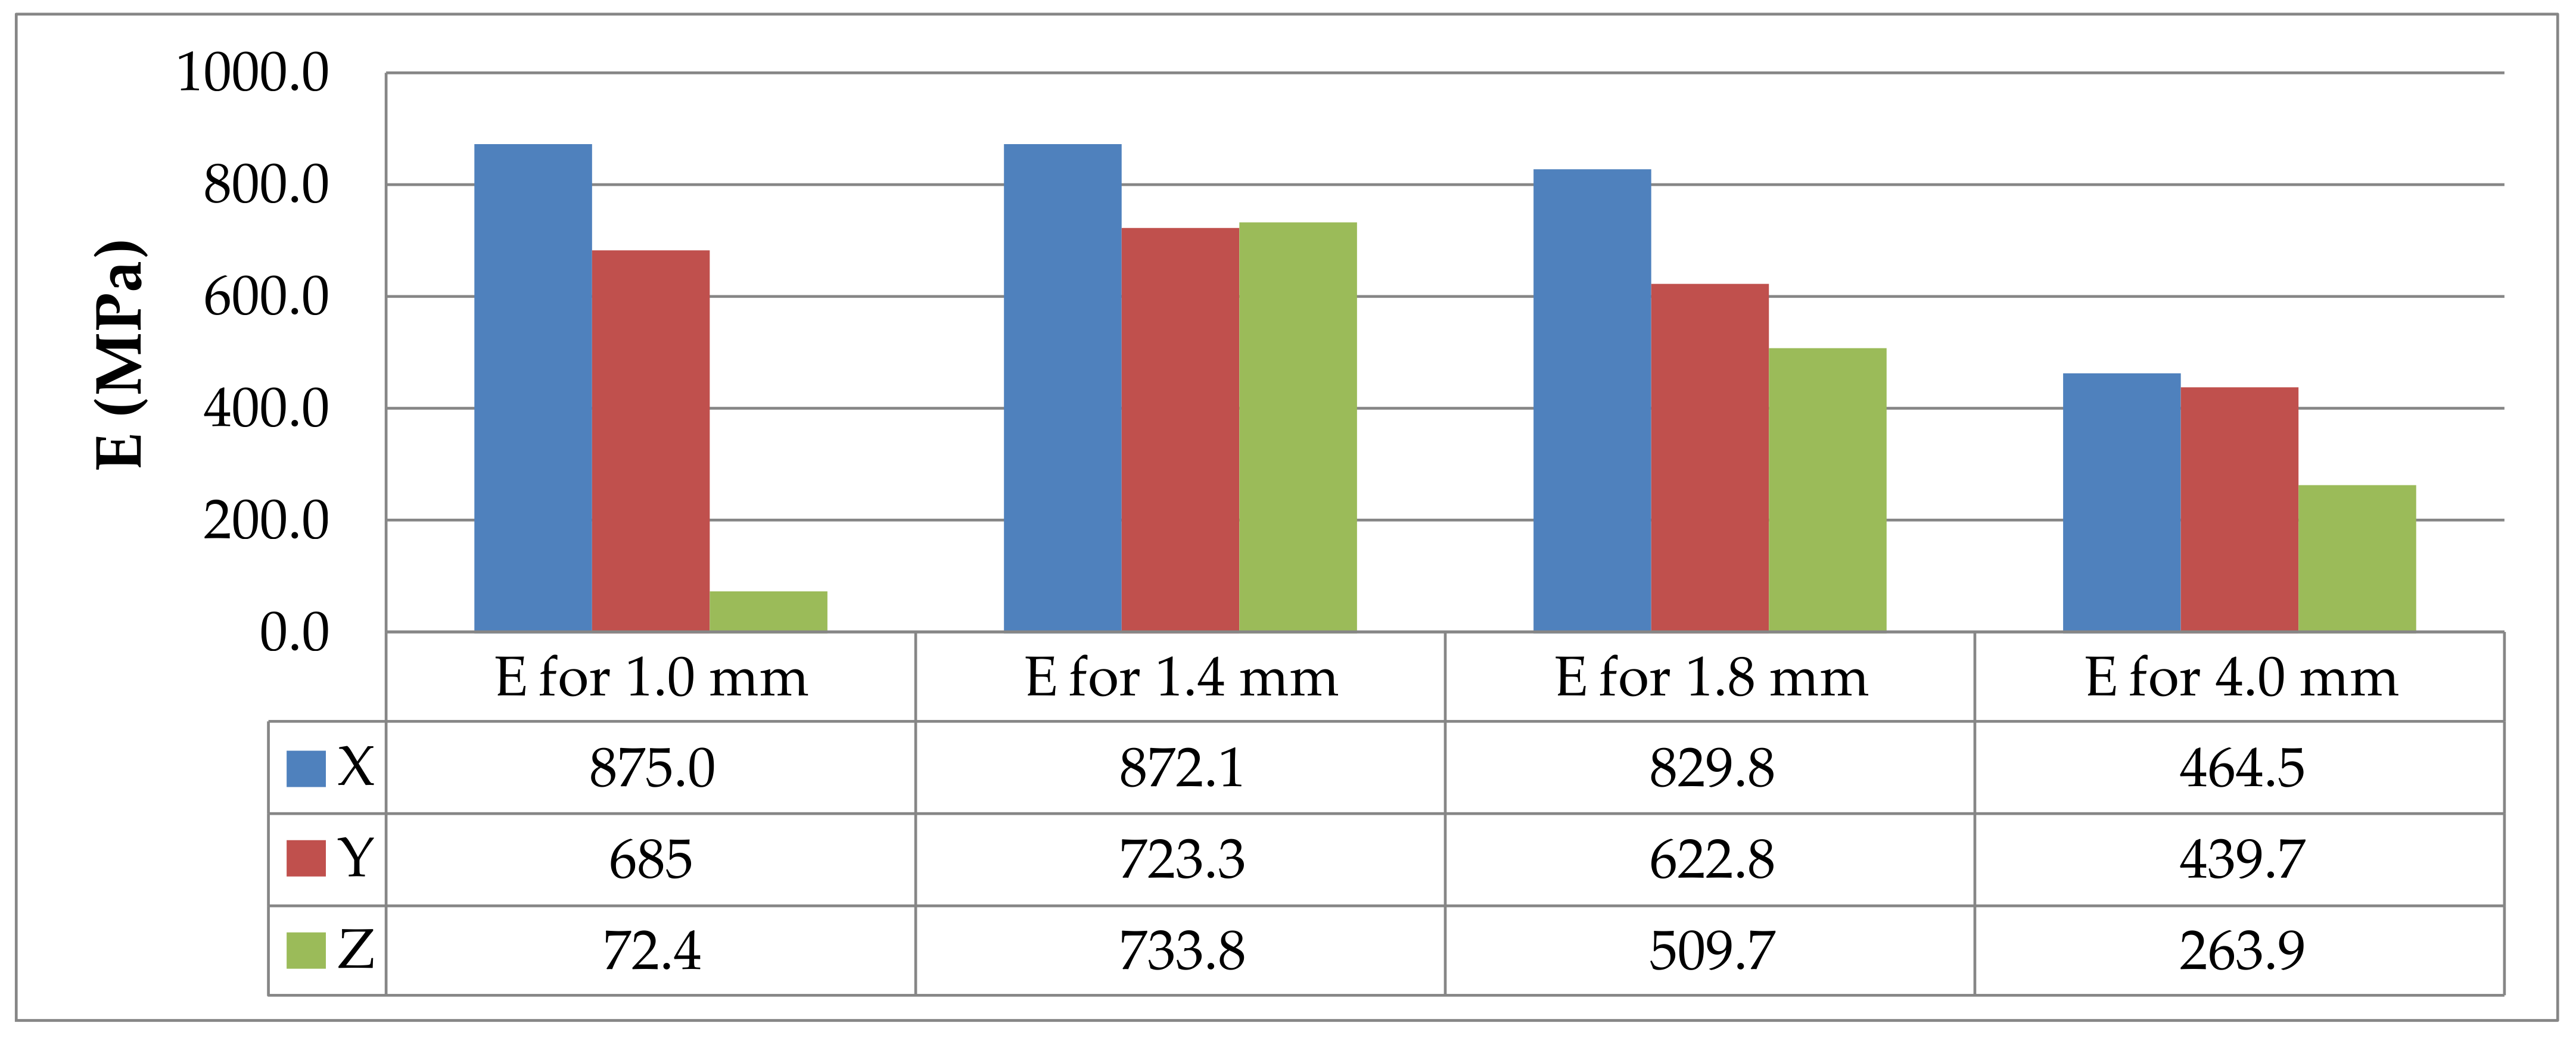
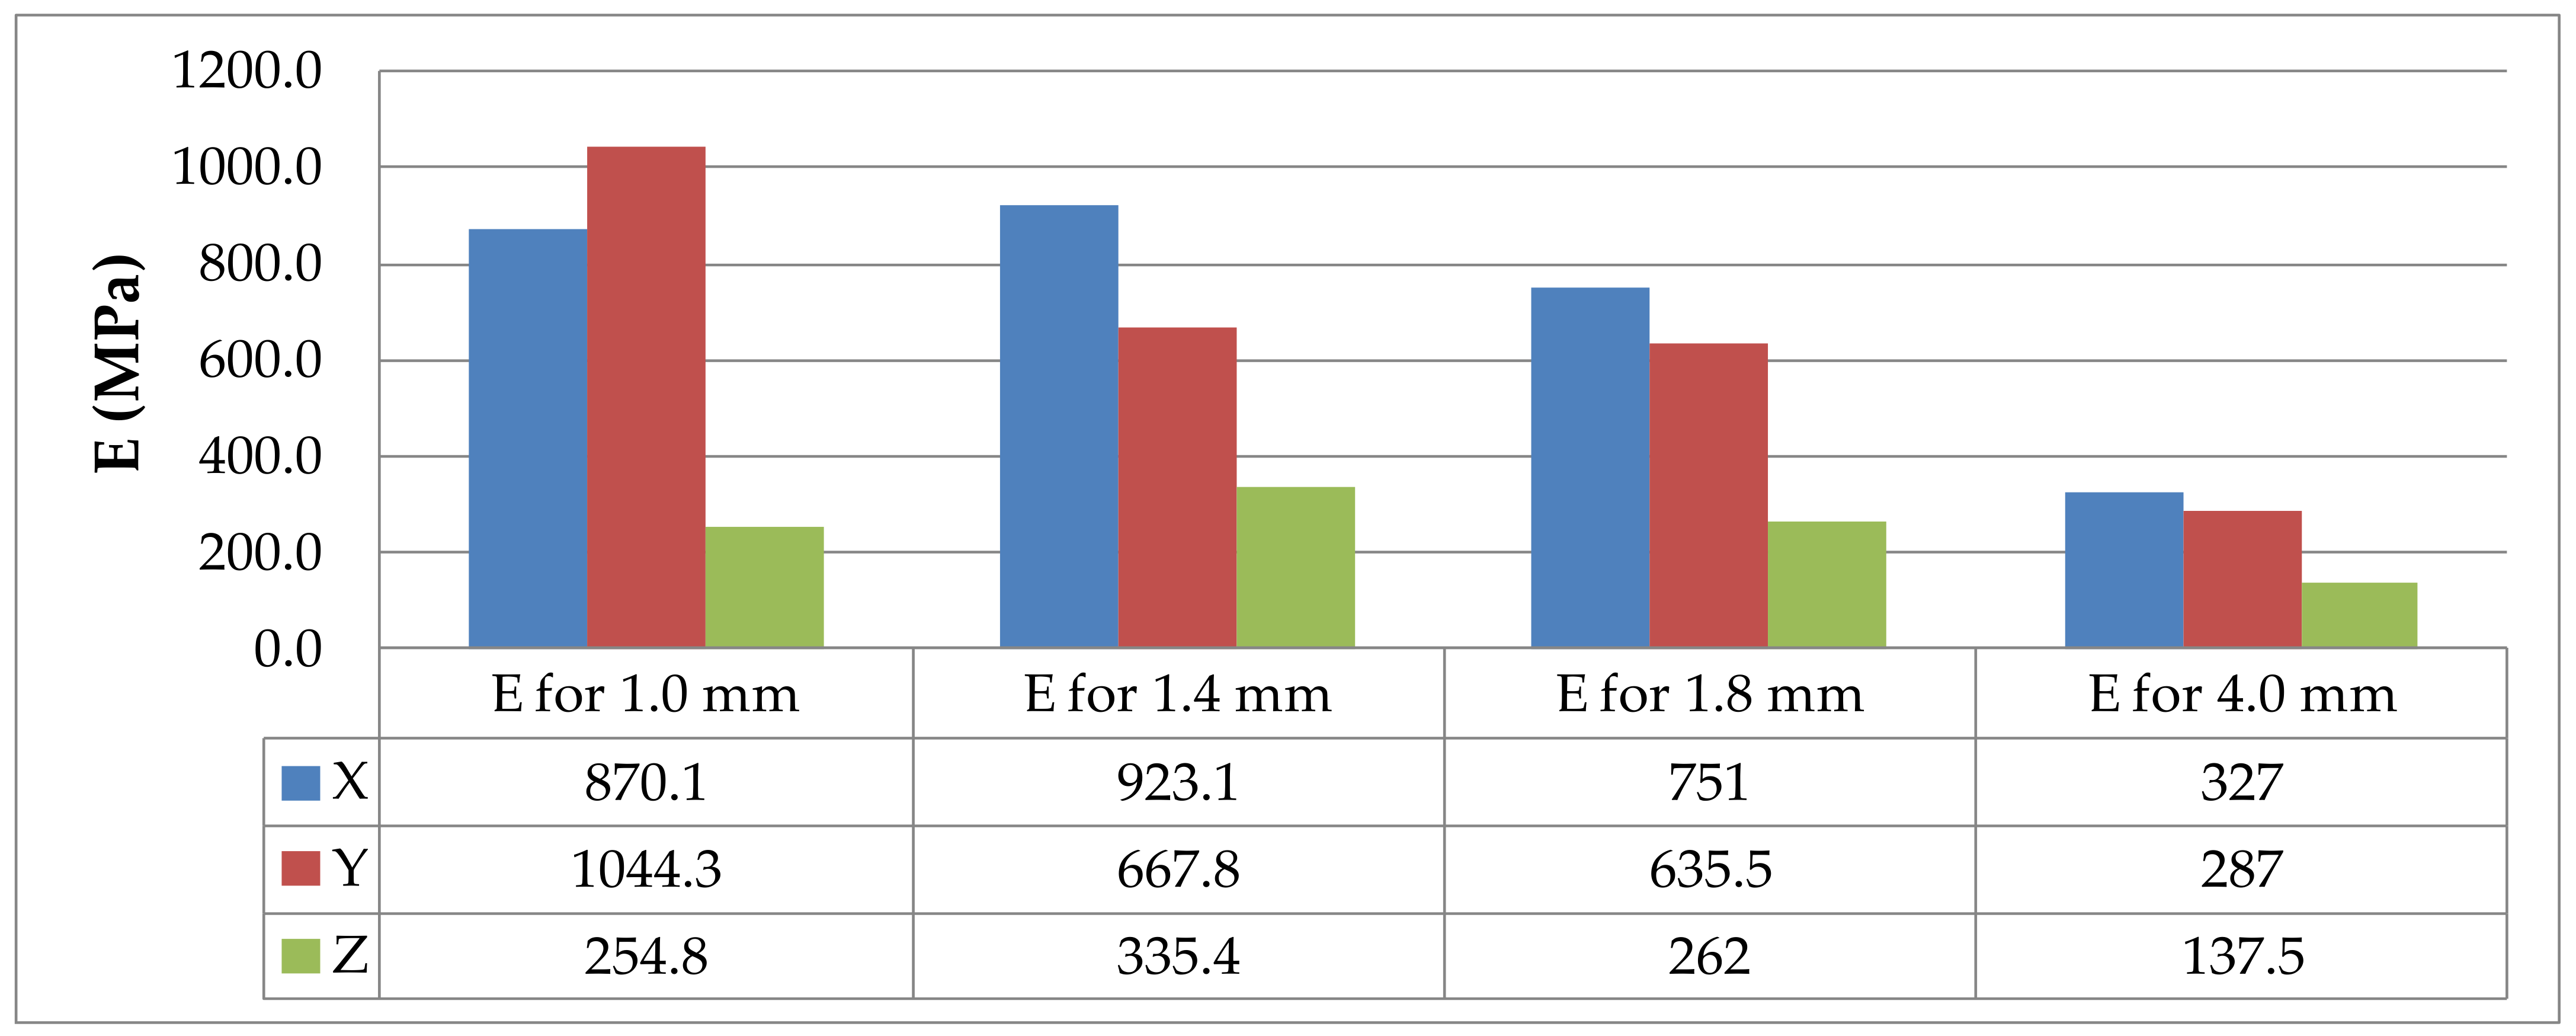
3.2. Tensile Tests
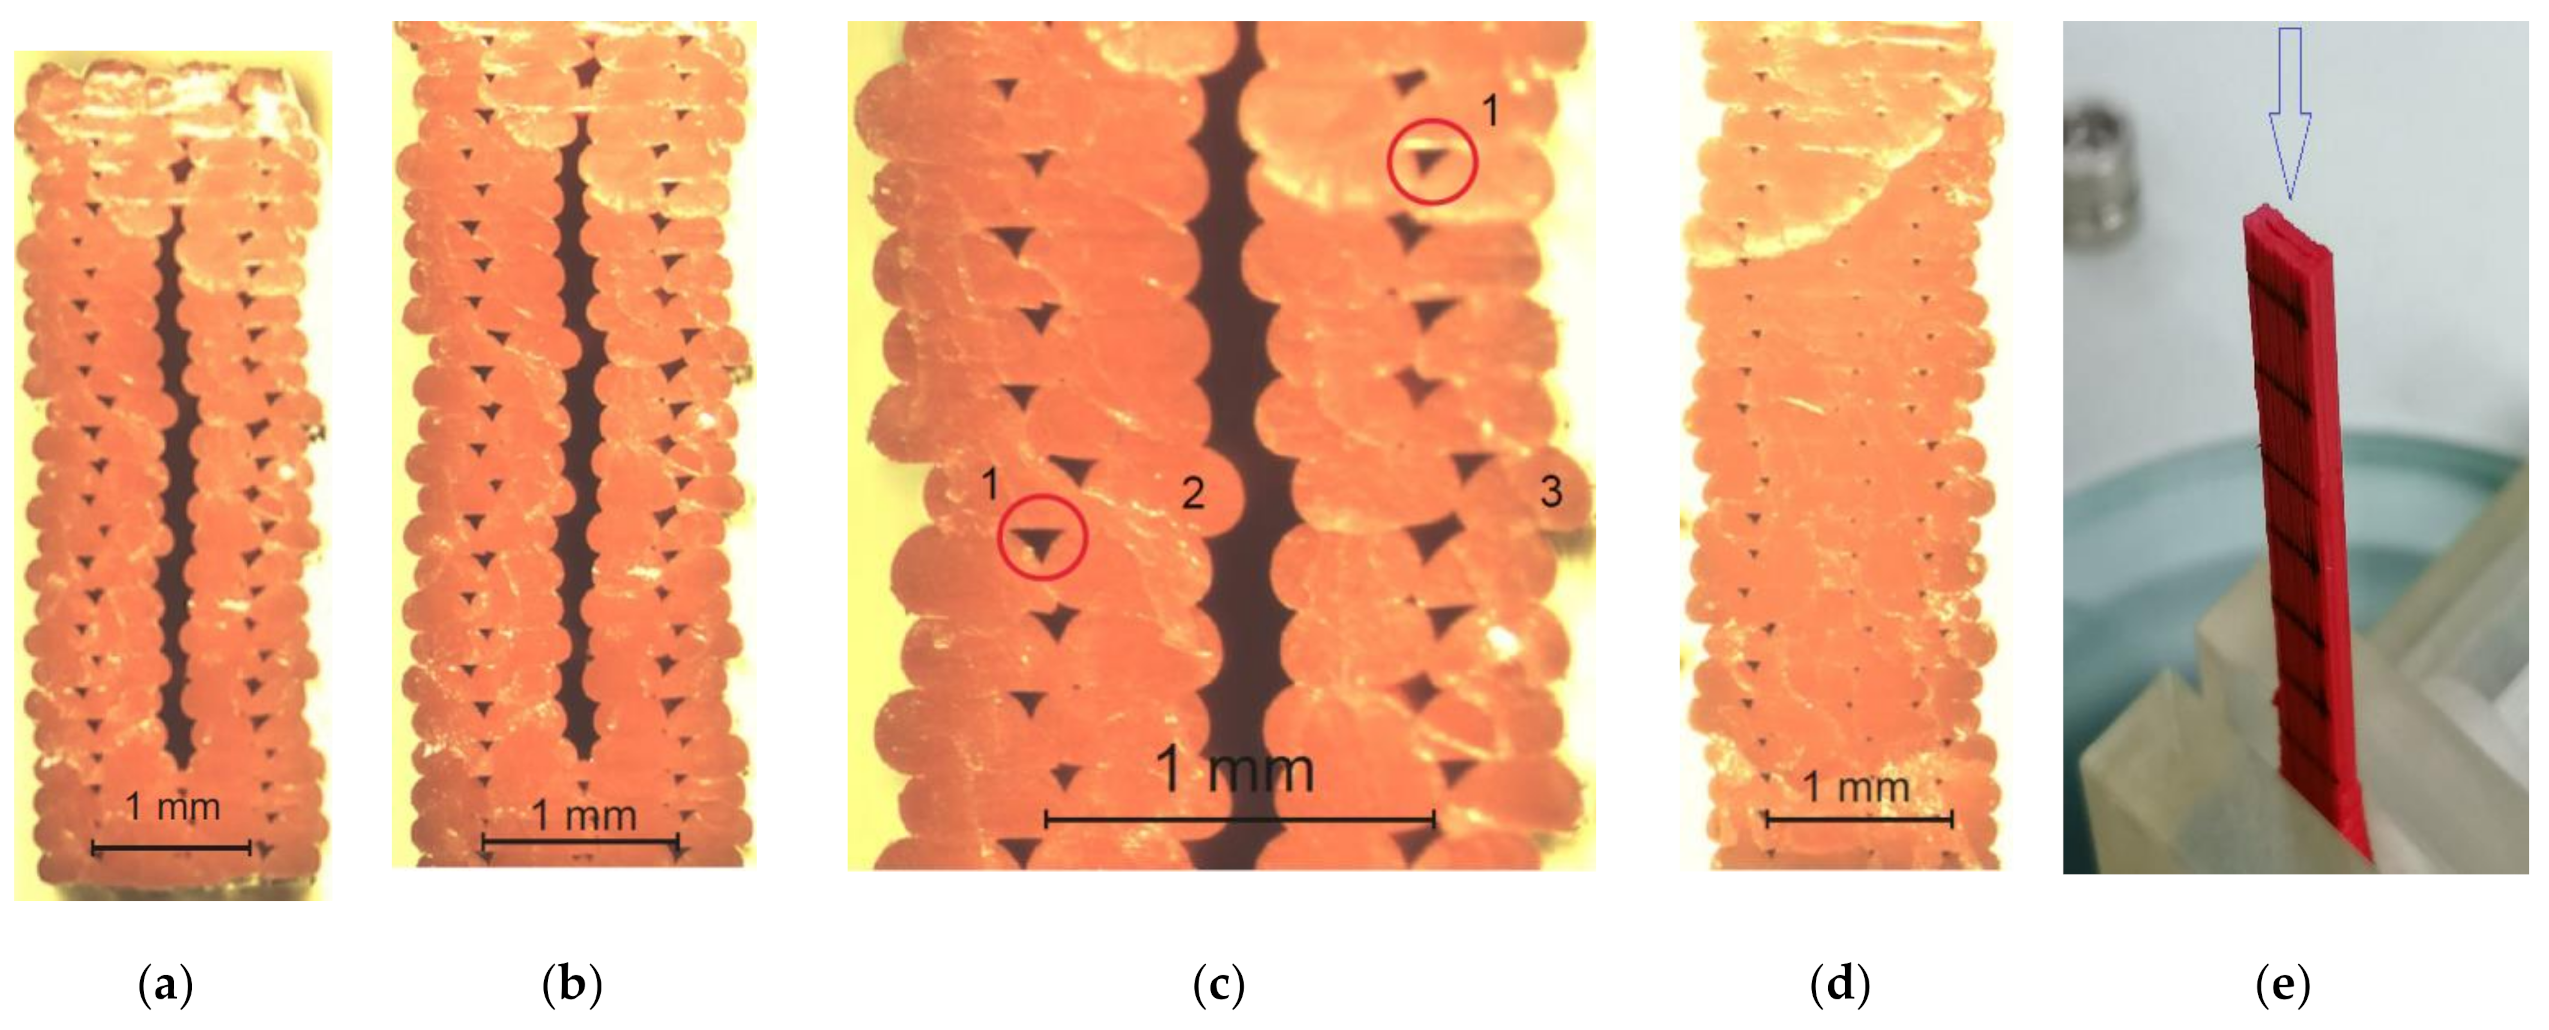
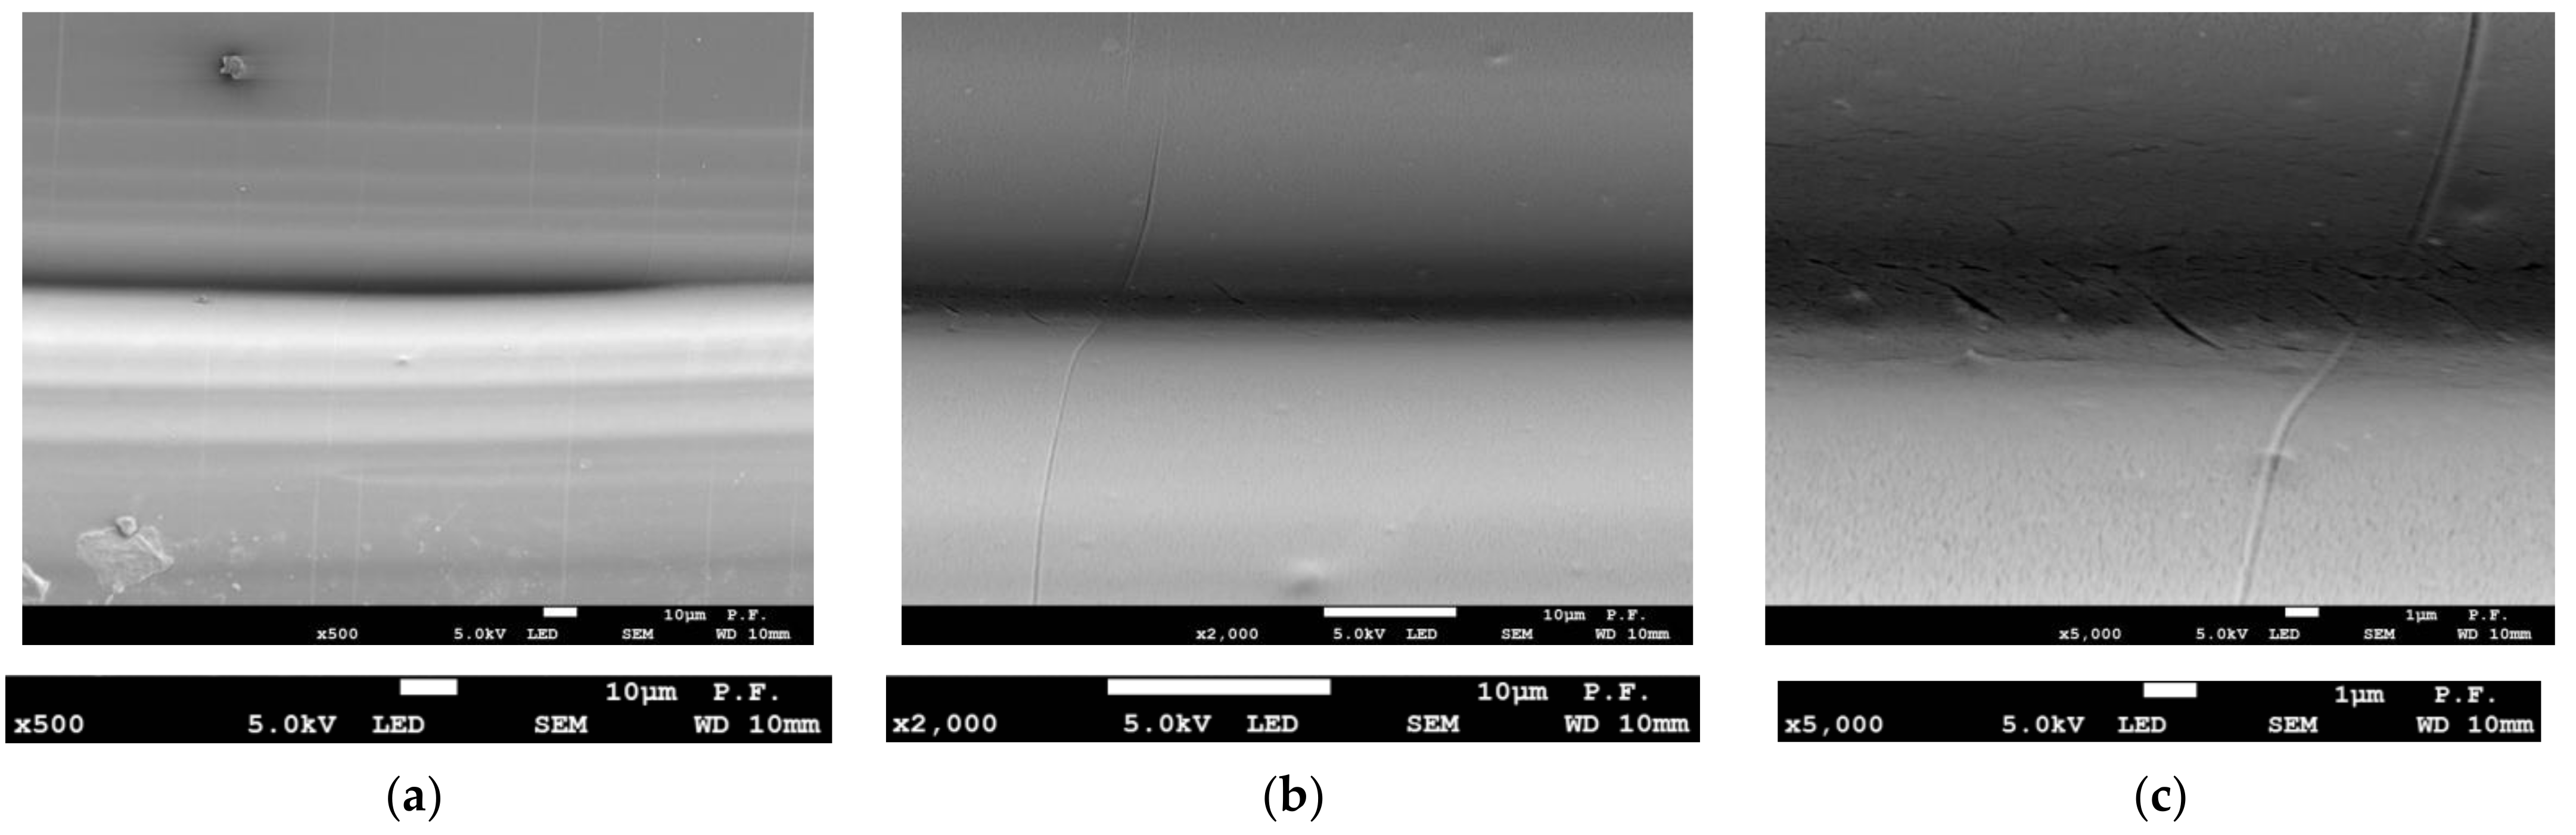
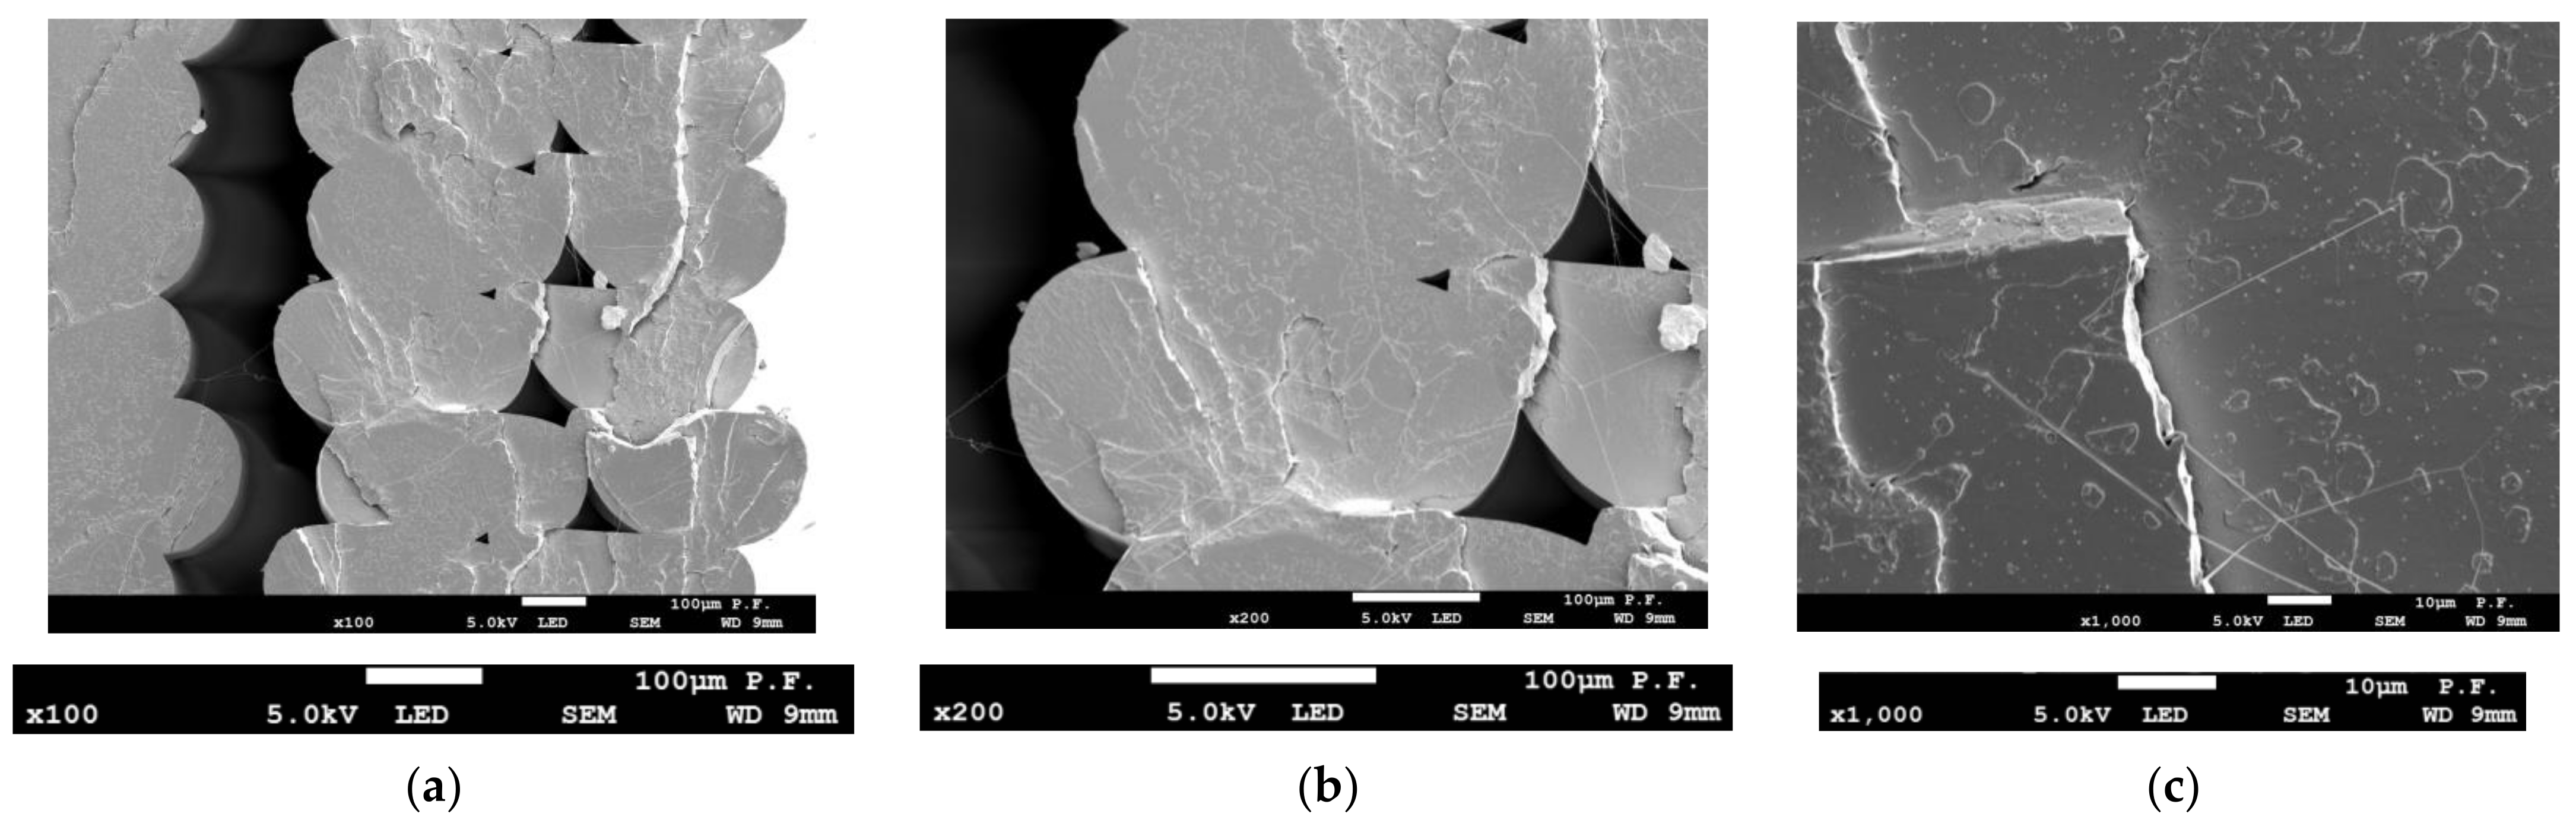
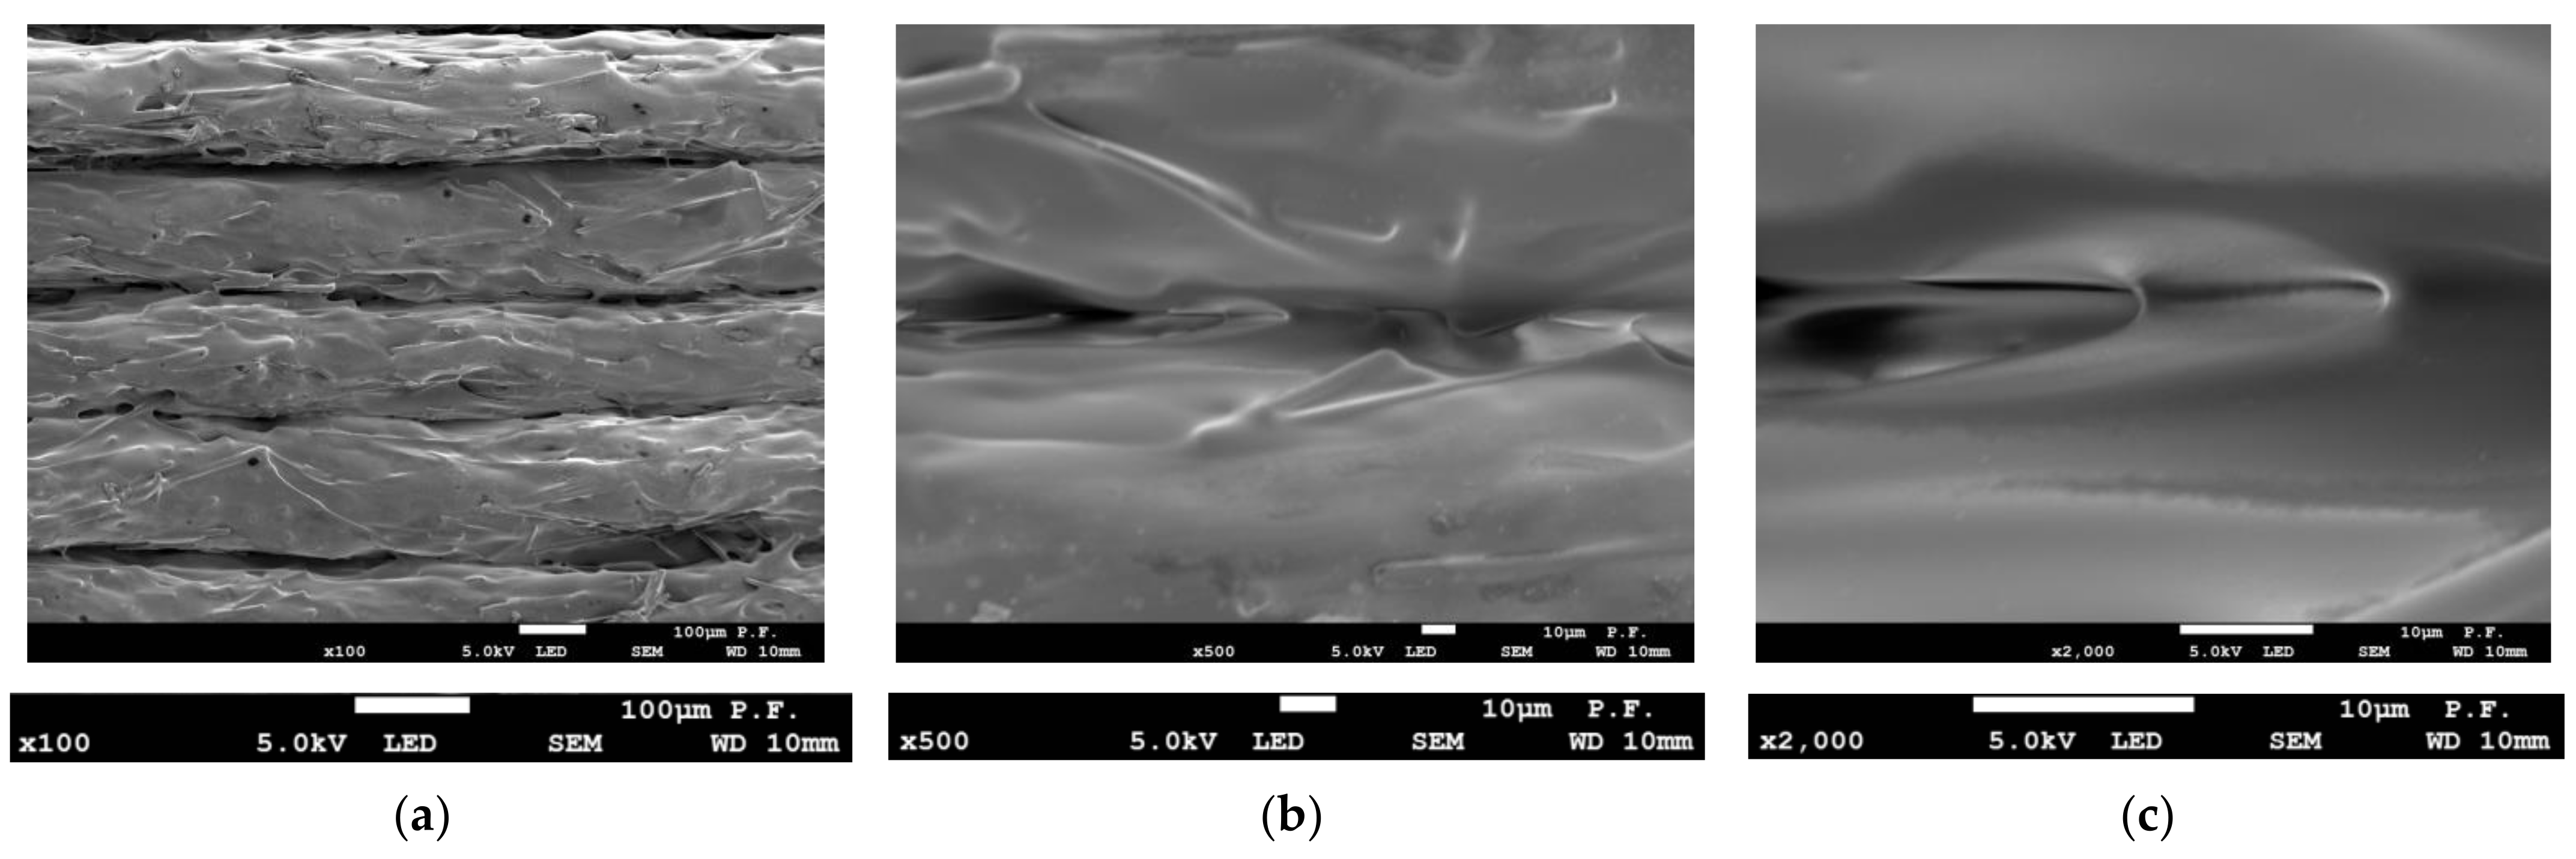
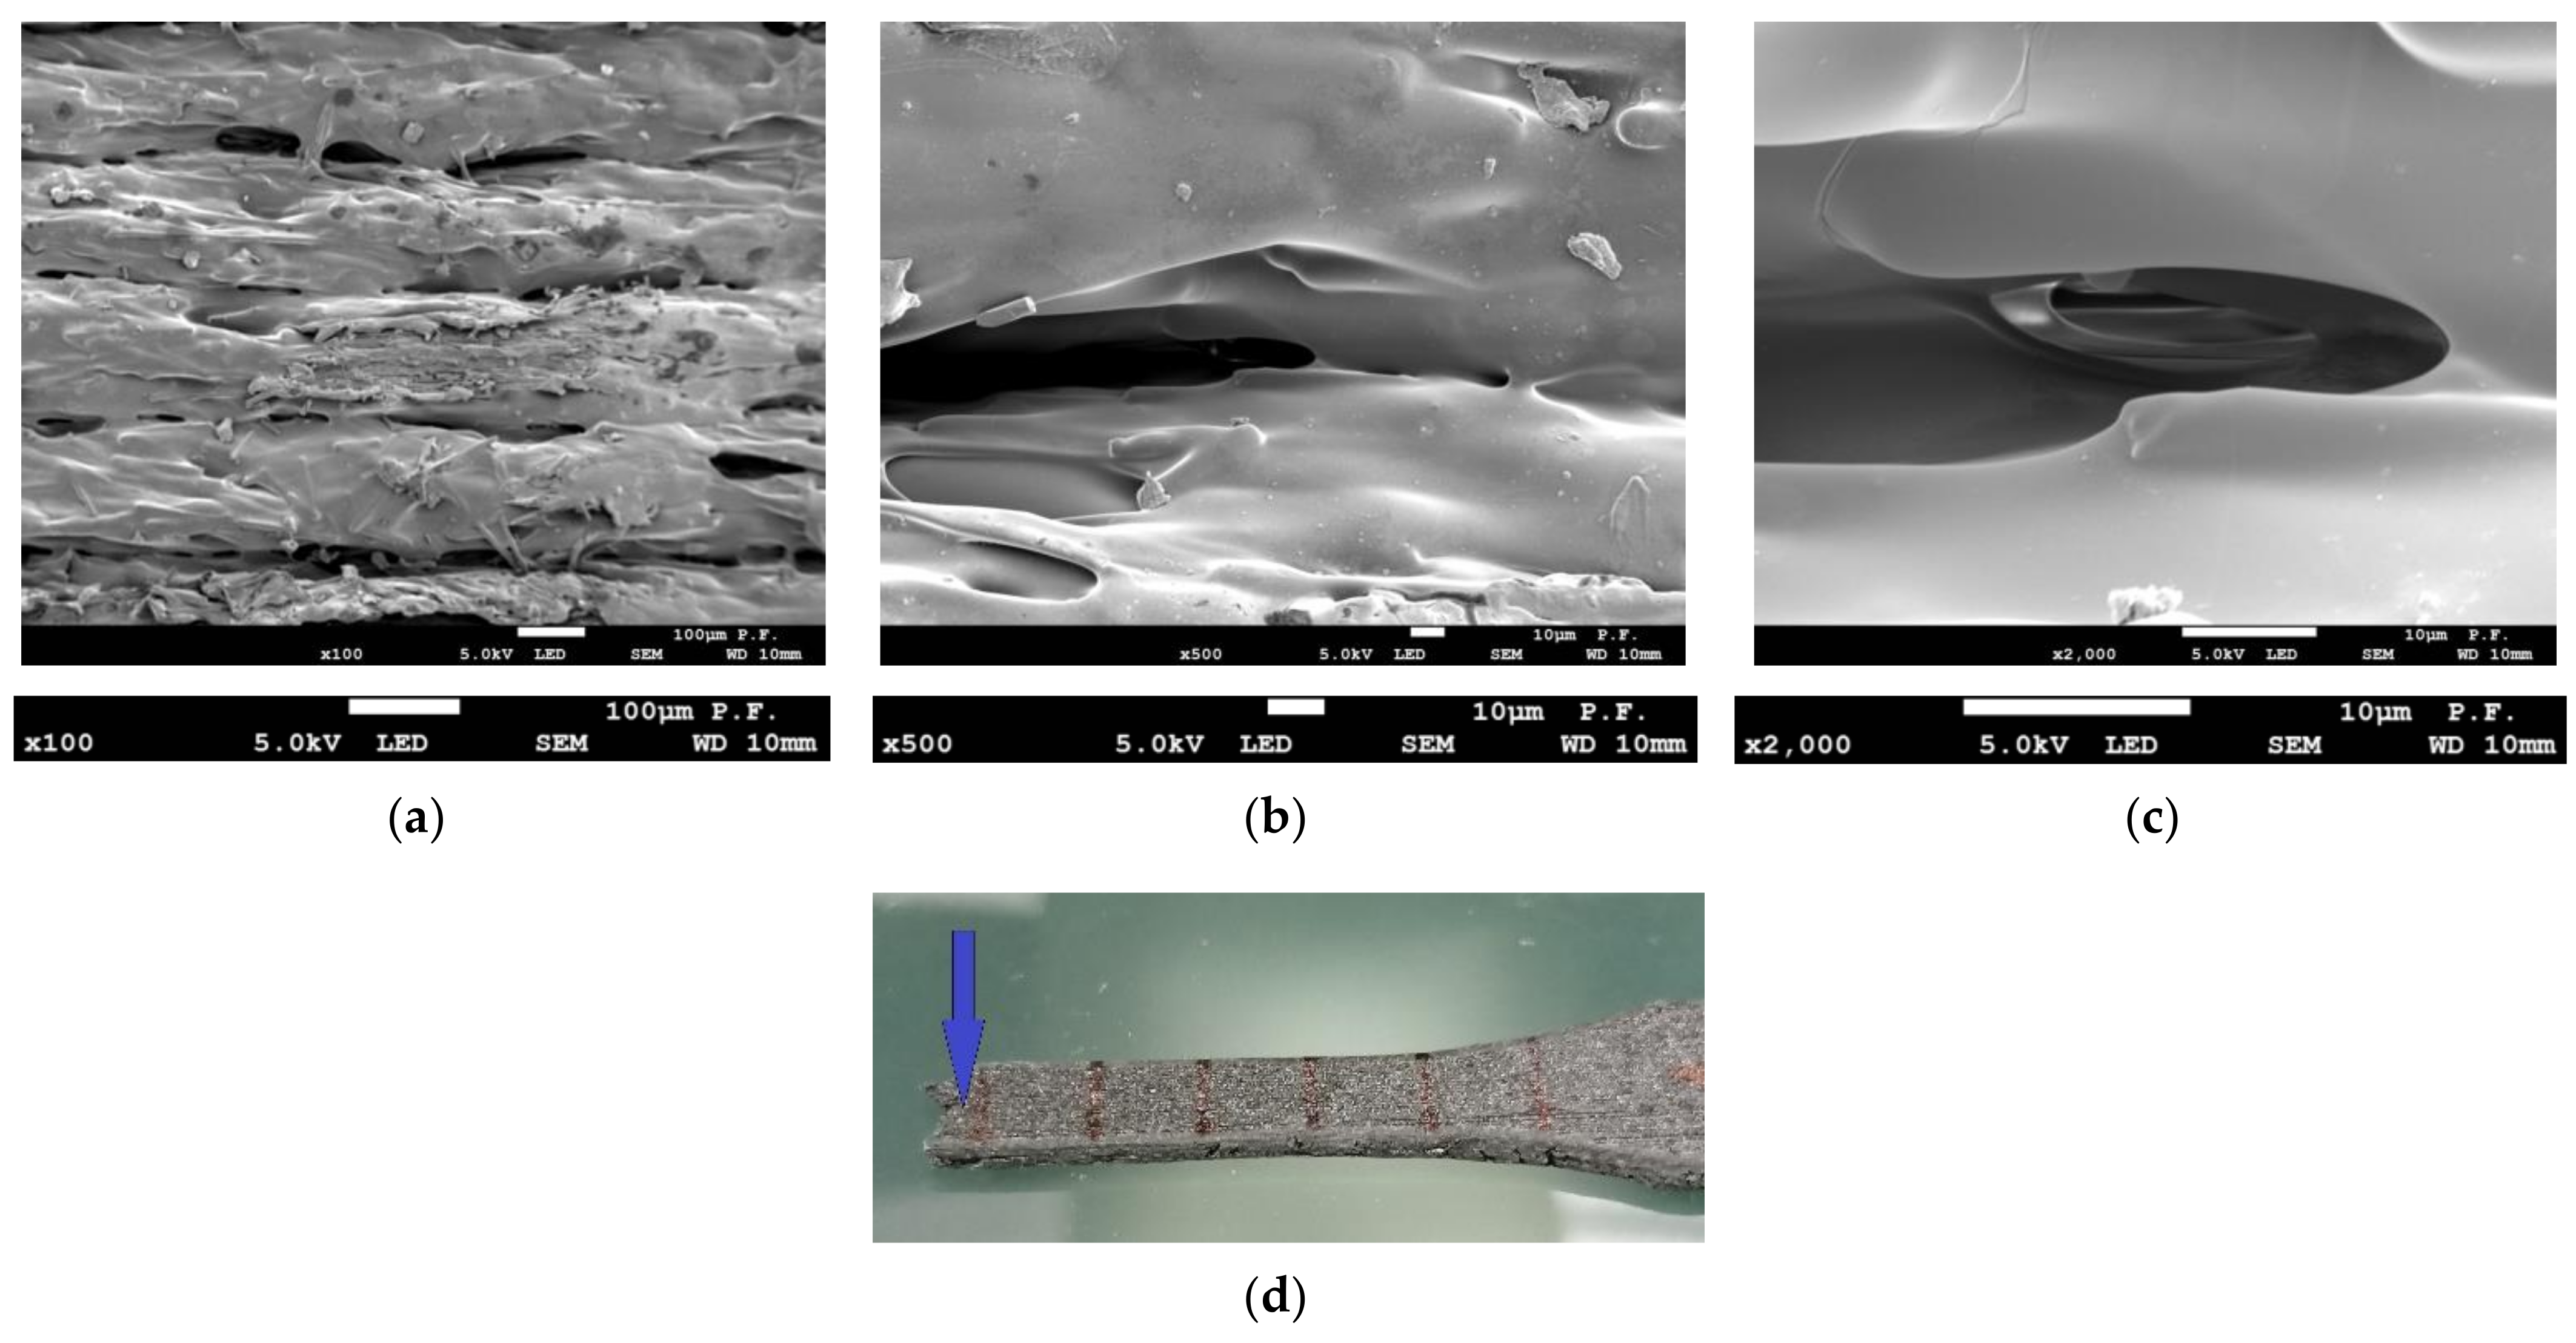
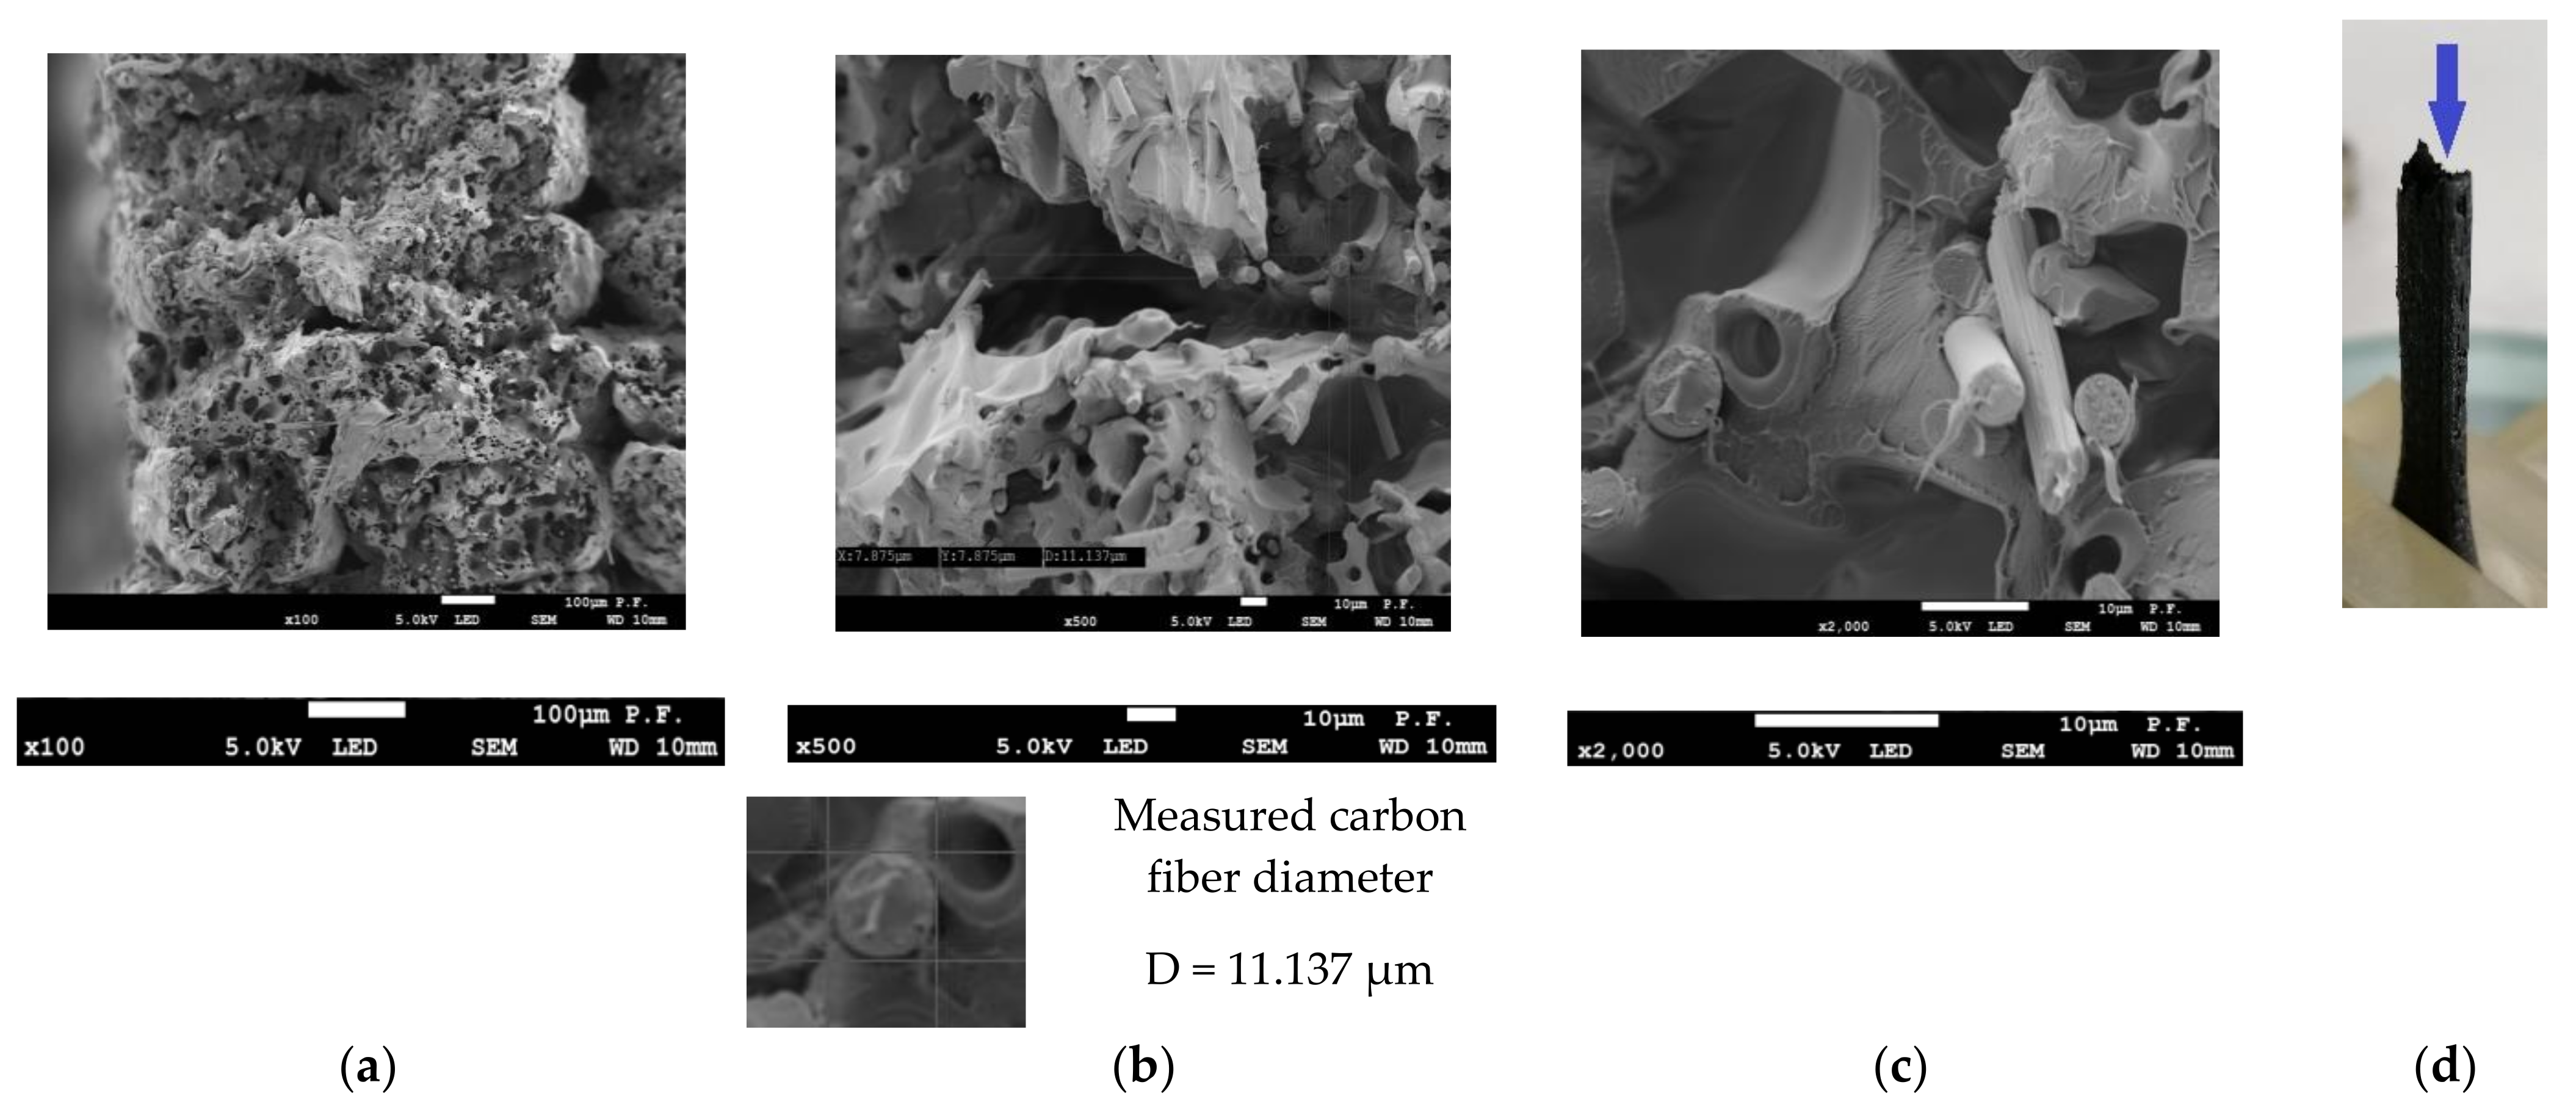
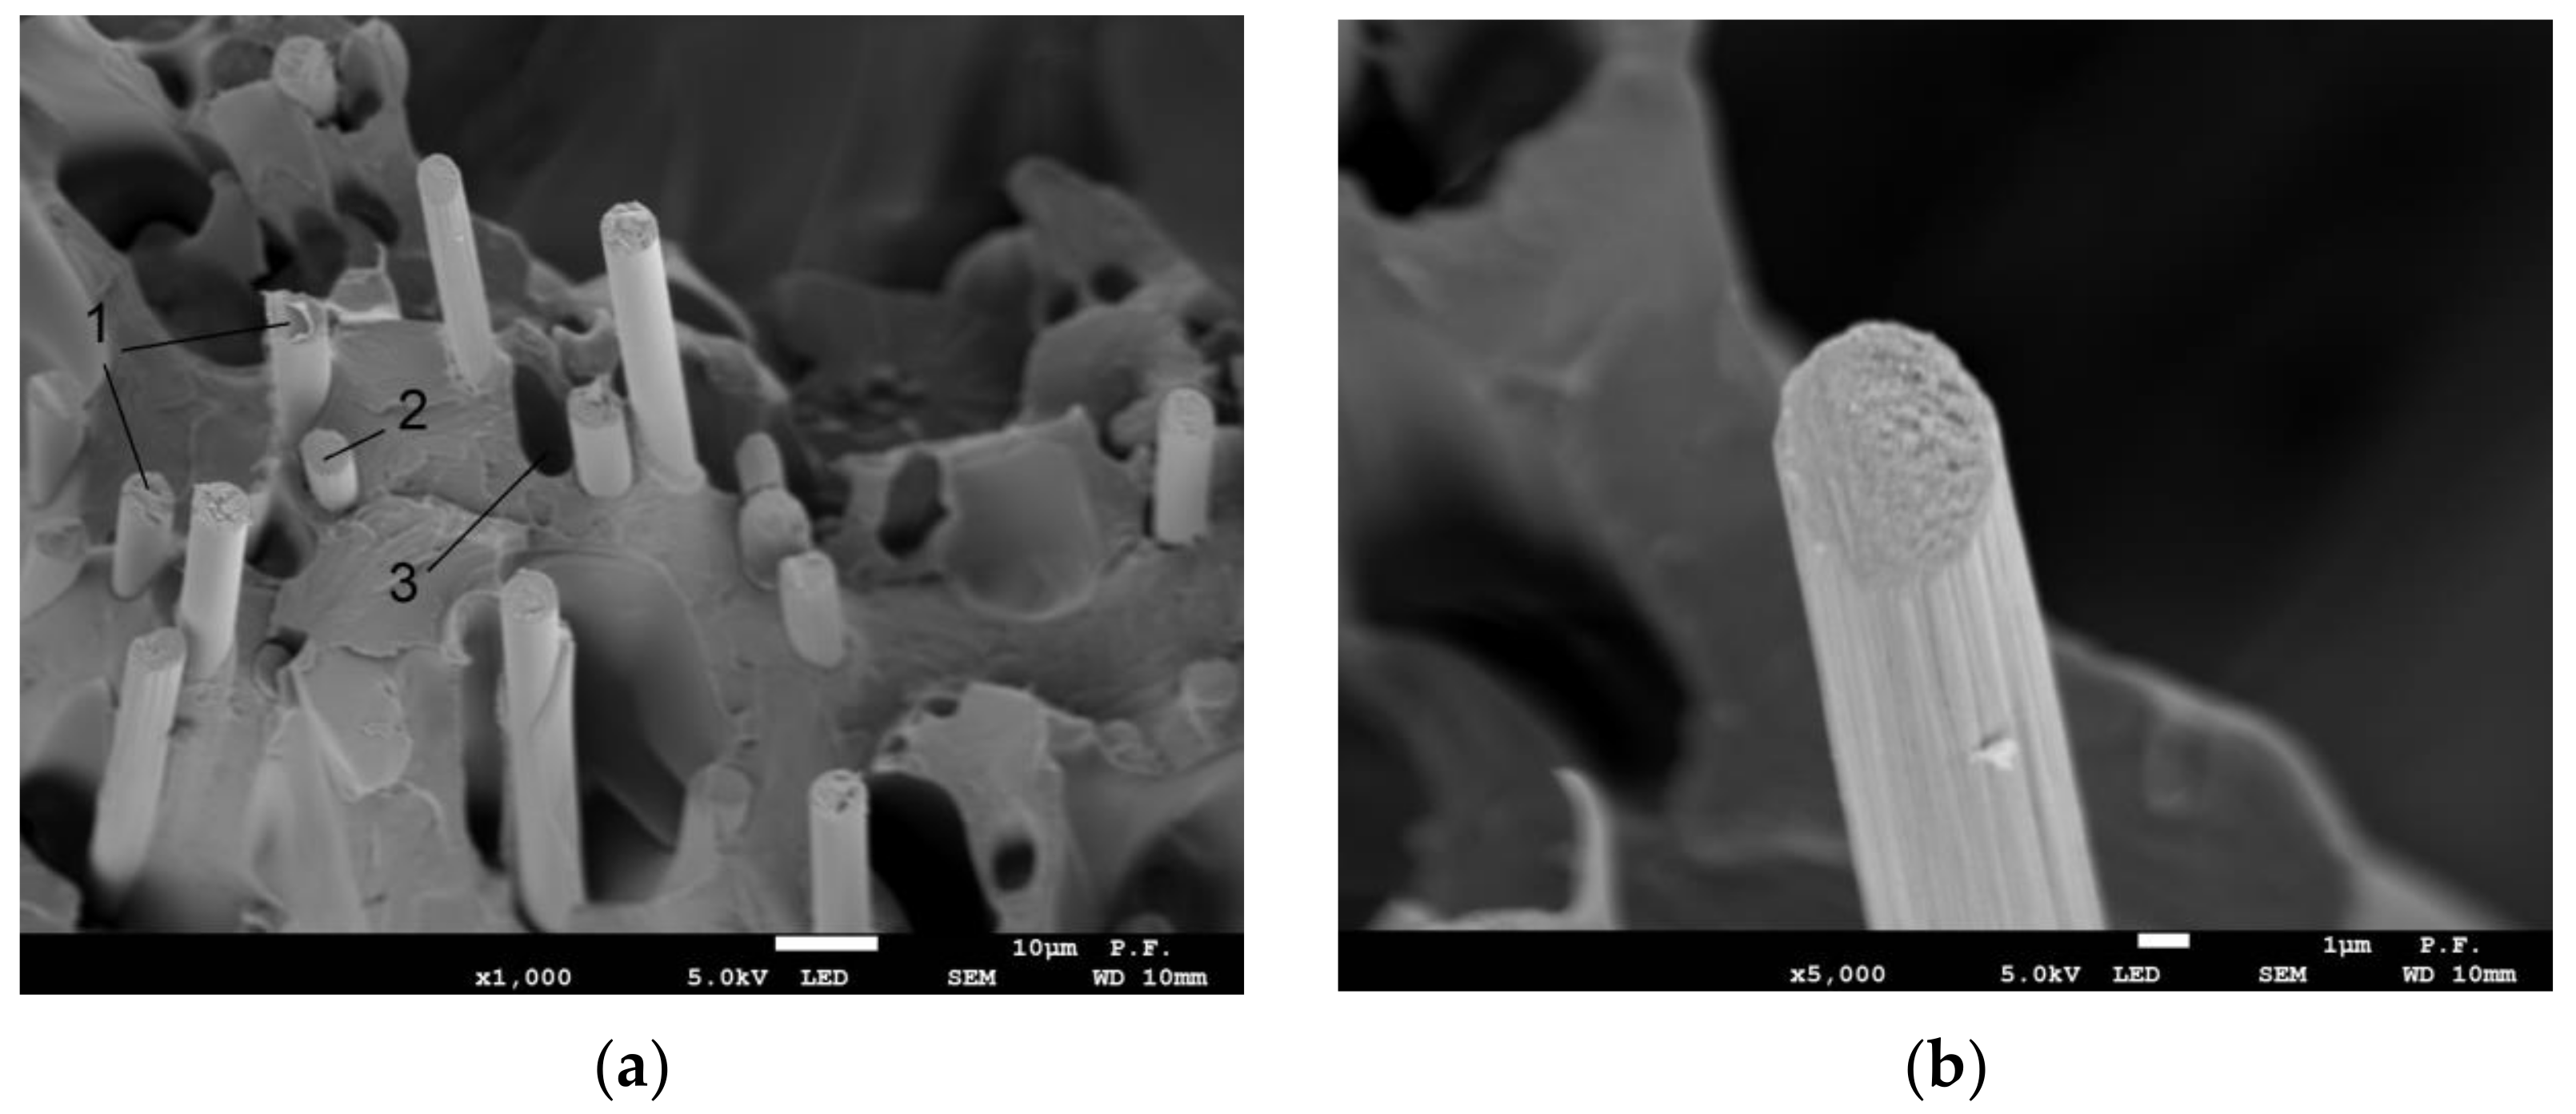
3.3. Microscopy
4. Discussion
- −
- −
- −
- the result of the specific macrostructural structure of the material produced with the 3D printing technology,
- −
- the result of the behavior of polymers described in terms of rheology by multi-parameter rheological models, e.g., the multi-parameter Maxwell–Wiechert model.
5. Conclusions
- The FDM technology has a high potential to use different materials. It is possible, for example, to modify the base material by reinforcing it with carbon fiber, which may improve or worsen the mechanical properties of the print, depending on the orientation.
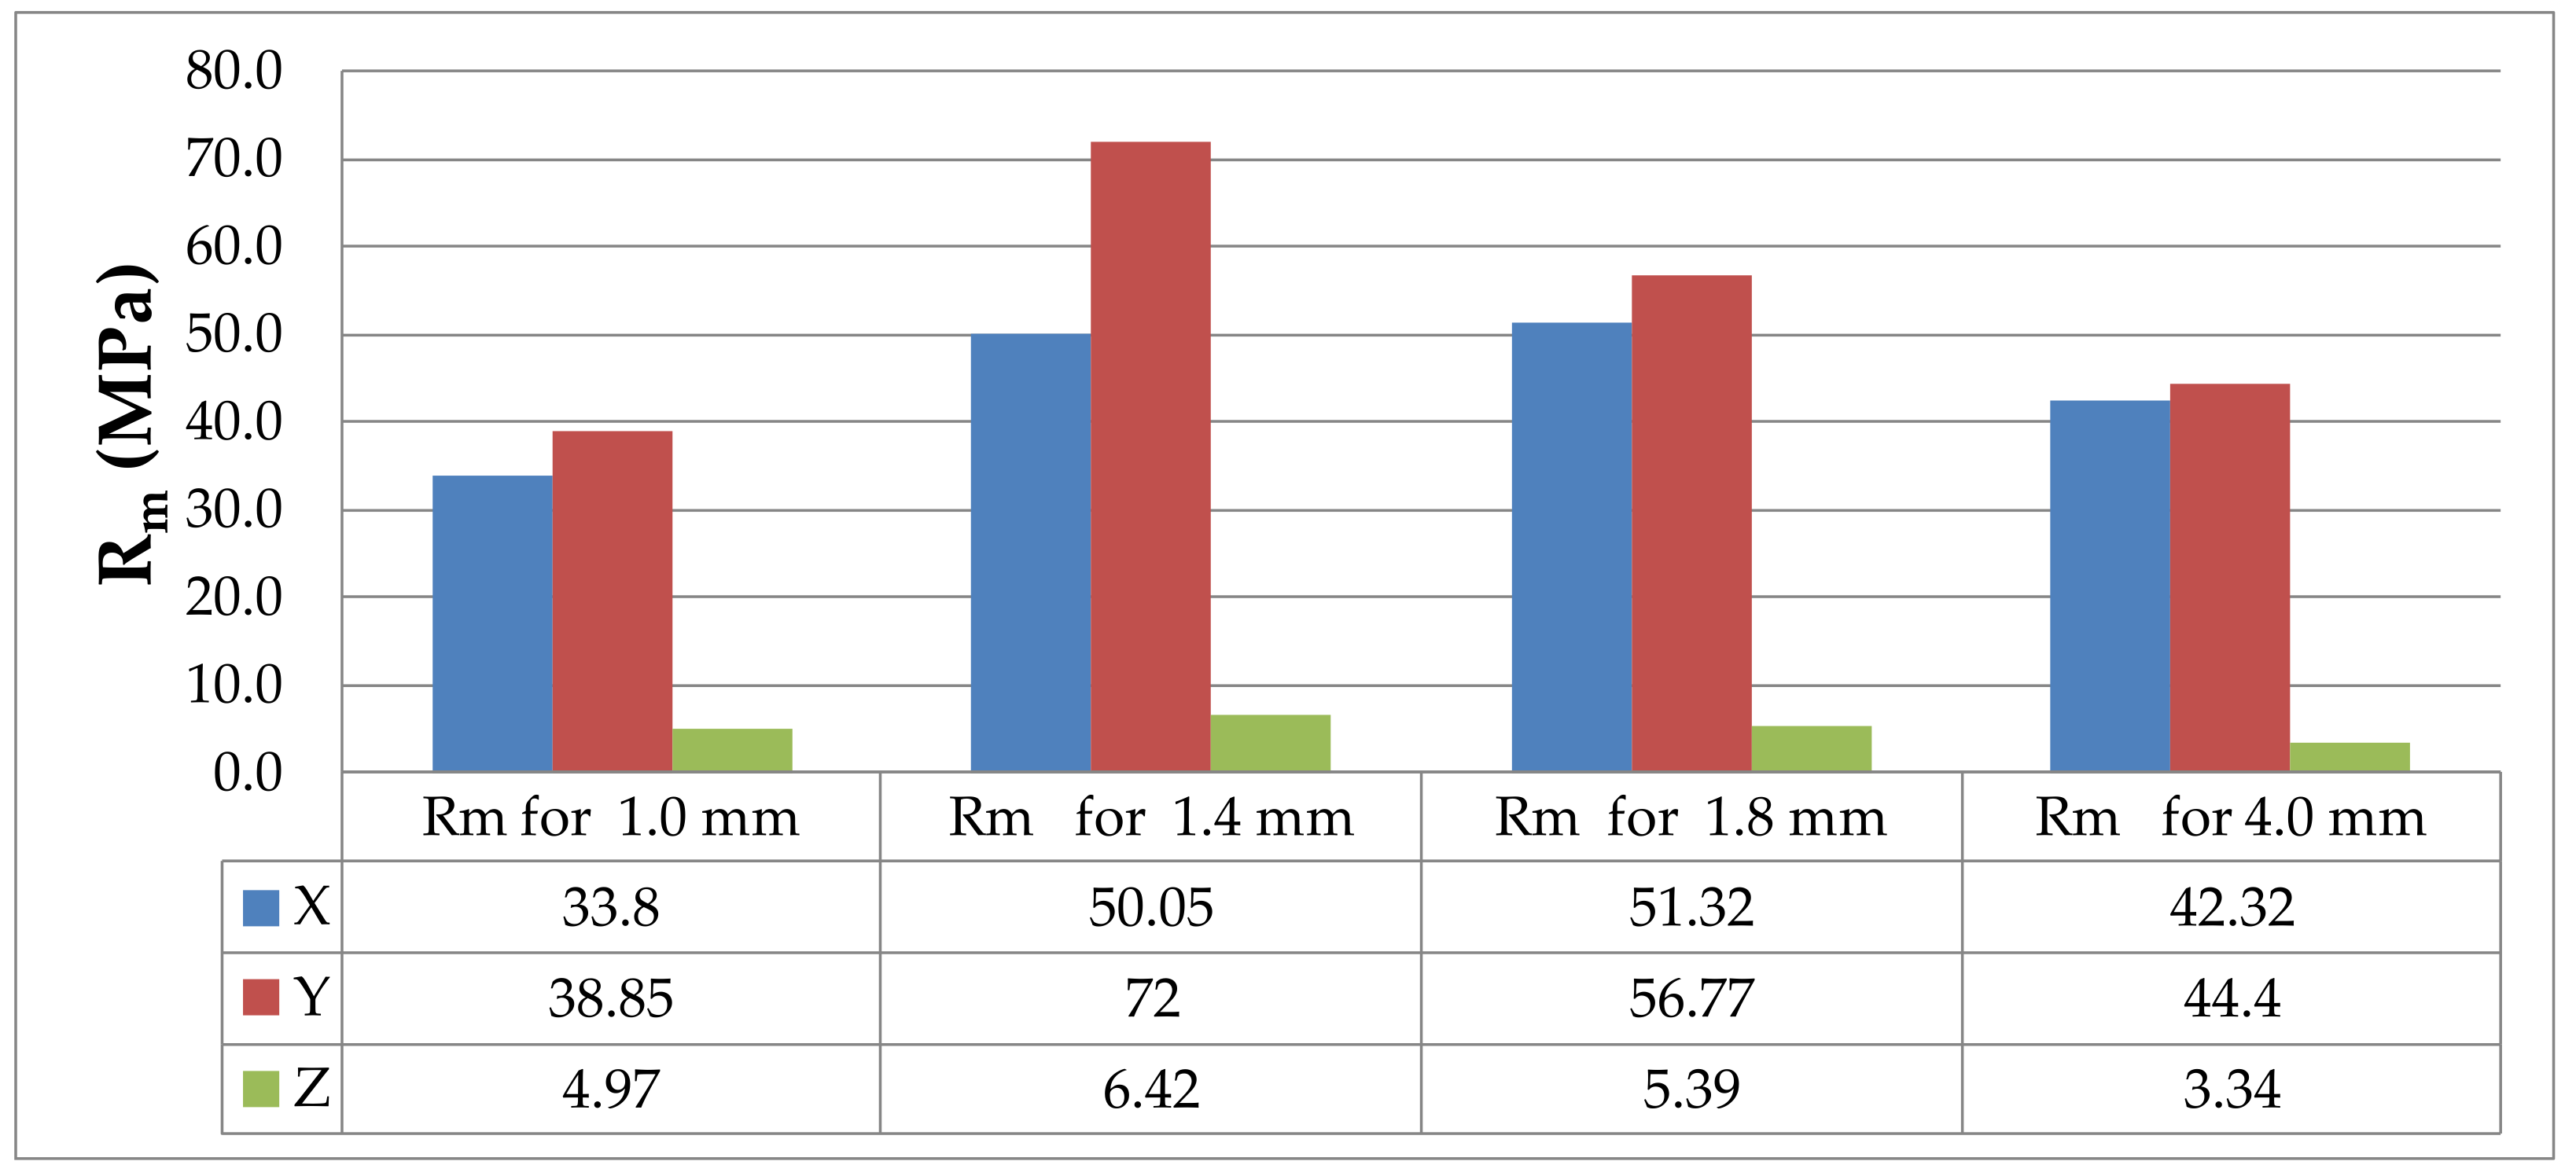
- The analysis of the mechanical properties of the thin-walled specimens showed that the tensile strength of the thinner specimens (1.0–1.8 mm in thickness) was generally much higher than that of the 4 mm reference specimens. The results can be useful to both design and manufacturing engineers as well as those dealing with the standardization of this 3D printing technology.
- The base material, PLA, has anisotropic properties; its behavior changes depending on the print orientation. This observation is important because when carbon fiber is used, the composite, i.e., PLA-CF, becomes a typical orthotropic material.
- The research results presented here can be used in future studies on the FDM printing method to further reduce the number and size of voids and gaps and to modify the base material by adding different components, e.g., carbon fiber.
- It is vital to properly match the printing parameters to the material used. The printer and the software used in the study were suitable for the purpose.
- The infill density parameter was found to be responsible not only for the amount of material used on the inside of the object printed but also for the presence of voids and gaps contributing to the material degradation when under tension. Furthermore, there were microckracks in the bonding zone along the direction of the maximum tangential stress, which also led to the material degradation when loaded.
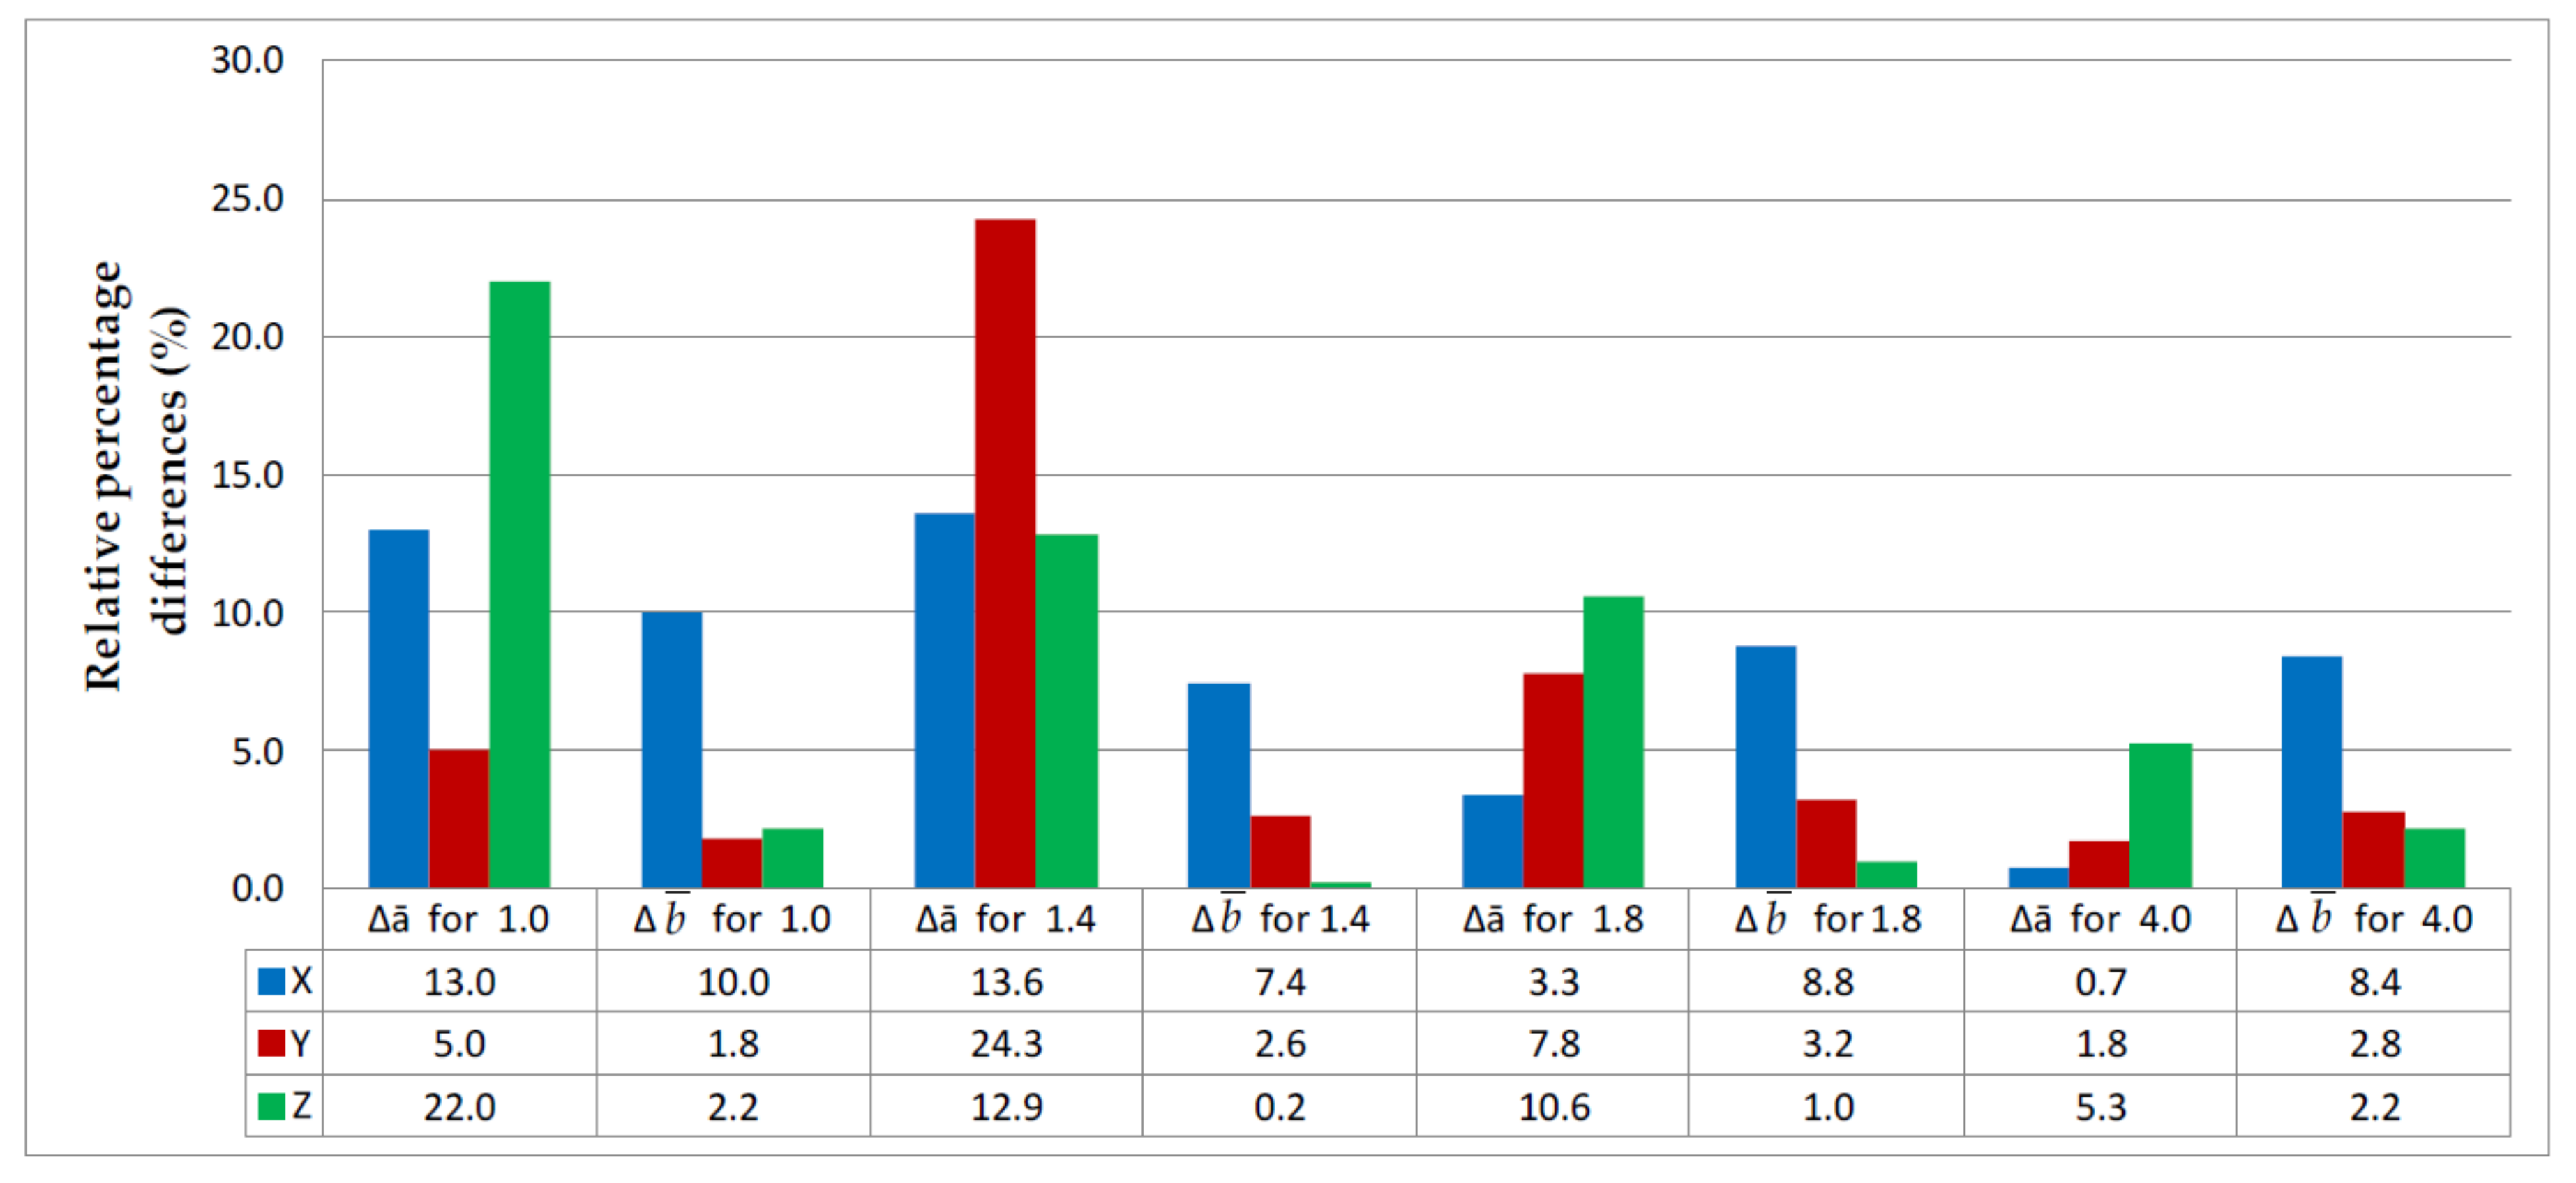
- The test results show that the elasticity modulus of thin-walled models varies depending on the printing direction and the specimen thickness. This relationship was particularly visible for the thinnest specimens, i.e., those 1 mm in thickness.
Author Contributions
Funding
Institutional Review Board Statement
Informed Consent Statement
Data Availability Statement
Acknowledgments
Conflicts of Interest
References
- Zmarzły, P.; Kozior, T.; Gogolewski, D. Dimensional and shape accuracy of foundry patterns fabricated through photo-curing. Teh. Vjesn. Tech. Gaz. 2019, 26, 1576–1584. [Google Scholar] [CrossRef]
- Hon, K.; Gill, T. Selective laser sintering of SiC/Polyamide composites. CIRP Ann. 2003, 52, 173–176. [Google Scholar] [CrossRef]
- Gibson, I.; Shi, D. Material properties and fabrication parameters in selective laser sintering process. Rapid Prototyp. J. 1997, 3, 129–136. [Google Scholar] [CrossRef]
- Pan, R.; Yang, L.; Zheng, L.; Hao, L.; Li, Y. Microscopic morphology, thermodynamic and mechanical properties of thermoplastic polyurethane fabricated by selective laser sintering. Mater. Res. Express 2020, 7, 055301. [Google Scholar] [CrossRef]
- Pagáč, M.; Hajnyš, J.; Malotová, Š.; Zlámal, T.; Petrů, J. The influence of the laser power on the utility properties of the surface roughness parameter of the overhangs during the slm proces. In Proceedings of the 27th International Conference on Metallurgy and Materials, Brno, Czech Republic, 23–25 May 2018; pp. 814–819. [Google Scholar]
- Nowakowski, L.; Miko, E.; Skrzyniarz, M. Designation of the minimum thickness of machined layer for the milling process of duralumin PA6. In Proceedings of the 23rd International Conference of Engineering Mechanics, Svratka, Czech Republic, 15–18 May 2017; pp. 722–725. [Google Scholar]
- Fafenrot, S.; Grimmelsmann, N.; Wortmann, M.; Ehrmann, A. Three-dimensional (3D) printing of polymer-metal hybrid materials by fused deposition modeling. Materials 2017, 10, 1199. [Google Scholar] [CrossRef] [PubMed] [Green Version]
- Richter, C.; Schmülling, S.; Ehrmann, A.; Finsterbusch, K. FDM printing of 3D forms with embedded fibrous materials. In Design, Manufacturing and Mechatronics, Proceedings of the 2015 International Conference on Design, Manufacturing and Mechatronics (ICDMM2015), Wuhan, China, 17–18 April 2015; Shahhosseini, A.M., Ed.; World Scientific: Singapore, 2015; pp. 961–969. ISBN 978-981-4730-50-1. [Google Scholar]
- Gogolewski, D.; Bartkowiak, T.; Kozior, T.; Zmarzły, P. Multiscale analysis of surface texture quality of models manufactured by laser powder-bed fusion technology and machining from 316L steel. Materials 2021, 14, 2794. [Google Scholar] [CrossRef]
- Liu, Z.; Wang, Y.; Wu, B.; Cui, C.; Guo, Y.; Yan, C. A critical review of fused deposition modeling 3D printing technology in manufacturing polylactic acid parts. Int. J. Adv. Manuf. Technol. 2019, 102, 2877–2889. [Google Scholar] [CrossRef]
- Chen, Q.; Boisse, P.; Park, C.H.; Saouab, A.; Bréard, J. Intra/inter-ply shear behaviors of continuous fiber reinforced thermoplastic composites in thermoforming processes. Compos. Struct. 2011, 93, 1692–1703. [Google Scholar] [CrossRef]
- Allum, J.; Gleadall, A.; Silberschmidt, V.V. Fracture of 3D-printed polymers: Crucial role of filament-scale geometric features. Eng. Fract. Mech. 2020, 224, 106818. [Google Scholar] [CrossRef]
- Tronvoll, S.A.; Vedvik, N.P.; Elverum, C.W.; Welo, T. A new method for assessing anisotropy in fused deposition modeled parts using computed tomography data. Int. J. Adv. Manuf. Technol. 2019, 105, 47–65. [Google Scholar] [CrossRef] [Green Version]
- Kozior, T.; Mamun, A.; Trabelsi, M.; Sabantina, L.; Ehrmann, A. Quality of the surface texture and mechanical properties of FDM printed samples after thermal and chemical treatment. Stroj. Vestn. J. Mech. Eng. 2020, 105–113. [Google Scholar] [CrossRef] [Green Version]
- Saad, M.S.; Nor, A.M.; Baharudin, M.E.; Zakaria, M.Z.; Aiman, A. Optimization of surface roughness in FDM 3D printer using response surface methodology, particle swarm optimization, and symbiotic organism search algorithms. Int. J. Adv. Manuf. Technol. 2019, 105, 5121–5137. [Google Scholar] [CrossRef]
- Turek, P.; Budzik, G.; Sęp, J.; Oleksy, M.; Józwik, J.; Przeszłowski, Ł.; Paszkiewicz, A.; Kochmański, Ł.; Żelechowski, D. An analysis of the casting polymer mold wear manufactured using PolyJet method based on the measurement of the surface topography. Polymers 2020, 12, 3029. [Google Scholar] [CrossRef]
- Kousiatza, C.; Tzetzis, D.; Karalekas, D. In-situ characterization of 3D printed continuous fiber reinforced composites: A methodological study using fiber Bragg grating sensors. Compos. Sci. Technol. 2019, 174, 134–141. [Google Scholar] [CrossRef]
- Chaudhry, F.N.; Butt, S.I.; Mubashar, A.; Bin Naveed, A.; Imran, S.H.; Faping, Z. Effect of carbon fibre on reinforcement of thermoplastics using FDM and RSM. J. Thermoplast. Compos. Mater. 2019, 089270571988689. [Google Scholar] [CrossRef]
- Chabaud, G.; Castro, M.; Denoual, C.; Le Duigou, A. Hygromechanical properties of 3D printed continuous carbon and glass fibre reinforced polyamide composite for outdoor structural applications. Addit. Manuf. 2019, 26, 94–105. [Google Scholar] [CrossRef]
- Bochnia, J.; Blasiak, M.; Kozior, T. Tensile strength analysis of thin-walled polymer glass fiber reinforced samples manufactured by 3D printing technology. Polymers 2020, 12, 2783. [Google Scholar] [CrossRef]
- Yi, X.; Tan, Z.-J.; Yu, W.-J.; Li, J.; Li, B.-J.; Huang, B.-Y.; Liao, J. Three dimensional printing of carbon/carbon composites by selective laser sintering. Carbon 2016, 96, 603–607. [Google Scholar] [CrossRef]
- Valvez, S.; dos Santos, P.S.P.; Parente, J.; Silva, M.; Reis, P. 3D printed continuous carbon fiber reinforced PLA composites: A short review. Procedia Struct. Integr. 2020, 25, 394–399. [Google Scholar] [CrossRef]
- Omar, N.W.Y.; Shuaib, A.N.; Ab Hadi, M.H.J.; Azmi, I.A. Mechanical properties of carbon and glass fibre reinforced composites produced by additive manufacturing: A short review. IOP Conf. Ser. Mater. Sci. Eng. 2019, 670, 012020. [Google Scholar] [CrossRef] [Green Version]
- Dou, H.; Cheng, Y.; Ye, W.; Zhang, D.; Li, J.; Miao, Z.; Rudykh, S. Effect of process parameters on tensile mechanical properties of 3D printing continuous carbon fiber-reinforced PLA composites. Materials 2020, 13, 3850. [Google Scholar] [CrossRef]
- Li, N.; Li, Y.; Liu, S. Rapid prototyping of continuous carbon fiber reinforced polylactic acid composites by 3D printing. J. Mater. Process. Technol. 2016, 238, 218–225. [Google Scholar] [CrossRef]
- Dzioba, I.; Lipiec, S.; Pala, R.; Furmanczyk, P. On characteristics of ferritic steel determined during the uniaxial tensile test. Materials 2021, 14, 3117. [Google Scholar] [CrossRef] [PubMed]
- Ferreira, R.T.L.; Amatte, I.C.; Dutra, T.A.; Bürger, D. Experimental characterization and micrography of 3D printed PLA and PLA reinforced with short carbon fibers. Compos. Part. B Eng. 2017, 124, 88–100. [Google Scholar] [CrossRef]
- Saharudin, M.; Hajnys, J.; Kozior, T.; Gogolewski, D.; Zmarzły, P. Quality of surface texture and mechanical properties of PLA and PA-based material reinforced with carbon fibers manufactured by FDM and CFF 3D printing technologies. Polymers 2021, 13, 1671. [Google Scholar] [CrossRef] [PubMed]
- Heidari-Rarani, M.; Rafiee-Afarani, M.; Zahedi, A. Mechanical characterization of FDM 3D printing of continuous carbon fiber reinforced PLA composites. Compos. Part. B Eng. 2019, 175, 107147. [Google Scholar] [CrossRef]
- Tekinalp, H.L.; Kunc, V.; Velez-Garcia, G.M.; Duty, C.E.; Love, L.J.; Naskar, A.K.; Blue, C.A.; Ozcan, S. Highly oriented carbon fiber–polymer composites via additive manufacturing. Compos. Sci. Technol. 2014, 105, 144–150. [Google Scholar] [CrossRef] [Green Version]
- Zmarzły, P.; Gogolewski, D.; Kozior, T. Design guidelines for plastic casting using 3D printing. J. Eng. Fibers Fabr. 2020, 15, 155892502091603. [Google Scholar] [CrossRef]
- Townsend, A.; Senin, N.; Blunt, L.; Leach, R.; Taylor, J. Surface texture metrology for metal additive manufacturing: A review. Precis. Eng. 2016, 46, 34–47. [Google Scholar] [CrossRef] [Green Version]
- Zmarzly, P. Influence of bearing raceway surface topography on the level of generated vibration as an example of operational heredity. Indian J. Eng. Mater. Sci. 2020, 356–364. [Google Scholar]
- Zmarzły, P. Multi-dimensional mathematical wear models of vibration generated by rolling ball bearings made of AISI 52100 bearing steel. Materials 2020, 13, 5440. [Google Scholar] [CrossRef] [PubMed]
- Van Der Klift, F.; Koga, Y.; Todoroki, A.; Ueda, M.; Hirano, Y.; Matsuzaki, R. 3D Printing of continuous carbon fibre reinforced thermo-plastic (CFRTP) tensile test specimens. Open J. Compos. Mater. 2016, 6, 18–27. [Google Scholar] [CrossRef] [Green Version]
- Weng, Y.; Li, M.; Zhang, D.; Tan, M.J.; Qian, S. Investigation of interlayer adhesion of 3D printable cementitious material from the aspect of printing process. Cem. Concr. Res. 2021, 143, 106386. [Google Scholar] [CrossRef]
- Kariz, M.; Kuzman, M.K.; Sernek, M. Adhesive bonding of 3D-printed ABS parts and wood. J. Adhes. Sci. Technol. 2017, 31, 1683–1690. [Google Scholar] [CrossRef]
- Unger, L.; Scheideler, M.; Meyer, P.; Harland, J.; Gorzen, A.; Wortmann, M.; Dreyer, A.; Ehrmann, A. Increasing adhesion of 3D printing on textile fabrics by polymer coating. Tekstilec 2018, 61, 265–271. [Google Scholar] [CrossRef]
- Meyer, P.; Döpke, C.; Ehrmann, A. Improving adhesion of three-dimensional printed objects on textile fabrics by polymer coating. J. Eng. Fibers Fabr. 2019, 14, 1558925019895257. [Google Scholar] [CrossRef] [Green Version]


| Properties | PLA, Easy PLA | PLA-CF, CarbonFil |
|---|---|---|
| Specific gravity | 1.24 g/cm3 | 1.19 g/cm3 |
| Tensile modulus | 3600 MPa (ASTM D882) | 3800 MPa (ASTM D256) |
| Elongation at break | 6% (ASTM D882) | 8% (ISO 527) |
| Print temperature | 200–230 °C | 230–265 °C |
| No. | ā (mm) | (mm) | No. | ā (mm) | (mm) | No. | ā (mm) | (mm) | No. | ā (mm) | (mm) |
|---|---|---|---|---|---|---|---|---|---|---|---|
| 1.0 1X | 1.15 | 5.52 | 1.4 1X | 1.56 | 5.38 | 1.8 1X | 1.85 | 5.46 | 4.0 1X | 3.98 | 5.39 |
| 1.0 2X | 1.13 | 5.55 | 1.4 2X | 1.63 | 5.38 | 1.8 2X | 1.88 | 5.44 | 4.0 2X | 3.96 | 5.36 |
| 1.0 3X | 1.13 | 5.5 | 1.4 3X | 1.58 | 5.36 | 1.8 3X | 1.87 | 5.43 | 4.0 3X | 3.95 | 5.44 |
| 1.0 4X | 1.14 | 5.45 | 1.4 4X | 1.61 | 5.33 | 1.8 4X | 1.85 | 5.42 | 4.0 4X | 3.98 | 5.45 |
| 1.0 5X | 1.1 | 5.47 | 1.4 5X | 1.55 | 5.38 | 1.8 5X | 1.86 | 5.43 | 4.0 5X | 3.96 | 5.46 |
| 1.13 | 5.5 | 1.59 | 5.37 | 1.86 | 5.44 | 3.97 | 5.42 | ||||
| SD | 0.02 | 0.04 | SD | 0.04 | 0.02 | SD | 0.01 | 0.02 | SD | 0.01 | 0.04 |
| 1.0 1Y | 1.06 | 5.06 | 1.4 1Y | 1.79 | 5.16 | 1.8 1Y | 1.99 | 5.15 | 4.0 1Y | 4.07 | 5.12 |
| 1.0 2Y | 1.06 | 5.11 | 1.4 2Y | 1.71 | 5.16 | 1.8 2Y | 1.95 | 5.15 | 4.0 2Y | 4.07 | 5.14 |
| 1.0 3Y | 1.07 | 5.1 | 1.4 3Y | 1.74 | 5.12 | 1.8 3Y | 1.92 | 5.16 | 4.0 3Y | 4.08 | 5.2 |
| 1.0 4Y | 1.03 | 5.09 | 1.4 4Y | 1.76 | 5.11 | 1.8 4Y | 1.92 | 5.14 | 4.0 4Y | 4.06 | 5.11 |
| 1.0 5Y | 1.01 | 5.1 | 1.4 5Y | 1.71 | 5.12 | 1.8 5Y | 1.93 | 5.18 | 4.0 5Y | 4.09 | 5.12 |
| 1.05 | 5.09 | 1.74 | 5.13 | 1.94 | 5.16 | 4.07 | 5.14 | ||||
| SD | 0.03 | 0.02 | SD | 0.04 | 0.02 | SD | 0.03 | 0.02 | SD | 0.01 | 0.04 |
| 1.0 1Z | 1.19 | 5.13 | 1.4 1Z | 1.66 | 5.07 | 1.8 1Z | 1.98 | 5.01 | 4.0 1Z | 4.2 | 5.24 |
| 1.0 2Z | 1.22 | 5.12 | 1.4 2Z | 1.52 | 5 | 1.8 2Z | 2 | 5.07 | 4.0 2Z | 4.16 | 5 |
| 1.0 3Z | 1.21 | 5.18 | 1.4 3Z | 1.54 | 4.99 | 1.8 3Z | 1.96 | 5.02 | 4.0 3Z | 4.18 | 5.16 |
| 1.0 4Z | 1.3 | 5.07 | 1.4 4Z | 1.56 | 4.99 | 1.8 4Z | 2.02 | 5.05 | 4.0 4Z | 4.21 | 5.05 |
| 1.0 5Z | 1.19 | 5.06 | 1.4 5Z | 1.63 | 5.02 | 1.8 5Z | 2 | 5.08 | 4.0 5Z | 4.3 | 5.11 |
| 1.22 | 5.11 | 1.58 | 5.01 | 1.99 | 5.05 | 4.21 | 5.11 | ||||
| SD | 0.02 | 0.05 | SD | 0.06 | 0.04 | SD | 0.02 | 0.03 | SD | 0.02 | 0.09 |
| No. | ā (mm) | (mm) | No. | ā (mm) | (mm) | No. | ā (mm) | (mm) | No. | ā (mm) | (mm) |
|---|---|---|---|---|---|---|---|---|---|---|---|
| 1.0C 1X | 1.1 | 5.4 | 1.4C 1X | 1.3 | 5.2 | 1.8C 1X | 1.88 | 5.25 | 4.0C 1X | 4.07 | 5.42 |
| 1.0C 2X | 1.4 | 5.48 | 1.4C 2X | 1.33 | 5.23 | 1.8C 2X | 1.76 | 5.36 | 4.0C 2X | 4 | 5.41 |
| 1.0C 3X | 0.95 | 5.68 | 1.4C 3X | 1.29 | 5.23 | 1.8C 3X | 1.79 | 5.38 | 4.0C 3X | 4.01 | 5.5 |
| 1.0C 4X | 1.09 | 5.57 | 1.4C 4X | 1.33 | 5.21 | 1.8C 4X | 1.75 | 5.32 | 4.0C 4X | 4.01 | 5.33 |
| 1.0C 5X | 1.04 | 5.33 | 1.4C 5X | 1.32 | 5.24 | 1.8C 5X | 1.75 | 5.35 | 4.0C 5X | 4.02 | 5.39 |
| 1.12 | 5.49 | 1.31 | 5.22 | 1.79 | 5.33 | 4.02 | 5.41 | ||||
| SD | 0.17 | 0.14 | SD | 0.0182 | 0.02 | SD | 0.06 | 0.05 | SD | 0.03 | 0.06 |
| 1.0C 1Y | 0.95 | 4.93 | 1.4C 1Y | 1.62 | 5 | 1.8C 1Y | 1.9 | 5.12 | 4.0C 1Y | 4.21 | 5.1 |
| 1.0C 2Y | 0.94 | 4.96 | 1.4C 2Y | 1.63 | 4.99 | 1.8C 2Y | 1.9 | 5.08 | 4.0C 2Y | 4.3 | 5.07 |
| 1.0C 3Y | 1 | 4.91 | 1.4C 3Y | 1.69 | 5.03 | 1.8C 3Y | 1.88 | 4.99 | 4.0C 3Y | 4.19 | 5.06 |
| 1.0C 4Y | 0.95 | 4.92 | 1.4C 4Y | 1.65 | 5.03 | 1.8C 4Y | 1.9 | 5.03 | 4.0C 4Y | 4.16 | 5.02 |
| 1.0C 5Y | 0.99 | 4.89 | 1.4C 5Y | 1.73 | 4.97 | 1.8C 5Y | 1.91 | 5.03 | 4.0C 5Y | 4.17 | 5.13 |
| 0.97 | 4.92 | 1.66 | 5 | 1.9 | 5.05 | 4.21 | 5.08 | ||||
| SD | 0.03 | 0.03 | SD | 0.02 | 0.01 | SD | 0.01 | 0.05 | SD | 0.03 | 0.04 |
| 1.0C 1Z | 1.14 | 4.86 | 1.4C 1Z | 1.44 | 4.91 | 1.8C 2Z | 1.94 | 4.84 | 4.0C 1Z | 4.2 | 4.9 |
| 1.0C 2Z | 1.17 | 4.9 | 1.4C 2Z | 1.57 | 4.86 | 1.8C 4Z | 1.9 | 4.87 | 4.0C 2Z | 4.13 | 4.91 |
| 1.0C 3Z | 1.28 | 4.92 | 1.4C 3Z | 1.43 | 4.97 | 1.8C 5Z | 1.82 | 4.86 | 4.0C 3Z | 4.07 | 4.83 |
| 1.0C 4Z | 1.19 | 4.83 | 1.4C 5Z | 1.56 | 4.83 | 1.8C 6Z | 1.98 | 4.87 | 4.0C 4Z | 4.13 | 4.91 |
| 1.0C 5Z | 1.2 | 4.85 | 1.4C 6Z | 1.59 | 4.98 | 1.8C 7Z | 1.87 | 4.91 | 4.0C 5Z | 4.13 | 4.79 |
| 1.2 | 4.87 | 1.52 | 4.91 | 1.90 | 4.87 | 4.13 | 4.87 | ||||
| SD | 0.05 | 0.037 | SD | 0.08 | 0.066 | SD | 0.06 | 0.03 | SD | 0.05 | 0.06 |
| No. | Rm (MPa) | ɛm (%) | No. | Rm (MPa) | ɛm (%) | No. | Rm (MPa) | ɛm (%) | No. | Rm (MPa) | ɛm (%) |
|---|---|---|---|---|---|---|---|---|---|---|---|
| 1.0 1X | 34.2 | 3.8 | 1.4 1X | 35.33 | 3.6 | 1.8 1X | 38.66 | 4.3 | 4.0 1X | 42.23 | 6.8 |
| 1.0 2X | 34.87 | 3.9 | 1.4 2X | 38.98 | 4.8 | 1.8 2X | 40.31 | 4.6 | 4.0 2X | 41.04 | 7.1 |
| 1.0 3X | 35.93 | 3.8 | 1.4 3X | 35.2 | 3.7 | 1.8 3X | 40.43 | 4.5 | 4.0 3X | 41.04 | 6.9 |
| 1.0 4X | 36.23 | 3.8 | 1.4 4X | 37.76 | 4.1 | 1.8 4X | 38.3 | 4.3 | 4.0 4X | 39.9 | 7.4 |
| 1.0 5X | 36.62 | 3.8 | 1.4 5X | 36.82 | 4.5 | 1.8 5X | 39.34 | 4.4 | 4.0 5X | 39.92 | 6.7 |
| 35.57 | 3.8 | 36.82 | 4.1 | 39.41 | 4.4 | 40.83 | 7.0 | ||||
| SD | 1.0 | 0.1 | SD | 1.61 | 0.5 | SD | 0.96 | 0.1 | SD | 0.97 | 0.3 |
| 1.0 1Y | 27.02 | 4.3 | 1.4 1Y | 42.1 | 4.9 | 1.8 1Y | 41.18 | 5.4 | 4.0 1Y | 45.88 | 8.8 |
| 1.0 2Y | 35.89 | 4.6 | 1.4 2Y | 47.54 | 5.6 | 1.8 2Y | 43.45 | 6.0 | 4.0 2Y | 44.58 | 7.8 |
| 1.0 3Y | 26.12 | 4.2 | 1.4 3Y | 46.31 | 5.3 | 1.8 3Y | 43.86 | 5.4 | 4.0 3Y | 45.08 | 8.3 |
| 1.0 4Y | 38.63 | 4.8 | 1.4 4Y | 46.5 | 5.9 | 1.8 4Y | 43.44 | 5.3 | 4.0 4Y | 43.93 | 7.5 |
| 1.0 5Y | 36.14 | 4.3 | 1.4 5Y | 46.55 | 5.3 | 1.8 5Y | 43.34 | 5.4 | 4.0 5Y | 45.24 | 7.9 |
| 32.76 | 4.5 | 45.8 | 5.4 | 43.05 | 5.5 | 44.94 | 8.1 | ||||
| SD | 5.76 | 0.3 | SD | 2.12 | 0.4 | SD | 1.07 | 0.3 | SD | 0.73 | 0.5 |
| 1.0 1Z | 12.7 | 2.4 | 1.4 1Z | 15.55 | 2.4 | 1.8 1Z | 20.85 | 4.0 | 4.0 1Z | 16.92 | 4.5 |
| 1.0 2Z | 13.49 | 1.9 | 1.4 2Z | 28.69 | 3.3 | 1.8 2Z | 21.8 | 3.6 | 4.0 2Z | 17.45 | 4.4 |
| 1.0 3Z | 14.19 | 2.1 | 1.4 3Z | 25.05 | 3.1 | 1.8 3Z | 20.22 | 3.8 | 4.0 3Z | 16.95 | 4.9 |
| 1.0 4Z | 14.22 | 2.3 | 1.4 4Z | 25.36 | 3.2 | 1.8 4Z | 21.11 | 3.4 | 4.0 4Z | 17.16 | 4.3 |
| 1.0 5Z | 12.72 | 1.8 | 1.4 5Z | 23.29 | 2.7 | 1.8 5Z | 22.27 | 3.6 | 4.0 5Z | 15.98 | 4.3 |
| 13.46 | 2.1 | 23.59 | 2.9 | 21.25 | 3.7 | 16.89 | 4.5 | ||||
| SD | 0.75 | 0.3 | SD | 4.9 | 0.4 | SD | 0.8 | 0.3 | SD | 0.55 | 0.2 |
| No. | Rm (MPa) | ɛm (%) | No. | Rm (MPa) | ɛm (%) | No. | Rm (MPa) | ɛm (%) | No. | Rm (MPa) | ɛm (%) |
| 1.0C 1X | 30.27 | 3.9 | 1.4C 1X | 51.68 | 5.0 | 1.8C 1X | 50.7 | 5.6 | 4.0C 1X | 42.8 | 9.4 |
| 1.0C 2X | 25.28 | 3.3 | 1.4C 2X | 43.89 | 4.2 | 1.8C 2X | 53.88 | 6.1 | 4.0C 2X | 43.53 | 8.7 |
| 1.0C 3X | 40.39 | 3.9 | 1.4C 3X | 55.41 | 4.9 | 1.8C 3X | 49.66 | 5.1 | 4.0C 3X | 40.72 | 9.0 |
| 1.0C 4X | 34.06 | 4.4 | 1.4C 4X | 50.92 | 5.3 | 1.8C 4X | 53.34 | 6.1 | 4.0C 4X | 42.57 | 8.6 |
| 1.0C 5X | 38.84 | 3.4 | 1.4C 5X | 50.61 | 4.8 | 1.8C 5X | 49.04 | 5.3 | 4.0C 5X | 41.99 | 8.4 |
| 33.77 | 3.8 | 50.5 | 4.8 | 51.32 | 5.6 | 42.32 | 8.8 | ||||
| SD | 6.2 | 0.4 | SD | 4.17 | 0.4 | SD | 2.18 | 0.5 | SD | 1.05 | 0.4 |
| 1.0C 1Y | 34.52 | 3.8 | 1.4C 1Y | 73.69 | 6.8 | 1.8C 1Y | 55.32 | 6.7 | 4.0C 1Y | 44.89 | 9.0 |
| 1.0C 2Y | 39.32 | 3.9 | 1.4C 2Y | 74.28 | 7.0 | 1.8C 2Y | 56.54 | 6.5 | 4.0C 2Y | 43.5 | 9.4 |
| 1.0C 3Y | 36.37 | 4.1 | 1.4C 3Y | 70.8 | 7.2 | 1.8C 3Y | 58 | 6.3 | 4.0C 3Y | 44.1 | 8.6 |
| 1.0C 4Y | 34.93 | 2.7 | 1.4C 4Y | 72.27 | 6.8 | 1.8C 4Y | 59.51 | 7.1 | 4.0C 4Y | 44.63 | 9.9 |
| 1.0C 5Y | 49.13 | 4.9 | 1.4C 5Y | 68.94 | 7.5 | 1.8C 5Y | 54.49 | 6.4 | 4.0C 5Y | 44.86 | 9.3 |
| 38.85 | 3.9 | 72 | 7.1 | 56.77 | 6.6 | 44.4 | 9.3 | ||||
| SD | 6.05 | 0.8 | SD | 2.18 | 0.3 | SD | 2.02 | 0.48 | SD | 0.59 | 0.5 |
| 1.0C 1Z | 4.87 | 2.4 | 1.4C 1Z | 6.66 | 2 | 1.8C 2Z | 5.25 | 2.2 | 4.0C 1Z | 3.44 | 2.7 |
| 1.0C 2Z | 4.65 | 1.9 | 1.4C 2Z | 6.7 | 2.3 | 1.8C 4Z | 4.79 | 1.9 | 4.0C 2Z | 3.3 | 2.4 |
| 1.0C 3Z | 4.85 | 2.0 | 1.4C 3Z | 5.94 | 2 | 1.8C 5Z | 6.47 | 2.3 | 4.0C 3Z | 3.07 | 2.2 |
| 1.0C 4Z | 5.02 | 2.2 | 1.4C 5Z | 6.18 | 1.8 | 1.8C 6Z | 5.09 | 1.9 | 4.0C 4Z | 3.28 | 2.9 |
| 1.0C 5Z | 5.47 | 2.5 | 1.4C 6Z | 6.65 | 2.2 | 1.8C 7Z | 5.36 | 2.5 | 4.0C 5Z | 3.63 | 3.1 |
| 4.97 | 2.2 | 6.42 | 2.1 | 5.39 | 2.2 | 3.34 | 2.7 | ||||
| SD | 0.31 | 0.2 | SD | 0.35 | 0.2 | SD | 0.64 | 0.3 | SD | 0.21 | 0.4 |
| No. | E | No. | E | No. | E | No. | E |
|---|---|---|---|---|---|---|---|
| 1.0 1X | 829.4 | 1.4 1X | 1062.5 | 1.8 1X | 854.8 | 4.0 1X | 497.6 |
| 1.0 2X | 866.6 | 1.4 2X | 756.4 | 1.8 2X | 799.8 | 4.0 2X | 437.2 |
| 1.0 3X | 865.6 | 1.4 3X | 976.2 | 1.8 3X | 804.7 | 4.0 3X | 486.3 |
| 1.0 4X | 921.3 | 1.4 4X | 876.9 | 1.8 4X | 844.7 | 4.0 4X | 399.2 |
| 1.0 5X | 897 | 1.4 5X | 688.6 | 1.8 5X | 844.9 | 4.0 5X | 502 |
| 875 | 872.1 | 829.8 | 464.5 | ||||
| SD | 34.9 | SD | 153.4 | SD | 25.5 | SD | 44.7 |
| 1.0 1Y | 574.1 | 1.4 1Y | 751.4 | 1.8 1Y | 659.8 | 4.0 1Y | 358 |
| 1.0 2Y | 656.9 | 1.4 2Y | 715.8 | 1.8 2Y | 590 | 4.0 2Y | 486.8 |
| 1.0 3Y | 645.3 | 1.4 3Y | 752.9 | 1.8 3Y | 628.7 | 4.0 3Y | 394 |
| 1.0 4Y | 723.7 | 1.4 4Y | 648.9 | 1.8 4Y | 641.4 | 4.0 4Y | 517 |
| 1.0 5Y | 825.1 | 1.4 5Y | 747.5 | 1.8 5Y | 594.1 | 4.0 5Y | 442.8 |
| 685 | 723.3 | 622.8 | 439.7 | ||||
| SD | 94.6 | SD | 44.3 | SD | 30.2 | SD | 65.1 |
| 1.0 1Z | 68.5 | 1.4 1Z | 600.6 | 1.8 1Z | 468.8 | 4.0 1Z | 293.3 |
| 1.0 2Z | 80.4 | 1.4 2Z | 801.6 | 1.8 2Z | 531 | 4.0 2Z | 260.9 |
| 1.0 3Z | 73.7 | 1.4 3Z | 791.7 | 1.8 3Z | 452.5 | 4.0 3Z | 215.8 |
| 1.0 4Z | 66.2 | 1.4 4Z | 690.2 | 1.8 4Z | 555.1 | 4.0 4Z | 279.3 |
| 1.0 5Z | 73 | 1.4 5Z | 784.8 | 1.8 5Z | 541.3 | 4.0 5Z | 270.4 |
| 72.4 | 733.8 | 509.7 | 263.9 | ||||
| SD | 5.5 | SD | 86.9 | SD | 45 | SD | 29.4 |
| No. | E | No. | E | No. | E | No. | E |
|---|---|---|---|---|---|---|---|
| 1.0C 1X | 723.5 | 1.4C 1X | 944 | 1.8C 1X | 771.5 | 4.0C 1X | 307.9 |
| 1.0C 2X | 649.8 | 1.4C 2X | 888.3 | 1.8C 2X | 792.3 | 4.0C 2X | 351.6 |
| 1.0C 3X | 1000.6 | 1.4C 3X | 1053.9 | 1.8C 3X | 822.6 | 4.0C 3X | 289.6 |
| 1.0C 4X | 841.1 | 1.4C 4X | 770.7 | 1.8C 4X | 651.8 | 4.0C 4X | 316.8 |
| 1.0C 5X | 1135.3 | 1.4C 5X | 958.6 | 1.8C 5X | 716.9 | 4.0C 5X | 369.2 |
| 870.1 | 923.1 | 751 | 327 | ||||
| SD | 198.9 | SD | 104 | SD | 67.6 | SD | 32.6 |
| 1.0C 1Y | 948.1 | 1.4C 1Y | 763.3 | 1.8C 1Y | 591.8 | 4.0C 1Y | 341.6 |
| 1.0C 2Y | 1029.4 | 1.4C 2Y | 696.5 | 1.8C 2Y | 638.1 | 4.0C 2Y | 277.1 |
| 1.0C 3Y | 983.6 | 1.4C 3Y | 651.8 | 1.8C 3Y | 701.9 | 4.0C 3Y | 306.3 |
| 1.0C 4Y | 1251.6 | 1.4C 4Y | 720.3 | 1.8C 4Y | 545.6 | 4.0C 4Y | 235.4 |
| 1.0C 5Y | 1008.7 | 1.4C 5Y | 507.3 | 1.8C 5Y | 700.2 | 4.0C 5Y | 274.4 |
| 1044.3 | 667.8 | 635.5 | 287 | ||||
| SD | 119.8 | SD | 98.4 | SD | 68.2 | SD | 39.6 |
| 1.0C 1Z | 230.2 | 1.4C 1Z | 363.7 | 1.8C 2Z | 240.5 | 4.0C 1Z | 139.6 |
| 1.0C 2Z | 268.1 | 1.4C 2Z | 315.7 | 1.8C 4Z | 265.1 | 4.0C 2Z | 155.9 |
| 1.0C 3Z | 257.6 | 1.4C 3Z | 312 | 1.8C 5Z | 292.9 | 4.0C 3Z | 148.7 |
| 1.0C 4Z | 260.8 | 1.4C 5Z | 365.1 | 1.8C 6Z | 273.7 | 4.0C 4Z | 121.2 |
| 1.0C 5Z | 257.4 | 1.4C 6Z | 320.7 | 1.8C 7Z | 238 | 4.0C 5Z | 122.2 |
| 254.8 | 335.4 | 262 | 137.5 | ||||
| SD | 14.4 | SD | 26.6 | SD | 23.1 | SD | 15.6 |
Publisher’s Note: MDPI stays neutral with regard to jurisdictional claims in published maps and institutional affiliations. |
© 2021 by the authors. Licensee MDPI, Basel, Switzerland. This article is an open access article distributed under the terms and conditions of the Creative Commons Attribution (CC BY) license (https://creativecommons.org/licenses/by/4.0/).
Share and Cite
Bochnia, J.; Blasiak, M.; Kozior, T. A Comparative Study of the Mechanical Properties of FDM 3D Prints Made of PLA and Carbon Fiber-Reinforced PLA for Thin-Walled Applications. Materials 2021, 14, 7062. https://doi.org/10.3390/ma14227062
Bochnia J, Blasiak M, Kozior T. A Comparative Study of the Mechanical Properties of FDM 3D Prints Made of PLA and Carbon Fiber-Reinforced PLA for Thin-Walled Applications. Materials. 2021; 14(22):7062. https://doi.org/10.3390/ma14227062
Chicago/Turabian StyleBochnia, Jerzy, Malgorzata Blasiak, and Tomasz Kozior. 2021. "A Comparative Study of the Mechanical Properties of FDM 3D Prints Made of PLA and Carbon Fiber-Reinforced PLA for Thin-Walled Applications" Materials 14, no. 22: 7062. https://doi.org/10.3390/ma14227062