3.1. Preparation and Characterization of 2,6-Dicarboxypyridine Polymers
Five 2,6-dicarboxypyridine-based polymers were prepared by azeotropic condensation of five different diols with diethyl pyridine-2,6-dicarboxylate.
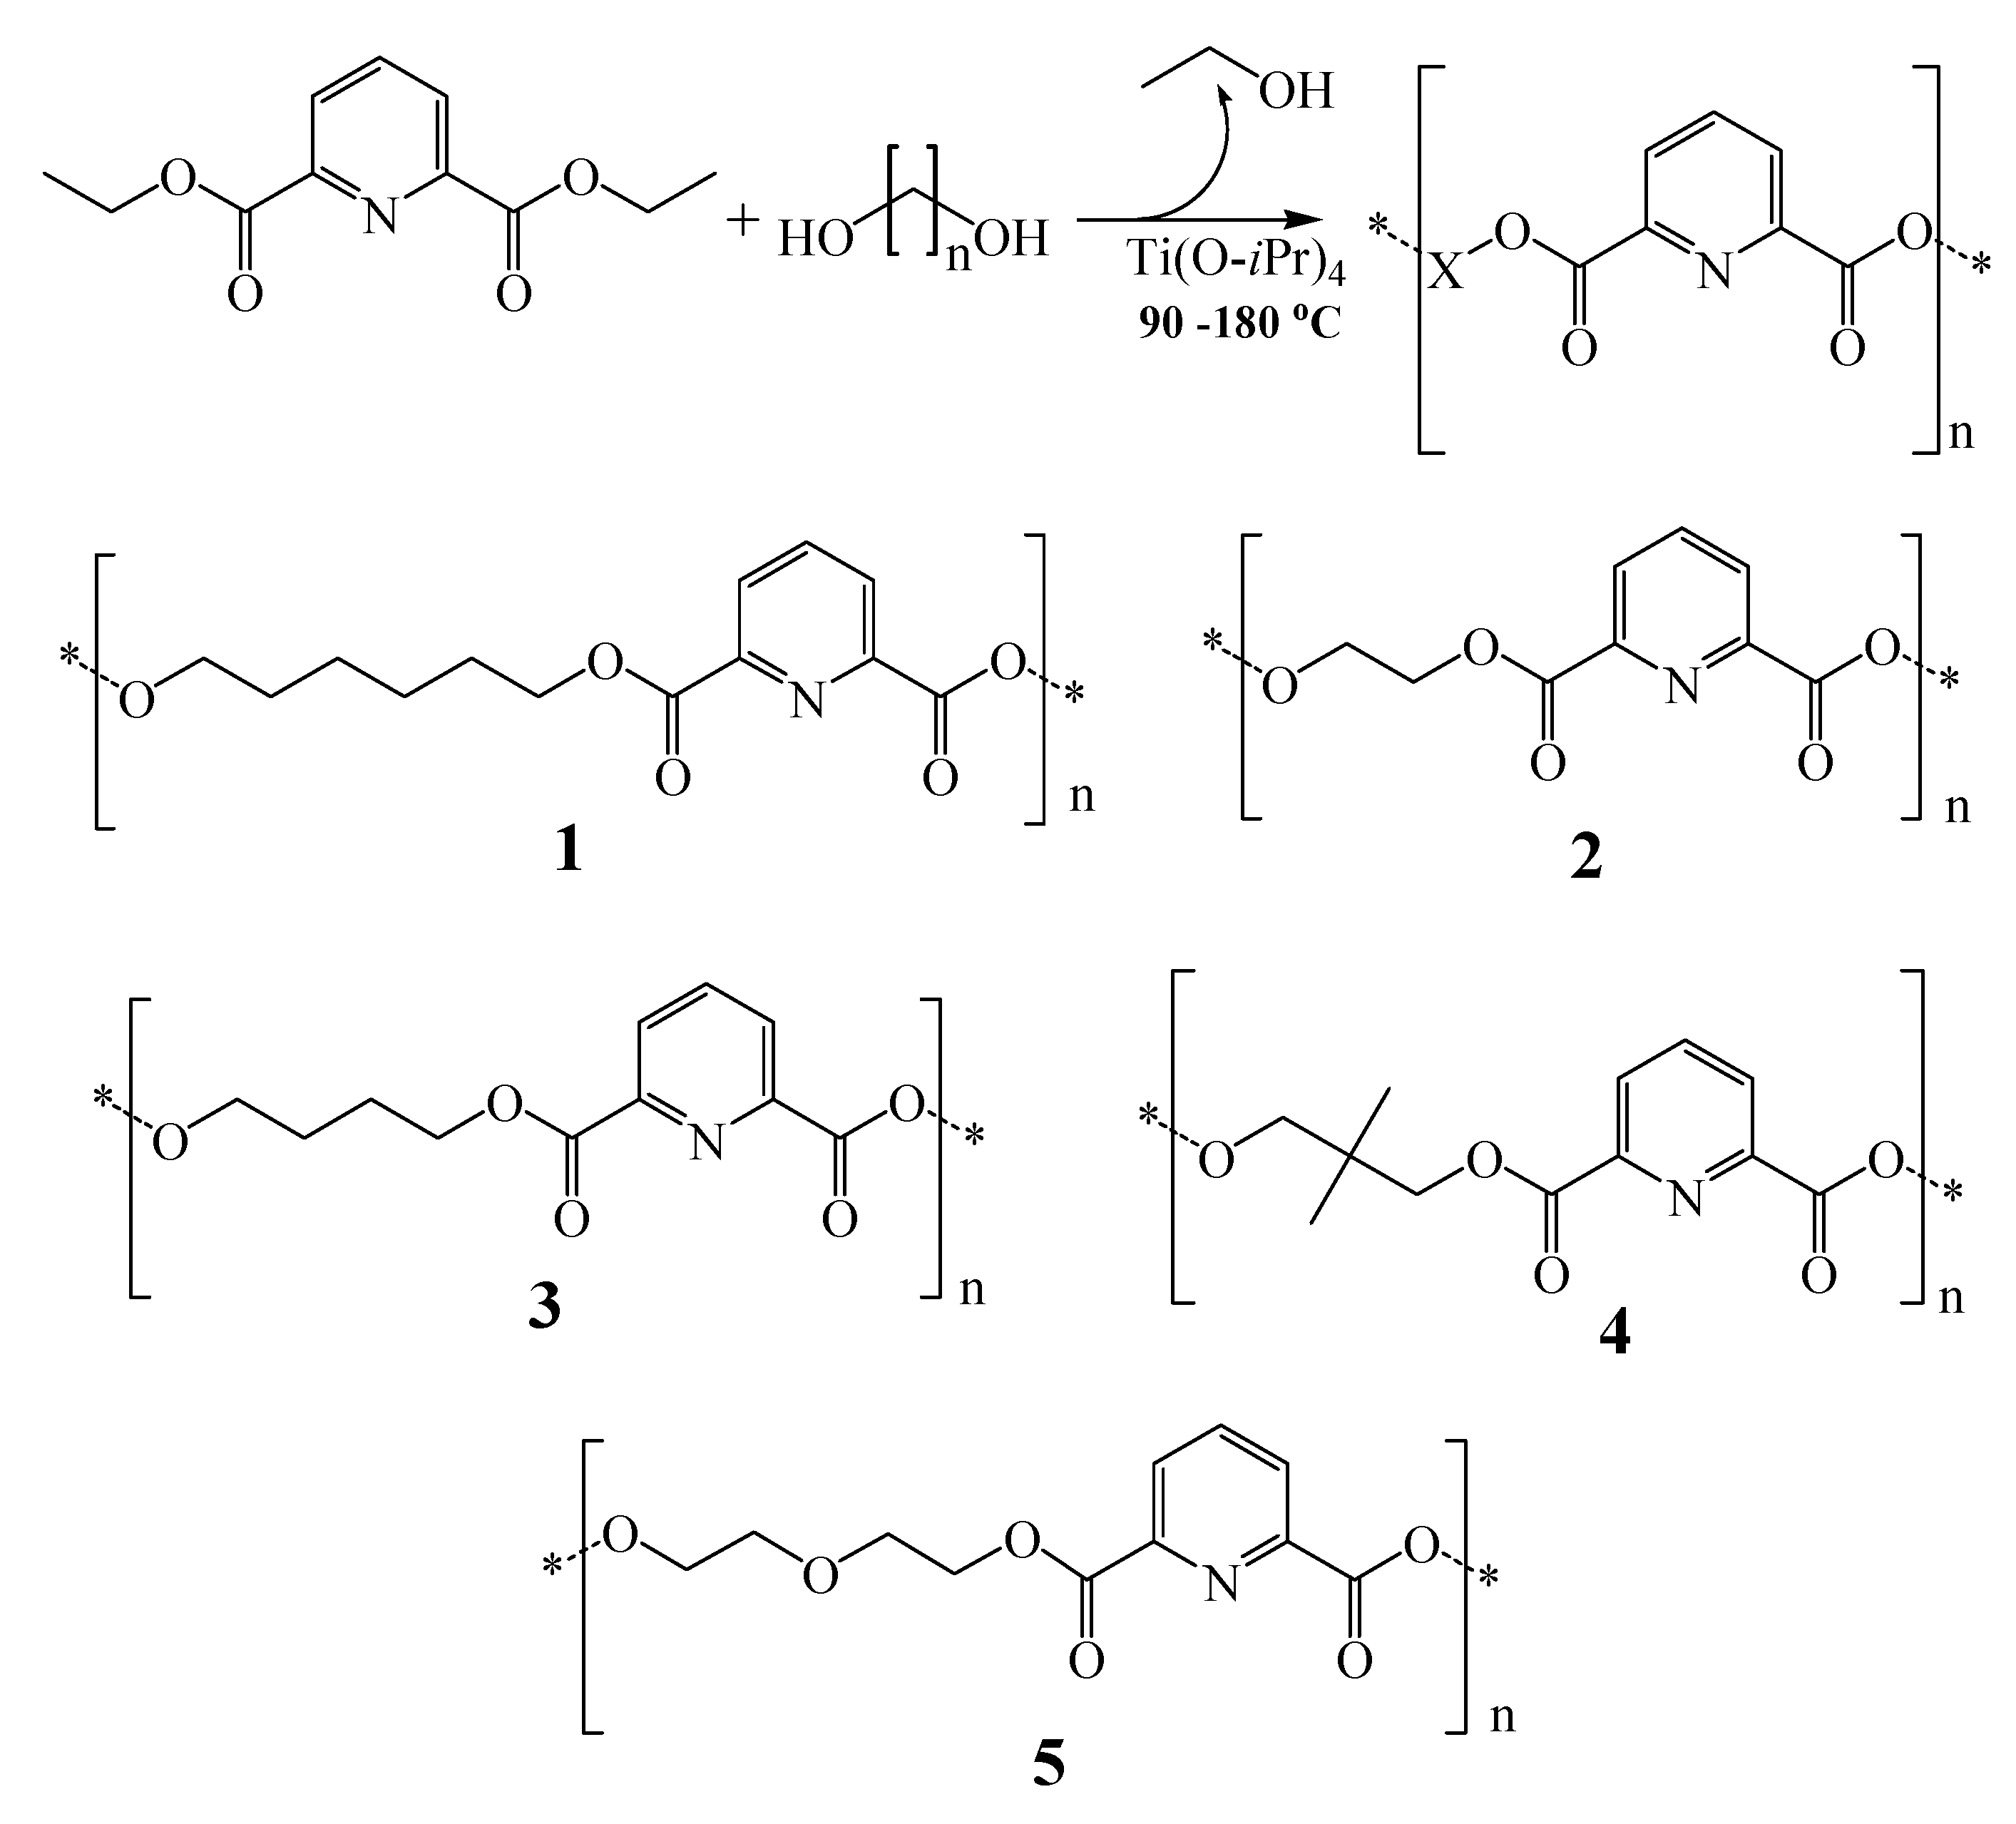
Scheme 1.
The condensation reaction and the prepared polymers: 1: Poly(1,6-hexane-2,6-dicarboxylate pyridine); 2: Poly(ethyleneglycol-2,6-dicarboxylate pyridine); 3: Poly(1,4-butane-2,6-dicarboxylate pyridine); 4: Poly(2,2-dimethyl-1,3-propane-2,6-dicarboxylate pyridine); 5: Poly(diethyleneglycol-2,6-dicarboxylate pyridine); n ranges from 2 to 6 atoms.
To force the reactions to completion titanium tetraisopropoxide [Ti(O-
iPr)
4] was added as Lewis acid catalyst, and reaction temperatures were raised to 180 °C to promote elimination of ethanol.
Scheme 1 shows the condensation reactions and the prepared polymers.
The polymers were characterized by inherent viscosity, differential scanning calorimetry (DSC), Fourier Transform Infra Red (FTIR) spectroscopy, proton and carbon nuclear magnetic resonance spectroscopy (
1H-NMR and
13C-NMR), and thermogravimetric analysis (TGA).
Table 1 shows the yields, major FTIR bands, inherent viscosities and glass transition points for the prepared polymers, while
Table 2 shows their
1H-NMR and
13C-NMR signals.
Table 1.
Prepared polymers, amounts of diols used in the preparation of each polymer, polymer yields, and select physicochemical properties.
Table 1.
Prepared polymers, amounts of diols used in the preparation of each polymer, polymer yields, and select physicochemical properties.
| Polymer a | Diol | Yield | Ester C=O Stretching (cm−1) | Inherent Viscosity(g/dL) | Tg c(°C) |
|---|
| No. | Name | Name | Amount (g) b |
|---|
| 1 | Poly(hexane-1,6-pyridine-2,6- dicarboxylate) | 1,6-Hexanediol | 1.18 | 60% | 1741 | 0.303 | 8.3 |
| 2 | Poly(ethyleneglycol pyridine 2,6-dicarboxylate) | Ethyleneglycol | 0.62 | 73% | 1729 | 0.301 | 74.7 |
| 3 | Poly(butane-1,4-pyridine-2,6-dicarboxylate) | 1,4-Butanediol | 1.442 | 45% | 1750 | 0.295 | 55.8 |
| 4 | Poly(2,2-dimethyl-1,3-propane- | 2,2-Dimethyl-1,3-propanediol | 1.04 | 53% | 1725 | 0.332 | 161.1 |
| pyridine-2,6-dicarboxylate) |
| 5 | Poly(diethyleneglycol pyridine- 2,6-dicarboxylate) | Diethyleneglycol | 1.06 | 32% | 1728 | 0.288 | 33.1 |
Table 2.
1H- and 13C-NMR chemical shifts of the diethyl-2,6-pyridine dicarboxylate monomer and prepared polymers.
Table 2.
1H- and 13C-NMR chemical shifts of the diethyl-2,6-pyridine dicarboxylate monomer and prepared polymers.
| Polymer | 13C-NMR shifts in CDCl3 (ppm) | 1H-NMR shifts in CDCl3 (ppm) |
|---|
| 1 | 25.6 (2 × CH2), 28.50 (2 × CH2), 66.10 (2 × CH2), 127.78 (2 × Aromatic CH), 138.25 (Aromatic CH), 148.30 (2 × Aromatic C), 164.48 (2 × C=O). | 1.50 (m, 4H), 1.8 (m, 4H), 4.50 (m, 4H, CH2-O), 8.0 (m, 1H), 8.2 (m, 2H). |
| 2 | 63.5 (4 × CH2), 128.36 (2 × Aromatic CH), 138.57 (Aromatic CH), 148.04 (2 × Aromatic C), 164.20 (2 x C=O). | 4.50 (m, 4H, CH2-O), 8.0 (m, 1H), 8.2 (m, 2H). |
| 3 | 25.31 (2 × CH2), 65.63 (2 × CH2), 127.90(2 × Aromatic CH), 138.30 (Aromatic CH), 148.49 (2 × Aromatic C), 164.51 (2 × C=O). | 1.97 (m, 4H), 4.10 (m, 4H), 7.97 (m, 1H), 8.23 (m, 2H). |
| 4 | 21.90 (2 × CH3), 35.49 (C), 70.41 (2 × CH2), 127.84 (2 × Aromatic CH), 138.24 (Aromatic CH), 148.32 (2 x Aromatic C), 164.28 (2 x C=O). | 1.20 (s, 6H), 4.2 (s, 4H), 7.80 (m, 1H), 8.23 (m, 2H). |
| 5 | 65.02 (2 × CH2), 68.91 (2 × CH2), 128.33(2 × Aromatic CH), 138.35 (Aromatic CH), 148.23 (2 × Aromatic C), 164.36 (2 × C=O). | 3.9 (t, 4H), 4.54 (s, 4H), 7.920 (m, 1H), 8.23 (m, 2H). |
| Diethyl-2,6-dicarboxylate pyridine (monomer) | 14.12 (2 x CH3), 62.16 (2 × CH2), 127.78 (2 × Aromatic CH), 138.25 (Aromatic CH), 148.49 (2 × Aromatic C), 164.48(2 × C=O). | 1.20 (t, 2 × 3H), 4.4 (q, 2 × 2H), 7.9 (m, 1H), 8.2 (m, 2H). |
Figure A in the Supporting Information shows the FTIR spectra of the five polymers aligned against each other. From the figure it is clear that the spectra of the polymers demonstrate intense characteristic bands ranging from 1,725–1,750 cm
−1 corresponding to the stretching vibrations of the newly formed ester carbonyl functions.
Table 2 lists the carbonyl stretching bands of the prepared polyesters.
Although the preparation conditions were identical for all prepared polymers the polymerization yields were rather variable and seemed to depend on the nature of the incorporated diol. Still, it is rather hard to simply correlate any diol property with the corresponding observed polymeric yield, which suggests that polymerization is influenced by several diol properties.
Unsurprisingly, polymers'
13C-NMR and
1H-NMR spectra (
Table 2) exhibit aliphatic and aromatic resonance signals corresponding to the diol and pyridine-2,6-dicarboxylate fragments, respectively. Furthermore, emergence of
13C-NMR signal at 164 ppm further establishes ester formation across polymeric backbones, as shown in
Scheme 1.
We determined the inherent viscosities of the polymers, as listed in
Table 1, to assess their molecular size [
44]. Clearly from the Table, all prepared polymers exhibited relatively high inherent viscosities, suggesting efficient polymerization reactions and significant molecular weights. In particular, polymer
4 [poly(2,2-dimethyl-1,3-propane-2,6-dicarboxylate pyridine] was characterized with the highest viscosity, while polymer
5 [poly(diethyleneglycol-2,6-dicarboxylate pyridine)] exhibited the least viscosity.
To further characterize the prepared polymers, we collected their DSC thermographs. DSC analyses reveal the response of any material to thermal challenge. Melting is normally expressed as downward endothermic broad band, while chemical degradation is usually expressed as an upward exothermic band. The transition from plastic to elastic states,
i.e., glass transition temperature or T
g, is usually expressed as downward "step" on the DSC trait of a particular polymer [
45].
Table 1 shows the T
g values of the prepared polymers, while Figure B in the Supporting Information shows their DSC traits.
Clearly from
Table 1 and Figure B, polymer
4 has the highest T
g value of 161.1 °C while polymer
1 [poly(1,6-hexane-2,6-dicarboxylate pyridine)] exhibits the lowest value of 8.3 °C. The most reasonable explanation of this behavior is linked to the relative flexibilities of the polymeric scaffolds. The fact that polymer
1 includes 1,6-hexanediol units having seven rotatable bonds should promote polymeric flexibility, leading to significant reduction in T
g value, while the shorter 2,2-dimethyl-1,3-propanediol (four rotable bonds) is less flexible and therefore yields a rigid polymer of higher TG values. A similar trend exists among the other three polymers,
i.e., polymeric T
g is roughly inversely proportional to the number of rotatable bonds.
Polymeric DSC traits unveil another interesting trend: Polymers 1, 3 and 4 exhibit pronounced endothermic melting bands at 114, 180 and 278 °C, respectively. On the other hand, polymers 2 and 5 exhibit unusual thermal robustness, extending up to 300 °C. We believe this behavior is also related to the flexibility of the polymers. The increasing trend in melting temperatures of 1, 3 and 4 correlates well with the decreasing number of rotatable bonds in their respective diol monomeric fragments, i.e., hexamethylene, tetramethylene and 2,2-dimethyl-1,3-propylene, respectively. Similarly, since polymer 2 possesses the shortest monomeric linker (ethylene) it is not unexpected for this polymer to exhibit robust thermal profile. However, we believe the impressive thermal stability of polymer 5 is related to the central ether oxygens of its diethyleneglycol monomeric linkers which seem to form dipole-dipole crosslinks within the polymeric matrix, thus elevating the melting point of the polymer.
To further assess polymeric chemical stability in response to thermal challenge we evaluated the thermogravimeric profiles (TGA) of the polymers. TGA assesses changes in mass upon exposure to heat. All prepared polymers illustrated good chemical stabilities up to 300 °C. Nevertheless, they degraded rather quickly upon exposure to higher temperatures. The TGA traits of the prepared polymers are shown in figure C in the Supporting Information.
3.2. Preparation and Characterization of Copper-Polymer and Silver-Polymer Composite films
To generate the corresponding silver and copper complexes, the prepared polymers were cast as thin films on glass cover slips. The resulting films were then softened at 200 °C and soaked in copper (II) sulfate (saturated) or silver nitrate (10% w/v) solutions. The solutions were maintained at 45 °C to enhance metal diffusibility through the polymeric films. Atomic absorption spectrophotometry was employed to determine the amounts of complexed metals in the resulting films.
Table 3 shows the amounts of complexed copper or silver in different polymeric films.
Experimental section 4.2.4 and
Experimental section 4.3 provide complete details about the methodologies used.
Table 3.
Metal content in different polymeric films as determined by atomic absorption spectrophotometry.
Table 3.
Metal content in different polymeric films as determined by atomic absorption spectrophotometry.
| Polymer | Complexed Cu+2 | Complexed Ag+ |
|---|
| (mg/g composite)a | (mg /g composite) a |
|---|
| 1 | 1.20 ± 0.07 | 2.9 ± 1.2 |
| 2 | 4.00 ± 0.10 | 13.7 ± 1.4 |
| 3 | 3.28 ± 0.13 | 2.3 ± 0.7 |
| 4 | 1.38 ± 0.10 | 1.2 ± 1.5 |
| 5 | 3.62 ± 0.13 | 3.0 ± 0.9 |
Clearly from
Table 3, polymers
2 and
5 showed high capacities in capturing metal ions (
i.e., copper and silver). Polymer
2, however, illustrated the highest affinity to both metal ions, particularly silver. Apparently,
2 possesses an optimal diol length to accommodate metal ions within the chelating pyridine dicarboxylate units. On the other hand, the relatively high chelating efficiency of polymer
5 can be attributed to extra metal chelation power due to the extra ether oxygen atoms in the diethyleneglycol monomeric units.
To further probe the complexation process, we decided to assess the DSC and FTIR profiles of the polymer-metal matrices. Copper- and silver-complexed polymeric matrices were prepared by vigorously mixing saturated methanolic metal solutions with saturated polymeric chloroform solutions. The resulting precipitates were assessed by FTIR and DSC.
3.2.1. Spectroscopic and calorimetric characterization of copper-polymer complexes
The FTIR traits of the polymer-copper complexes revealed variable shifts in the carbonyl stretching vibrations upon complexaion.
Table 4 illustrates the shifts in polymeric carbonyl stretching vibrations upon complexation to copper, while figure D in Supporting Information shows the FTIR spectrums of copper complexes of the five polymers.
Table 4.
Characteristic carbonyl stretching vibrations of each polymer.
Table 4.
Characteristic carbonyl stretching vibrations of each polymer.
| | Ester Carbonyl Stretching Bandb (cm−1) |
|---|
| Polymer | Before Complexaion | Cu2+ Complexes | Ag2+ Complexes |
|---|
| 1 | 1741 | 1744 | 1722 |
| 2 | 1729 | 1711 | 1732 |
| 3 | 1750 | 1737 | 1723 |
| 4 | 1725 | 1737 | ----- |
| 5 | 1728 | 1711 | 1734 |
Clearly from
Table 4, polymer
1 exhibited negligible shift in its carbonyl stretching band upon complexation to copper ions, suggesting a minimal degree of carbonyl-mediated copper complexation in this case, which agrees with the relatively low copper levels in this complex as measured by atomic absorption (
Table 3). On the other hand, polymers
2,
3 and
5 illustrated significant downward shifts in their carbonyl stretching bands, indicating the formation of significant levels of copper complexes, which also agrees with their higher copper contents in
Table 3.
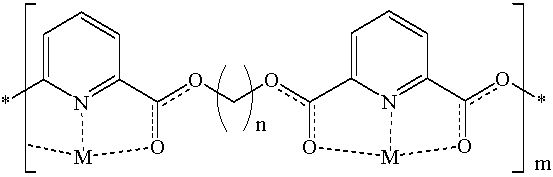
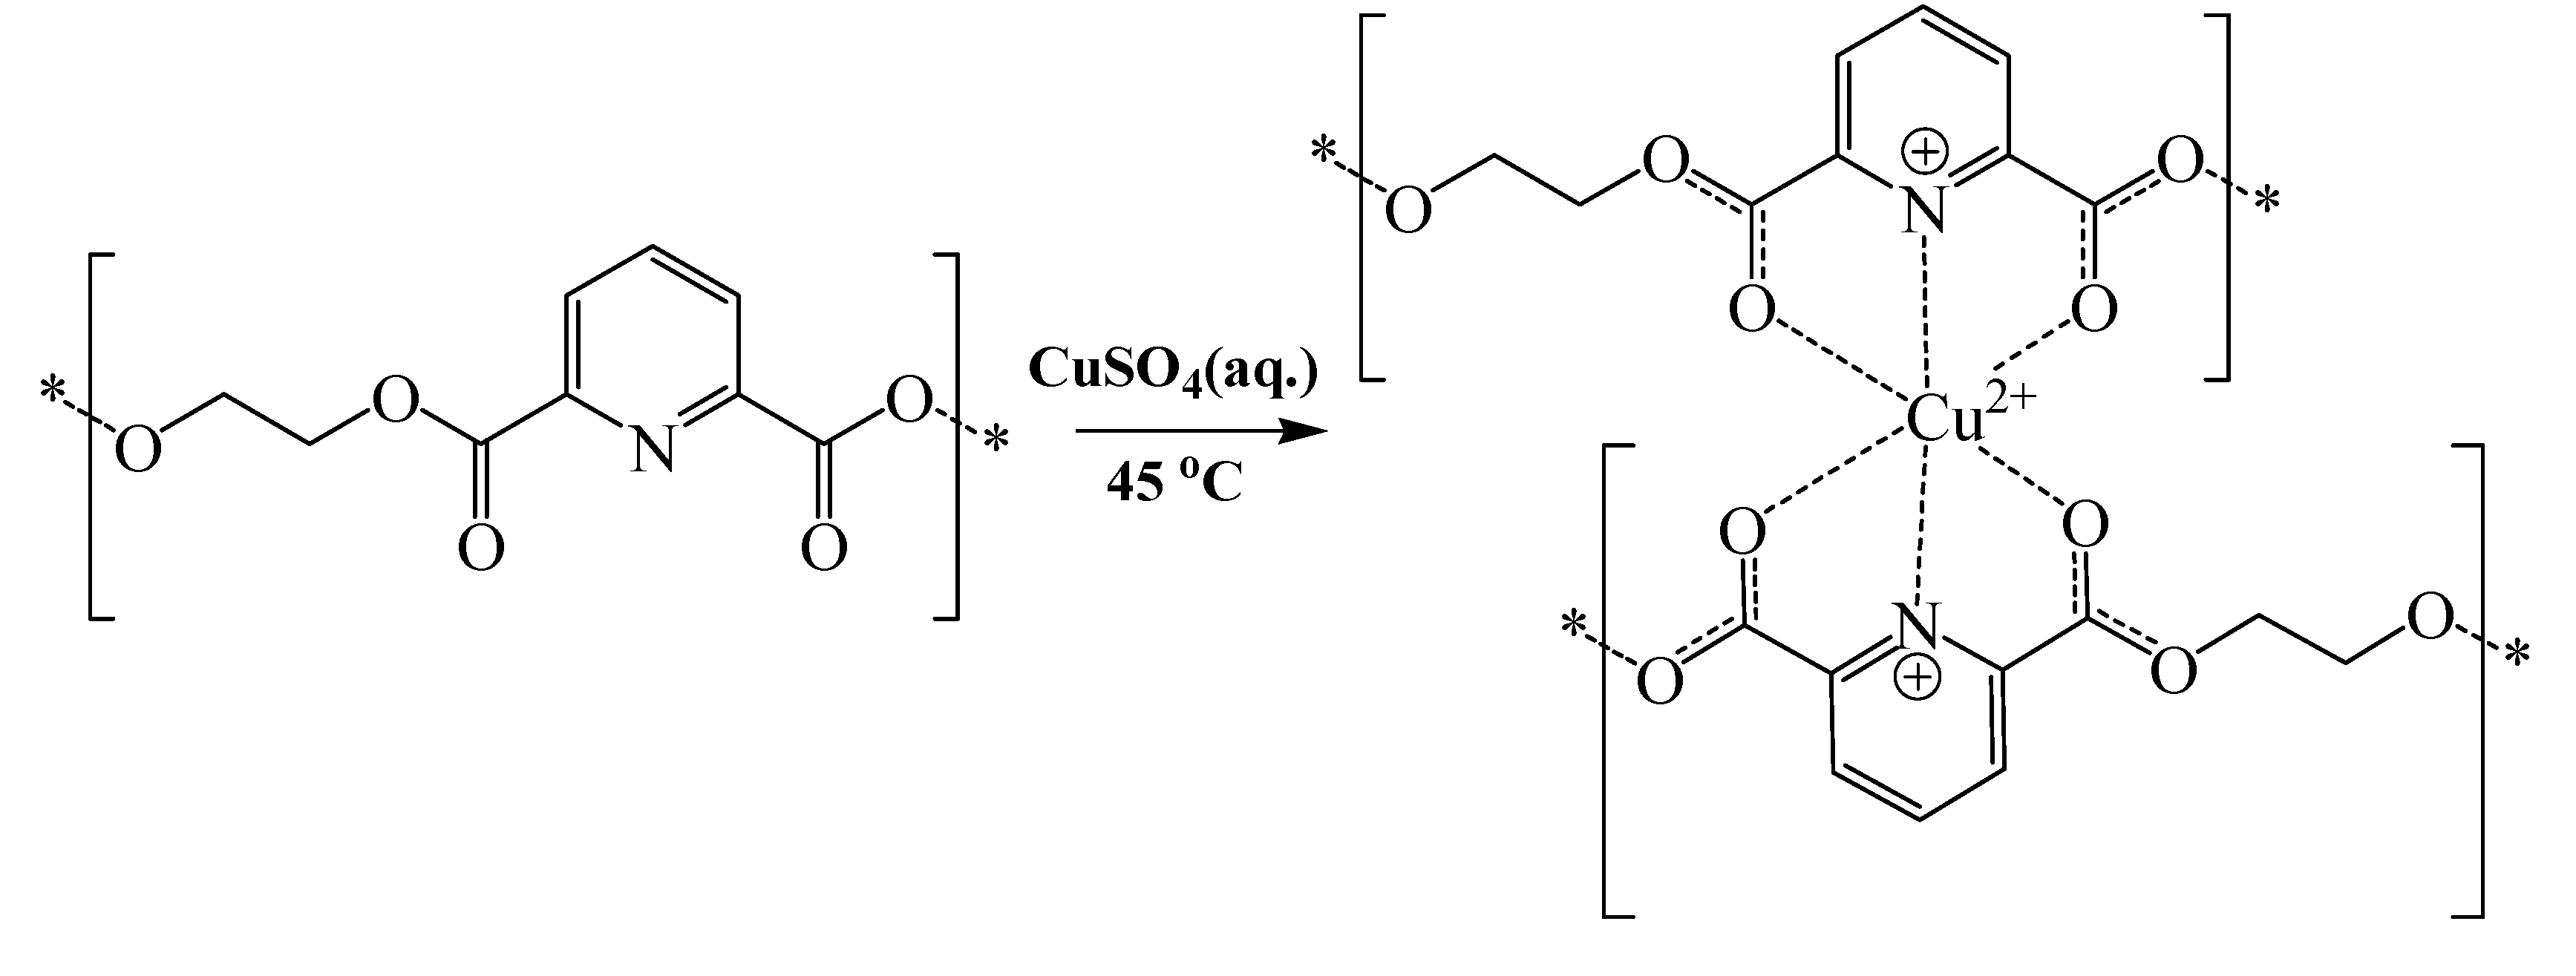
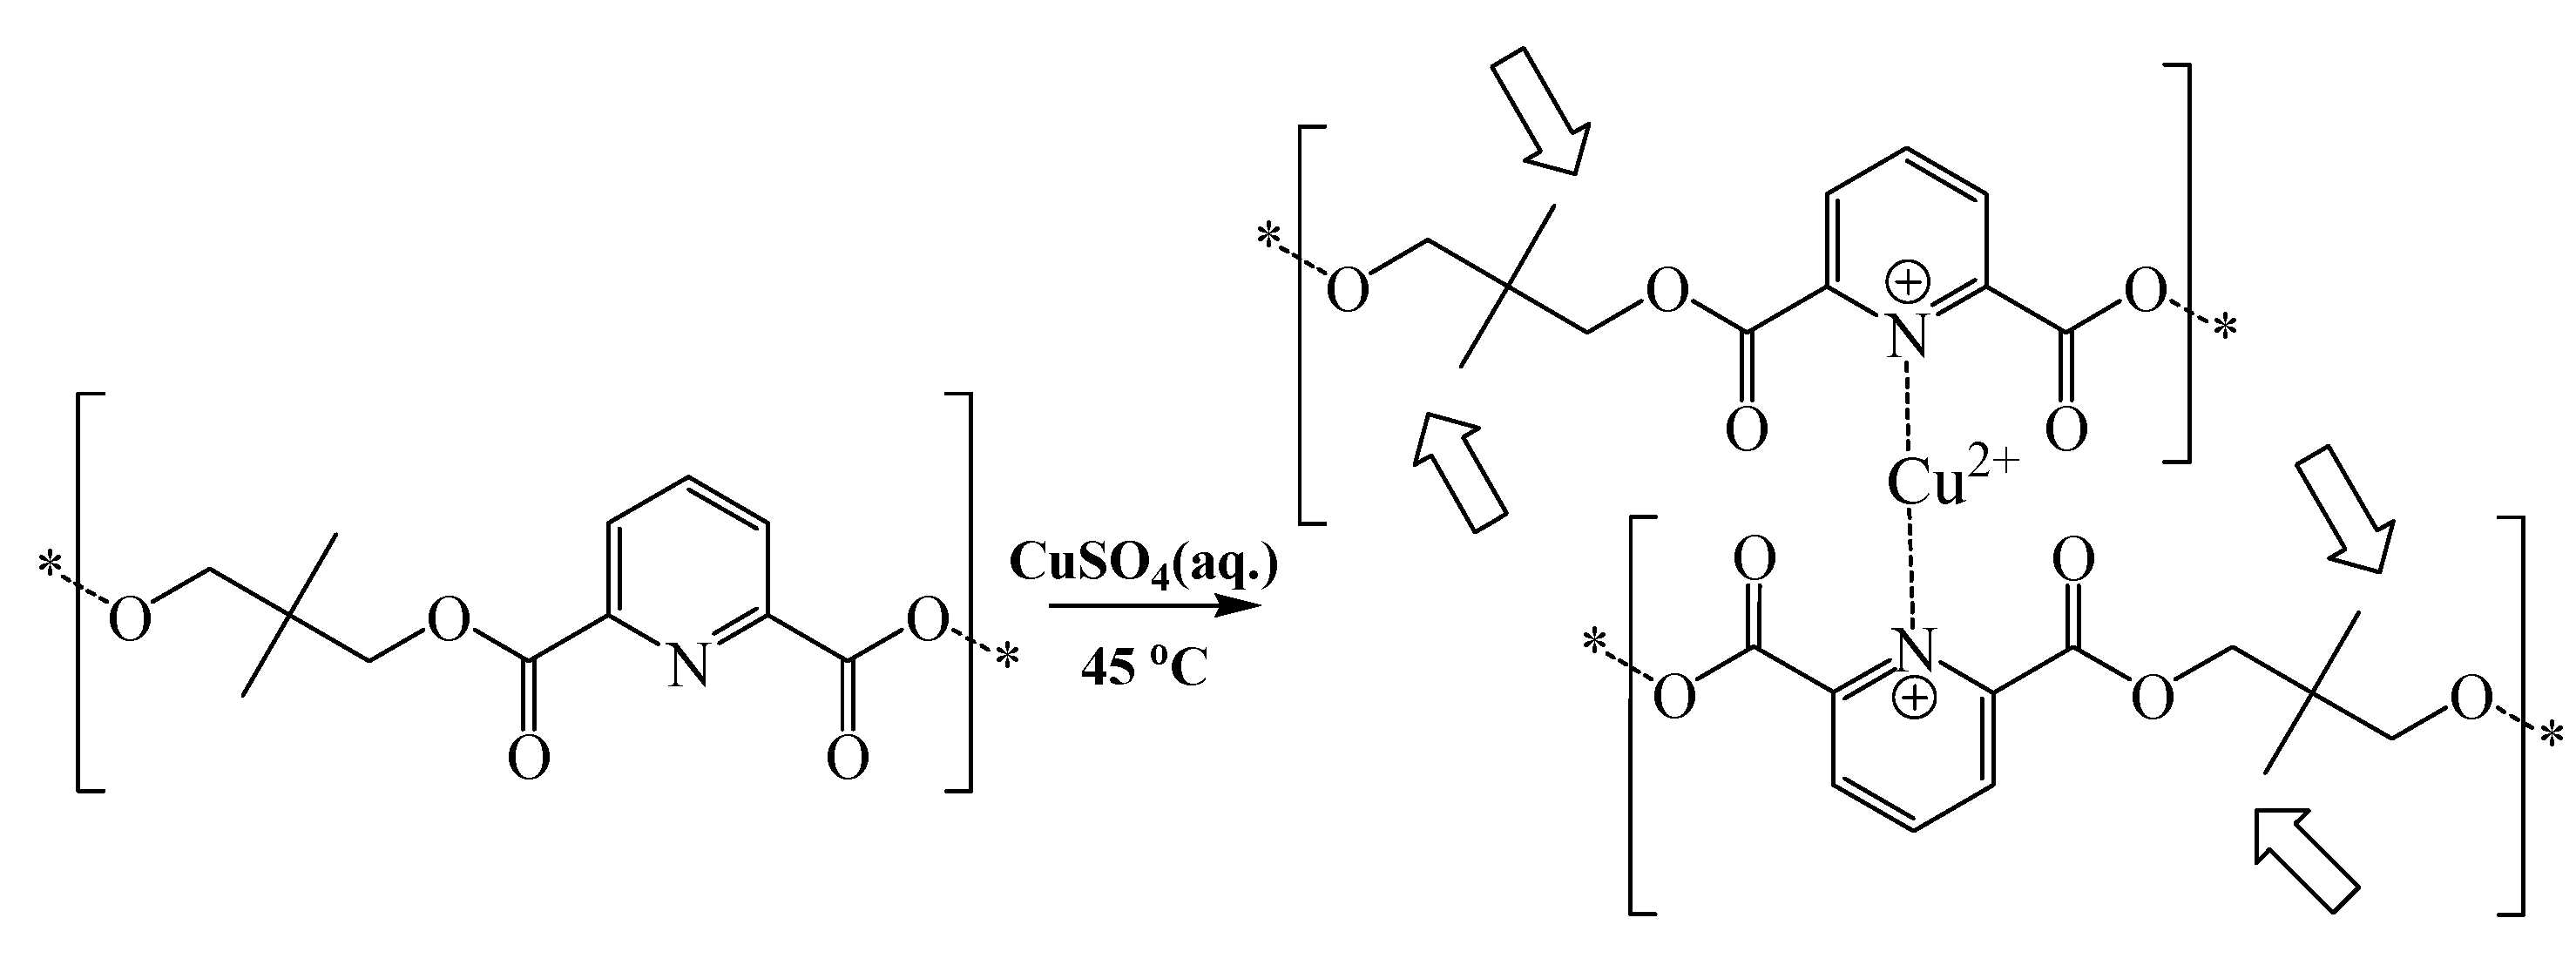
Scheme 2.
Schematic representation illustrating the proposed complexation of polymer 2 to copper.
Scheme 2.
Schematic representation illustrating the proposed complexation of polymer 2 to copper.
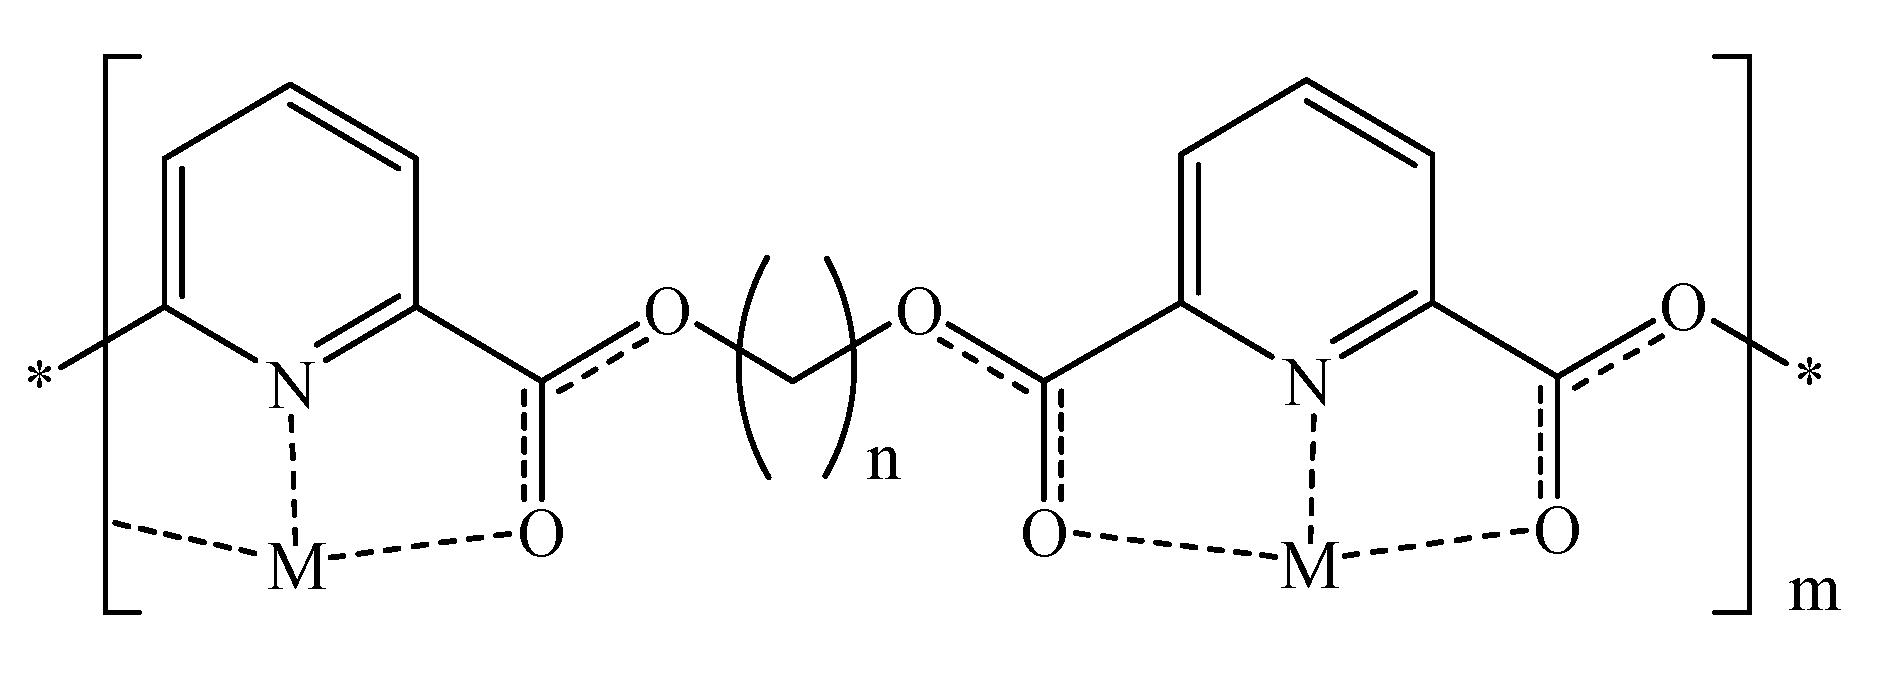
Strangely, the carbonyl stretching band of polymer
4 illustrated a significant upward shift upon complexation to copper. The most probable explanation for this behavior is related to the steric constrains imposed by the 2,2-dimethyl groups, which seem to hinder carbonyl coordination to copper ions, and therefore leaves the pyridine nitrogen as sole electron donor in the coordination complex. This effect seems to enhance the double bond character of the carbonyl groups and therefore increases their stretching vibrations, as illustrated in
Scheme 3.
Scheme 3.
Schematic representation illustrating the proposed copper complex with polymer 4. Broad arrows point to methyl groups believed to sterically hinder the complexation of copper ions to polymeric ester carbonyls.
Scheme 3.
Schematic representation illustrating the proposed copper complex with polymer 4. Broad arrows point to methyl groups believed to sterically hinder the complexation of copper ions to polymeric ester carbonyls.
Copper complexation caused significant alterations in the DSC traits of all five polymers.
Table 5 lists major endothermic and exothermic bands observed for the polymers before and after complexation with copper, while figure E in Supporting Information shows the corresponding DSC charts. Apparently, copper complexation rendered endothermic bands of polymers
1,
2,
3 and
4 sharper, which is probably attributed to the enthalpic homogeneity of the newly formed metal-ligand coordinate bonds compared to the heterogeneity of attractive interactions existing within polymeric matrices prior to complexation (e.g., hydrogen-bonding, diapole-diapole interactions,
etc.). Interestingly, the slight Tg step seen in the DSC trait of polymer
5 converted into deep endothermic band at 173 °C upon complexation to copper, which is indicative of extensive polymeric crosslinking due to metal complexation.
Table 5.
Characteristic DSC bands of polymeric-copper composites.
Table 5.
Characteristic DSC bands of polymeric-copper composites.
| | Endothermic bands (°C) b | Exothermic bands (°C) b |
|---|
| Polymera | Before Complexation | After Copper Complexation | Before Complexation | After Copper Complexation |
|---|
| 1 | 114 f | 242 f | 73 f | 270 f |
| 2 | 77 c,d,e | 260 f | --- | --- |
| 3 | 180f | 180 f | --- | --- |
| 4 | 260 | 170 f | --- | --- |
| 5 | --- | 173 | --- | --- |
Interestingly, the endothermic bands of polymers 1 and 2 shifted significantly upwards upon polymer-copper complexation, while polymer 3 maintained its endothermic band at 180 °C upon complexation. On the other hand, polymer 4 showed a significant downward shift in its endothermic band after complexation to copper. We believe these apparently contradictory behaviors can be attributed to the competing effects of polymeric flexibility and polymeric crosslinking by copper ions. Copper complexation, although minimal in polymer 1 (as deduced earlier from FTIR and copper loading levels), seems to significantly limit its polymeric flexibility causing the apparent upward shift in the endothermic band. A similar explanation is applicable in the case of polymer 2, albeit more pronounced than polymer 1. In case of polymer 3, it seems that the uncomplexed polymer exhibits comparable polymeric flexibility to the crosslinked version, which explains the small change in the position of the endothermic band upon copper complexation.
The thermal behavior of polymer 4 might be explained based on the limited flexibility of the uncomplexed polymeric backbone due to the 2,2-dimethyl substituents, which seems to cause high-temperature endothermic bands seen in the uncomplexed polymer case. On the other hand, copper-complexation seems to disturb existing attractive interactions within the polymeric matrix leading to downward shift in the corresponding endothermic band.
Regarding the exothermic bands seen in the DSC of polymer 1, apparently, the relatively low temperature of the exothermic band seen before copper complexation (at 73 °C) suggests it is related to polymeric rearrangement rather than degradation. However, upon copper-crosslinking, this band was replaced by another exothermic degradation band at 270 °C.
3.2.2. Spectroscopic and calorimetric characterization of silver-polymer complexes
The FTIR traits of the polymer-silver complexes revealed different carbonyl stretching shifts compared to copper complexation.
Table 4 compares the shifts in polymeric carbonyl stretching vibrations upon complexation to copper and silver, while figures D and F in the Supporting Information show the FTIR spectrums of the copper and silver complexes of the five polymers.
Clearly from
Table 4, polymers
2 and
5 exhibited negligible shifts in carbonyl stretching bands upon complexation to silver ions suggesting a minimal degree of carbonyl-mediated coordination to silver, which contradicts the high silver contents of their complexes as measured by atomic absorption (particularly polymer
2,
Table 3). Apparently, polymers
2 and
5 bind to silver ions via their pyridine nitrogen atoms thus causing minimal shifts in the carbonyl stretching bands, reminiscent of copper complexation to polymer
4 (
Scheme 3). This proposition is supported by the pronounced changes seen in the DSC profiles of polymers
2 and
5 upon complexation with silver (
Table 6 and figure G in the Supporting Information). On the other hand, carbonyl stretching bands of polymers
1 and
3 showed a significant downward shifts upon complexation to silver. Apparently, silver ions coordinate to the carbonyl groups of these polymers causing significant reduction in their double bond character, a similar scenario to that shown in
Scheme 2. The complexations are clearly evident from the significant alteration in the DSC profiles of polymers
1 and
3 upon complexation to silver (Figures B and G in the Supporting Information).
Table 6.
Characteristic DSC bands of polymeric-silver composites.
Table 6.
Characteristic DSC bands of polymeric-silver composites.
| | Endothermic bands (oC) b | Exothermic bands (oC) b |
|---|
| Polymer a | Before Complexation | After silver Complextaion | Before Complexation | After silverComplexation |
|---|
| 1 | 114 f | 138 c,e | 73 f | 204 f |
| 2 | 77 c,d,e | 111 c,e | --- | 222 f, 274f |
| 3 | 180f | --- | --- | 267 f |
| 4 | 260 | --- | --- | 180 c,e |
| 5 | --- | 163 c,e | --- | 210 f |
Strangely, the carbonyl stretching band of polymer 4 disappeared completely upon complexation to silver. We believe this behavior is caused silver-mediated degradation of this polymer through which the pyridine-dicarboxylate units loose their carboxylic acid groups. DSC trait of polymer 4 supports this conclusion: it lacks any significant endothermic or exothermic bands, in stark contrast to the DSC profiles of other polymers.
However, silver complexation caused significant alterations in the DSC traits of the remaining four polymers.
Table 6 lists major endothermic and exothermic bands observed for the polymers before and after complexation with silver, while figure G in the Supporting Information shows the corresponding DSC charts. Silver complexation shortened the endothermic bands of polymers
1,
2,
3 and
5, which is probably attributed to disruption of existing inter-polymer interactions (e.g., hydrogen-bonding, diapole-diapole interactions,
etc.) upon complexation with silver ions. Most notably, the silver complexes of these polymers (
i.e.,
1,
2,
3 and
5) exhibit intense sharp exothermic bands above (or at) 200 °C. We believe this behavior is related to certain three-dimensional rearrangement of the polymer-silver composite matrix upon heating.
3.3. The Antibacterial Properties of Copper-Polymer and Silver-Polymer films
Clearly from
Table 7, both silver- and copper-complexed polymers diplayed significant anti-biofilm properties compared to uncoated glass cover slips. Unsurprisingly, silver-based polymers seemed superior to copper analogues, which agrees with the findings of Harrison
et al. [
46],
i.e., silver is one of the most toxic metals on different microorganisms including the
Pseudomonas strain used in the current study. However, this trend seems to be reversed in the case of silver complex of polymer
2.
Table 7.
Nnumber of attached bacteria to composite polymer-metal films after 2 h of incubation in 1 × 10⁵ - 1 × 10⁶ CFU a/mL.
Table 7.
Nnumber of attached bacteria to composite polymer-metal films after 2 h of incubation in 1 × 10⁵ - 1 × 10⁶ CFU a/mL.
| | Average Bacterial Colonization Density |
|---|
| (CFU a/cm2) ± Standard Deviation |
|---|
| Polymers | Ag-Complex | Cu-complex |
|---|
| 1 | 0.7 ± 0.6 | 11 ± 5 |
| 2 | 40 ± 11.4 | 5 ± 5 |
| 3 | 0.8 ± 0.5 b | 0.3 ± 0.4 b |
| 4 | 0.4 ± 0.4 b | 0.2 ± 0.4 b |
| 5 | 1.6 ± 1.2 | 4 ± 6 |
| Glass cover slips | 2440.1 ± 279.9 |
In an attempt to explain the behavior of polymer
2, we studied the amounts of released silver from each composite film after incubation in microbial media over 24 h.
Table 8 summarizes the results. Clearly, polymer
2 showed the highest levels of released silver over this time interval, suggesting that high polymeric metal leaching rates coincided with inferior anti-biofilm polymeric properties. This behavior can be explained as follows: Leached metal ions tend to suppress planktonic bacteria prompting bacteria to form biofilms via triggering SOS response [
47]. In fact, biofilms are known to resist intoxication by heavy metals in minimal media [
17,
48]. Furthermore, silver leaching reduces the amount of silver within the vicinity of polymeric surface, which should further encourage bacterial growth at polymeric surface.
Table 8.
Released Ag+ in microbial testing media.
Table 8.
Released Ag+ in microbial testing media.
| Polymer | Released Ag+(ppm) from 1 mg composite After 24 h a |
|---|
| 1 | 1.3 ± 1.1 |
| 2 | 4.2 ± 1.7 |
| 3 | 1.8 ± 2.4 |
| 4 | 0.9 ± 2.0 |
| 5 | 2.6 ± 1.2 |
These explanations are supported by the anti-biofilm behavior of the silver complex of polymer 4, which combined the best anti-biofilm behavior and least silver release rates. Overall, it seems that effective polymeric resistance to biofilm formation requires slow-release of metal ions at the polymeric surface to guarantee high concentration of biocidal metal within the vicinity of the polymeric surface while minimizing the concentration of the metal within the bulk of the growth medium.


