Phenolics Content and Antioxidant Activity of Tartary Buckwheat from Different Locations

Abstract
:1. Introduction
2. Results and Discussion
2.1. Total Phenolics and Flavonoids Content

| Variety | Location | Phenolic content | Flavonoid content | ||||
|---|---|---|---|---|---|---|---|
| (μmol of gallic acid eq./100 g DW) | (μmol of rutin eq./100 g DW) | ||||||
| Free | Bound | Total | Free | Bound | Total | ||
| Xingku No.2 | Sichuan | 9590 ± 428 a | 71 ± 10 d | 9660 ± 433 a | 1980 ± 210 bc | 97 ± 12 d | 2077 ± 198 c |
| Ningxia | 8410 ± 621 b | 353 ± 16 ab | 8760 ± 614 abc | 3014 ± 188 a | 135 ± 23 d | 3149 ± 187 a | |
| Gansu | 4820 ± 260 d | 333 ± 26 b | 5150 ± 283 d | 2161 ± 170 b | 318 ± 14 c | 2479 ± 157 bc | |
| Diqing | Sichuan | 7310 ± 412 c | 394 ± 3 a | 7700 ± 414 c | 1719 ± 77 c | 541 ± 5 a | 2260 ± 81 bc |
| Ningxia | 8150 ± 337 bc | 253 ± 13 c | 8400 ± 342 bc | 1871 ± 124 bc | 593 ± 85 a | 2464 ± 151 bc | |
| Gansu | 8950 ± 138 ab | 310 ± 20 b | 9260 ± 118 ab | 2109 ± 84 bc | 425 ± 26 b | 2534 ± 102 b | |
2.2. Phenolic Compound Profiles
| Variety | Location | Free (mg/100 g DW) | Bound (mg/100 g DW) | Total (mg/100 g DW) |
|---|---|---|---|---|
| (A) Rutin composition | ||||
| Xingku No.2 | Sichuan | 1444.59 ± 1.75 a | 3.28 ± 0.06 d | 1447.87 ± 1.69 a |
| Ningxia | 1213.98 ± 9.05 e | 2.94 ± 0.04 e | 1216.92 ± 9.09 e | |
| Gansu | 1344.47 ± 5.86 b | 3.83 ± 0.04 b | 1348.30 ± 5.90 b | |
| Diqing | Sichuan | 1322.00 ± 10.59 c | 3.59 ± 0.06 c | 1325.59 ± 10.65 c |
| Ningxia | 517.45 ± 4.34 f | 1.09 ± 0.03 f | 518.54 ± 4.32 f | |
| Gansu | 1247.01 ± 6.74 d | 11.49 ± 0.04 a | 1258.50 ± 6.77 d | |
| (B) Quercetin composition | ||||
| Xingku No.2 | Sichuan | 478.76 ± 2.39 d | 0.61 ± 0.01 c | 479.37 ± 2.40 d |
| Ningxia | 425.09 ± 4.03 e | 0.56 ± 0.01 d | 425.65 ± 4.03 e | |
| Gansu | 621.82 ± 2.28 b | 0.72 ± 0.02 b | 622.54 ± 2.29 b | |
| Diqing | Sichuan | 538.42 ± 2.60 c | 0.61 ± 0.02 c | 539.03 ± 2.61 c |
| Ningxia | 857.23 ± 3.66 a | 0.39 ± 0.01 e | 857.62 ± 3.66 a | |
| Gansu | 626.59 ± 3.14 b | 0.86 ± 0.03 a | 627.46 ± 3.12 b | |
| (C) Catechin composition | ||||
| Xingku No.2 | Sichuan | 4.40 ± 0.03 a | 7.61 ± 0.03 d | 12.01 ± 0.05 b |
| Ningxia | 3.74 ± 0.03 b | 6.34 ± 0.05 e | 10.08 ± 0.05 d | |
| Gansu | 3.13 ± 0.04 c | 16.84 ± 0.04 a | 19.96 ± 0.01 a | |
| Diqing | Sichuan | 0.95 ± 0.02 f | 8.83 ± 0.04 c | 9.78 ± 0.06 e |
| Ningxia | 2.95 ± 0.03 d | 5.94 ± 0.04 f | 8.89 ± 0.06 f | |
| Gansu | 2.31 ± 0.04 e | 9.02 ± 0.07 b | 11.34 ± 0.06 c | |
| (D) p-Hydroxybenzoic acid composition | ||||
| Xingku No.2 | Sichuan | 5.39 ± 0.15 b | 0.11 ± 0.01 d | 5.51 ± 0.14 b |
| Ningxia | 2.95 ± 0.03 c | 0.14 ± 0.01 c | 3.10 ± 0.03 c | |
| Gansu | 8.56 ± 0.32 a | 0.21 ± 0.01 a | 8.78 ± 0.31 a | |
| Diqing | Sichuan | 5.64 ± 0.07 b | 0.10 ± 0.01 e | 5.74 ± 0.07 b |
| Ningxia | 2.22 ± 0.00 c | nd | 2.22 ± 0.00 c | |
| Gansu | 5.00 ± 0.03 b | 0.19 ± 0.01 b | 5.18 ± 0.04 b | |
| (E) Ferulic acid composition | ||||
| Xingku No.2 | Sichuan | 6.4 ± 0.42 a | 0.89 ± 0.01 b | 7.29 ± 0.39 a |
| Ningxia | 2.07 ± 0.01 e | 0.78 ± 0.01 d | 2.85 ± 0.01 e | |
| Gansu | 1.00 ± 0.01 f | 0.86 ± 0.00 c | 1.86 ± 0.01 f | |
| Diqing | Sichuan | 4.31 ± 0.09 b | 0.61 ± 0.01 e | 4.92 ± 0.07 b |
| Ningxia | 2.73 ± 0.21 d | 0.48 ± 0.02 f | 3.21 ± 0.20 d | |
| Gansu | 3.73 ± 0.12 c | 0.98 ± 0.04 a | 4.71 ± 0.11 c | |
| (F) Protocatechuic acid composition | ||||
| Xingku No.2 | Sichuan | 3.16 ± 0.11 a | 1.47 ± 0.01 b | 4.63 ± 0.13 a |
| Ningxia | 1.81 ± 0.02 b | 1.41 ± 0.02 c | 3.21 ± 0.02 c | |
| Gansu | 1.58 ± 0.03 c | 2.15 ± 0.02 a | 3.73 ± 0.04 b | |
| Diqing | Sichuan | 1.32 ± 0.05 d | 0.4 ± 0.00 e | 1.73 ± 0.06 f |
| Ningxia | 1.6 ± 0.01 c | 0.5 ± 0.03 d | 2.1 ± 0.04 e | |
| Gansu | 1.14 ± 0.01 e | 1.49 ± 0.04 b | 2.64 ± 0.05 d | |
| (G) p-Coumaric acid composition | ||||
| Xingku No.2 | Sichuan | 0.72 ± 0.03 a | 0.26 ± 0.01 a | 0.98 ± 0.04 a |
| Ningxia | 0.23 ± 0.00 d | nd | 0.23 ± 0.00 e | |
| Gansu | 0.5 ± 0.02 b | 0.18 ± 0.02 b | 0.68 ± 0.03 | |
| Diqing | Sichuan | 0.38 ± 0.01 c | 0.11 ± 0.00 c | 0.49 ± 0.01 c |
| Ningxia | 0.18 ± 0.02 e | 0.11 ± 0.01 c | 0.29 ± 0.02 d | |
| Gansu | 0.51 ± 0.01 b | nd | 0.51 ± 0.01 c | |
| (H) Gallic acid composition | ||||
| Xingku No.2 | Sichuan | 0.62 ± 0.01 a | nd | 0.62 ± 0.01 a |
| Ningxia | 0.48 ± 0.01 c | nd | 0.48 ± 0.01 c | |
| Gansu | 0.48 ± 0.00 c | nd | 0.48 ± 0.00 c | |
| Diqing | Sichuan | 0.48 ± 0.00 c | nd | 0.48 ± 0.00 c |
| Ningxia | 0.49 ± 0.02 c | nd | 0.49 ± 0.02 c | |
| Gansu | 0.55 ± 0.05 b | nd | 0.55 ± 0.05 b | |
| (I) Caffeic acid composition | ||||
| Xingku No.2 | Sichuan | 0.49 ± 0.00 a | nd | 0.49 ± 0.00 a |
| Ningxia | nd | 0.12 ± 0.00 b | 0.12 ± 0.00 b | |
| Gansu | 0.23 ± 0.01 c | 0.12 ± 0.00 b | 0.35 ± 0.00 c | |
| Diqing | Sichuan | nd | nd | nd |
| Ningxia | 0.32 ± 0.02 b | nd | 0.32 ± 0.02 d | |
| Gansu | 0.19 ± 0.01 d | 0.17 ± 0.02 a | 0.36 ± 0.03 b | |
| (J) Vanillic acid composition | ||||
| Xingku No.2 | Sichuan | nd | 0.21 ± 0.01 d | 0.21 ± 0.01 f |
| Ningxia | 0.53 ± 0.01c | 0.14 ± 0.01 e | 0.67 ± 0.02 c | |
| Gansu | nd | 0.52 ± 0.00 a | 0.52 ± 0.00 d | |
| Sichuan | 1.17 ± 0.01a | 0.43 ± 0.01 b | 1.6 ± 0.01 a | |
| Ningxia | nd | 0.28 ± 0.02 c | 0.28 ± 0.02 c | |
| Gansu | 0.6 ± 0.00b | 0.43 ± 0.01 b | 1.04 ± 0.01 b | |
| (K) Syringic acid composition | ||||
| Xingku No.2 | Sichuan | 0.18 ± 0.01 a | nd | 0.18 ± 0.01 a |
| Ningxia | nd | nd | nd | |
| Gansu | 0.12 ± 0.00 b | nd | 0.12 ± 0.00 b | |
| Diqing | Sichuan | nd | nd | nd |
| Ningxia | nd | nd | nd | |
| Gansu | nd | nd | nd | |
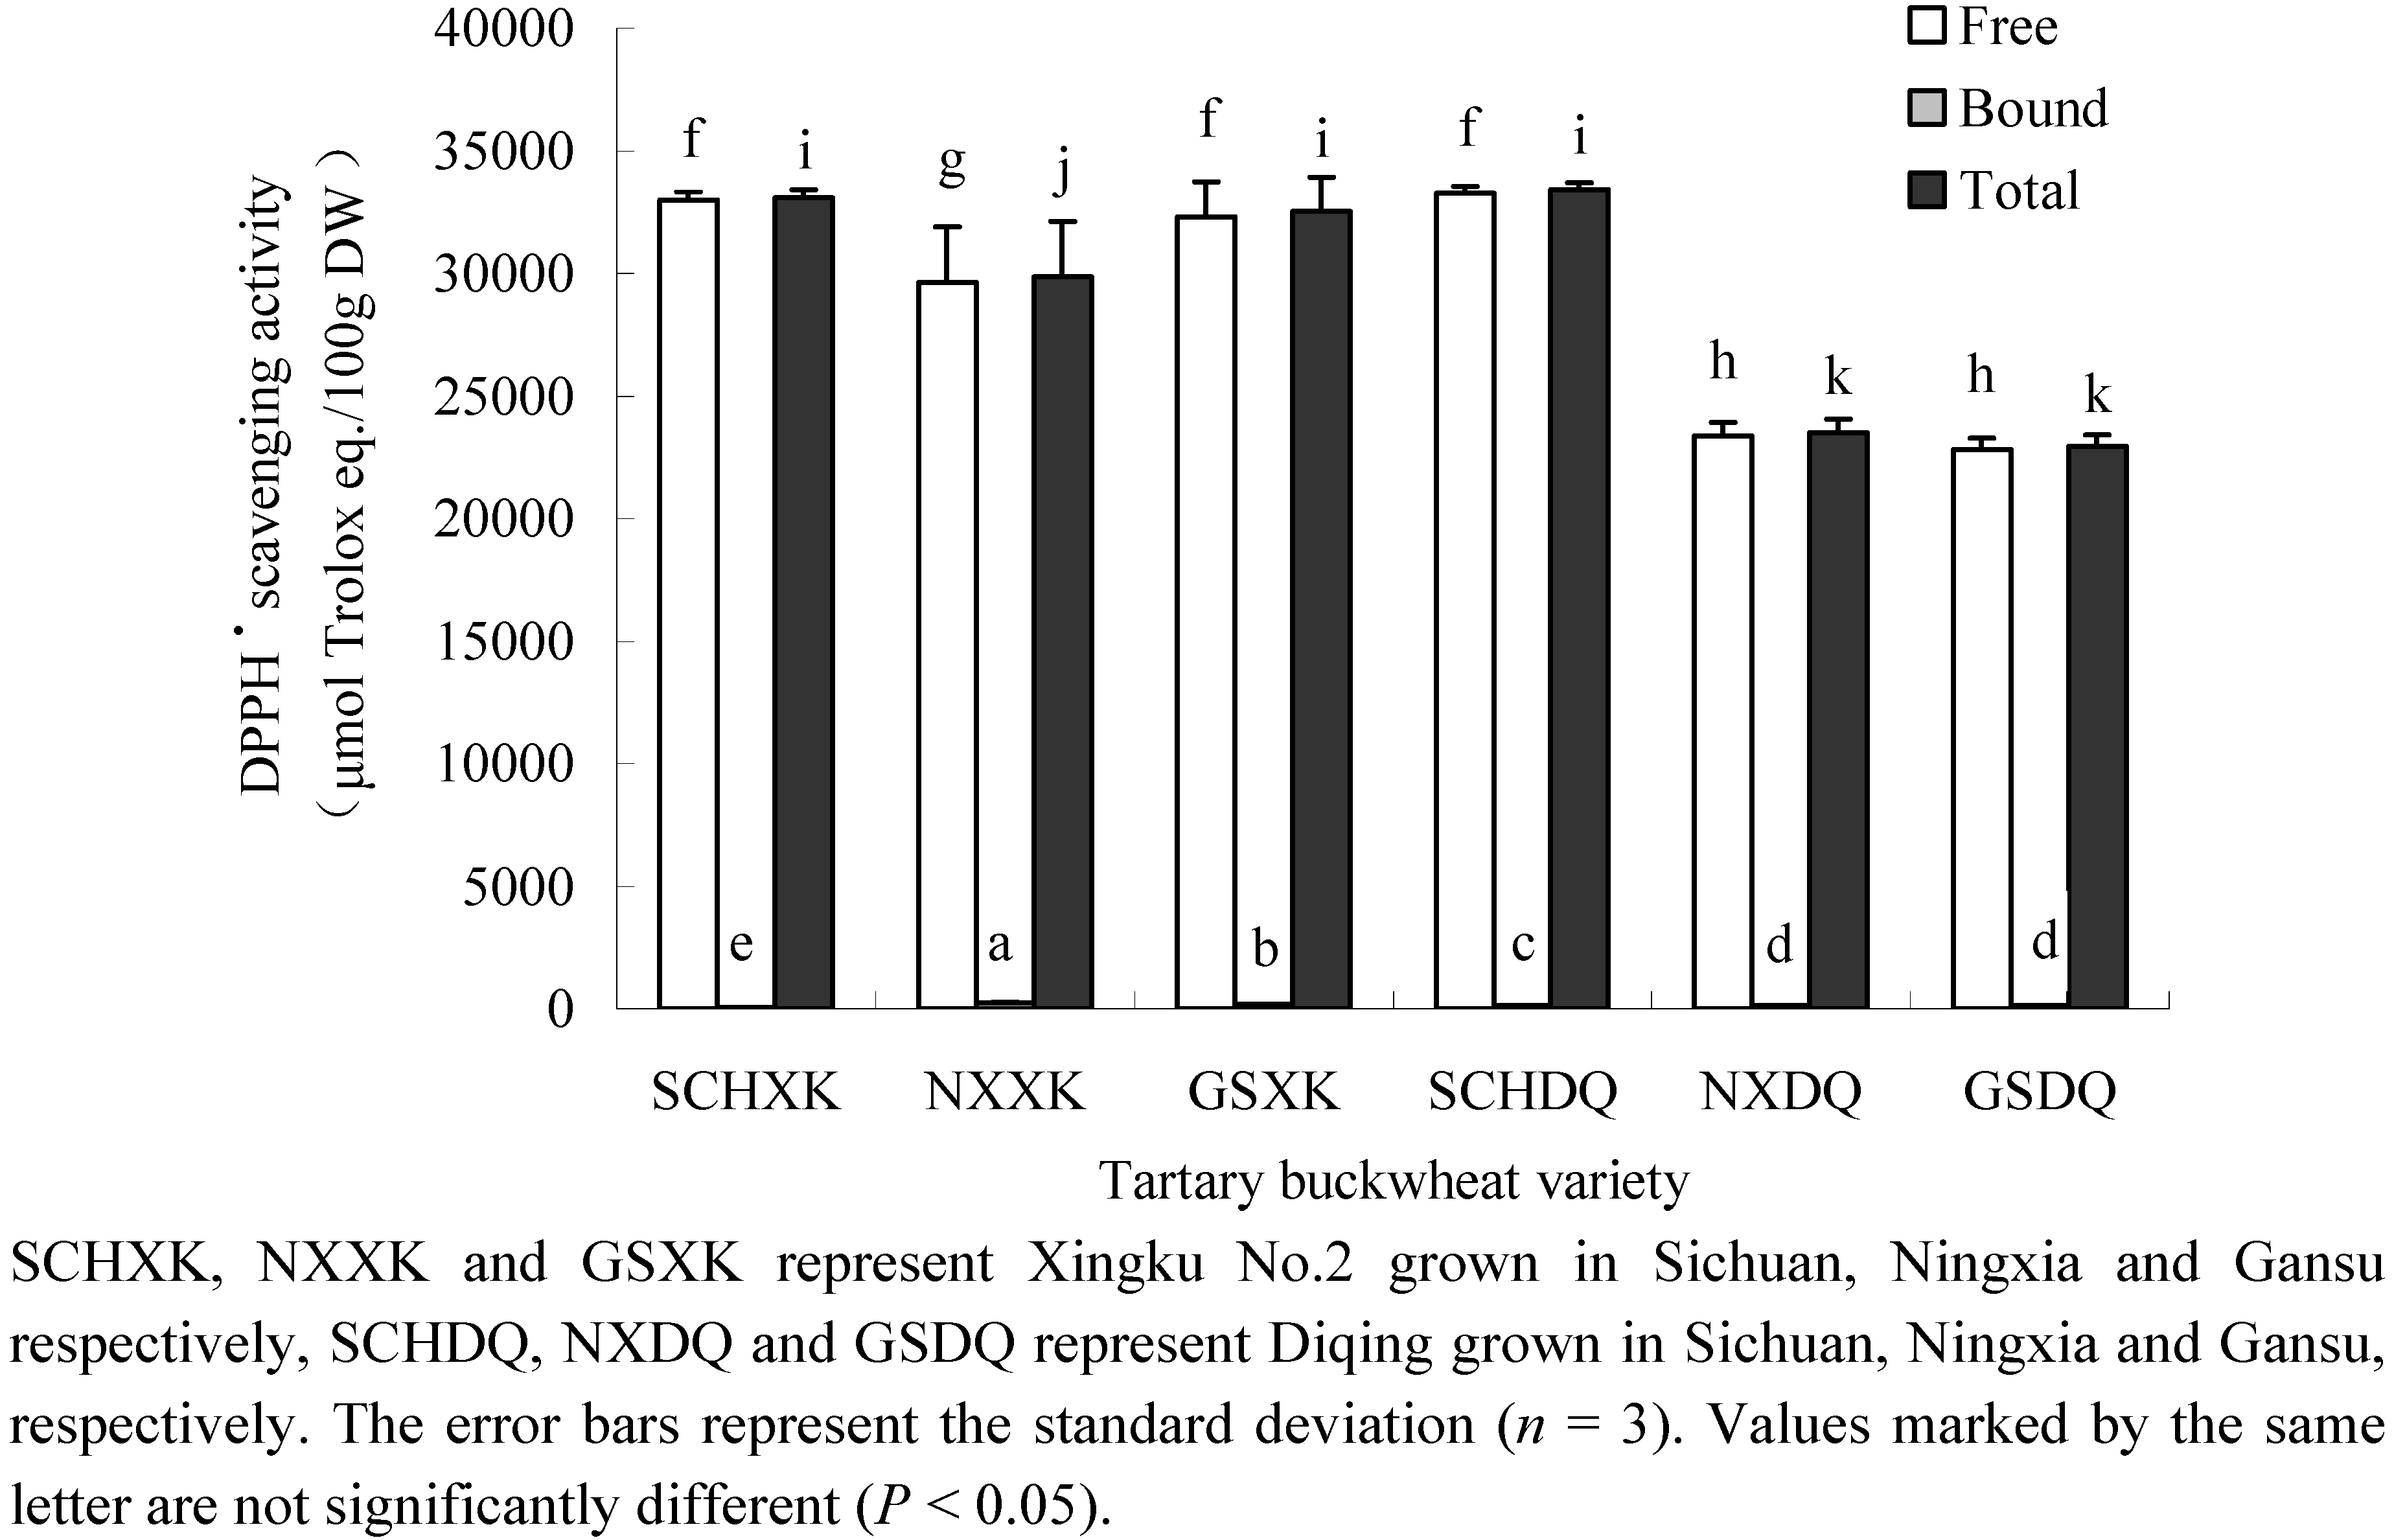
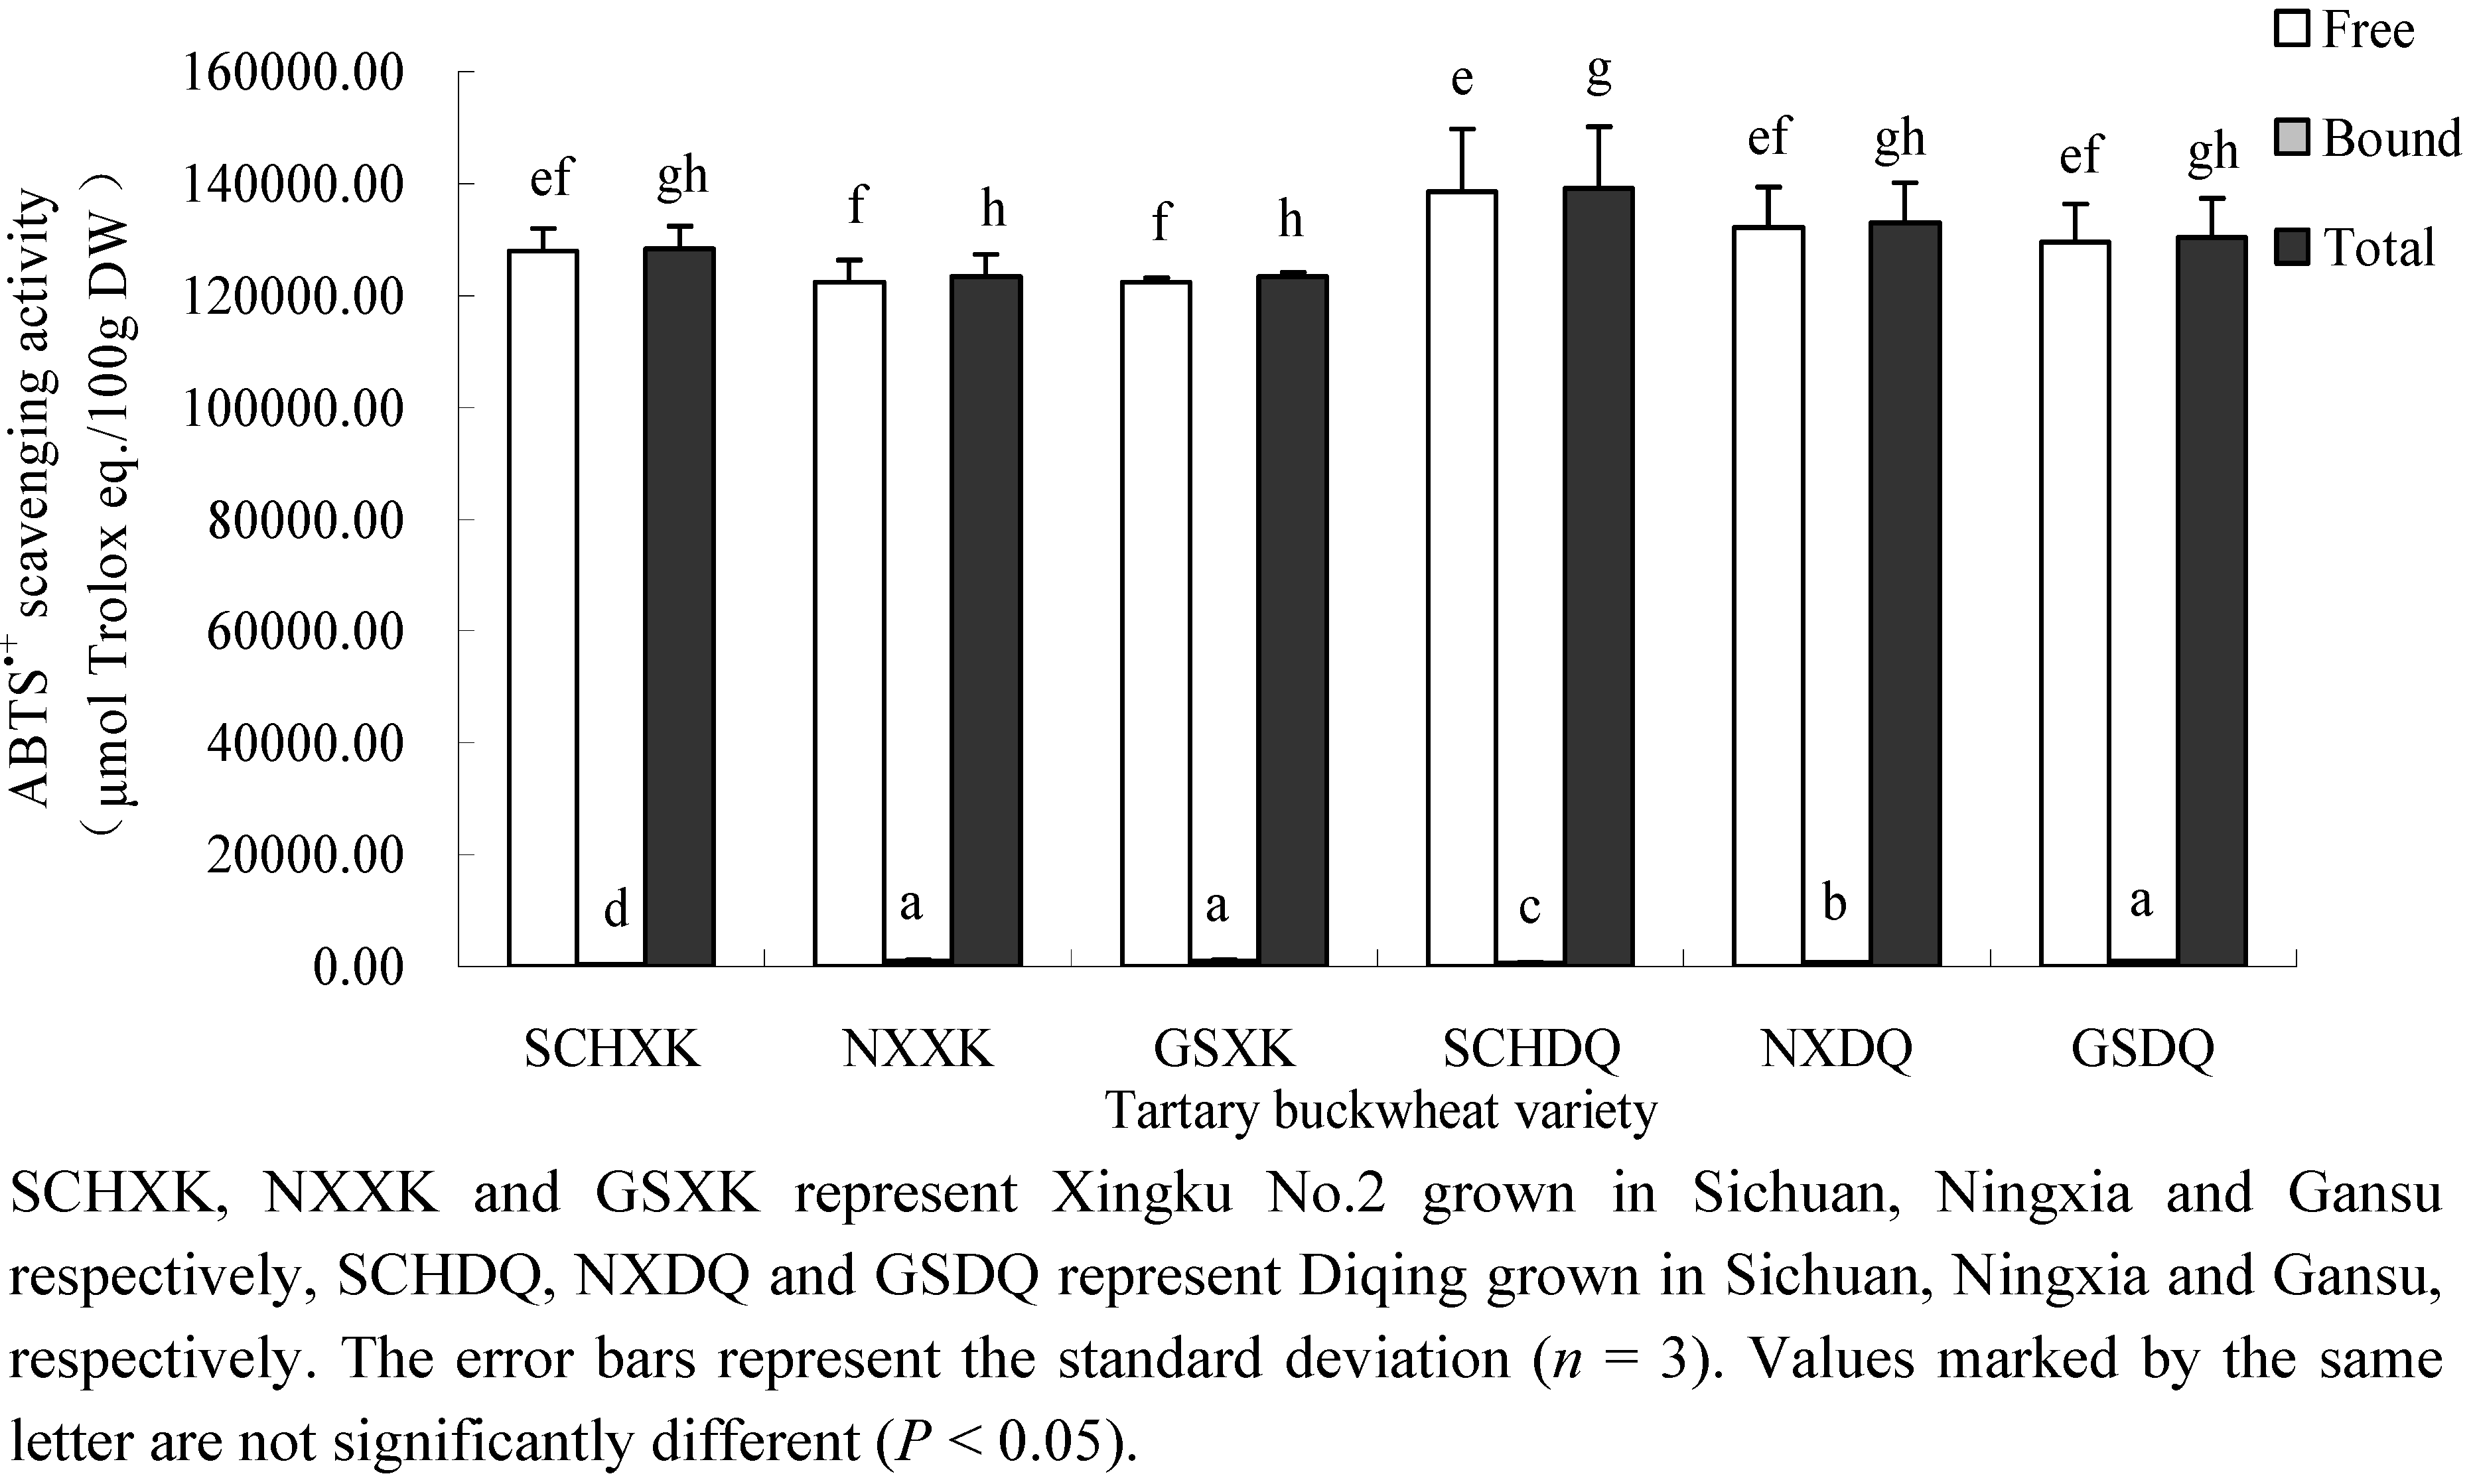
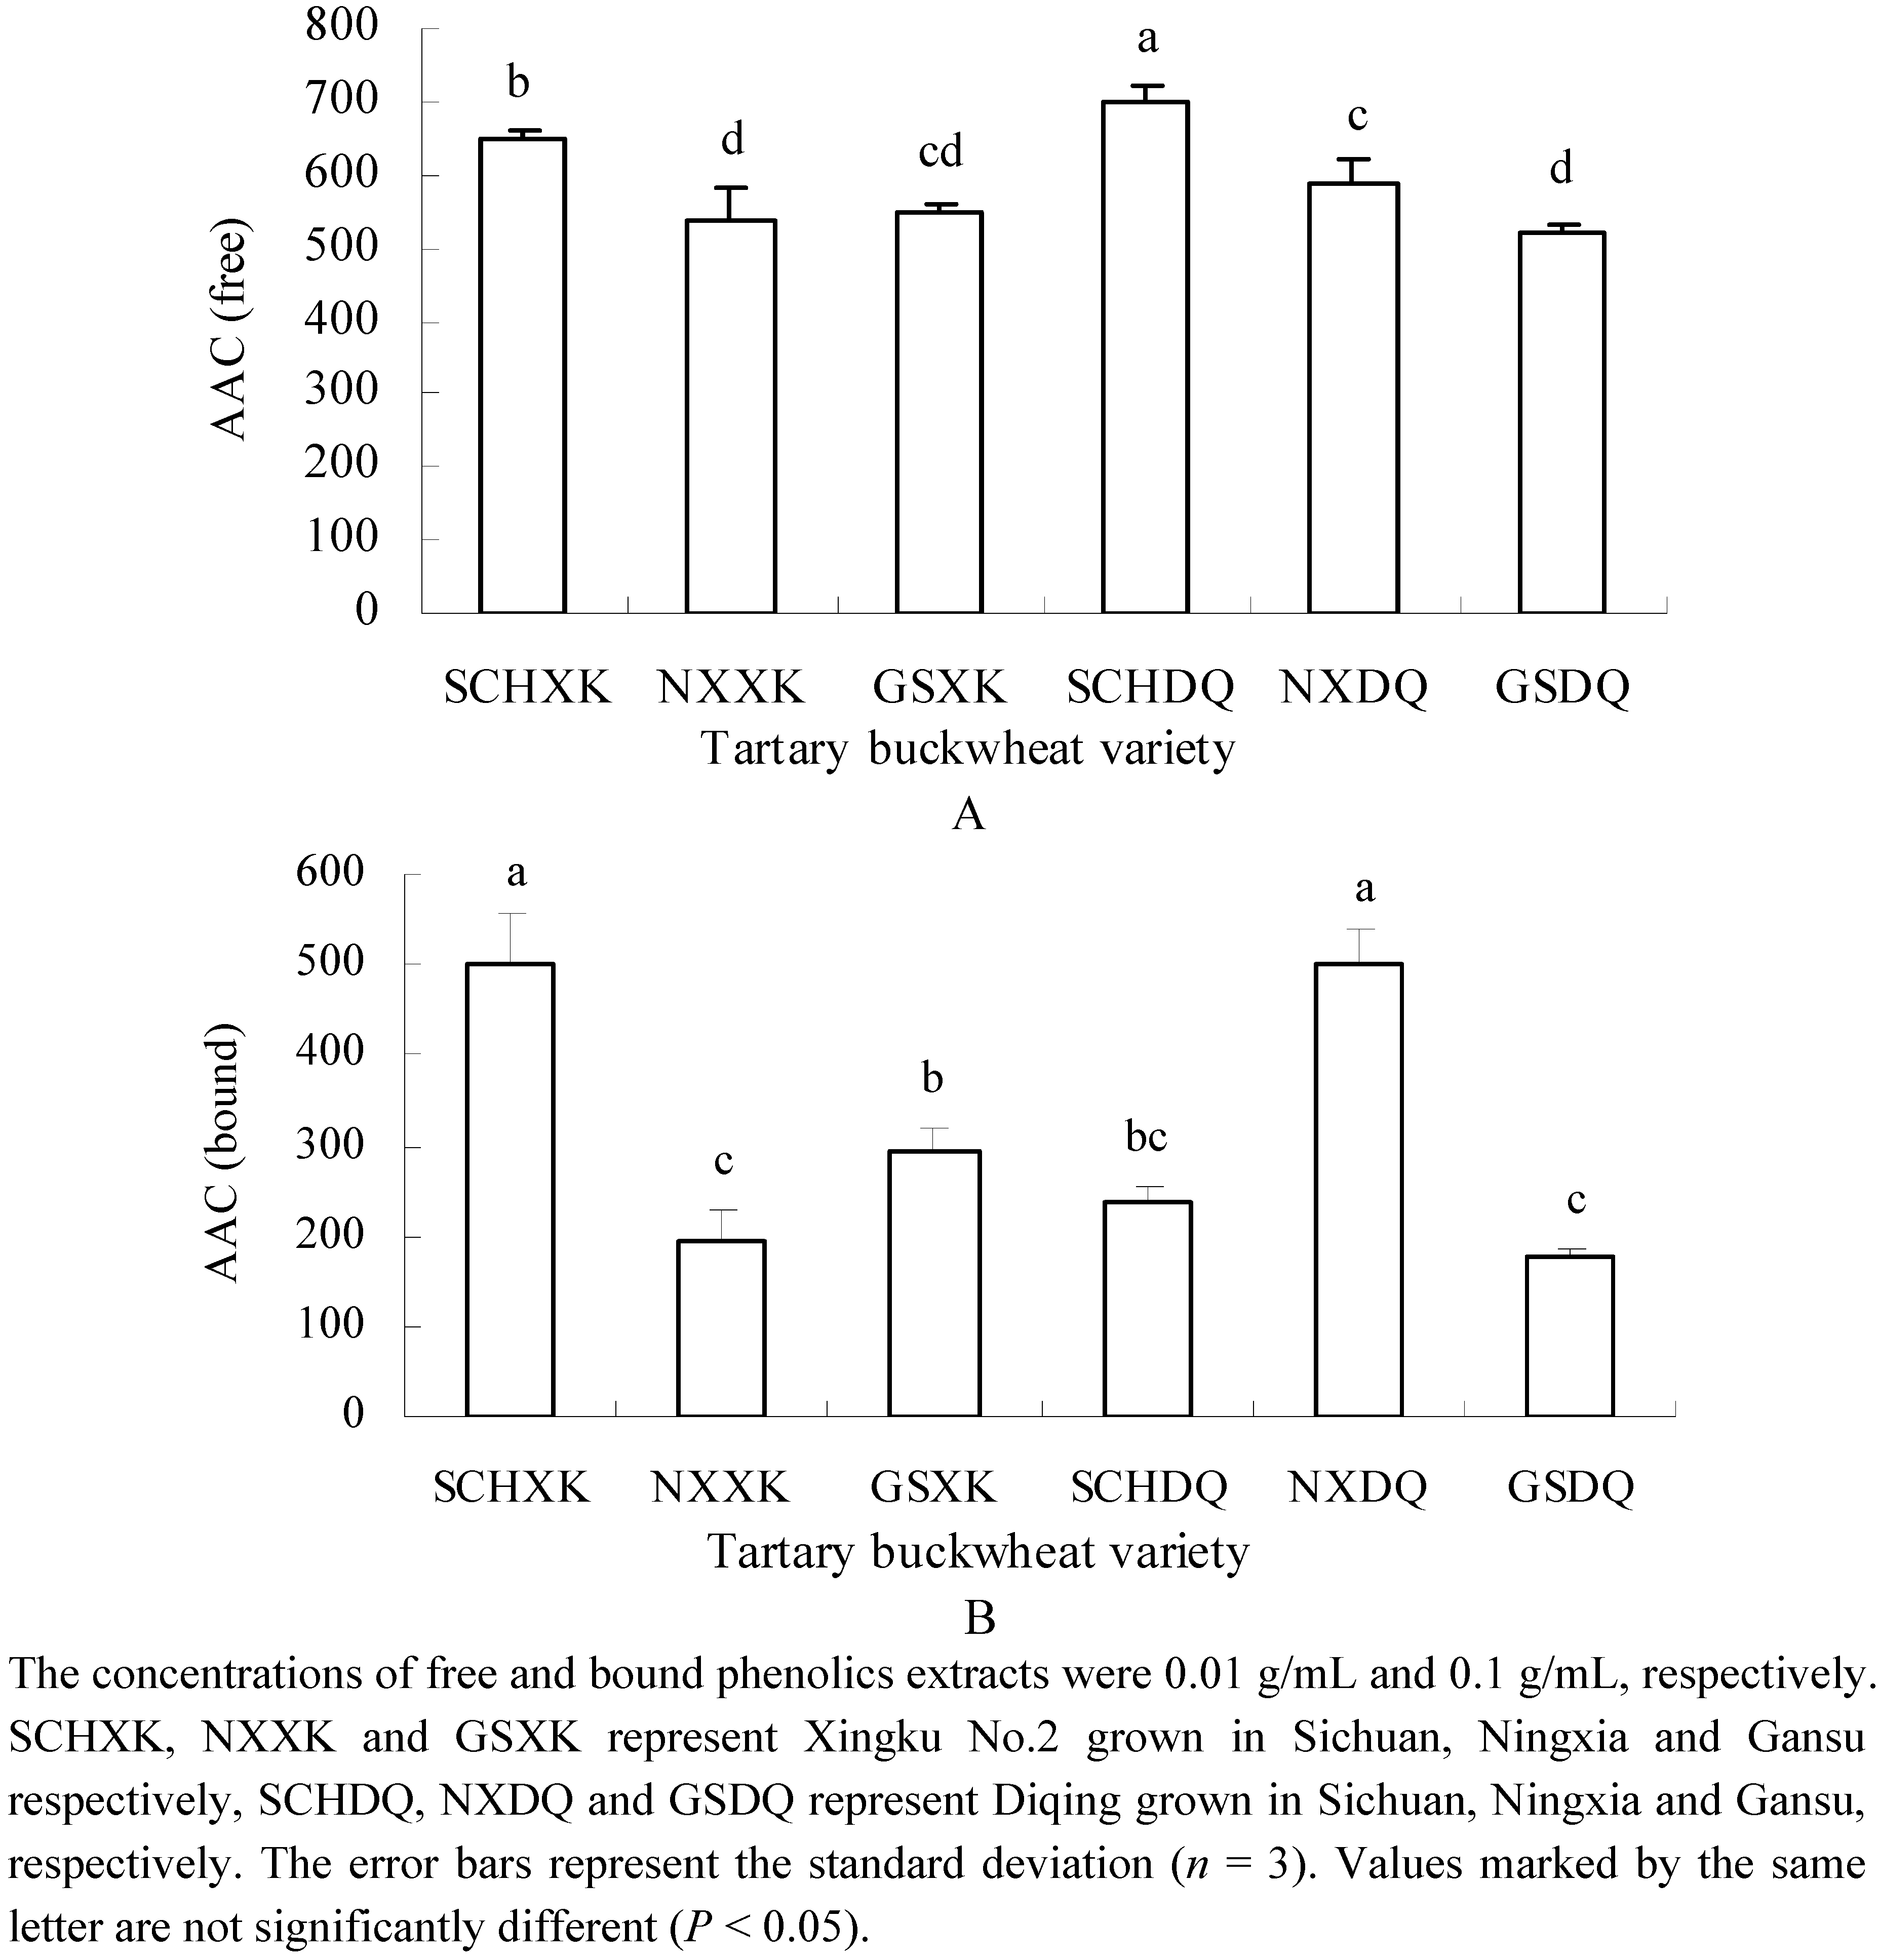
2.3. Antioxidant Properties


2.4. Effects of V and E on Tartary Buckwheat Phenolics Content and Antioxidant Properties
| Antioxidant property | Variance component | ||
|---|---|---|---|
| V | E | V × E | |
| DPPH● scavenging activity (μmol Trolox eq./100 g DW) | 33.25 ** | 40.23 ** | 20.37 ** |
| ABTS●+ scavenging activity (μmol Trolox eq./100 g DW) | 31.47 * | 7.42 | n |
| AAC (free phenolics) | 2.45 | 77.36 ** | 6.33 * |
| AAC (bound phenolics) | 0.41 | 16.23 ** | 77.11 ** |
| Total Phenolic Content (μmol of gallic acid eq./100 g DW) | 3.48 * | 18.89 ** | 71.12 ** |
| Total Flavonoid Content (μmol of rutin eq./100 g DW) | 3.40 | 52.01 ** | 27.14 ** |
| Total phenolic acid (mg/100g DW) | 18.86 ** | 66.45 ** | 14.68 ** |
| Rutin (mg/100 g DW) | 6.96 ** | 46.86 ** | 46.13 ** |
| Quercetin (mg/100 g DW) | 19.40 ** | 72.87 ** | 7.69 ** |
| Catechin (mg/100 g DW) | 29.47 ** | 50.79 ** | 19.72 ** |
| p-Hydroxybenzoic acid (mg/100 g DW) | 5.24 ** | 79.19 ** | 5.75 * |
| Ferulic acid (mg/100 g DW) | 4.08 ** | 55.83 ** | 40.08 ** |
| Protocatechuic acid (mg/100 g DW) | 75.67 ** | 5.97 ** | 18.28 ** |
| Environment | Variety | Antioxidant property and phenolic content | ||||||||||
|---|---|---|---|---|---|---|---|---|---|---|---|---|
| parameter | DPPH | AACF | AACB | TPC | TFC | TPA | R | Q | HA | FA | PA | |
| MT (°C) | XK | −0.72 | −0.22 | −0.26 | 0.80 | 0.56 | −0.56 | −0.50 | −0.98 * | −0.99 * | 0.25 | −0.29 |
| DQ | 0.13 | 0.46 | 0.91 | −0.61 | −0.32 | −0.83 | −0.78 | 0.64 | −0.73 | −0.76 | −0.65 | |
| AOP (mm) | XK | 0.85 | 0.98 * | 0.99 * | 0.38 | −0.94 | 0.94 | 0.96 * | 0.06 | 0.23 | 0.88 | 0.99 * |
| DQ | 0.93 | 0.75 | −0.63 | −0.62 | −0.84 | 0.74 | 0.79 | −0.90 | 0.84 | 0.82 | −0.58 | |
| SH (h) | XK | −0.98 * | −0.57 | −0.75 | 0.34 | 0.92 | −0.93 | −0.90 | −0.72 | −0.83 | −0.33 | −0.77 |
| DQ | −0.44 | −0.11 | 0.99 * | −0.07 | 0.25 | −0.99 * | −0.99 * | 0.96 * | −0.99 * | −0.99 * | −0.12 | |
| A (m) | XK | 0.99 * | 0.77 | 0.9 | −0.07 | −0.99 * | 0.99 * | 0.98 * | 0.51 | 0.64 | 0.57 | 0.91 |
| DQ | 0.67 | 0.37 | −0.91 | −0.2 | −0.51 | 0.97 * | 0.98 * | −0.99 * | 0.99 * | 0.99 * | −0.15 | |
2.5. Correlations Between Antioxidant Properties
| DPPH | ABTS | AACF | AACB | TPC | TFC | TPA | R | Q | |
|---|---|---|---|---|---|---|---|---|---|
| DPPH | 1 | ||||||||
| ABTS | −0.09 | 1 | |||||||
| AACF | 0.56 | 0.71 | 1 | ||||||
| AACB | 0.01 | 0.1 | 0.37 | 1 | |||||
| TPC | −0.36 | 0.22 | 0.16 | 0.16 | 1 | ||||
| TFC | −0.26 | −0.53 | −0.56 | −0.56 | −0.01 | 1 | |||
| TPA | 0.58 | −0.07 | 0.33 | 0.1 | −0.04 | −0.65 | 1 | ||
| R | 0.68 | −0.23 | 0.15 | −0.42 | −0.08 | −0.16 | 0.81 * | 1 | |
| Q | −0.66 | 0.3 | −0.14 | 0.43 | −0.19 | −0.21 | −0.46 | −0.83 * | 1 |
3. Experimental
3.1. Tartary Buckwheat Sample Preparation
| Location | Mean | Amount | Sunlight hours | Altitude |
|---|---|---|---|---|
| temperature (°C) | of precipitation (mm) | (h) | (m) | |
| Sichuan | 17.19 | 667.3 | 1078.4 | 2100 |
| Ningxia | 19.61 | 151.4 | 1446.5 | 1422 |
| Gansu | 14.02 | 317 | 1071.7 | 1920 |
3.2. Chemicals
3.3. Extraction of Free and Bound Phenolic Compounds
3.4. Determination of Total Phenolic Content
3.5. Determination of Total Flavonoid Content
3.6. Phenolic Compound Profiles in Tartary Buckwheat
3.7. Determination of Antioxidant Activities
3.7.1. DPPH Radical Scavenging Activity Assay
3.7.2. ABTS●+ Scavenging Activity Assay
3.7.3. β-carotene-linoleic Acid Assay

3.8. Statistical Analysis
4. Conclusions
Acknowledgements
References and Notes
- Wang, M.; Liu, J.R.; Gao, J.M.; Parry, J.W.; Wei, Y.M. Antioxidant activity of tartary buckwheat bran extracts and its effect on the lipid profile of hyperlipidemic rats. J. Agric. Food Chem. 2009, 57, 5106–5112. [Google Scholar] [CrossRef]
- Inglett, G.E.; Rose, D.J.; Chen, D.; Stevenson, D.G.; Biswas, A. Phenolic content and antioxidant activity of extracts from whole buckwheat (Fagopyrum esculentum Möench) with or without microwave irradiation. Food Chem. 2010, 119, 1216–1219. [Google Scholar]
- Manach, C.; Scalbert, A.; Morand, C.; Rémésy, C.; Jiménez, L. Polyphenols: Food sources and bioavaiability. Am. J. Clin. Nutr. 2004, 79, 727–747. [Google Scholar]
- Naczk, M.; Shahidi, F. Phenolics in cereals, fruits and vegetables: Occurrence, extraction and analysis. J. Pharm. Biomed. Anal. 2006, 41, 1523–1542. [Google Scholar] [CrossRef]
- Inglett, G.E.; Chen, D.; Berhow, M.; Lee, S. Antioxidant activity of commercial buckwheat flours and their free and bound phenolic compositions. Food Chem. 2011, 125, 923–929. [Google Scholar] [CrossRef]
- Klepacka, J.; Fornal, L. Ferulic acid and its position among the phenolic compounds of wheat. Crit. Rev. Food Sci. Nutr. 2006, 46, 639–647. [Google Scholar] [CrossRef]
- Sun, J.; Chu, Y.F.; Wu, X.Z.; Liu, R.H. Antioxidant and antiproliferative activities of common Fruits. J. Agric. Food Chem. 2002, 50, 7449–7454. [Google Scholar] [CrossRef]
- Klepacka, J.; Gujska, E.; Michalak, J. Phenolic compounds as cultivar- and variety-distinguishing factors in some plant products. Plant Foods Hum. Nutr. 2011, 66, 64–69. [Google Scholar] [CrossRef]
- Adom, K.K.; Liu, R.H. Antioxidant activity of grains. J. Agric. Food Chem. 2002, 50, 6182–6187. [Google Scholar] [CrossRef]
- Yu, C.; Ranieri, M.; Lv, D.; Zhang, M.; Charles, M.T.; Tsao, R.; Rekika, D.; Khanizadeh, S. Phenolic composition and antioxidant capacity of newly developed strawberry lines from British Columbia and Quebes. Int. J. Food Prop. 2011, 14, 59–67. [Google Scholar] [CrossRef]
- Adom, K.K.; Sorrells, M.E.; Liu, R.H. Phytochemicals and antioxidant activity of milled fractions of different wheat varieties. J. Agric. Food Chem. 2005, 53, 2297–2306. [Google Scholar] [CrossRef]
- Yu, L.L.; Haley, S.; Perret, J.; Harris, M. Comparison of wheat flours grown at different locations for their antioxidant properties. Food Chem. 2004, 86, 11–16. [Google Scholar] [CrossRef]
- Wang, S.Y.; Zheng, W. Effect of plant growth temperature on antioxidant capacity in strawberry. J. Agric. Food Chem. 2001, 49, 4977–4982. [Google Scholar] [CrossRef]
- Nacif de Abreu, I.; Mazzafera, P. Effect of water and temperature stress on the content of active constituents of Hypercium brasiliencse Choisy. Plant Physiol. Biochem. 2005, 43, 241–248. [Google Scholar] [CrossRef]
- Oomah, B.D.; Mazza, G. Flavonoids and antioxidative activities in buckwheat. J. Agric. Food Chem. 1996, 44, 1746–1750. [Google Scholar] [CrossRef]
- Oomah, B.D.; Campbell, C.G.; Mazza, G. Effects of cultivar and environment on phenolic acids in buckwheat. Euphytica 1996, 90, 73–77. [Google Scholar]
- Kitabayashi, H.; Ujihara, A.; Hirose, T.; Minami, M. Varietal difference and heritability for rutin content in common buckwheat, Fagopyrum esculentum Möench. Jpn. J. Breed. 1995, 45, 75–79. [Google Scholar]
- Kishore, G.; Ranjan, S.; Pandey, A.; Gupta, S. Influence of altitudinal variation on the antioxidant potential of tartar buckwheat of western Himalaya. Food Sci. Biotechnol. 2010, 19, 1355–1363. [Google Scholar] [CrossRef]
- Socha, R.; Juszczak, L.; Pietrzyk, S.; Fortuna, T. Antioxidant activity and phenolic composition of herbhoneys. Food Chem. 2009, 113, 568–574. [Google Scholar] [CrossRef]
- Idris, Y.M.A.; Mariod, A.A.; Hamad, S.I. Physicochemical properties, phenolic contents and antioxidant activity of Sudanese honey. Int. J. Food Prop. 2011, 14, 450–458. [Google Scholar] [CrossRef]
- Suzuki, T.; Honda, Y.; Mukasa, Y. Effects of UV-B radiation, cold and desiccation stress on rutin concentration and rutin glucosidase activity in tartary buckwheat (Fagopyrum tataricum) leaves. Plant Sci. 2005, 168, 1303–1307. [Google Scholar] [CrossRef]
- Hung, P.V.; Morita, N. Distribution of phenolic compounds in the graded flours milled from whole buckwheat grains and their antioxidant capacities. Food Chem. 2008, 109, 325–331. [Google Scholar]
- Moore, J.; Hao, Z.G.; Zhou, K.Q.; Luther, M.; Costa, J.; Yu, L.L. Carotenoid, tocopherol, phenolic acid, and antioxidant properties of Maryland-grown soft wheat. J. Agric. Food Chem. 2005, 53, 6649–6657. [Google Scholar] [CrossRef]
- Kim, K.H.; Tsao, R.; Yang, R.; Cui, S.W. Phenolic acid profiles and antioxidant activities of wheat bran extracts and the effects of hydrolysis conditions. Food Chem. 2006, 95, 466–473. [Google Scholar]
- Holasova, M.; Fiedlerova, V.; Smrcinova, H.; Orsak, M.; Lachman, J.; Vavreinova, S. Buckwheat – the source of antioxidant activity in functional foods. Food Res. Int. 2002, 35, 207–211. [Google Scholar] [CrossRef]
- Durkee, A.B. Polyphenols of the bran—Aleurone fraction of buckwheat seed (Fagopyrum sagitatum, Gilib). J. Agric. Food Chem. 1977, 25, 286–287. [Google Scholar] [CrossRef]
- Sun, T.; Simon, P.W.; Tanumihardjo, S.A. Antioxidant phytochemicals and antioxidant capacity of biofortified carrots (Daucus carota L.) of various colors. J. Agric. Food Chem. 2009, 57, 4142–4147. [Google Scholar] [CrossRef]
- Velioglu, Y.S.; Mazza, G.; Gao, L.; Oomah, B.D. Antioxidant activity and total phenolics in selected fruits, vegetables, and grain products. J. Agric. Food Chem. 1998, 46, 4113–4117. [Google Scholar] [CrossRef]
- Lopez-Martinez, L.X.; Oliart-Ros, R.M.; Valerio-Alfaro, G.; Lee, C.H.; Parkin, K.L.; Garcia, H.S. Antioxidant activity, phenolic compounds and anthocyanins content of eighteen strains of Mexican maize. LWT-Food Sci. Technol. 2009, 42, 1187–1192. [Google Scholar]
- Xu, B.C.; Xiao, G.; Ding, X.L. Deternimation of phenolic acids and proanthocyanidin in buckwheat (Fagopytum tataricum Gaench). Food Ferment. Ind. (in Chinese) 2002, 28, 32–37. [Google Scholar]
- Abu Bakar, M.F.; Mohamed, M.; Rahmat, A.; Fry, J. Photochemicals and antioxidant activity of different parts of bambangan (Mangifera pajang) and tarap (Artocarpus odoratissimus). Food Chem. 2009, 113, 479–483. [Google Scholar] [CrossRef]
- Zhou, K.Q.; Laux, J.J.; Yu, L.L. Comparison of Swiss red wheat grain and fractions for their antioxidant properties. J. Agric. Food Chem. 2004, 52, 1118–1123. [Google Scholar] [CrossRef]
- Li, X.L.; Zhou, A.G. Evaluation of the antioxidant effects of polysaccharides extracted from Lycium barbarum. Med. Chem. Res. 2007, 15, 471–482. [Google Scholar] [CrossRef]
- Sample Availability: Samples are available from the authors.
© 2011 by the authors; licensee MDPI, Basel, Switzerland. This article is an open access article distributed under the terms and conditions of the Creative Commons Attribution license ( http://creativecommons.org/licenses/by/3.0/).
Share and Cite
Guo, X.-D.; Ma, Y.-J.; Parry, J.; Gao, J.-M.; Yu, L.-L.; Wang, M. Phenolics Content and Antioxidant Activity of Tartary Buckwheat from Different Locations. Molecules 2011, 16, 9850-9867. https://doi.org/10.3390/molecules16129850
Guo X-D, Ma Y-J, Parry J, Gao J-M, Yu L-L, Wang M. Phenolics Content and Antioxidant Activity of Tartary Buckwheat from Different Locations. Molecules. 2011; 16(12):9850-9867. https://doi.org/10.3390/molecules16129850
Chicago/Turabian StyleGuo, Xu-Dan, Yu-Jie Ma, John Parry, Jin-Ming Gao, Liang-Li Yu, and Min Wang. 2011. "Phenolics Content and Antioxidant Activity of Tartary Buckwheat from Different Locations" Molecules 16, no. 12: 9850-9867. https://doi.org/10.3390/molecules16129850
APA StyleGuo, X.-D., Ma, Y.-J., Parry, J., Gao, J.-M., Yu, L.-L., & Wang, M. (2011). Phenolics Content and Antioxidant Activity of Tartary Buckwheat from Different Locations. Molecules, 16(12), 9850-9867. https://doi.org/10.3390/molecules16129850