2.3. Effects of R-III on [Ca2+]i and pHi in Sf9 Cells
In order to know the effects of R-III on [Ca
2+]
i, Sf9 cells were exposed to Hanks, a buffer solution containing Ca
2+. Ca
2+ influx took place in Sf9 cells stimulated by R-III, which elicited a significant increase of [Ca
2+]
i. As shown in
Figure 4A1, comparing to control, Sf9 cells showed gradual increase of [Ca
2+]
i by 29.9%, 38.28%, 64.21% and 111.78%, after the stimulation with 1, 10, 100 and 200 μg/mL of R-III respectively, showing a dose-dependent fashion. Under these conditions, we observed a similar change of pH
i with that of [Ca
2+]
i. As shown in
Figure 4B1, Sf9 cells presented a gradual increase of pH
i by 22.27%, 37.13%, 69.17% and 89.58% after stimulation with 1, 10, 100 and 200 μg/mL of R-III respectively, also in a dose-dependent fashion. The increase of pH
i was only 5.7% in control. In order to further investigate the effects of R-III on [Ca
2+]
i in Sf9 cells, we checked the time-dependent changes of Ca
2+ fluorescence signals in Sf9 cells induced by R-III. As shown in
Figure 4A-a, a flat trace in control indicated no change of [Ca
2+]
i in cells. A transient elevation of [Ca
2+]
i characterized by a fluorescence intensity increase followed by a recovery to basal level was observed in Sf9 cells stimulated with low concentration of R-III (1 μg/mL) (
Figure 4A-b), suggesting that cells can regulate [Ca
2+ ]
i to keep intracellular Ca
2+ homeostasis in case of slight external stimulation.
Figure 4.
Effect of R-Ⅲ on [Ca2+]i and pHi in Sf9 cells in presence of Hanks. (A1). changes of [Ca2+]i in Sf9 cells stimulated by R-III at various concentrations as indicated by relative change of Fluo-3AM fluorescence intensity; (B1). Changes of pHi in Sf9 cells stimulated by R-III at various concentrations as indicated by relative change of Snarf1M fluorescence intensity; (A a–d). Dynamic changes of [Ca2+]i indicated by a dynamic trace of Fluo-3AM fluorescence intensity in case of Sf9 cells treated with 0, 1, 100, 200 µg/mL of R-Ⅲ respectively; (B a–d). pHi profile in cells subject to the protocol in (A a–d); (A-e). Dynamic variation of [Ca2+]i in Sf9 cells treated with 100 µg/mL of R-III for two times; (B-e). pHi profile in cells subject to the protocol in (A-e). Arrows indicated the addition of R-Ⅲ.Results of representative experiment derived from three repetitions and 4–6 cells were measured in each repetition. The error bars represent mean ± SEM for data derived from value of relative fluorescence intensity in each time interval. Treatment means sharing the same letter were not significantly different from each other (P < 0.05).
![Molecules 16 03179 g004]()
When exposed to 100 and 200 μg/mL of R-III, Sf9 cells showed a rapid rise of [Ca
2+]
i, which reached to a high steady state [
Figure 4A-(c,d)]. Previous studies have established that elevation of [Ca
2+]
i may derive from extra cellular Ca
2+influx through calcium channels or transporters [
20] or the Ca
2+release from intracellular Ca
2+ stores induced by intracellular inositol 1,4,5-trisphosphate (IP3), synthesized in response to external stimulation [
21]. Under this condition, we applied the second stimulation of R-III, which caused [Ca
2+]
i declining sharply in a index fashion to a steady state lower than the basal level (
Figure 4A-e). In this assay, we also found that the changes of pH
i were in line with that of [Ca
2+]
i, as shown in the traces in
Figure 4B-(a,d) and the second stimulation of R-III also produced a sharply decrease of pH
i to a steady state lower than the basal level (
Figure 4B-e). Although the mechanisms of the sharp decrease of [Ca
2+]
i and pH
i are not clear yet, an interpretation from groups of Li
et al. [
22] who investigated the modulation effect of glutamate on [Ca
2+]
i of inner hair cell of the guinea pig cochlea and found similar phenomenon may enlighten us on this study: Excessive stimulation of glutamate may cause toxicity on cells and increase the penetration of plasma membrane (PM) which gives rise to [Ca
2+]
i efflux. Since R-III was a botanic pesticide showing significant toxicity to many kinds of insect, the second stimulation of R-III possibly produced toxic effect on Sf9 cells causing [Ca
2+]
i efflux, in agreement with viewpoint of [
22], and [Ca
2+]
i efflux exchanged for H
+ influx through Ca
2+-ATPase in PM [
23], eliciting decrease of pH
i.
2.4. Effects of R-III on [Ca2+]i and pHi in Sf9 Cells in Presence of Dhanks
To further clarify the effect of R-III on [Ca
2+]
i and pH
i, Sf9 cells were exposed to Dhanks, a Ca
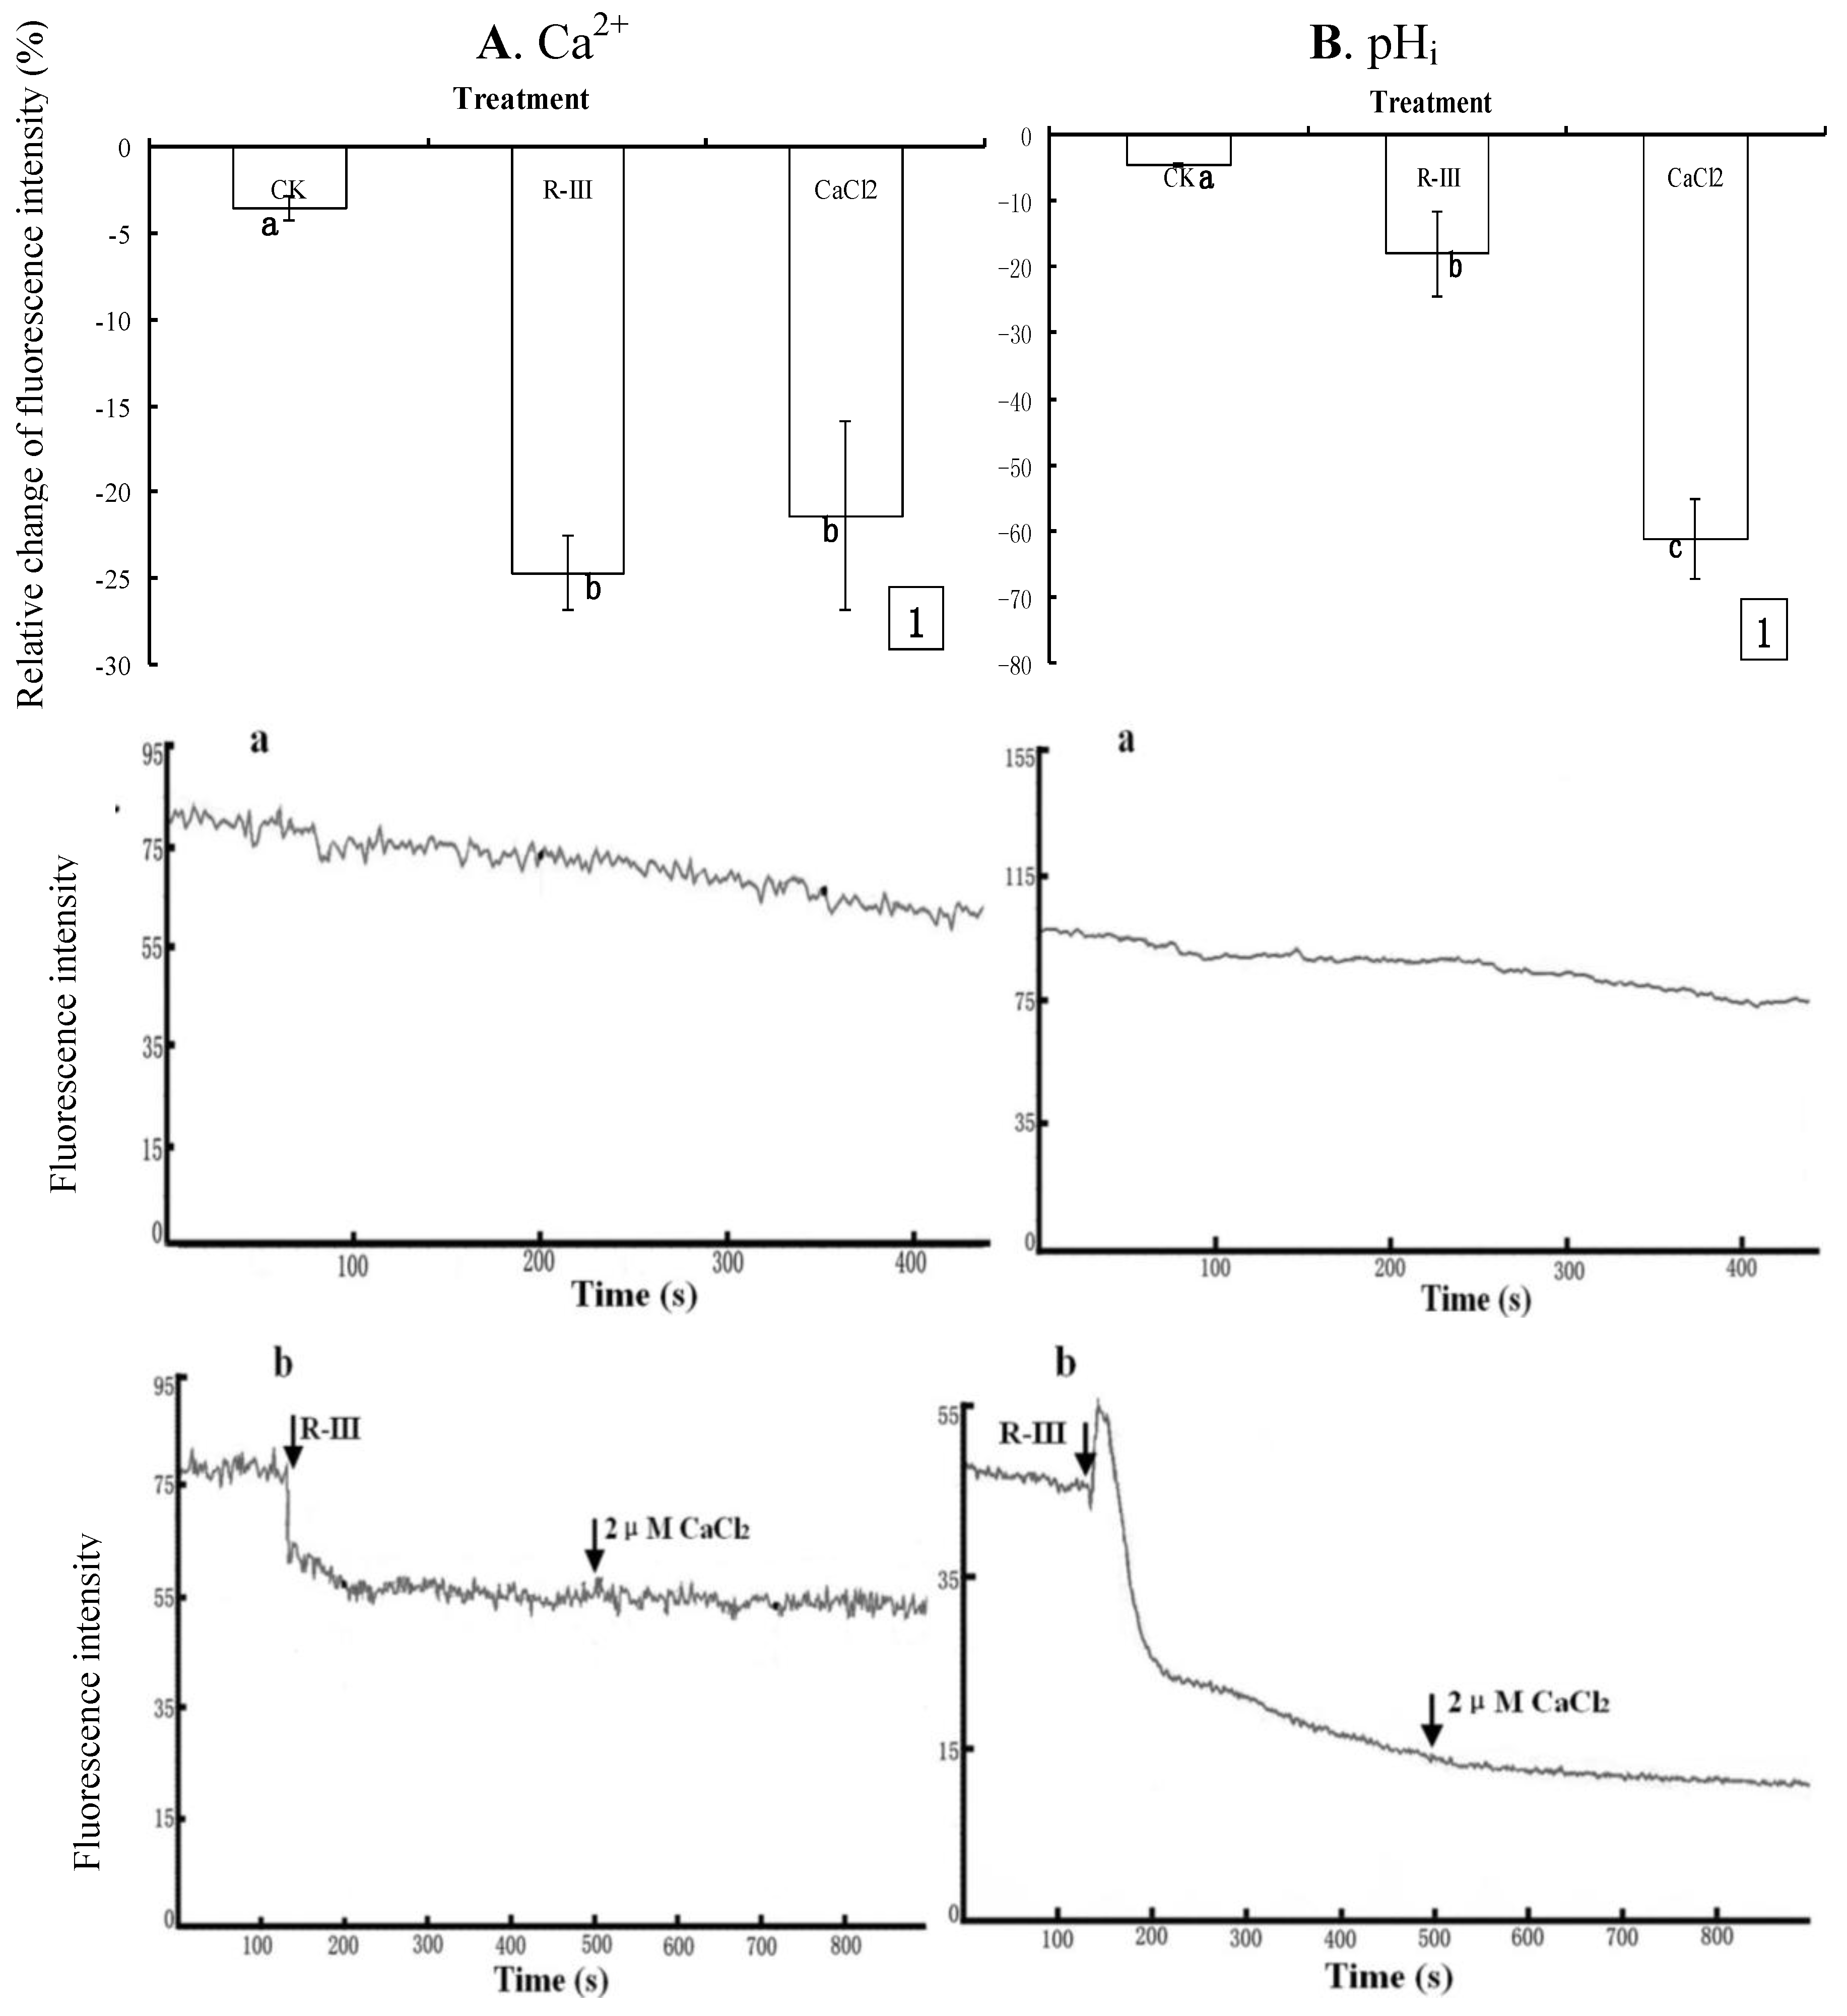
2+-free buffer solution, and recoded the change of fluorescence intensity in Sf9 cells stimulated with R-III (100 μg/mL) at 130 s. Comparing to the control with only a slightly decrease of [Ca
2+]
i (3.52%) ( 5A1, A-a), [Ca
2+]
i sharply decreased by 24.64% after the stimulation of R-III (
Figure 5A1), and kept in a steady state (
Figure 5A-b), indicating [Ca
2+]
i efflux in Sf9 cells induced by R-III, and no increase of [Ca
2+]
i was observed in case of re-addition of CaCl
2 (2 μM) to the Ca
2+-free buffer solution at 500 s (
Figure 5A-b), suggesting that Ca
2+ efflux in cells was irreversible. Previous study finds that although glucose oxidase induce a rapid decrease in rat endothelial cells exposed in Ca
2+ free buffer, re-addition of Ca
2+ to the extracellular buffer may activate store operated Ca
2+ entry to cause large [Ca
2+]
i increases [
24]. However, store operated Ca
2+ entry in Sf9 cells was not activated by the re-addition of Ca
2+ in this assay. The results further proved that it was the Ca
2+ influx that elicited the substantial increase of [Ca
2+]
i in Sf9 cells stimulated by R-III in case of cell exposure to Hanks in the experiment above [
Figure 4A-(b,e)]. Under these conditions, pH
i also showed significant decrease (17.85%), and sustained decrease (61.02%) was observed even if addition of CaCl
2 at 130 s after stimulation (
Figure 5B1). Knowing from dynamic change of fluorescence signals in Sf9 cells induced by R-III (
Figure 5B-b), R-III induced a transient rise of pH
i, followed by a decline to a steady level much lower than basal level in Sf9 cells, and no recovery of pH
i was observed even if addition of CaCl
2 at 130 s after stimulation. In contrast, the control showed only a slightly decrease of pH
i (
Figure 5B-a). Interestingly, [Ca
2+]
i showed no transient increase in the same conditions ( 5A- b). The results in this assay indicated that R-III not only induced [Ca
2+]
i in Sf9 cells decline through Ca
2+ efflux but also elicited the intracellular acidification, possibly through H
+ entry in exchange for Ca
2+ extrusion by the Ca
2+-ATPase in cell PM [
23].
Figure 5.
Effects of R-III on [Ca2+]i and pHi in Sf9 cells in presence of Dhanks. (A1). Changes of [Ca2+]i when cells were stimulated by 100 μg/mL in 130 s and subsequent addition of 2 μM CaCl2 in 500 s, as indicated by relative change of Fluo-3AM fluorescence intensity; (A-a). Control; (A-b). Dynamic changes of [Ca2+]i in the same conditions with (A1); (B). pHi profile in cells subjected to the protocol in (A). Results of representative experiment derived from three repetitions and 4–6 cells were measured in each repetition. The error bars represent mean ± SEM for data derived from value of relative fluorescence intensity (vs. control) in each time interval. Treatment means sharing the same letter were not significantly different from each other (P < 0.05). The negative value meant decrease of relative fluorescence intensity in cells.
Ca
2+ signaling plays a crucial role in the function of almost all cell types as an intracellular second messenger [
25]. For example, many researches prove that changes in [Ca
2+]
i homeostasis are associated with induction of apoptotic [
26] or cell death [
27]. An experimental report coming from group of Wang
et al. [
28] provides a convincing interpretation for the role of Ca
2+ in participation in apoptotic cell death. In their study, the authors found that H
2O
2-induced apoptosis of tobacco protoplasts primarily involves in the increase of [Ca
2+]
i resulting from the entry of extra cellular Ca
2+. In recent years, some reports show that calcium signal is a key component of the molecular switch mechanism in cell division cycle [
29].Through the interplay with several proteins, [Ca
2+]
i participates in regulating key steps in the cell cycle such as reentry of quiescent cells into proliferation and the transition through the G1/S, G2/M, and the metaphase/anaphase boundaries [
30,
31,
32]. Moreover, mitosis can be initiated by IP
3R-induced calcium transients [
33]. Disturbance of [Ca
2+]i homeostasis such as increase of [Ca
2+]i level in response to external stimulation may interfere with cells division cycle, resulting in cell cycle arrest [
34]. In present study, Sf9 cells showed significant changes of [Ca
2+]i induced by R-III [
Figure 4A-(b,e) and
Figure 5A-b]. Otherwise, R-III also produced cell cycle arrest in G2/M (
Figure 3) and strongly inhibited Sf9 cells proliferation (
Figure 2), although apoptosis was not observed. Our results suggested that there was a certain linkage for change of [Ca
2+]i, cell cycle arrest, cell proliferation inhibition in Sf9 cells induced by R-III. Moreover, we tentatively hypothesize that disturbance of [Ca
2+]i homeostasis in Sf9 cells induced by R-III may result in cell cycle arrest, which finally causes inhibition of insect cells proliferation or even cell death (including apoptopic cell death). This dual negative effect would significantly decrease the absolute number of cells, and finally induce remarkable decrease of survival cell number in R-III treatment.
2.5. The Contribution of Intracellular Ca2+ Stores to the Changes of Intracellular Ca2+ and pHi
Intracellular Ca
2+ stores such as mitochondria or endoplasmic reticulum may be the other principal source of Ca
2+ [
35]. In present study, to examine the contribution of intracellular Ca
2+ stores to the changes of intracellular Ca
2+, CdCl
2, a blocker of Ca
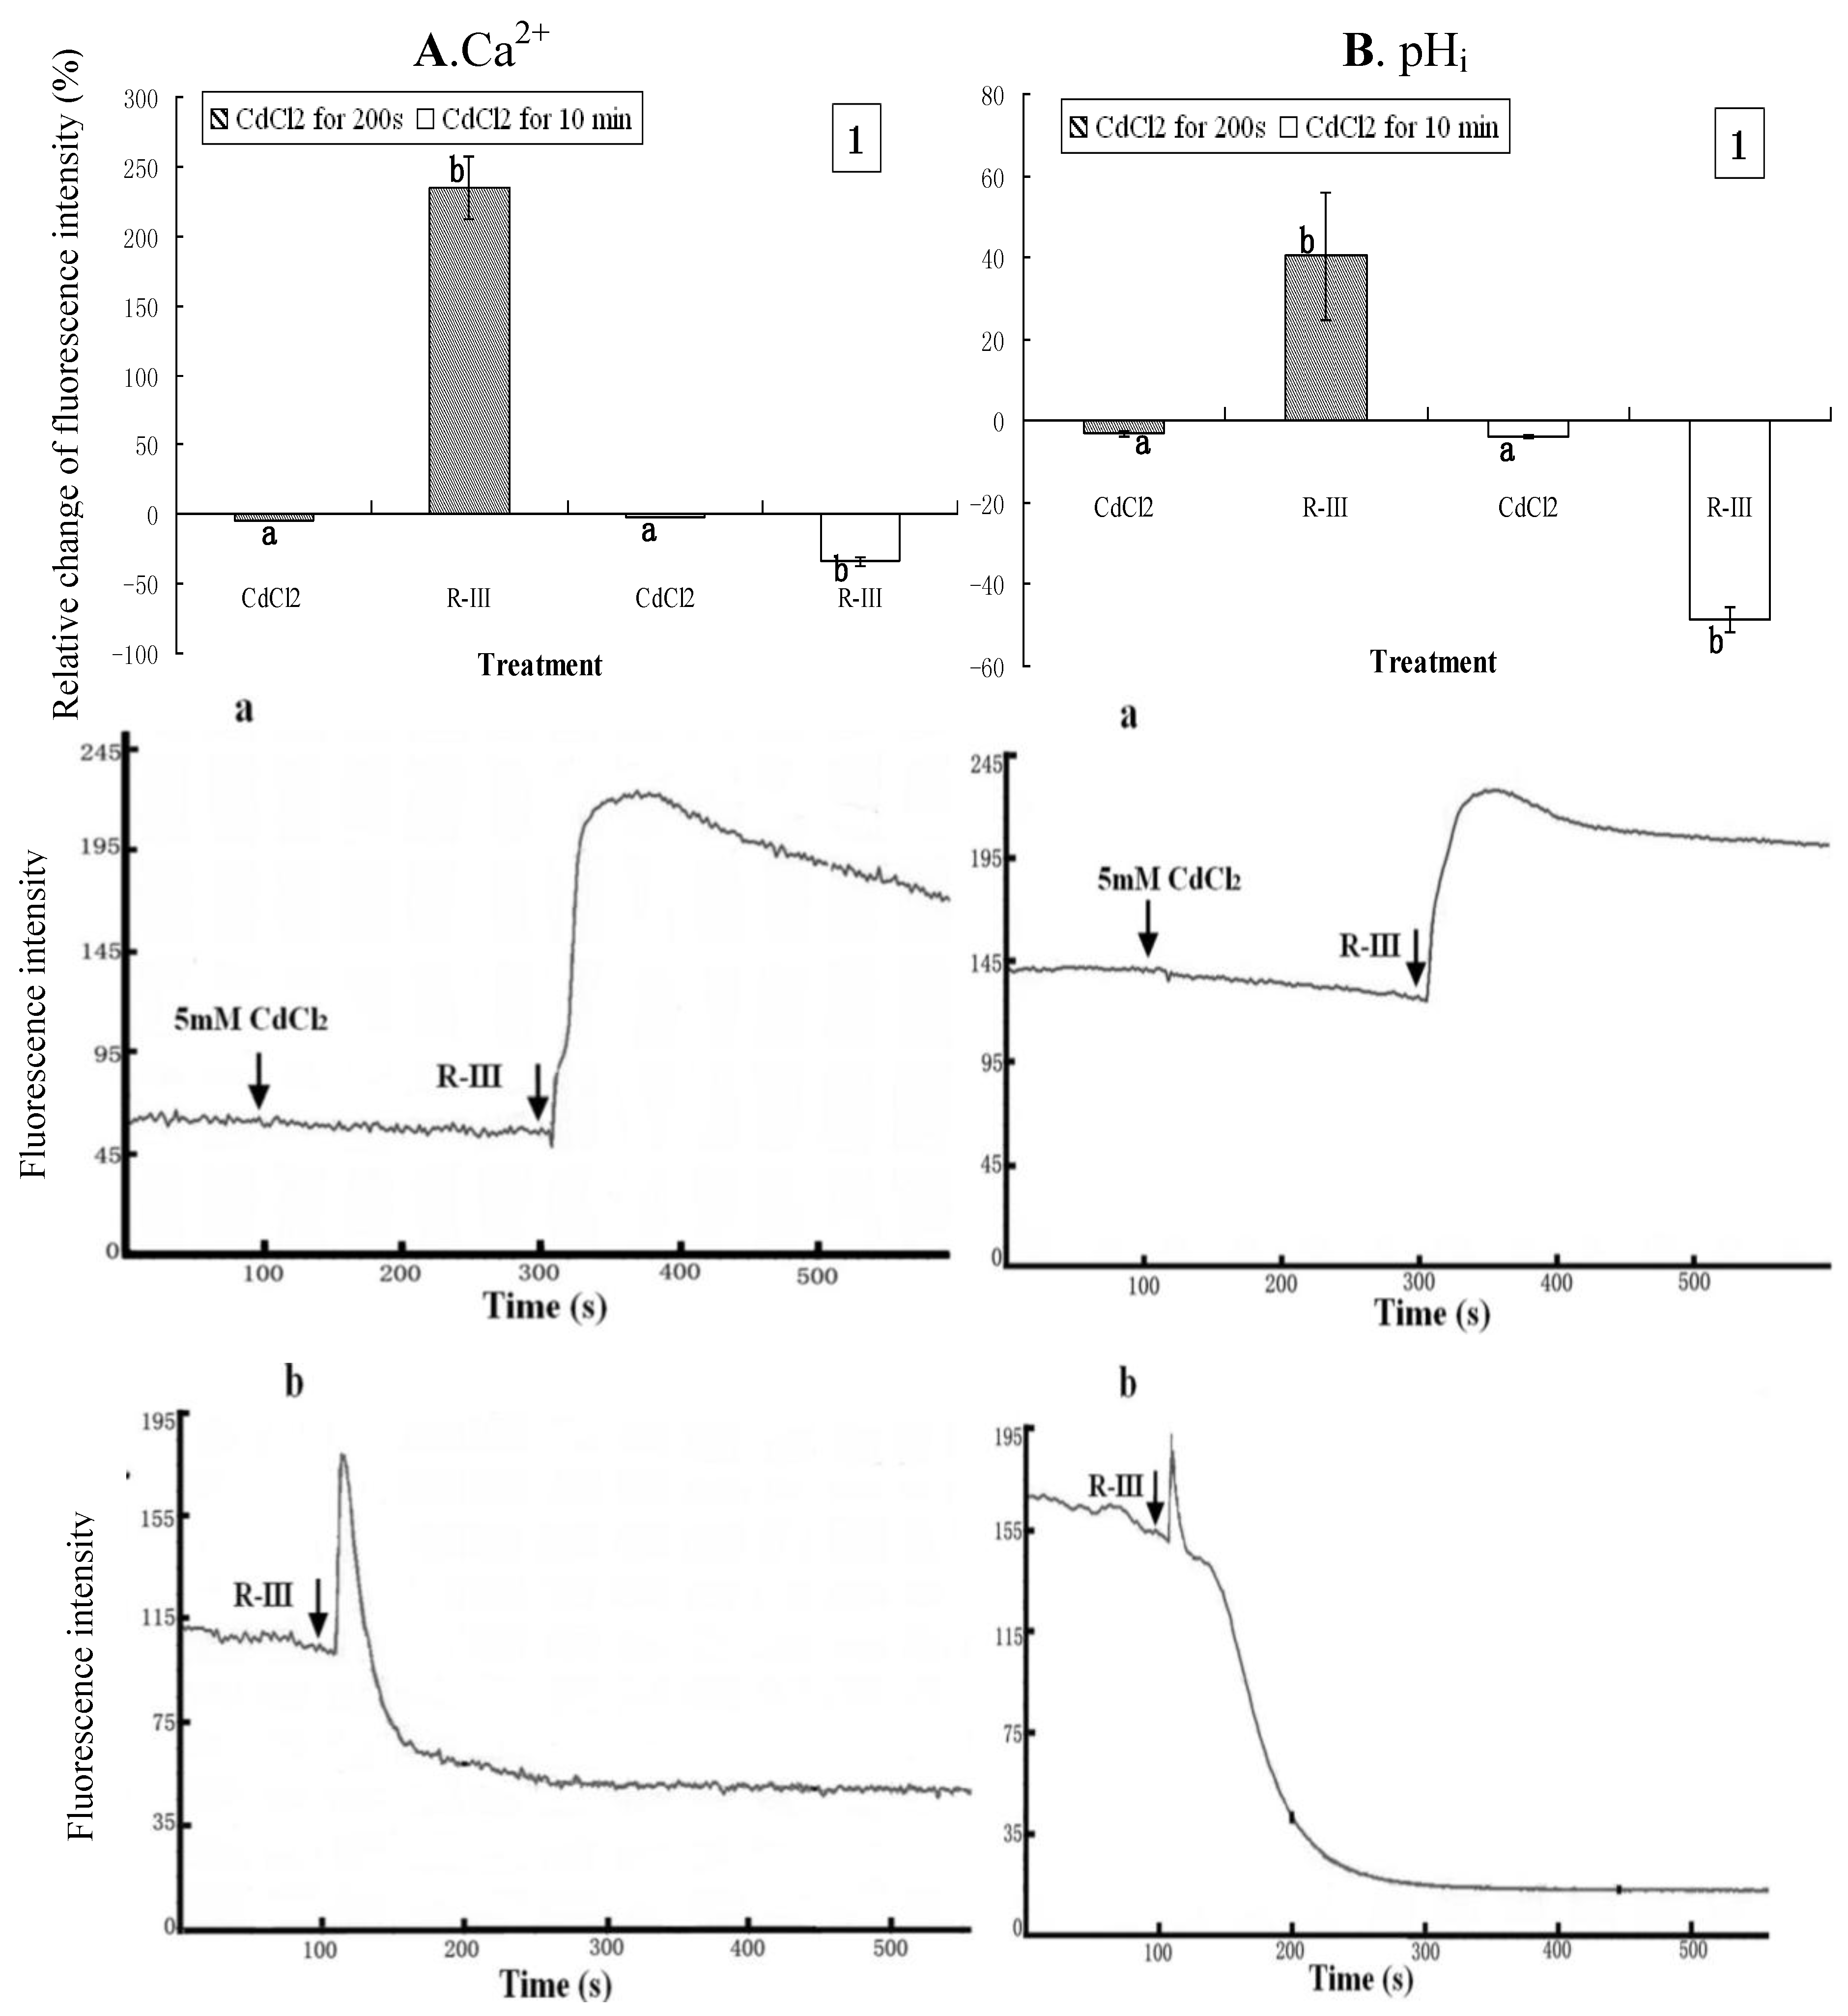
2+ channels was used to treat the cells that were then exposed to Hanks in the following experiments. CdCl
2 (5 mM) was applied to treat the cells for 200 s prior to the stimulation of R-III (100 μg/mL). As shown in
Figure 6A1 and
Figure 6B1, [Ca
2+]
i and pH
i in Sf9 cells incubated with CdCl
2 showed a slight decrease (4.52% and 3.03% respectively). After treatment with R-III, [Ca
2+]
i and pH
i rose by 235% and 40.32% respectively. As indicated in dynamic change of trace (
Figure 6A-a and B-a), [Ca
2+]
i increased immediately, but followed by a gradual decrease when cells were stimulated by R-III, suggesting that Cd
2+ gradually blocked the Ca
2+ channels to inhibit the Ca
2+ influx.
Figure 6.
Effect of Ca2+ channels blockon [Ca2+]i and pHi in R-III-induced Sf9 cells in presence of Hanks. (A1). changes of [Ca2+]i in Sf9 cells treated with 0.5 mM CdCl2 for 200 s and10 min prior to stimulate with R-III (100 μg/mL), as indicated by relative change of Fluo-3AM fluorescence intensity; (A-a). Dynamic changes of [Ca2+]i in Sf9 cells treated with 0.5 mM CdCl2 for 200 s prior to stimulate with R-III (100 μg/mL); (A-b). Dynamic changes of [Ca2+]i in Sf9 cells incubated with CdCl2 (5 mM) for 10 min prior to stimulated with R-III (100 μg/mL); (B). pHi profile in cells subjected to the protocol in (A). Results of representative experiment derived from three repetitions and 4–6 cells were measured in each repetition. The error bars represent mean ± SEM for data derived from value of relative fluorescence intensity in each time interval. Treatment means sharing the same letter were not significantly different from each other (P < 0.05). The negative value meant decrease of relative fluorescence intensity in cells.
![Molecules 16 03179 g006]()
Under these conditions, pH
i changed in similar fashion with [Ca
2+]
i. When we used CdCl
2 (5 mM) to incubate with Sf9 cells for 10 min to block the Ca
2+ channels completely, and then stimulated with R-III (100 g/mL), both [Ca
2+]
i and pH
i decreased sharply by rate of 33.85% and 48.74% respectively (
Figure 6A1 and 6B1). However, in this condition, we found in dynamic change of trace of
Figure 6A-b and
Figure 6B-b that both [Ca
2+]
i and pH
i showed a transient elevation before decreasing sharply. Since Cd
2+ had blocked Ca
2+ channels completely and inhibited Ca
2+ influx, the transient increase of [Ca
2+]
i mainly derived from Ca
2+ released from intracellular Ca
2+ stores. It is well established that inositol 1,4,5-trisphosphate (IP3), synthesized in response to external stimulation, induces the release of Ca
2+ from intracellular stores [
21]. In this assay, stimulation of R-III may also induce the synthesis and increase of IP
3 to promote release of Ca
2+ from intracellular stores through the Ca
2+-ATPase. Otherwise, the Ca
2+ sustained release from intracellular Ca
2+ stores may likely give rise to its depletion, which could activate store-operated Ca
2+ channels to promote the Ca
2+ influx in mammalian non-excitable cells [
36], whereas Ca
2+ channels had been blocked completely by CdCl
2, and no Ca
2+ entry but efflux characterized by sharp decline of [Ca
2+]
i to a level far lower than basal level occurred in this study (
Figure 6A-b). Under this condition, we observed a proportional change of pH
i with that of [Ca
2+]
i. We hypothesized that Ca
2+ released from intracellular stores through the Ca
2+-ATPase in exchange for H
+ entry intracellular stores resulted in the transient increase of pH
i, and the Ca
2+-ATPase of PM was activated by the transient increase of [Ca
2+]
i and the sustained stimulation of R-III. [Ca
2+]
i effused through Ca
2+-ATPase in exchange for H
+ entry intracellular cytosol, which caused the decrease of pH
i. The results in this assay demonstrated that both extra calcium influx and Ca
2+ release from intracellular Ca
2+ stores contributed to the elevation of [Ca
2+]
i in Sf9 cells stimulated by R-III, and pH
i showed proportional change with [Ca
2+]
i+ in response to the stimulation of R-III.
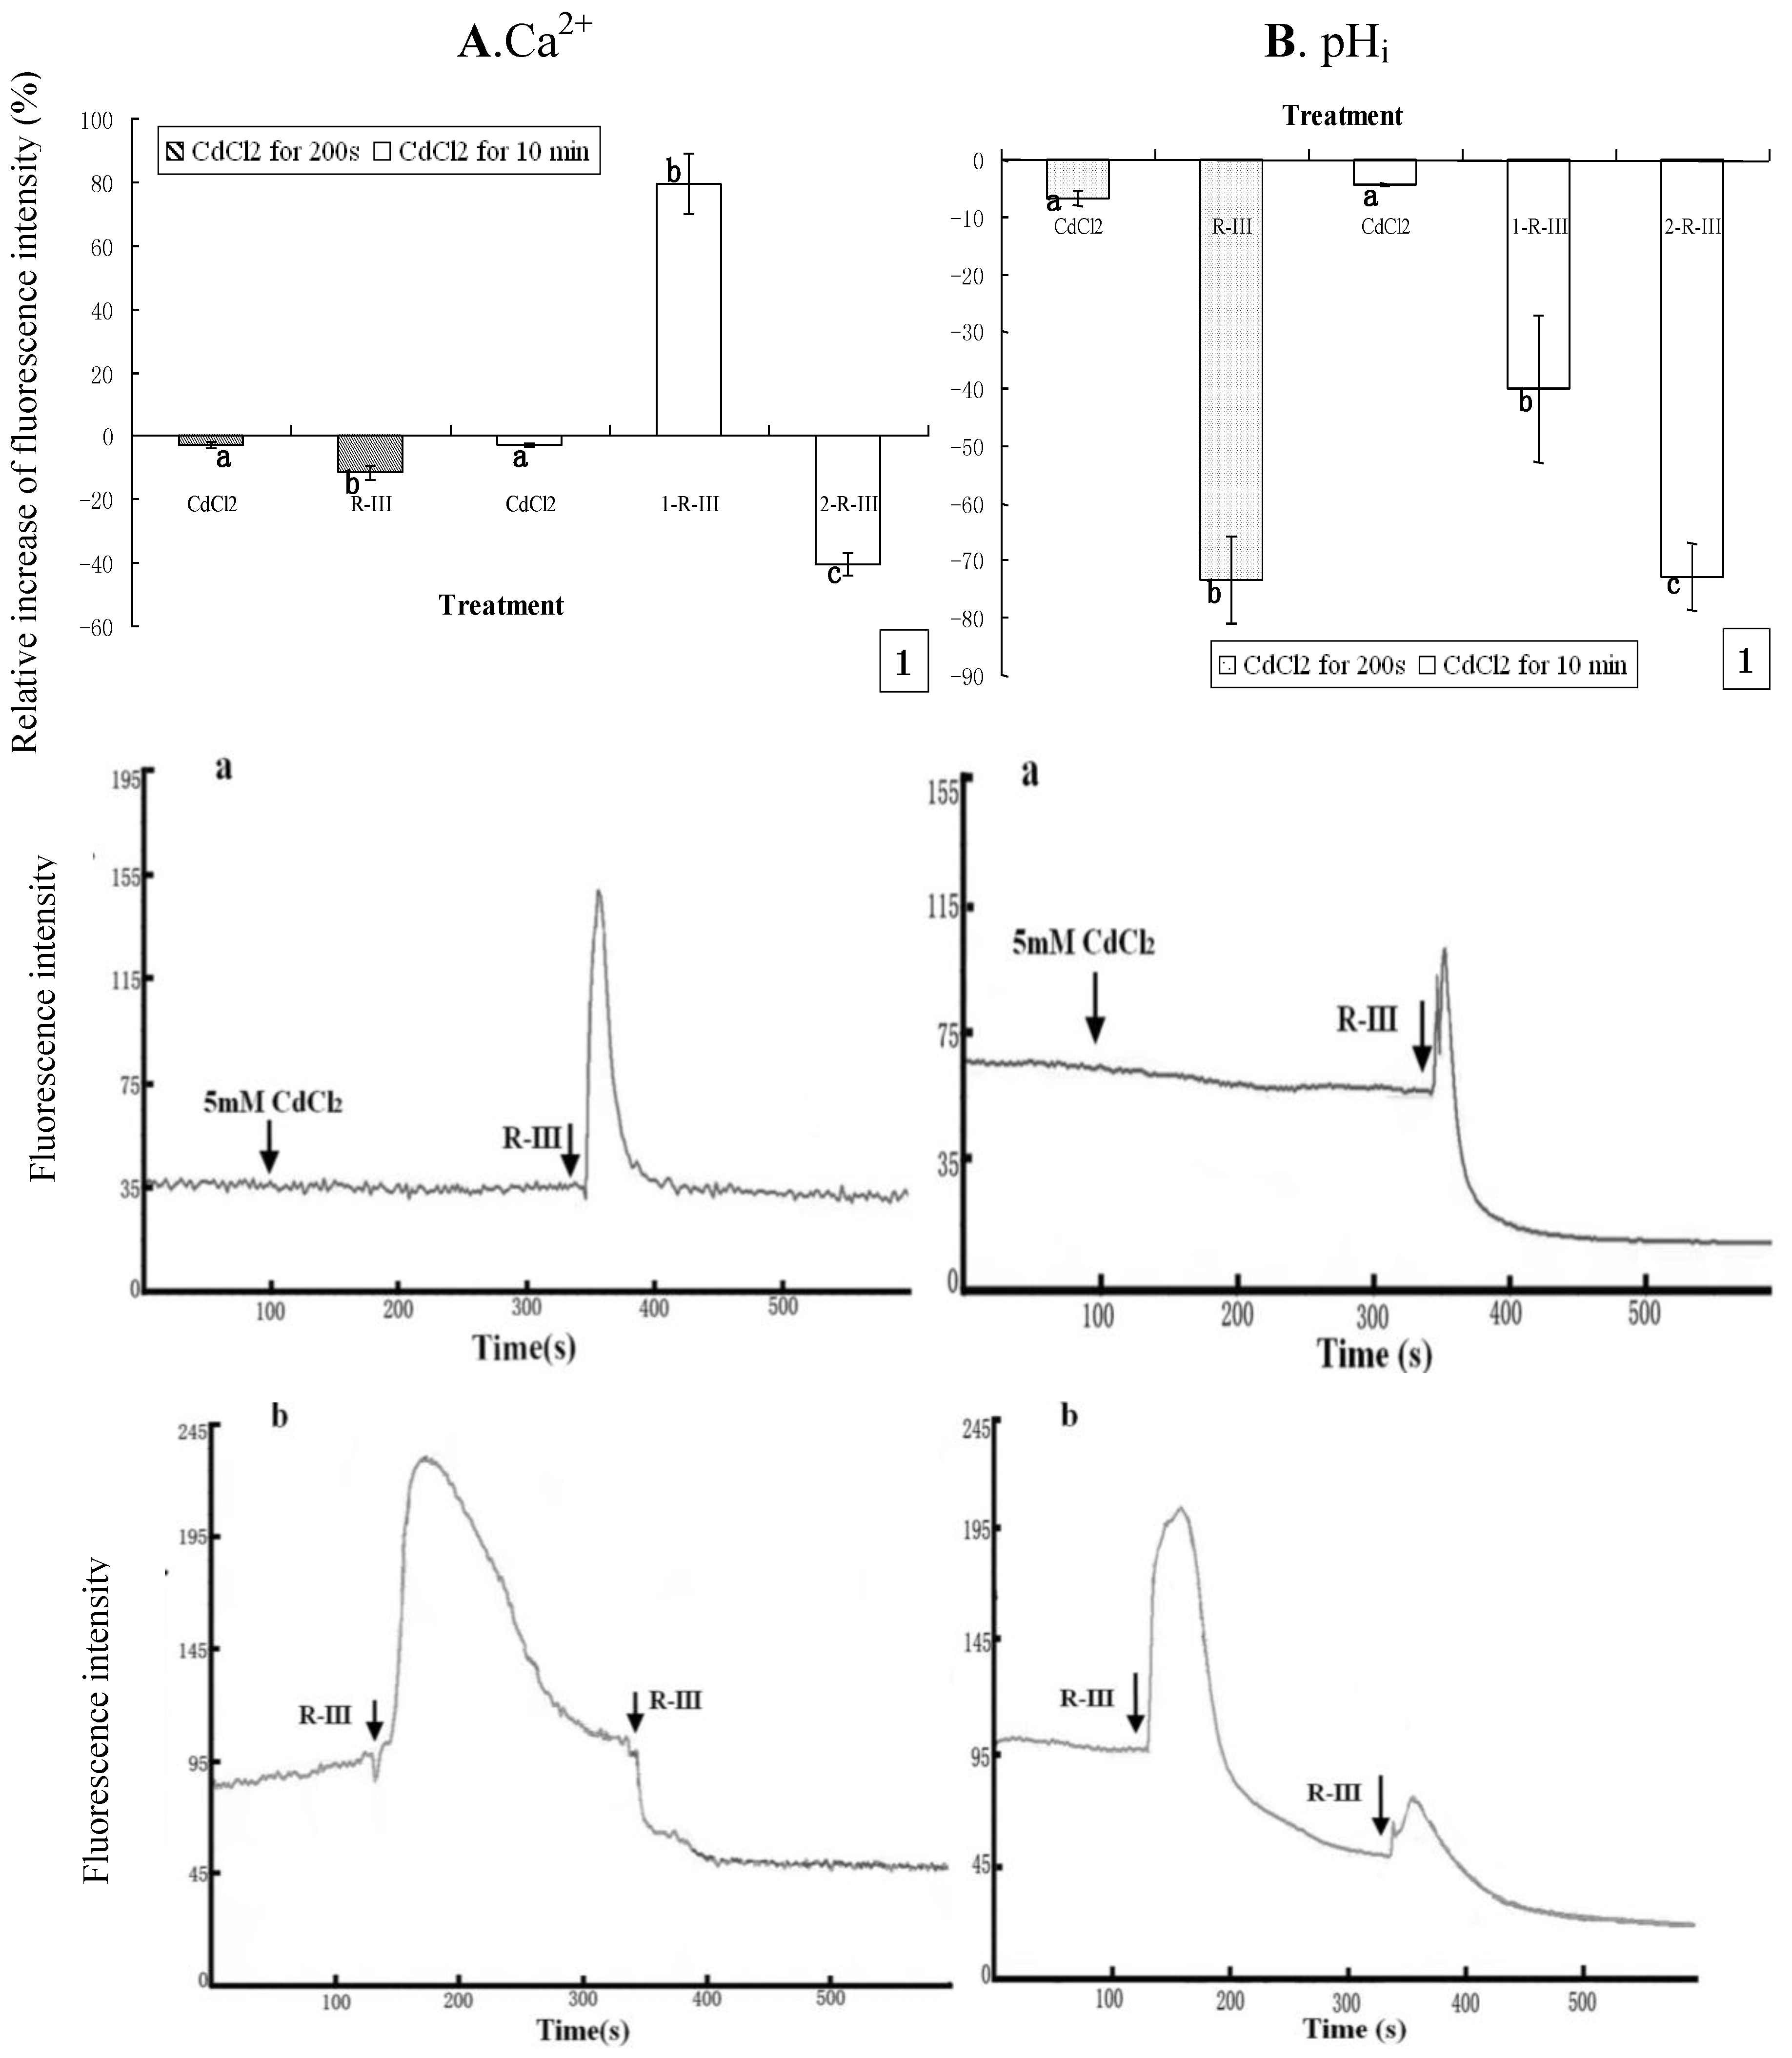
To further clarify the sources of Ca
2+ and the response of intracellular Ca
2+ stores in Sf9 cells stimulated by R-III, we repeated the above experiment with the only different condition of cells being exposed to Dhanks. As shown in
Figure 7Aand
Figure 7B, [Ca
2+]
i and pH
i of Sf9 cells indicated only a slight decline in case of incubation with CdCl
2 for 200s or 10 min. However, the subsequent addition of stimulation by R-III to Sf9 cells after incubation with CdCl
2 for 200 s gave rise to a dramatic decrease of pH
i by rate of 73.36% and only a slight decrease of [Ca
2+]
i (11.55%) ( 7A1 and
Figure 7B1). Under this condition, we got the information from
Figure 7A-a that [Ca
2+]
i showed only a transient increase followed by a rapid recovery to the basal level, which explained well the only slight change of [Ca
2+]
i in this time interval. Since cells were in presence of Ca
2+ free solution, and Ca
2+ channels in PM were at least partially blocked, the transient increase of [Ca
2+]
i should mainly derive from intracellular Ca
2+ stores, which further prove the contribution of intracellular Ca
2+ stores to the changes of intracellular Ca
2+.
Figure 7.
Effect of Ca2+ channels block on [Ca2+]i and pHi in R-III-induced Sf9 cells in presence of Dhanks. (A1). changes of [Ca2+]i in Sf9 cells treated with 0.5 mM CdCl2 for 200 s and 10 min prior to stimulate with R-III (100 μg/mL), as indicated by relative change of Fluo-3AM fluorescence intensity; (Aa). Dynamic changes of [Ca2+]i in Sf9 cells incubated with CdCl2 (5 mM) for 200 s prior to stimulate with R-III (100 μg/mL); (A-b). Dynamic changes of [Ca2+]i in Sf9 cells incubated with CdCl2 (5 mM) for 10 min prior to stimulate with R-III (100 μg/mL) for two times; (B). pHi profile in cells subjected to the protocol in (A). Results of representative experiment derived from three repetitions and 4–6 cells were measured in each repetition. The error bars represent mean ± SEM for data derived from value of relative fluorescence intensity in each time interval. Treatment means sharing the same letter were not significantly different from each other (P < 0.05). The negative value meant decrease of relative fluorescence intensity in cells.
![Molecules 16 03179 g007]()
Meanwhile, pH
i under these conditions also showed a transient increase similar with that of [Ca
2+]
i, but decline finally to a state much lower than the basal level (
Figure 7B-a), which induced a high rate of pH
idecrease (
Figure 7A1) differing from the change of [Ca
2+]
i. Nevertheless, cells pretreated for 10 min with CdCl
2 (5 mM) presented an markedly increase of [Ca
2+]
i by rate of 79.43% in the first stimulation of R-III for 200 s, and the second stimulation of R-III induced [Ca
2+]
i decrease by 40.35% (
Figure 7A1). Knowing from the dynamic trace in
Figure 7A-b, [Ca
2+]
i in Sf9 cells showed a transient elevation followed by a gradual decline to basal level in the first stimulation of R-III, which made the peak of dynamic trace much wider than that of
Figure 6A-b, suggesting that [Ca
2+]
i was much higher in this time interval. In contrast, R-III induced a decrease of pH
i by rate of 39.85% in first stimulation and 72.78% in the second stimulation (
Figure 7B1). We found from
Figure 7B-b that pH
i in Sf9 cell also showed a transient elevation, but followed by a rapid decline in the first stimulation of R-III. The peak of dynamic trace also became wider comparing to that of
Figure 6A-b. Although the reason for these phenomenon was not clear, the results in this assay further indicated that pH
i showed proportional change with [Ca
2+]
i+ in response to the stimulation of R-III on the whole.
It is known that the functional relationships and crosstalk between calcium and pH receive more and more attention, specially, on human cells, but little on insect cells. Although many studies show that changes of pH
iare associated with that of [Ca
2+]
i in a number of cell types, a clear relationships between the steady state level of pH
i and [Ca
2+]
i is not observed in present because interrelationships between pH
i and [Ca
2+]
i are rather complex and depend on the cell type [
37]. A few studies show that cytosolic alkalinization shift is associated with the increase of [Ca
2+]
i [
38] and that acidification shift is associated with the decrease of [Ca
2+]
i [
39]. More specifically, an experimental report on crayfish muscle fibre from Kaila and Voipio [
40] shows that resting cytosolic calcium is decreased by intracellular alkalosis. In present study, the changes of pH
i in Sf9 cells induced by R-III show distinct proportion with that of [Ca
2+]
i, which also suggests that cytosolic alkalinization or acidification are associated with changes of [Ca
2+]
i, but the specific interaction mechanism of pH
i and [Ca
2+]
i in these conditions remains unclear, and need further researches to clarify.


