2.1. Electronic Spectra of CIP and NADP and Their Complexes with Al(III)
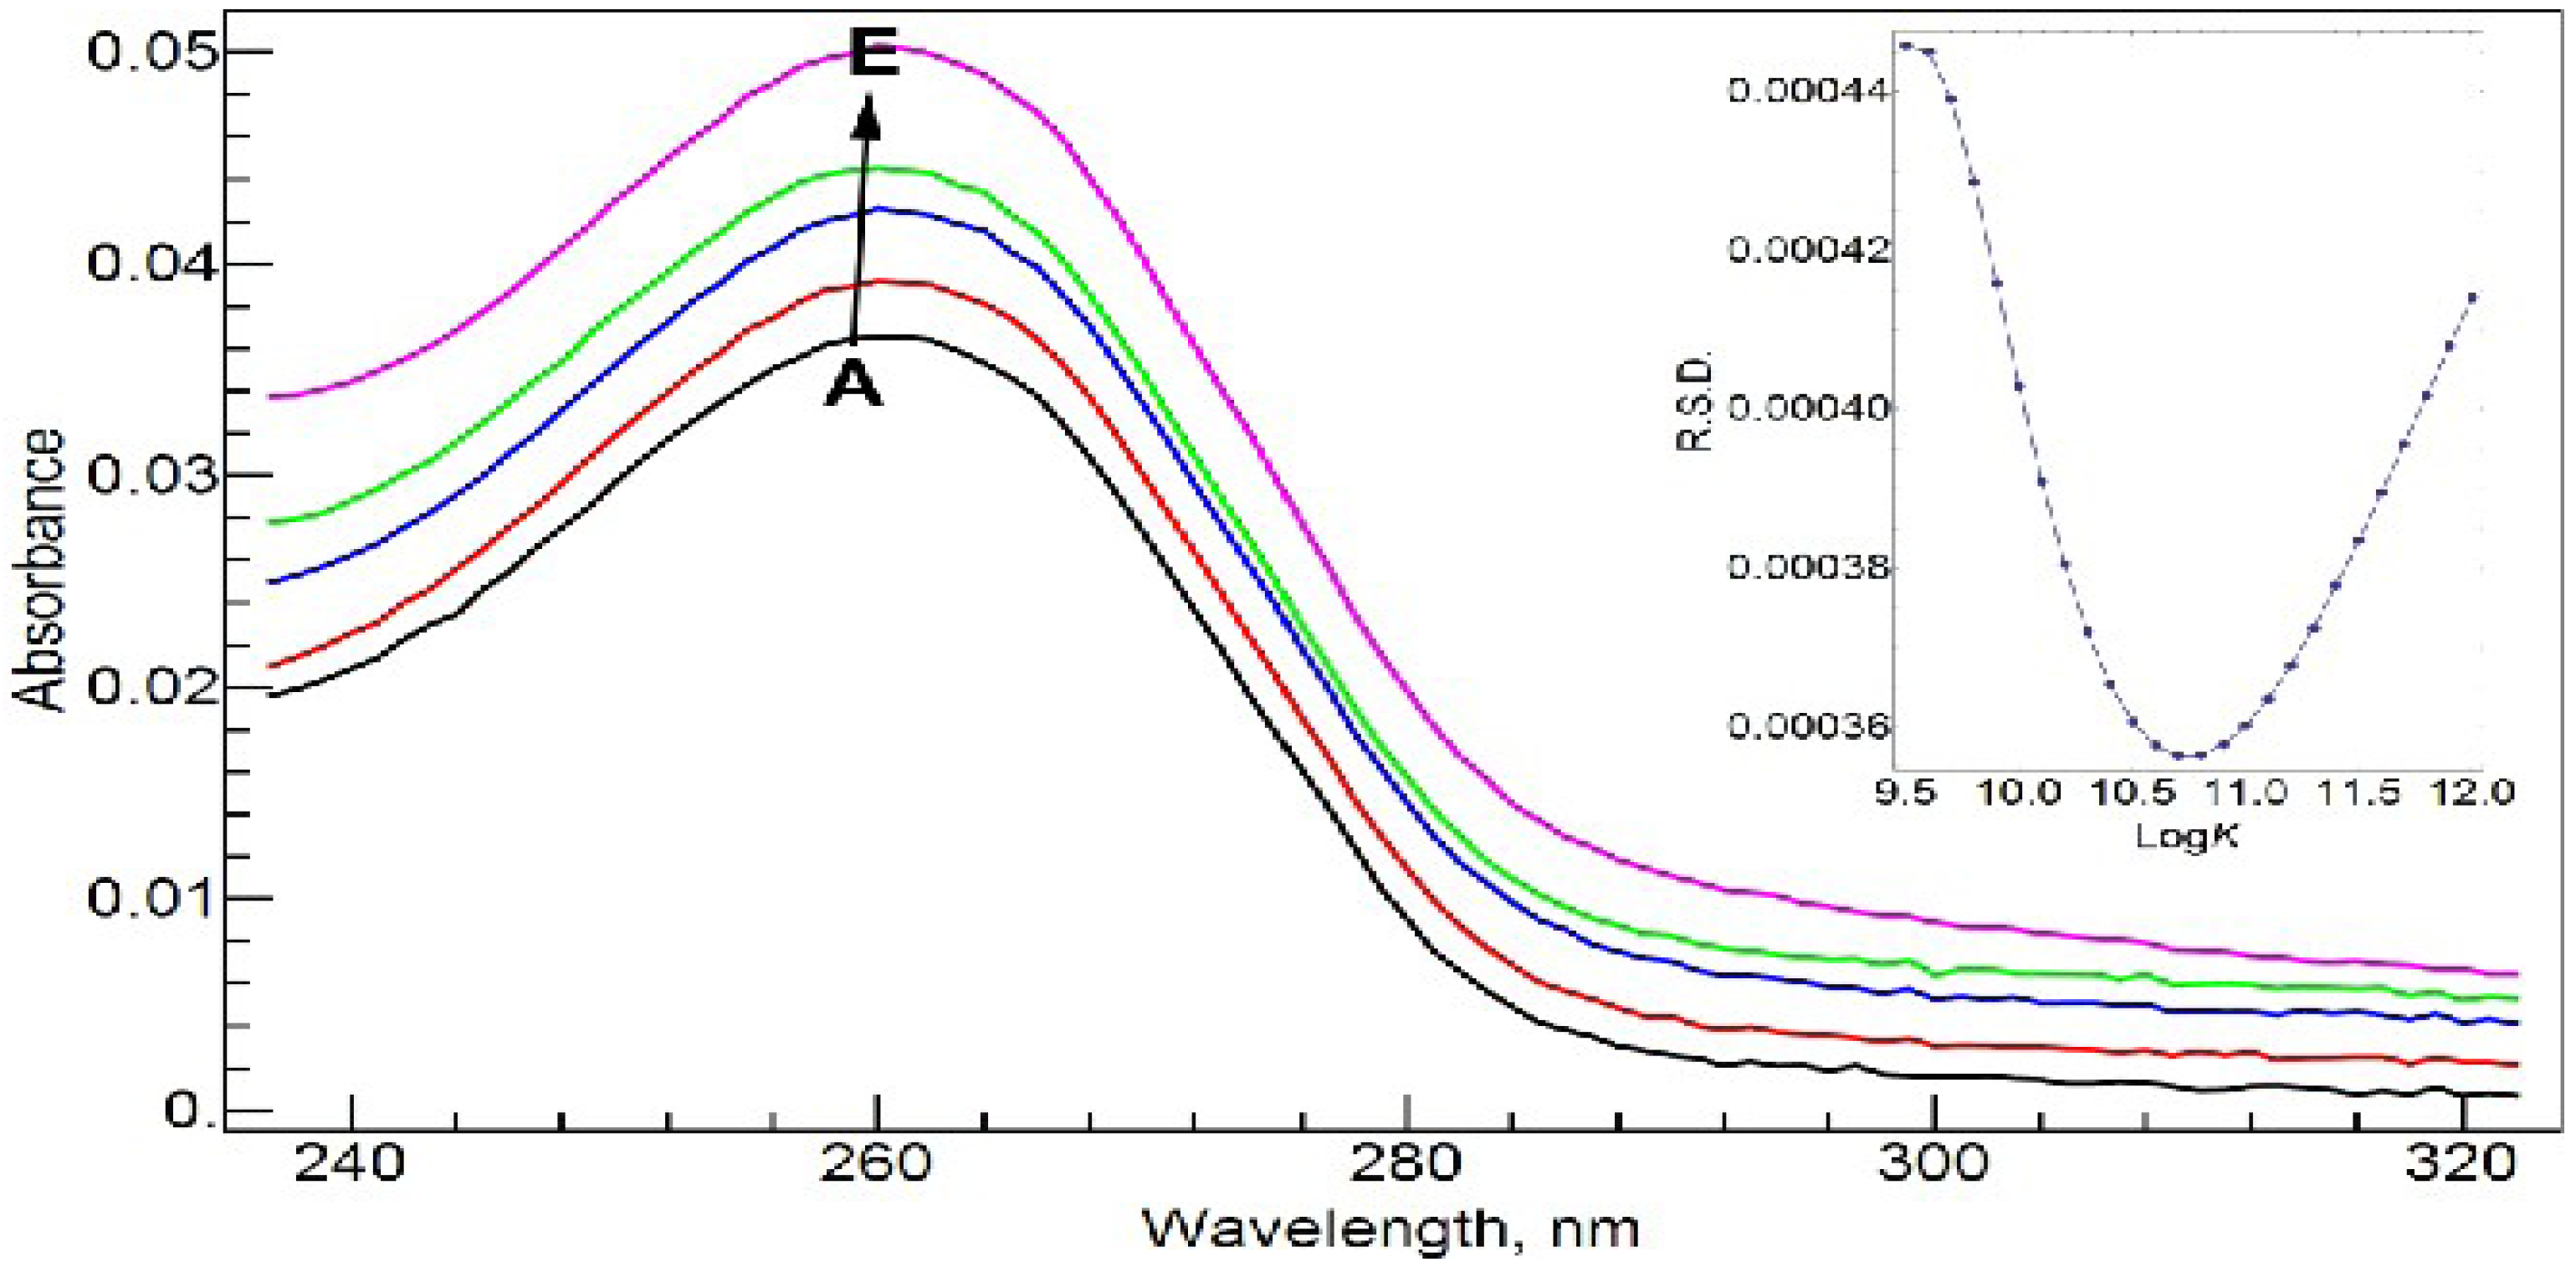
In Tris-HCl buffer solution at pH = 7.0, the absorption spectrum of 20 µM CIP has a strong absorbance band at 272.0 nm and two much weaker absorbances near 323.0 nm (error: ±0.1 nm, the subsequent errors are the same) and 335.0 nm, respectively (
Figure 3A). Upon complexation with Al(III), the major absorbance band at 272.0 nm shifts slightly to the red direction (
Figure 3C–E). After the addition of 1 molar equivalent of Al(III), the maximum absorbance peak shifts to 275.0 nm. The red shift suggests that the complexation between Al(III) and CIP via the carboxylate and ketone groups might form a six-member ring, and disturb the conjugation system of the fluoroquinolone structure.
Figure 3.
Absorption spectra of CIP and Al(III)-CIP at different molar ratios of metal to ligand. The inset shows the curve of RSD vs. logK for the RAFA analysis of the spectra. A–E: 20 µM cCIP, 10 mM Tris-HCl buffer solution (pH = 7.0); cAl(III), 0 (A), 5 (B), 10 (C), 15 (D) and 20 (E) µM.
Figure 3.
Absorption spectra of CIP and Al(III)-CIP at different molar ratios of metal to ligand. The inset shows the curve of RSD vs. logK for the RAFA analysis of the spectra. A–E: 20 µM cCIP, 10 mM Tris-HCl buffer solution (pH = 7.0); cAl(III), 0 (A), 5 (B), 10 (C), 15 (D) and 20 (E) µM.
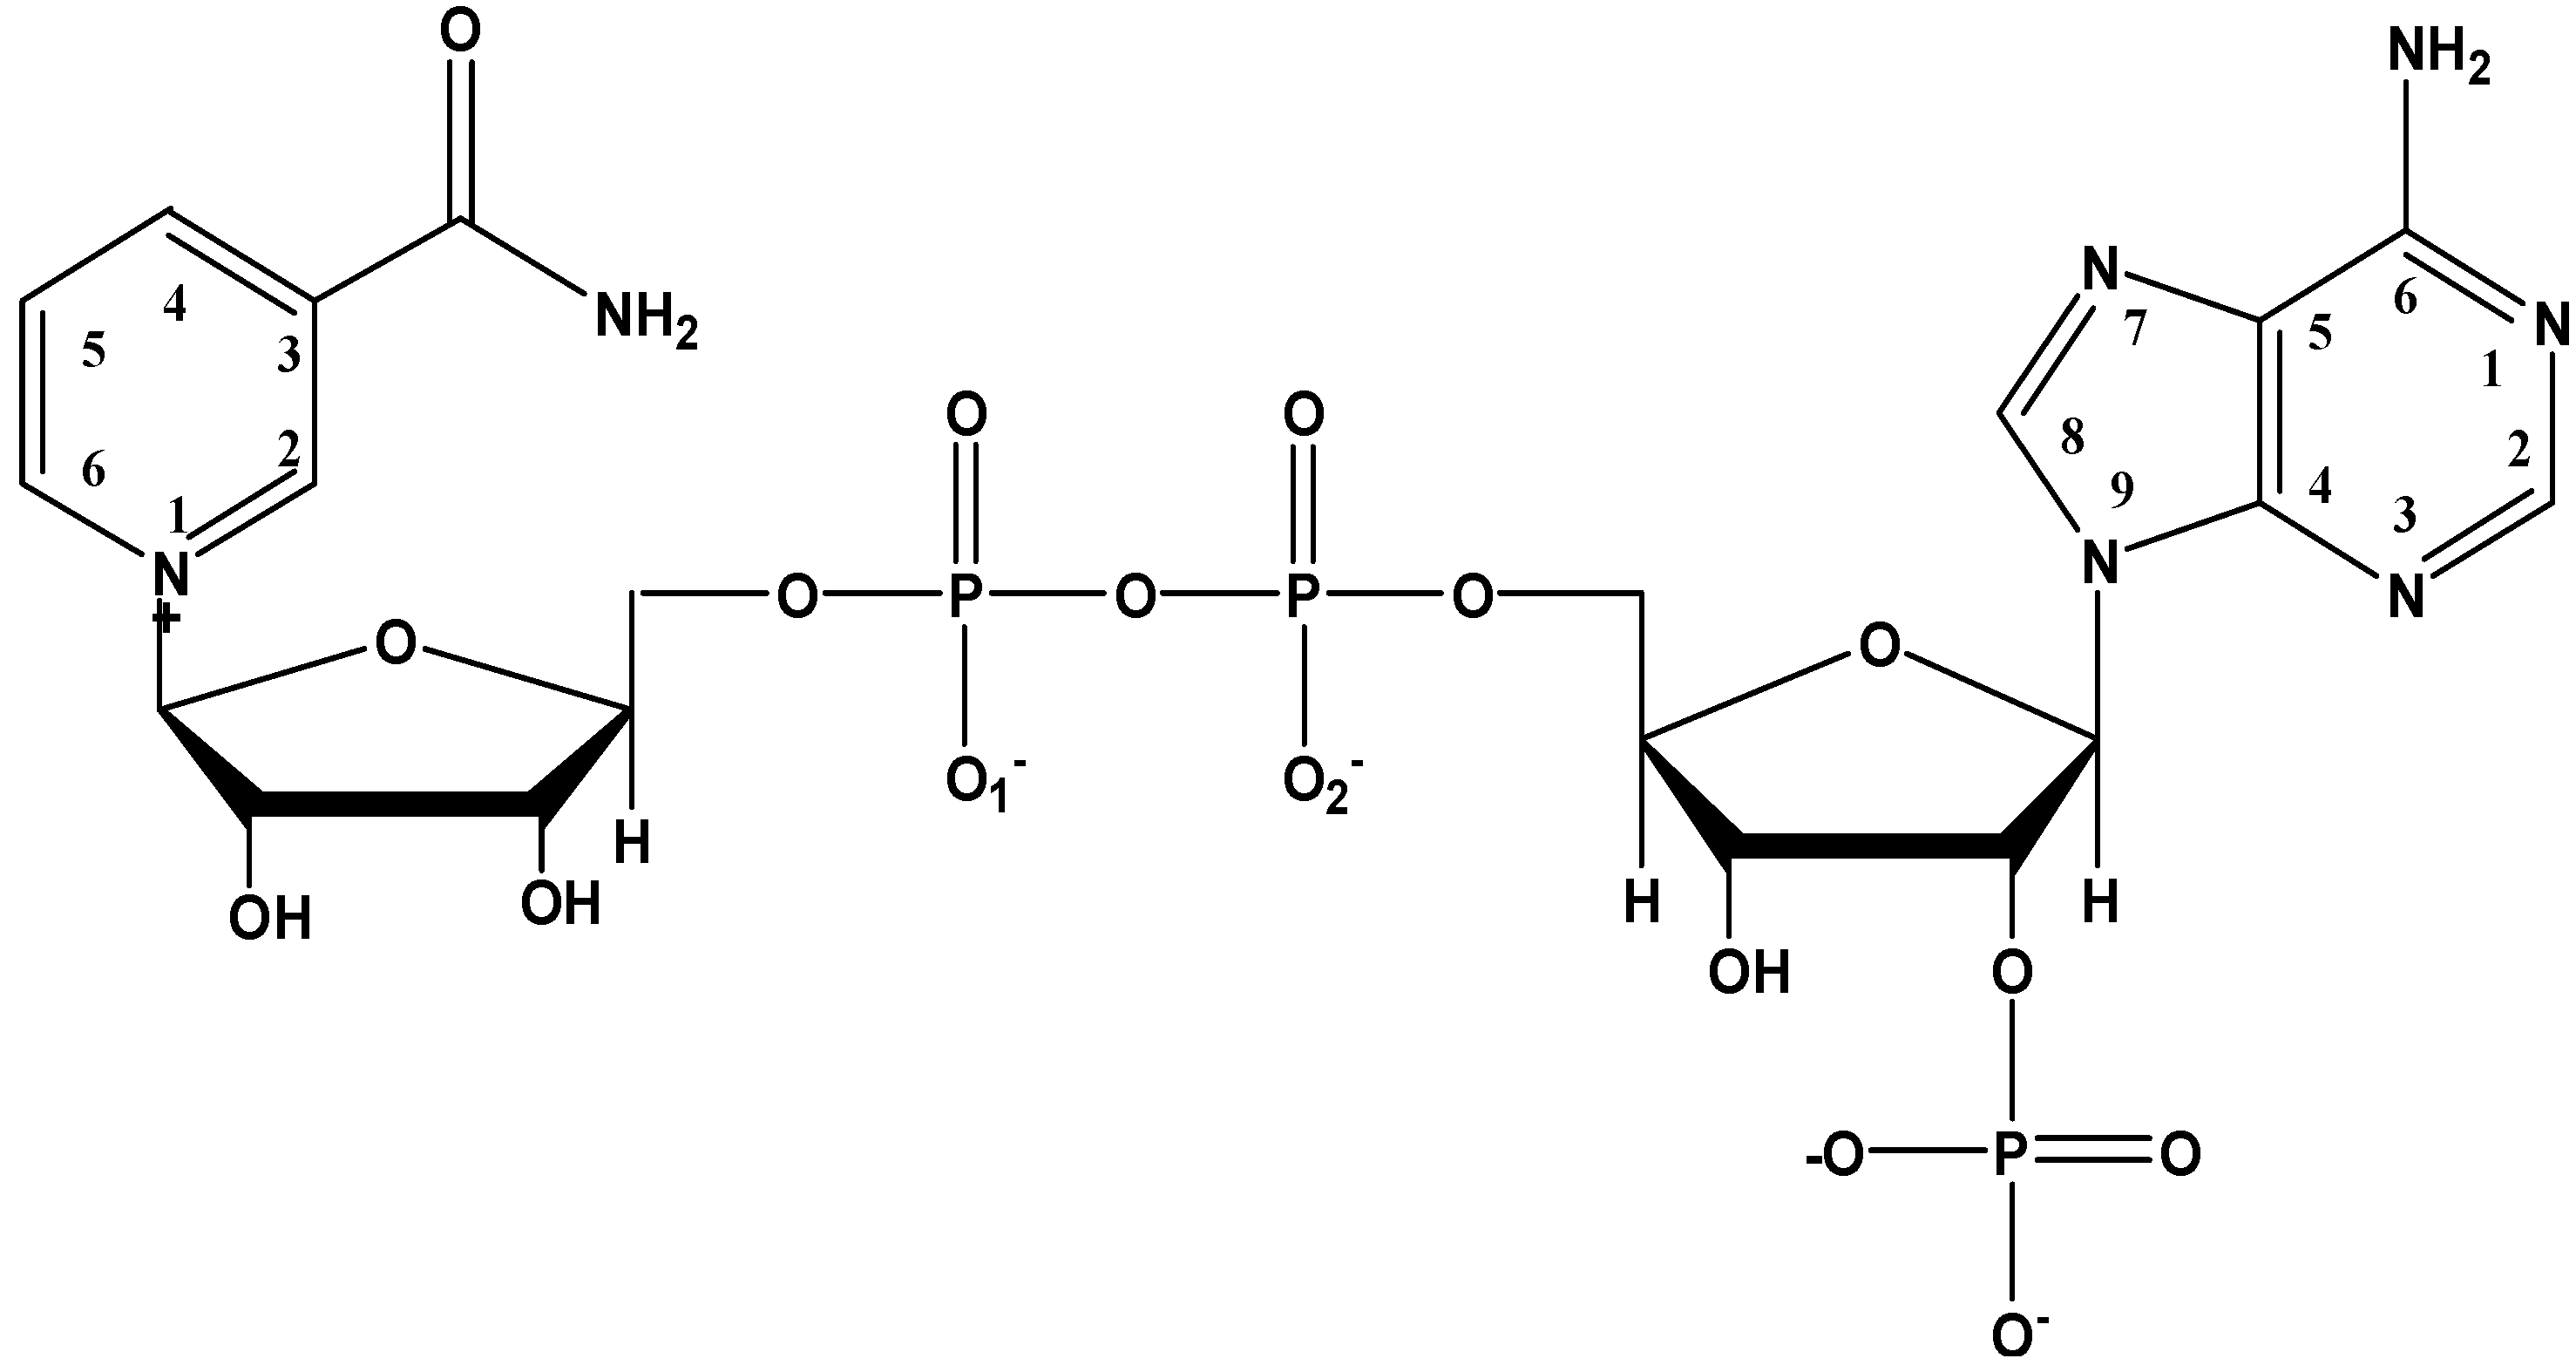
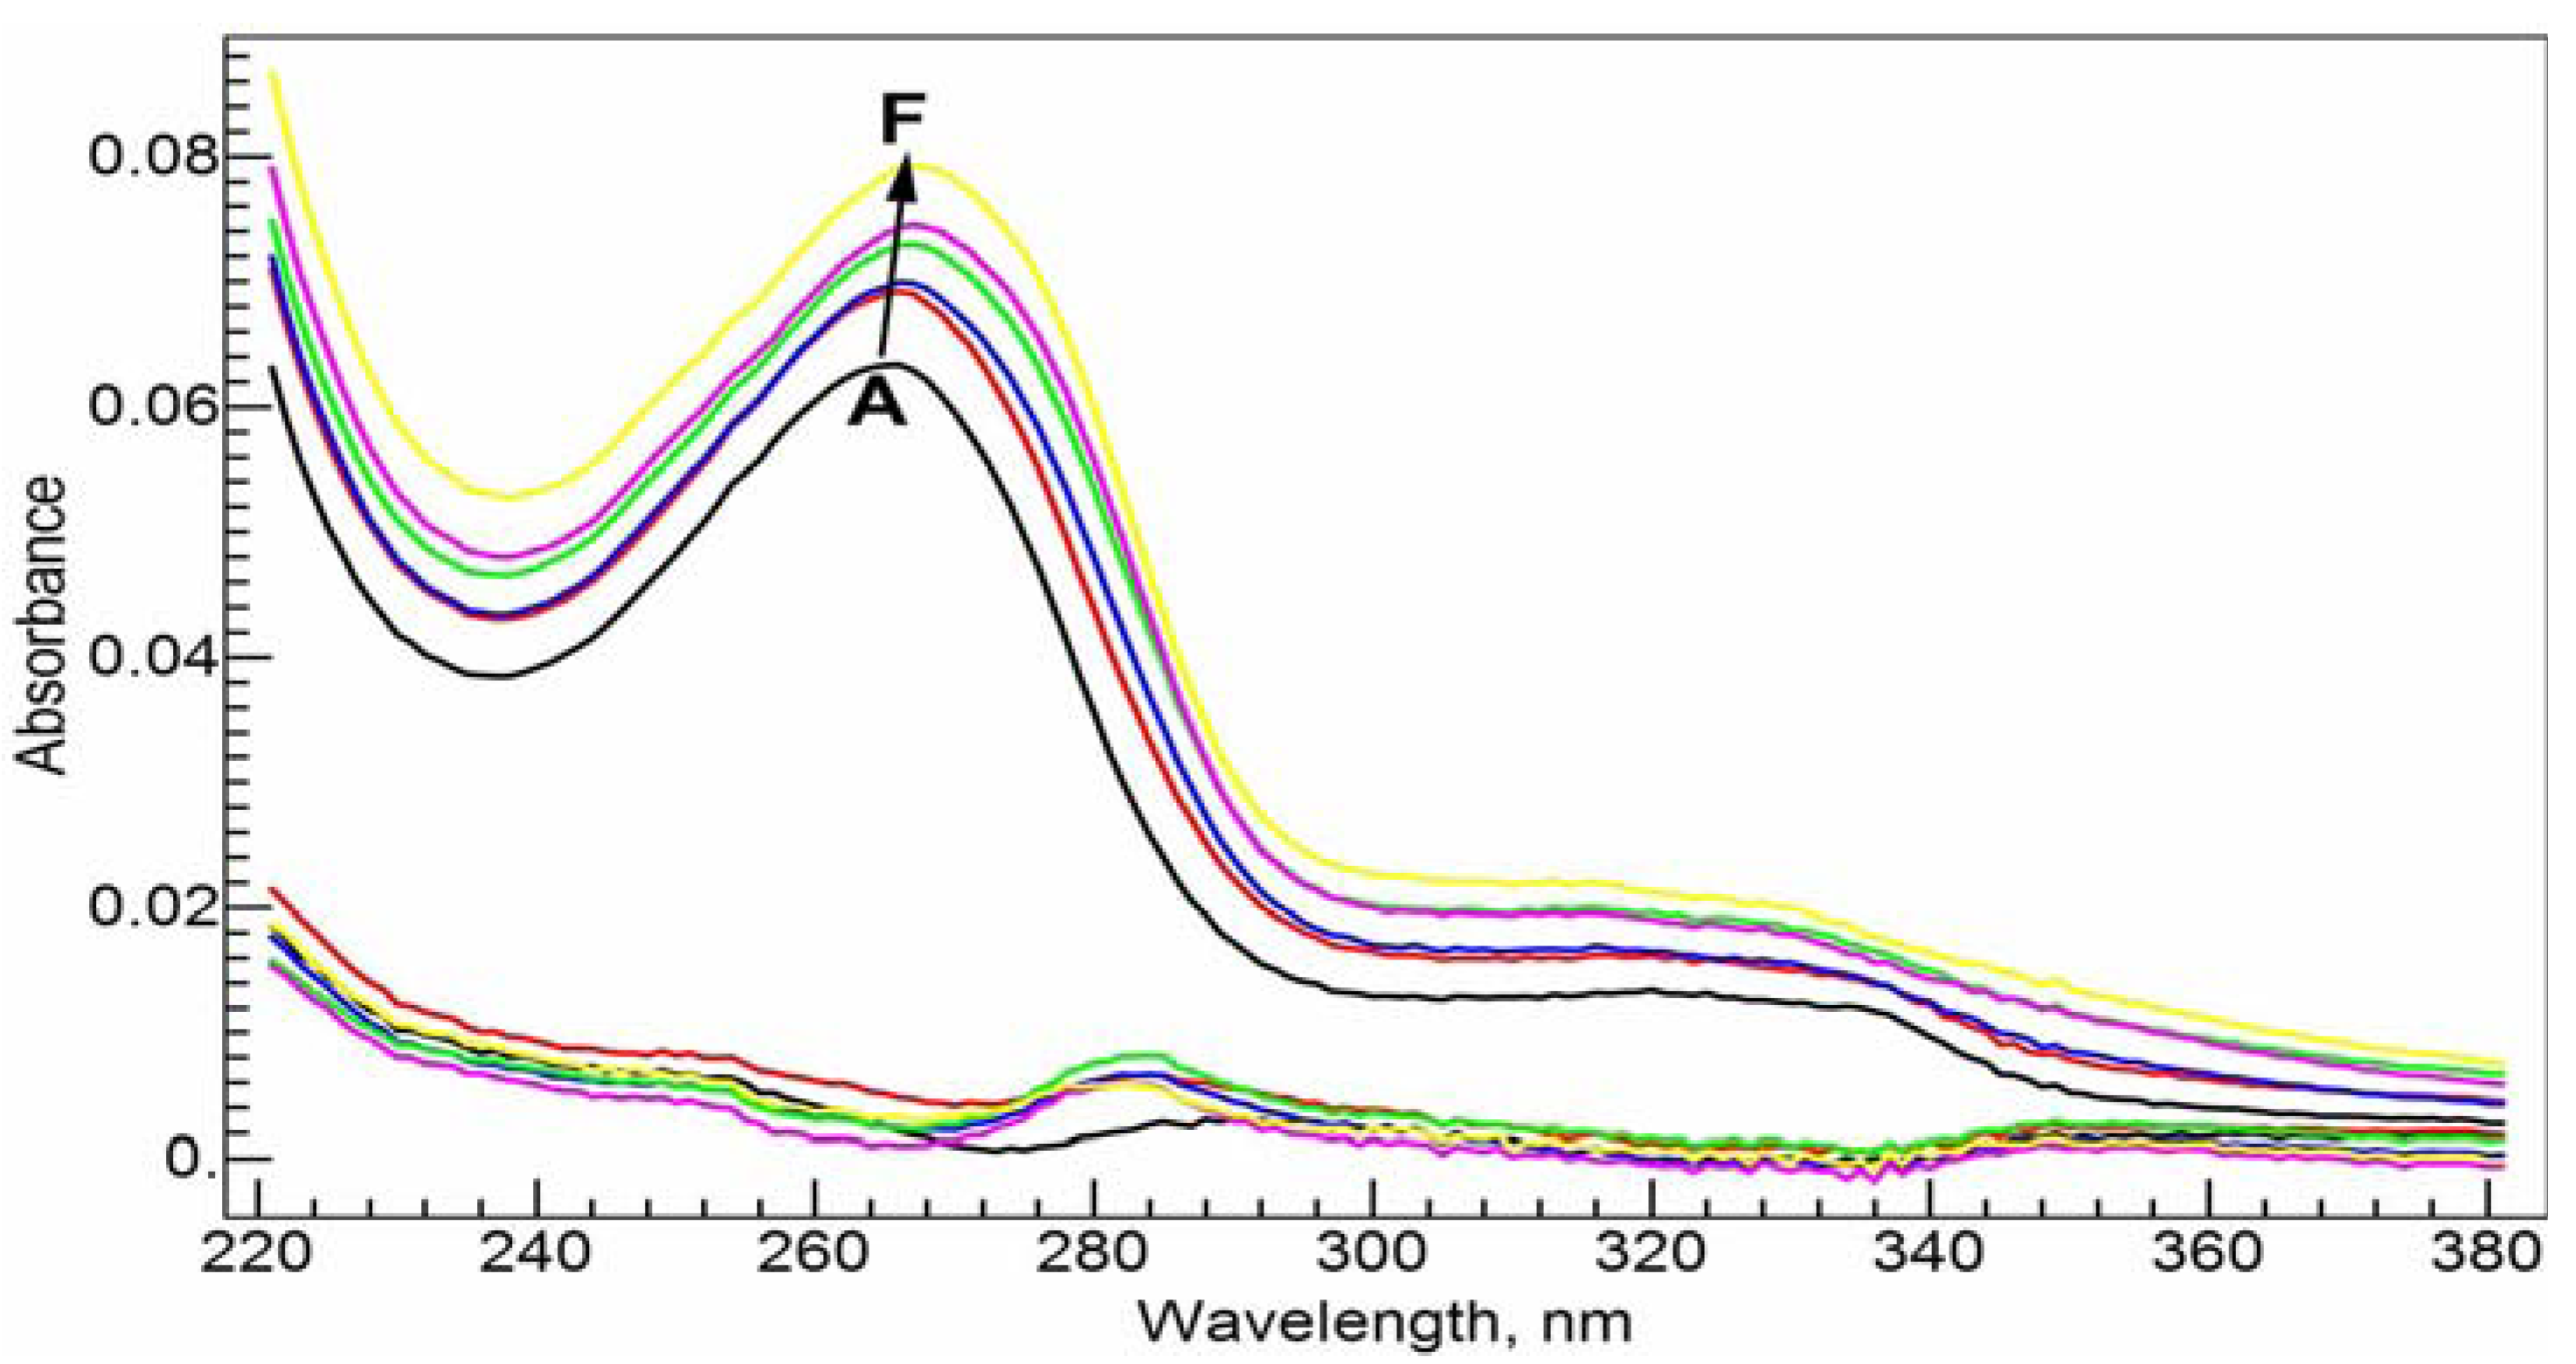
Figure 4 shows the absorption spectra of 20 µM NADP and its complex with Al(III) in Tris-HCl buffer solution at pH = 7.0 at different molar ratios of metal to ligand. NADP has an absorbance band at 261.0 nm due to the adenine ring. As well known, Al(III) shows strong binding ability with the phosphate group in NADP [
20,
21]. The complexation does not cause a change in the maximum absorbance wavelength, but the absorbance intensity increases with the concentration of Al(III) in a nearly linear fashion.
Figure 4.
Absorption spectra of NADP and Al(III)-NADP at different molar ratios of metal to ligand. The inset shows the curve of RSD vs. logK for the RAFA analysis of the spectra. A–E: 20 µM cNADP, 10 mM Tris-HCl buffer solution (pH = 7.0); cAl(III), 0 (A), 5 (B), 10 (C), 15(D) and 20 (E) µM.
Figure 4.
Absorption spectra of NADP and Al(III)-NADP at different molar ratios of metal to ligand. The inset shows the curve of RSD vs. logK for the RAFA analysis of the spectra. A–E: 20 µM cNADP, 10 mM Tris-HCl buffer solution (pH = 7.0); cAl(III), 0 (A), 5 (B), 10 (C), 15(D) and 20 (E) µM.
In
Figure 5, we first mixed 20 µM NADP and 20 µM CIP in Tris-HCl buffer solution at pH = 7.0 and then measured how the absorption spectra of the ligands change upon the addition of Al(III) at different concentrations. Because the major absorbance bands of CIP and NADP overlap to a great degree, not much new information appears at first sight. We decided to calculate the conditional stability constants of Al(III) with the two ligands from the spectra in
Figure 3 and
Figure 4. Without considering the protonation states of the ligands, the complexation reactions can be written as the following equations, where
Ka and
Kb are the corresponding complex formation constants and charges are ignored for the ligands and the complexes:
At pH = 7.0, we need to take the hydrolysis reactions of Al(III) into account. The reactions can be generally written as follows:
The accumulated hydrolysis constants in the common logarithm (lgβ) for q = 1, 2, 3 and 4 are −5.5, −11.1, −16.6 and −23.2 (25 °C, I = 0.16), respectively, for producing the Al(OH)2+, Al(OH)2+, Al(OH)3 and Al(OH)4− species.
Figure 5.
Absorption spectra of the ternary Al(III)-CIP-NADP system at different molar ratios of metal to ligand. The bottom curves are the calculated residual spectra using the RAFA analysis. A–F: 20µM cNADP, 20µM cCIP, 10 mM Tris-HCl buffer solution (pH = 7.0); cAl(III), 0 (A), 5 (B), 10 (C), 15 (D), 20 (E) and 25 (F) µM.
Rank annihilation factor analysis (RAFA) has been a well-studied and effective method to calculate the stability constants from spectroscopic data [
22,
23,
24,
25,
26]. The method merits from using all the range of spectroscopic intensity values at different molar ratios instead of using just the maximum peak absorbance values. In addition there is no need to know the spectrum of the complex in advance. The whole-range spectroscopic data at a series of molar ratios form a matrix, while the spectrum of the pure ligand is used to decrease the rank of the matrix by 1. Principal component analysis (PCA) is used to analyze the matrix. The eigenvalues of the covariance matrix of the spectroscopic data are used to determine the major species contributing to the spectra. The commonly used relative standard deviation (RSD), which was calculated from the eigenvalues, was adopted to find the stability constants. See the insets of
Figure 3 and
Figure 4.
Through the RAFA method, we found that the spectra in both
Figure 3 and
Figure 4 are mainly due to two species, the ligand and 1:1 complex. The possibility for the 1:2 (M/L) complex is small. The conditional stability constants at pH = 7.0 are found to be log
Ka = 10.2 and log
Kb = 10.7. NADP shows slightly stronger binding ability with Al(III) than CIP. With these two conditional stability constants and the following assumptions: (1) the interaction between the ligands (CIP and NADP) is negligible, and (2) at the μM concentration level, the chance to form the mixed ternary complex, Al(CIP)(NADP) is small, we calculated the synthetic spectra at the conditions in
Figure 5 from the spectra of the pure ligands and the extrapolated spectra of the ternary complexes. The residual spectra after subtracting the synthetic spectra from the corresponding real spectra are shown in the bottom of
Figure 5. As shown, the residual spectra are largely identical except for a small region near 290.0 nm. This result can be interpreted as meaning that the above assumptions are largely sound, and the residual spectra represent a consistent system effect from the interaction between CIP and NADP.
2.2. Effect of NADP on Fluorescence Spectra of CIP and Its Complex with Al(III)
Fluoroquinolones are a kind of compound with strong fluorescence, while NADP is transparent in fluorescence. Therefore, fluorescence spectroscopy fits well the purpose to study how NADP affects the complexation between Al(III) and CIP. In
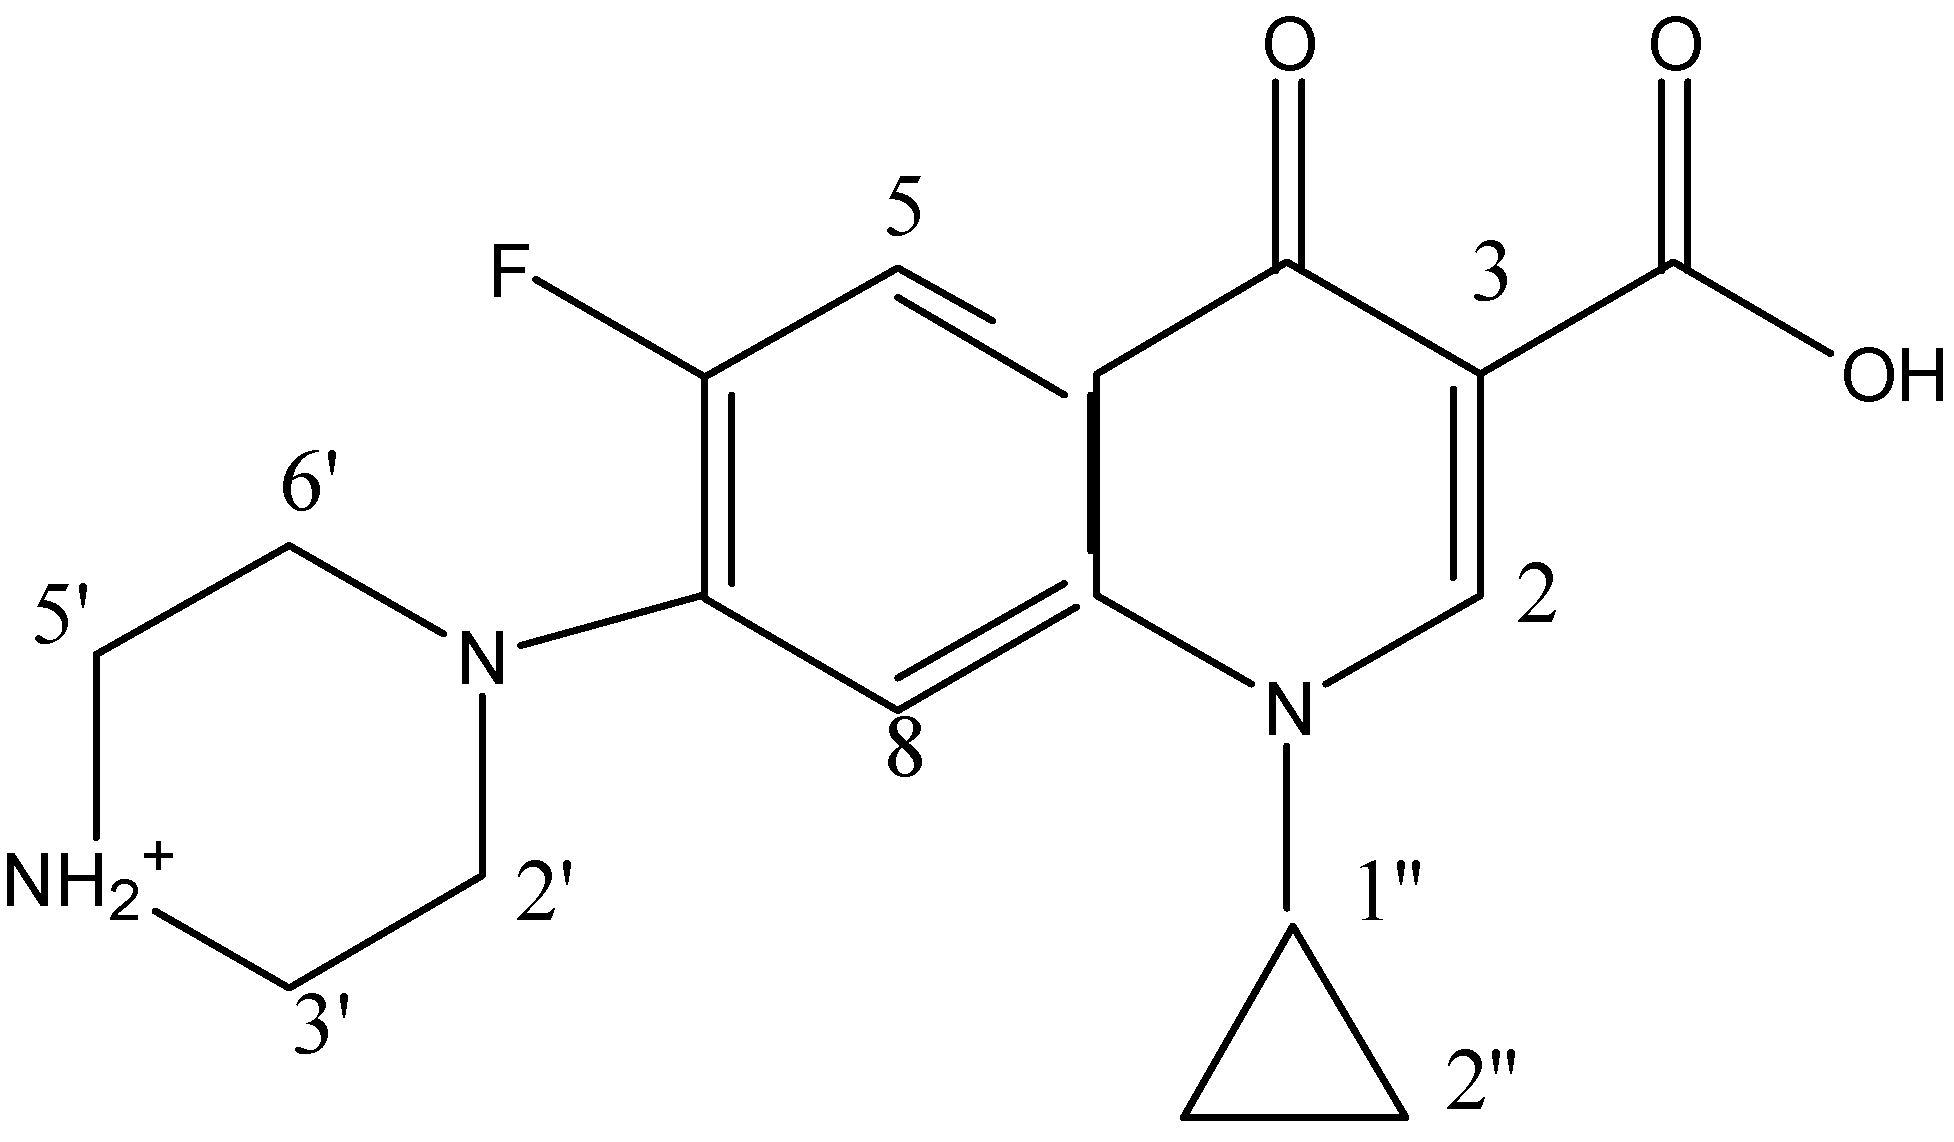
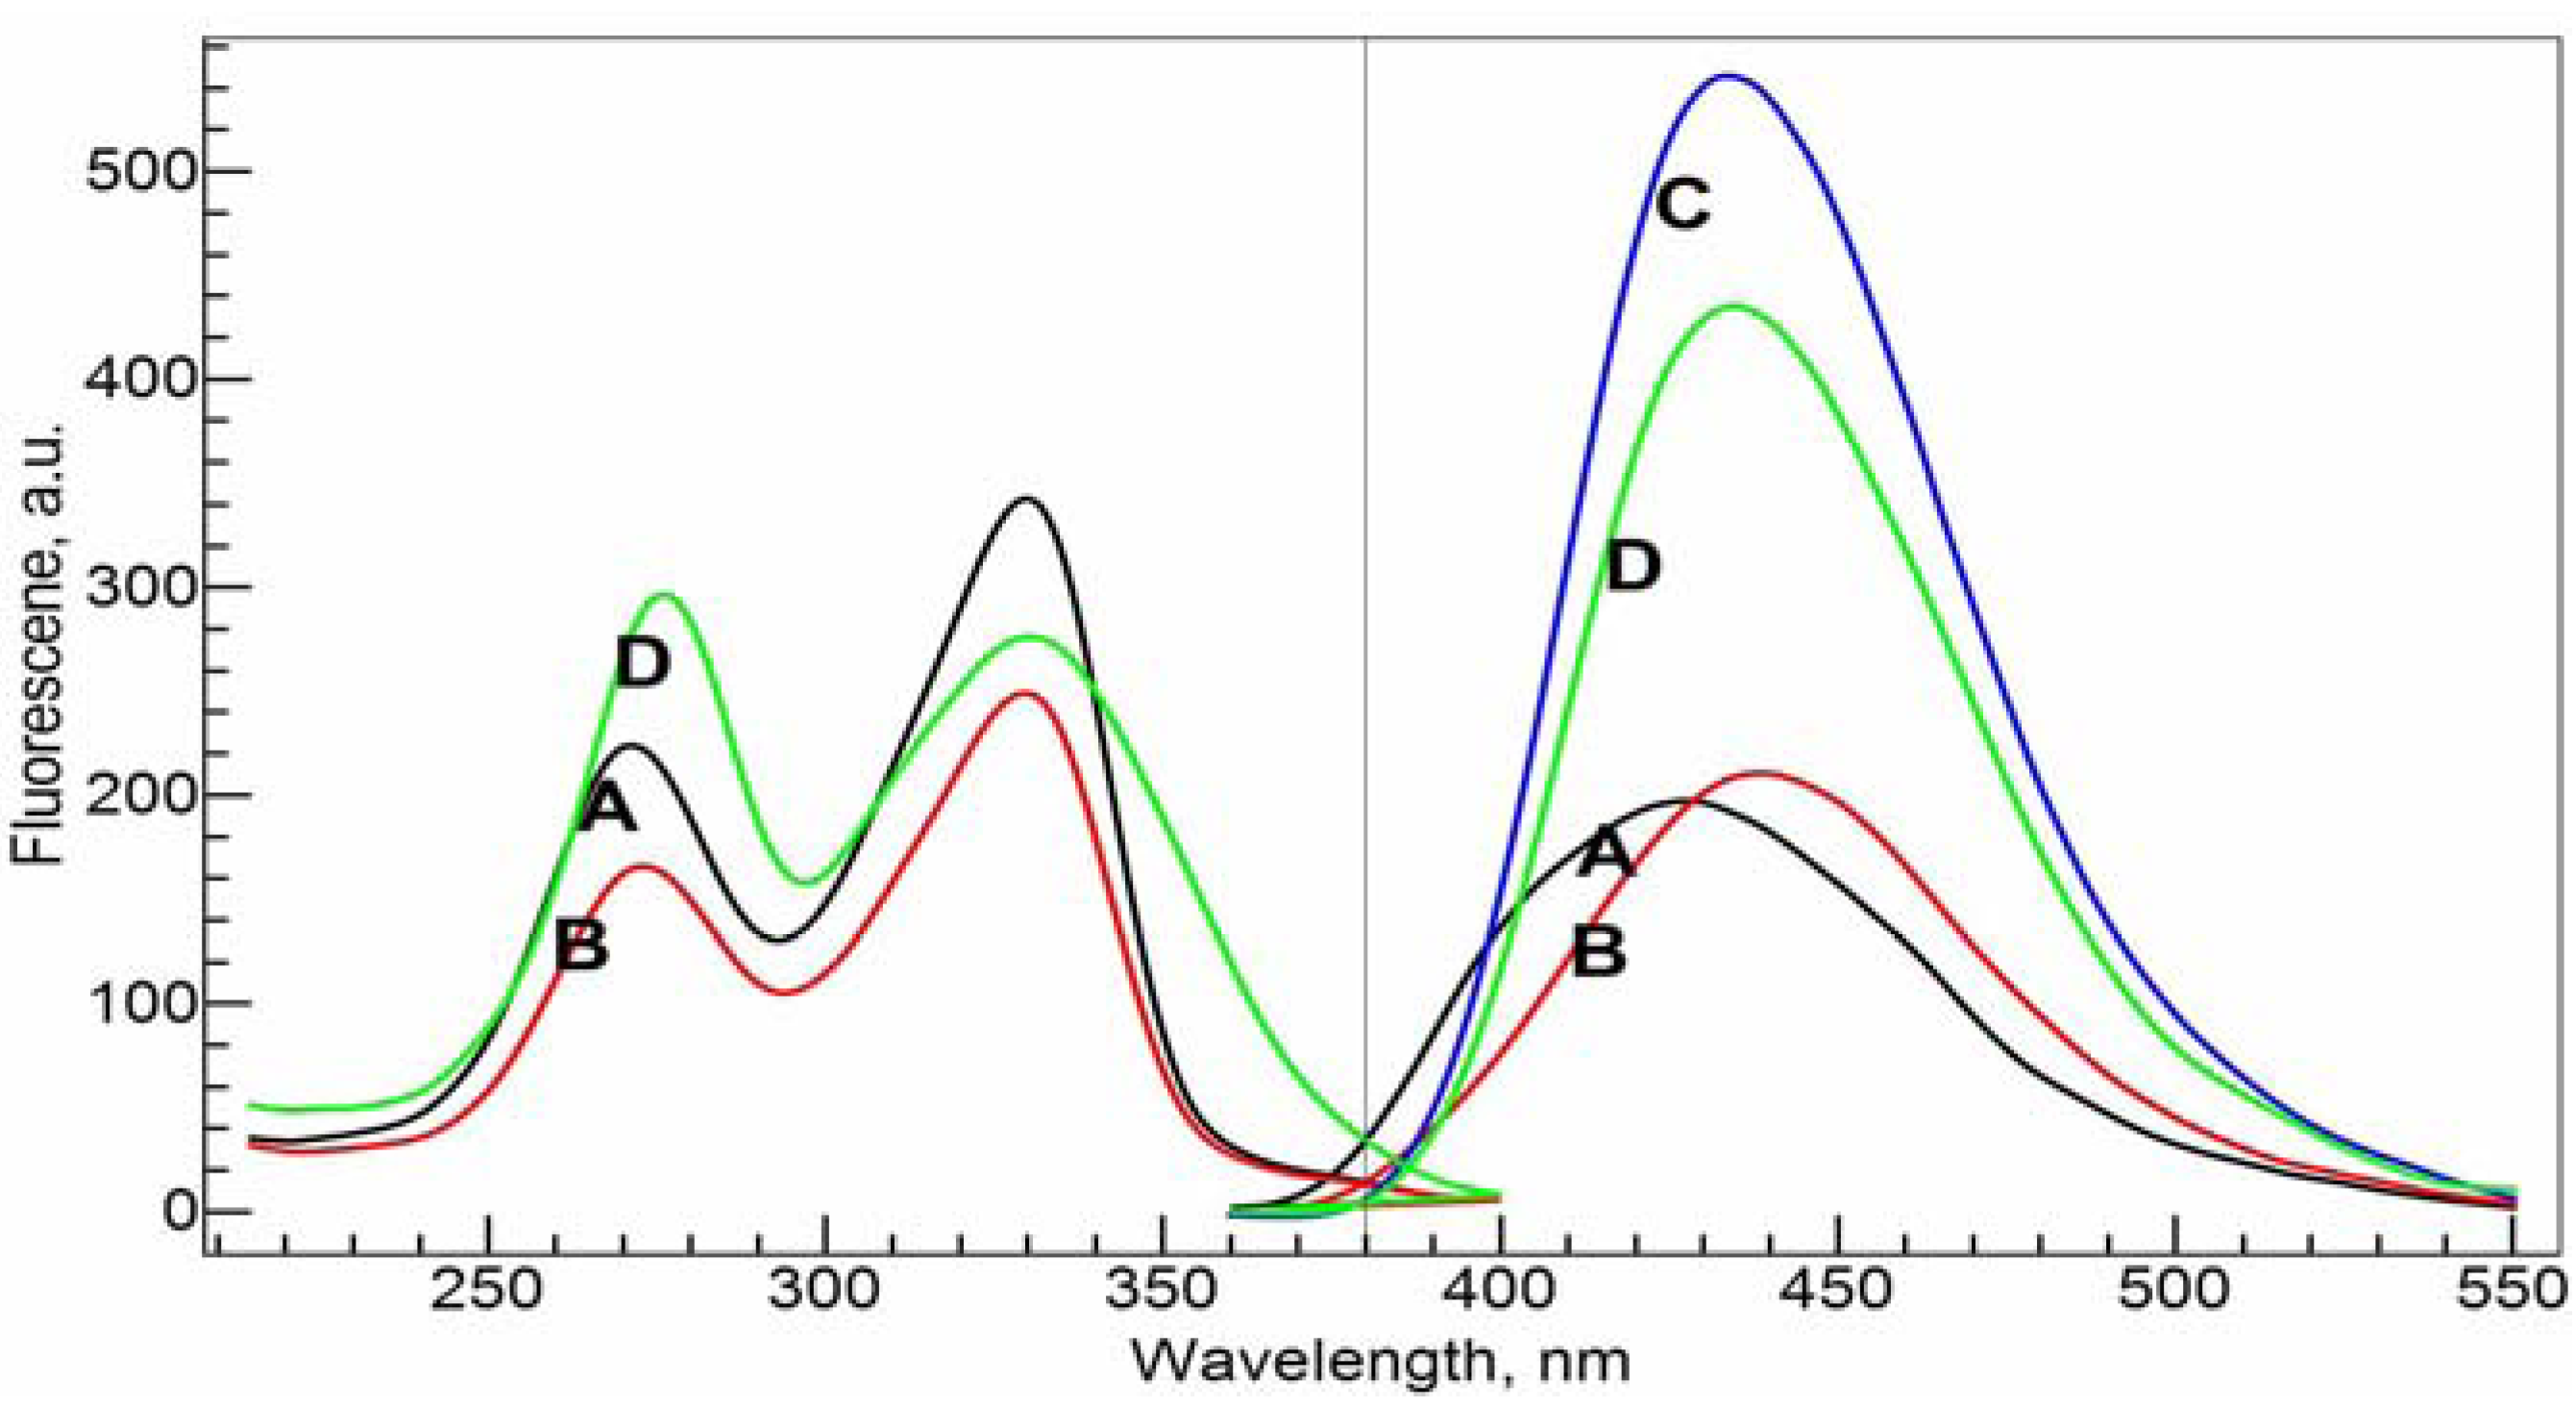
Figure 6, the emission and excitation spectra of CIP alone (A), CIP with NADP (B), Al(III) with CIP (C), and Al(III) with CIP and NADP (D) in Tris-HCl buffer solutions at pH = 7.0 are shown. Consistent with the UV-visible absorbance spectra, the ligand CIP shows two strong peaks in the excitation spectra at 271.0 nm and 330.0 nm. The former wavelength was chosen as the excitation wavelength for the following emission spectra experiments. The ternary system of Al(III)-CIP-NADP, the excitation peak at 271.0 nm shifts to 275.0 nm.
Figure 6.
Fluorescence excitation (left panel) and emission (right panel) spectra of the ligands and the complexes. A–D: 10 mM Tris-HCl buffer solution (pH = 7.0); A, 34 μM cCIP only; B, 34 µM cCIP and 20 µM cNADP; C, 34 µM cCIP and 20 µM cAl(III); D, 34 μM cCIP, 20 µM cNADP and 20 µM cAl(III). Excitation wavelength was fixed at 270 nm forthe emission spectra and emission wavelength was fixed at 430 nm for the excitation spectra.
The ligand CIP itself has a strong emission band with a maximum emission wavelength at 426.0 nm. Upon the addition of NADP, this peak shifts to 438.0 nm while the emission intensity stays the same. This indicates that there is indeed an interaction between the two ligands. With the addition of Al(III), the emission intensity increases significantly, to about 2.5 times that of the original ligand. Furthermore, the complexation also causes a red-shift of the emission spectra. The maximum emission peak of the Al(III)-CIP complex system is at 433.0 nm. With the addition of one molar equivalent of NADP [relative to Al(III)] to the binary Al(III)-CIP system, the peak decreases its intensity significantly, by about 20% of the intensity of the Al(III)-CIP complex system. On the other hand, the maximum emission wavelength shifts slightly to 435.0 nm. Qualitatively, the results show us that NADP has strong binding ability with Al(III) compared with CIP. The formation of Al(NADP) complex decreases the concentration of Al(CIP) complex and causes the intensity decreases for the complex.
The Al(CIP) complex formation and/or the competition between CIP and NADP of Al(III) seem strongly dependent on pH, and around the neutral condition of pH = 7 the emission spectrum of the complex system reaches to its maximum magnitude (data not shown).
In
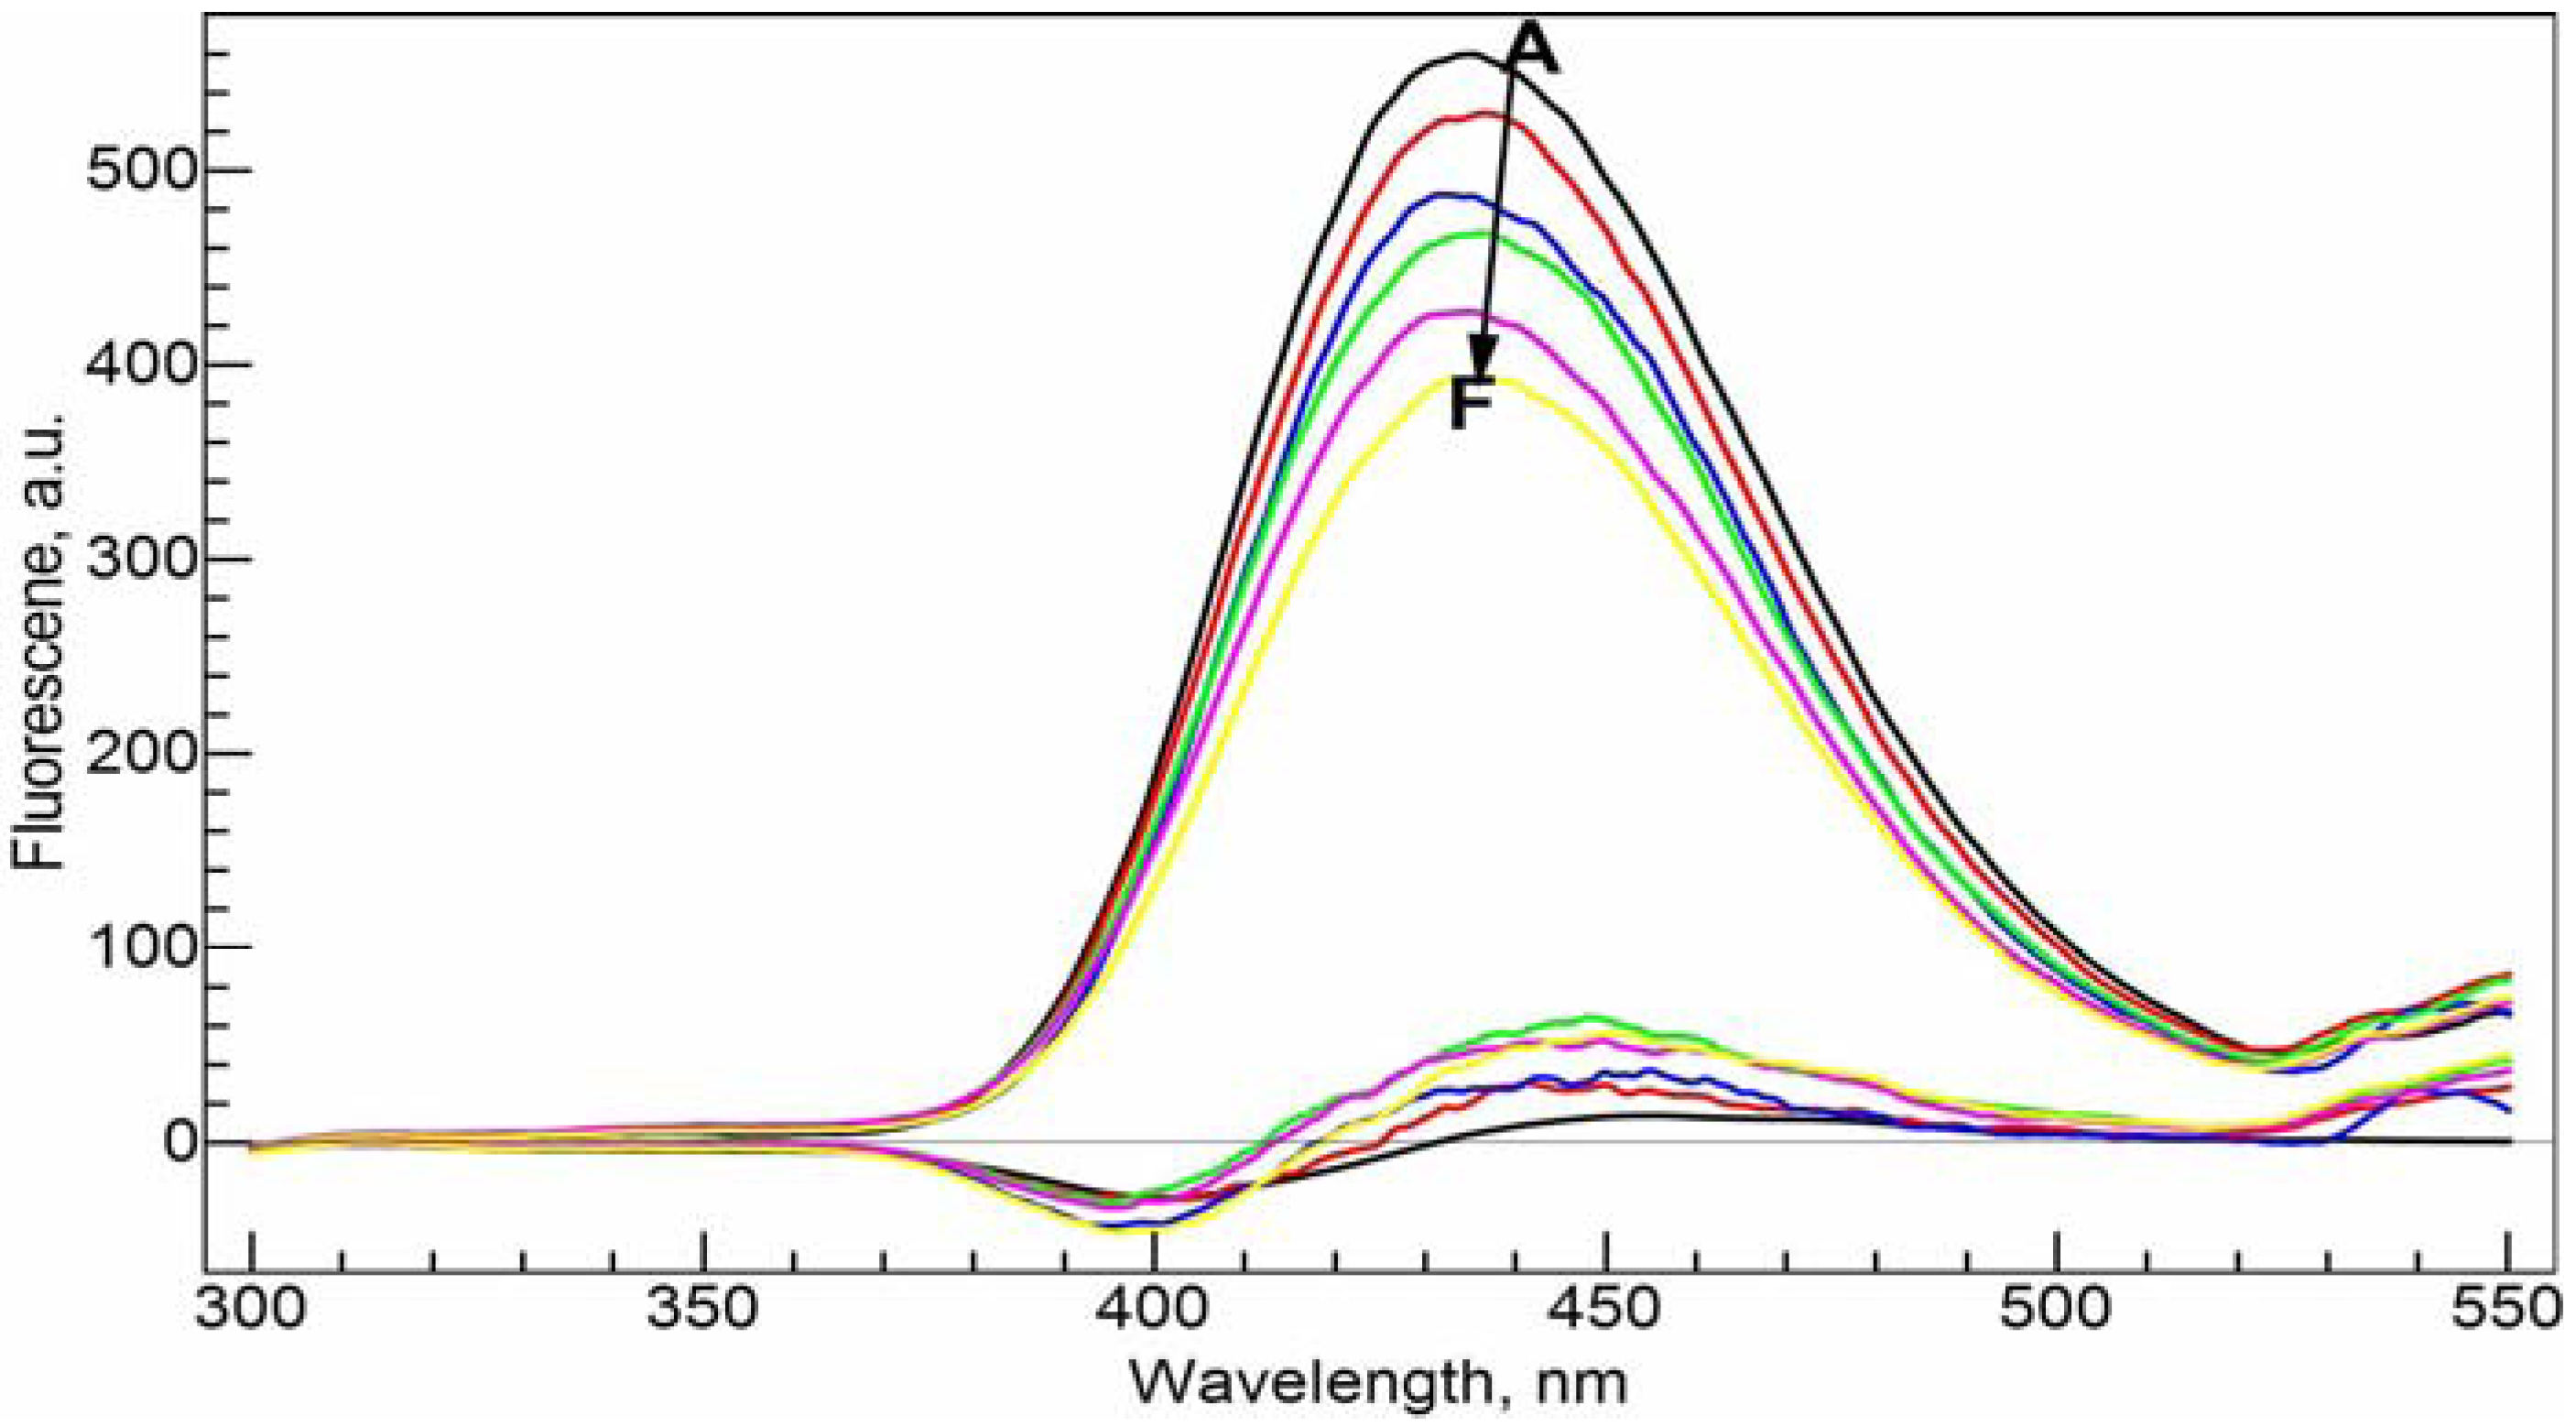
Figure 7, NADP was gradually added to the Al(III)-CIP system. The emission intensity decreases in a nearly linear fashion with the increase of NADP concentration. We also calculated the residual spectra as the difference between the real spectra and the synthetic spectra based on the speciation distribution calculated from the conditional stability constants obtained from the previous section. The residual spectra have a negative peak around 395.0 nm and a positive peak around 450.0 nm. Both are increasing with the concentration of NADP. This is consistent with the red shift effect caused by the interaction between NADP and CIP.
Figure 7.
Fluorescence emission spectra of the ternary Al(III)-CIP-NADP system at different molar ratios of metal to ligand. The bottom curves are the calculated residual spectra using the RAFA analysis. A–F: 34 µM cNADP, 20 µM cCIP, 10 mM Tris-HCl buffer solution (pH = 7.0); cAl(III), 0 (A), 5 (B), 10 (C), 15 (D), 20 (E) and 25 (F) µM. Excitation wavelength was 270 nm.
The emission spectra were also taken with the increasing Al(III) concentration while keeping the concentrations of NADP and CIP constant at 20 µM in Tris-HCl buffer solution at pH = 7.0 and the increasing concentration of CIP while keeping the concentrations of NADP and Al(III) constant at 20 µM in Tris-HCl buffer solution at pH = 7.0 (spectra not shown). The intensity of the emission band shows a nearly perfect correlation with the concentration of Al(III) or CIP. This is not surprising. Since the conditional stability constants of the two complexes are close, the species distribution of the free ligands and the complexes has an approximately linear dependence on the total concentration of Al(III) (see
Figure 8). Such a linear relationship may be used in quantitative determination of Al(III) and/or the ligands under physiological conditions.
Figure 8.
Speciation distribution of the system of 20 µM cCIP and 20 µM cNADPvs. cAl(III) concentration at pH =7.0 calculated with the conditional stability constants obtained in this work. CIP and NADP represent the free ligands and Al(III)-CIP and Al(III)-NADP represent the mononuclear complexes.
Figure 8.
Speciation distribution of the system of 20 µM cCIP and 20 µM cNADPvs. cAl(III) concentration at pH =7.0 calculated with the conditional stability constants obtained in this work. CIP and NADP represent the free ligands and Al(III)-CIP and Al(III)-NADP represent the mononuclear complexes.
2.3. Coordination Modes Identified with 1H and 31P-NMR Spectra
To identify the coordination modes between the ligands and Al(III),
1H-NMR spectra were measured for the D
2O solutions of the ligands, the binary complex systems and the ternary complex system at pD = 3.0 (see
Figure 9). This acidic pH value was chosen to avoid the possible hydrolysis of Al(III) under the neutral pH conditions at the much elevated concentration of 0.10 M. Based on the
1H-NMR evidence, Sakai
et al. concluded CIP along other fluoroquinolone antimicrobials form stable complexes with Al(III) at pD = 2.5 and the absorptivity of the drugs in oral administration could be affected by Al(III) [
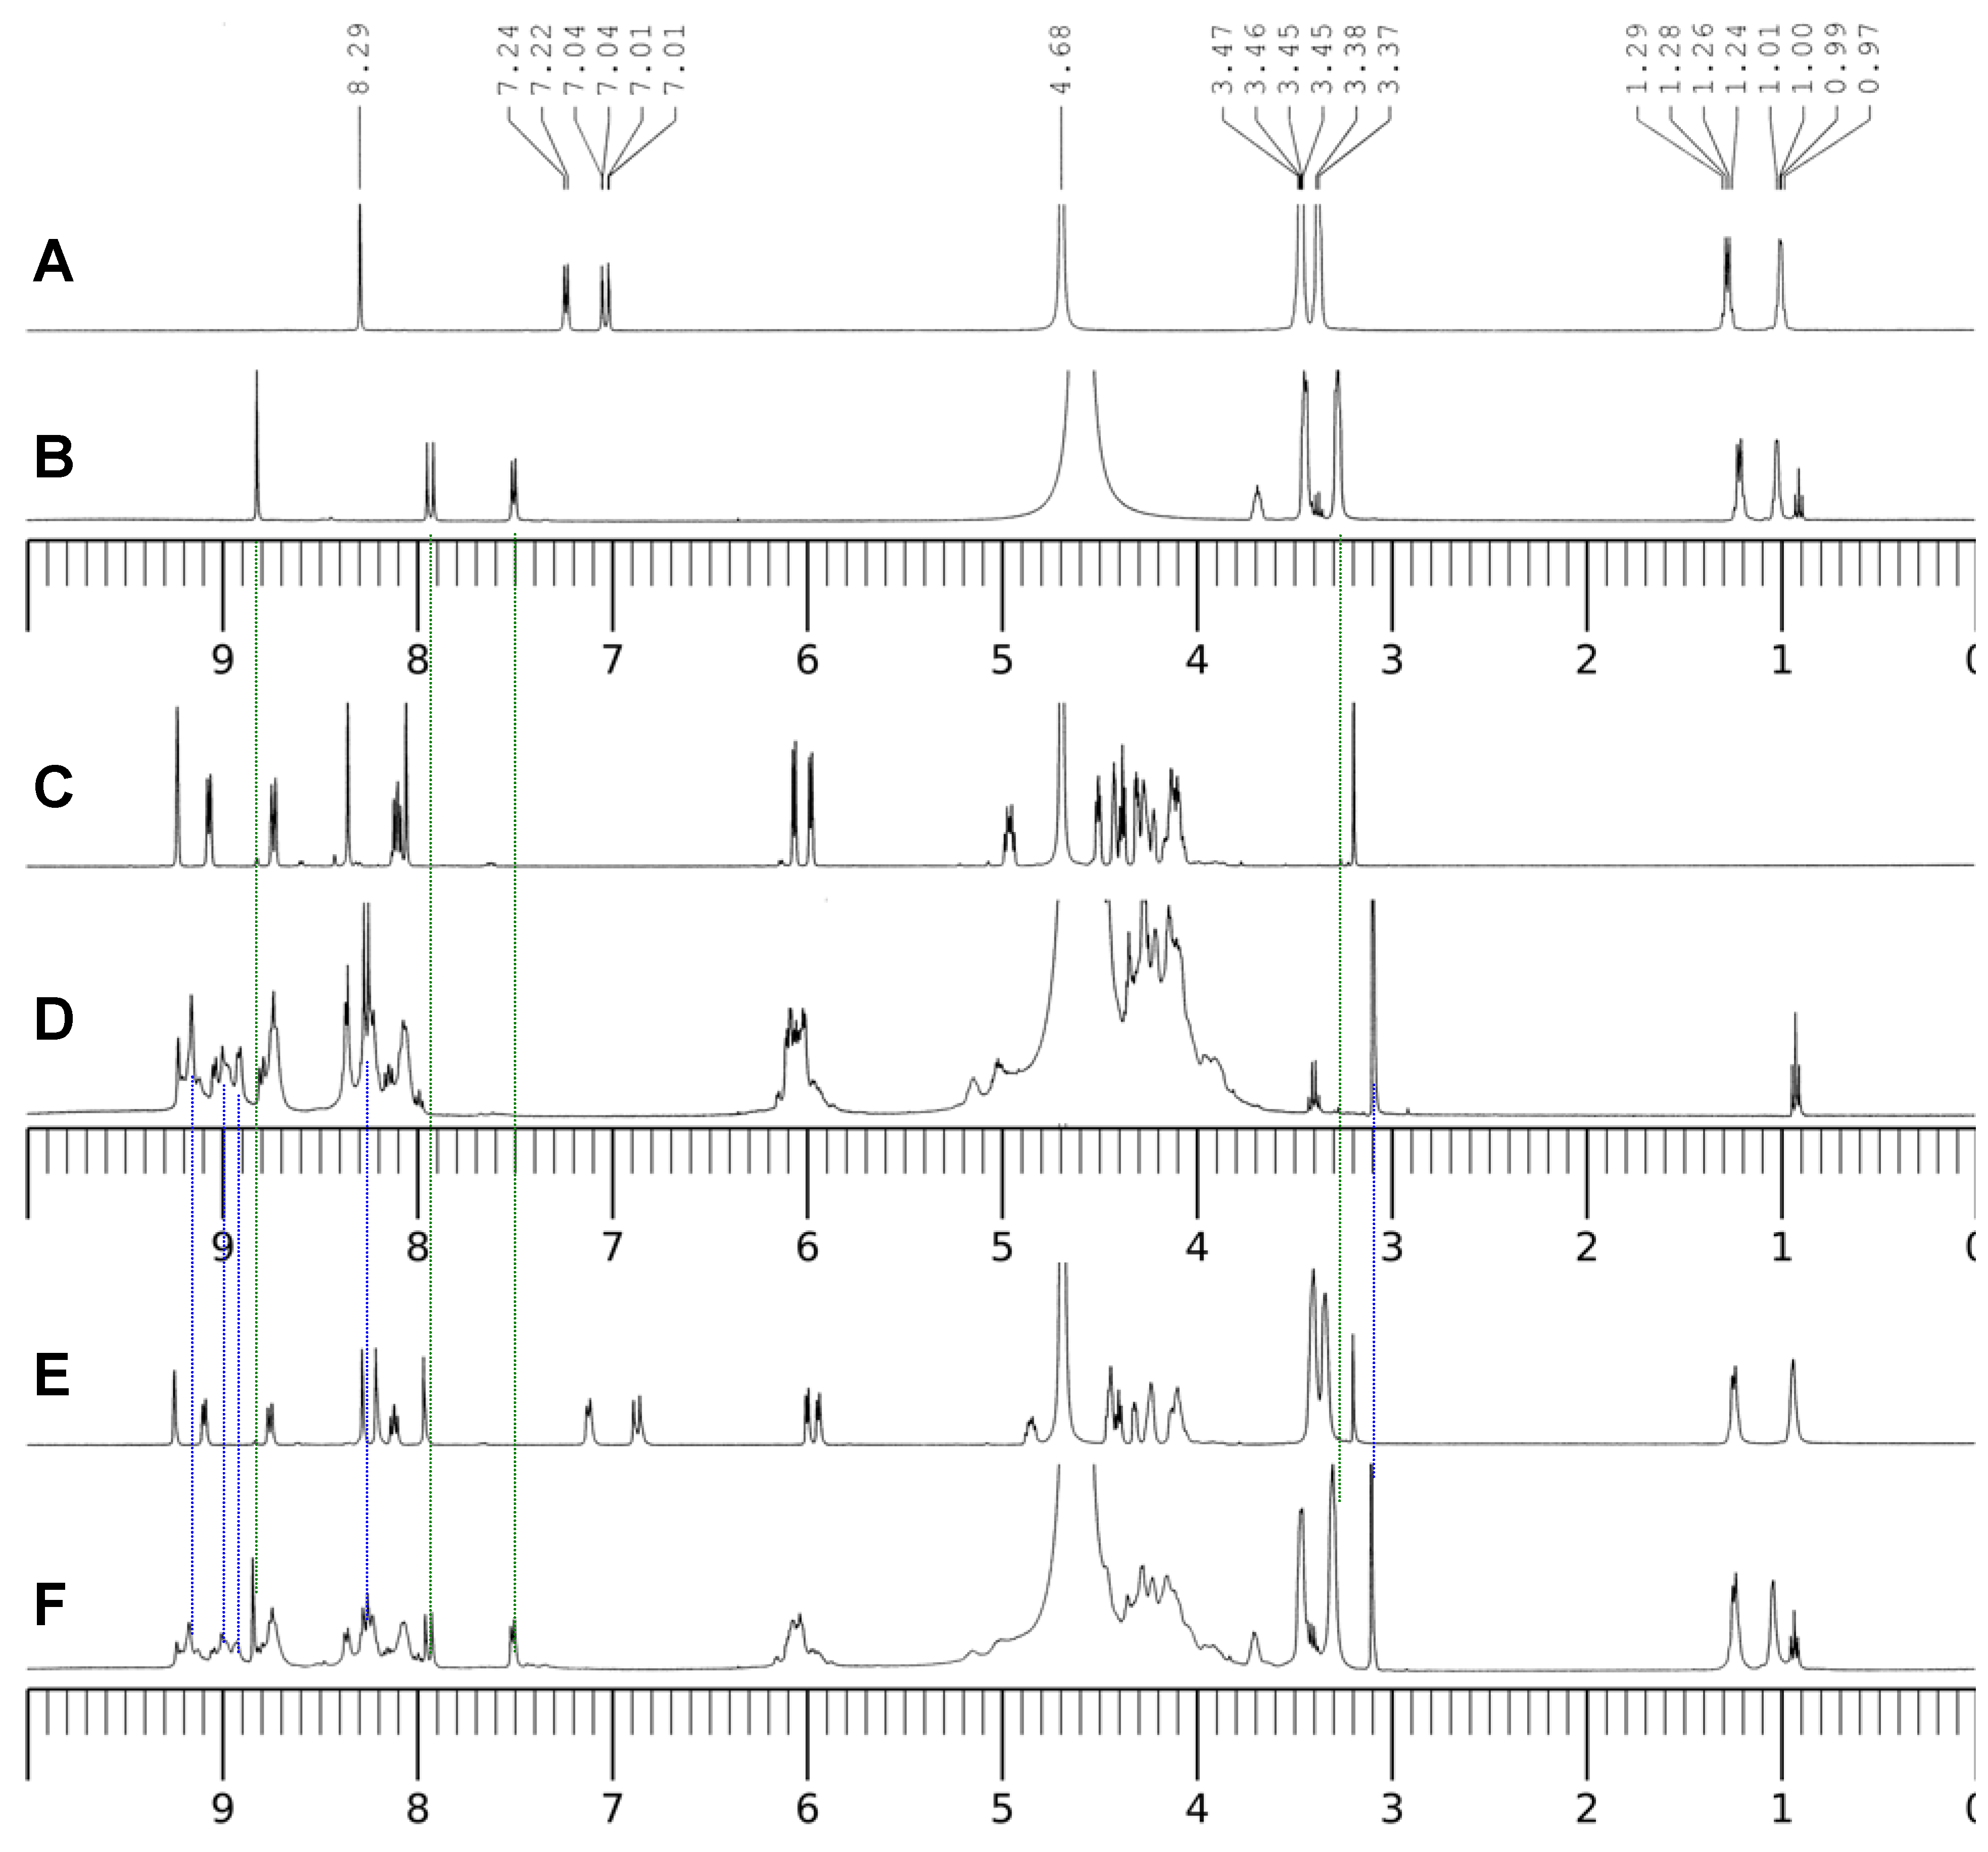
2]. Compared with CIP, the complex Al(CIP) shows a down-field shift for the three aromatic protons on the quinolone ring. The proton on C-2 shifts from 8.29 to 8.81 ppm, the doublet peaks of the protons on C-5 and C-8 shift from 7.02 and 7.23 ppm to 7.50 and 7.92 ppm, respectively. The hydrogens on the piperazine at 3.46 and 3.38 ppm in CIP shift to upfield by only 0.02 ppm. The download shifts are caused by the induction effect due to the strong coordination of Al(III) with the 4-keto group and the 3-carboxylate group by forming a 6-member ring. Since the signals from the ligand itself disappeared completely, the Al(III)-CIP complex was the main species in the solutions. Using the
1H-NMR titration experiments, Sakai
et al. estimated that the activation free energy for the dissociation of the Al(III)-CIP complex is
ca. 19 kcal/mol pD = 2.5 [
2]. This value is close to the Gibbs free energy for the dissociation reaction, 14 kcal/mol, calculated from the conditional stability constant in the UV-visible spectra experiments at pH = 7.0. Sakai also proposed that besides the main M/L = 1:1 species Al(CIP), there also exist the 1:2 and 1:3 species, Al(CIP)
2 and Al(CIP)
3 at the very high concentration of Al(III) and CIP [
2]. We could not exclude the possibility for the presence of Al(CIP)
2 and Al(CIP)
3 in the
1H-NMR experiments, but their percentage at the very low concentration (μM) level under physiological conditions should be very low.
Figure 9.
1H-NMR spectra of the ligands and the complexes. A–F: pD = 3.0; A, 10 mM cCIP only; B, 10 mM cCIP and 10 mM cAl(III); C, 10 mM cNADP only; D, 10 mM cNADP and 10 mM cAl(III); E, 10 mM cCIP and 10 mM cNADP; F, 10 mM cCIP, 10 mM cNADP and 10 mM cAl(III).
Figure 9.
1H-NMR spectra of the ligands and the complexes. A–F: pD = 3.0; A, 10 mM cCIP only; B, 10 mM cCIP and 10 mM cAl(III); C, 10 mM cNADP only; D, 10 mM cNADP and 10 mM cAl(III); E, 10 mM cCIP and 10 mM cNADP; F, 10 mM cCIP, 10 mM cNADP and 10 mM cAl(III).
Figure 9C,D and 10 show the
1H-NMR and
31P-NMR spectra of NADP and the Al(III)-NADP complex system at pD = 3.0. In the free ligand of NADP, the proton signals on both the nicotinamide and adenine ring appear in the region between 8.0 and 9.3 ppm and overlap with each other. Upon the addition of one molar equivalent of Al(III), the proton resonance signals become quite complicated due to three kinds of changes: (1) the broadening effect because of the scalar coupling of the quadrupolar aluminum ion; (2) the upfield shifts, which was thought due to the alterations in geometry and dielectric constant of the solvent environment; (3) the separation of the nicotinamide and adenine proton signals upon the coordination of Al(III) with the nonbridging phosphate group. Besides the upfield shifts of the aromatic hydrogens, the proton signals at 6.0 ppm, which were assigned to the hydrogens on the carbon atoms directly connected with the phosphate groups on the two ribose rings, become separated because the nonbridging phosphate binds with Al(III) and causes the downfield shift of one hydrogen. In addition, ribose hydrogen at 3.18 ppm in the free ligand shifts slightly to 3.10 ppm in the complex.
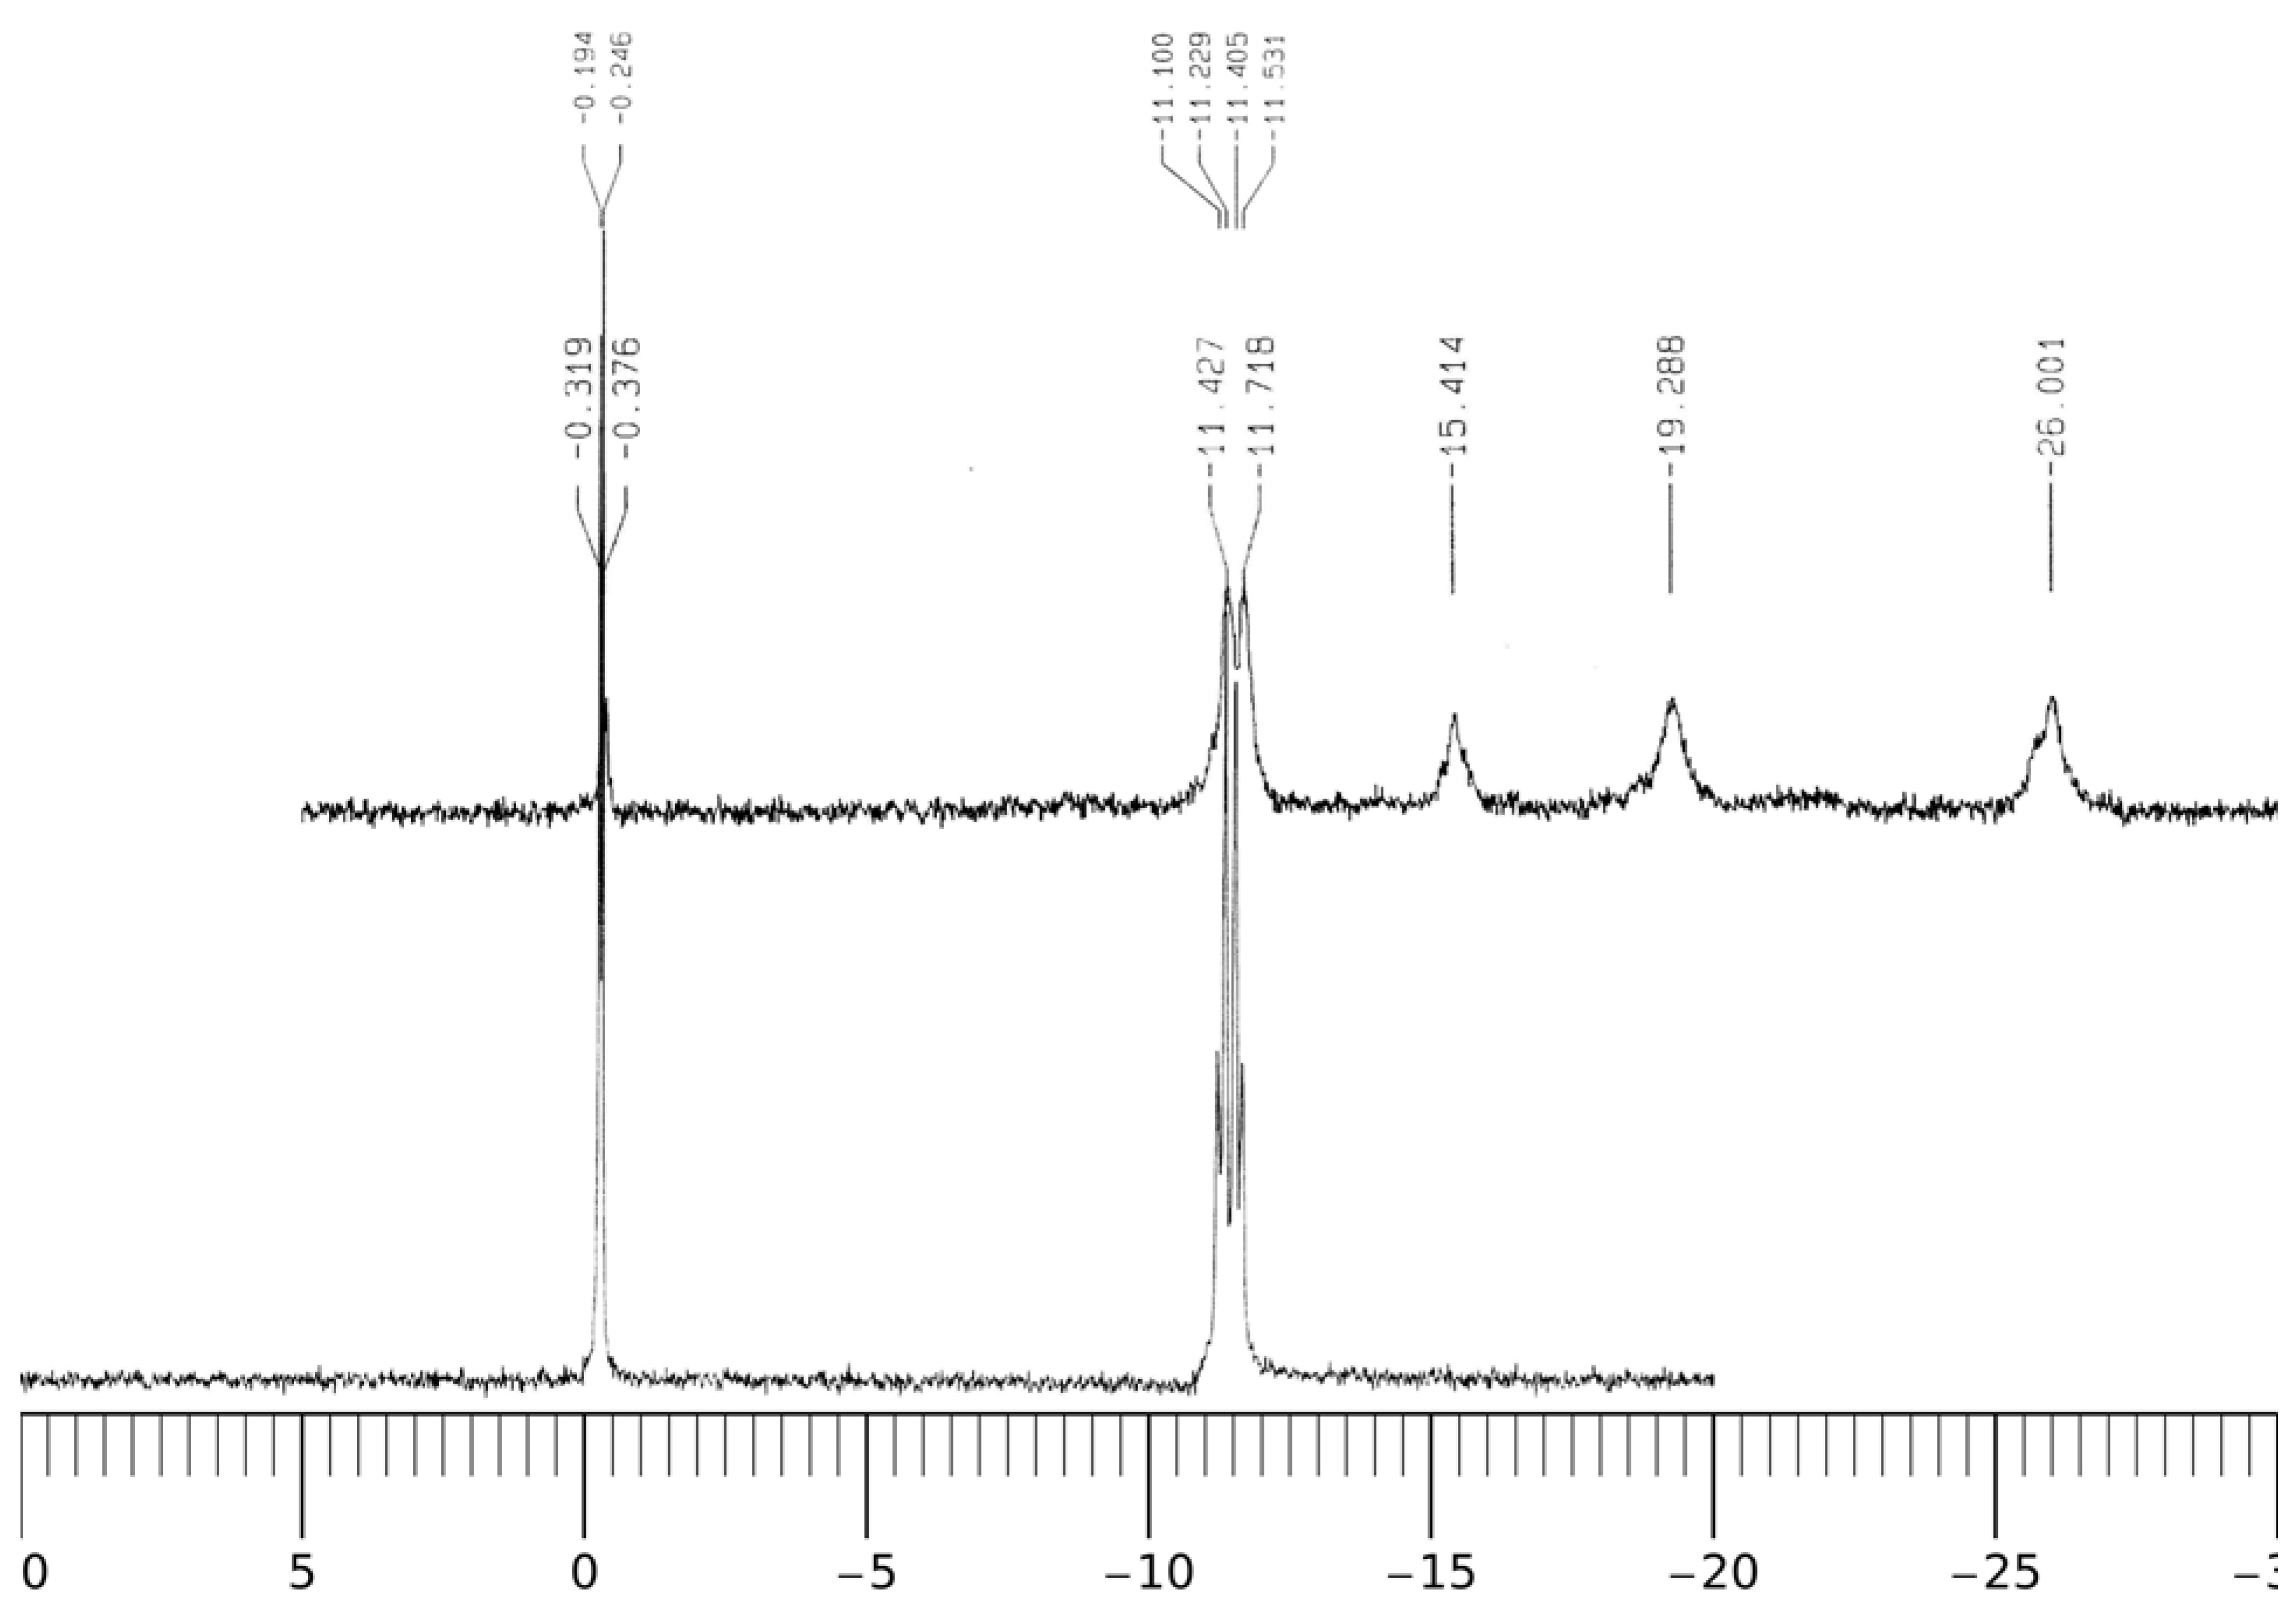
Figure 10.
31P-NMR spectra of NADP and Al(III)-NADP. A–B: pD = 3.0; A, 10 mM cNADP only; B, 10 mM cNADP and 10 mM cAl(III).
Figure 10.
31P-NMR spectra of NADP and Al(III)-NADP. A–B: pD = 3.0; A, 10 mM cNADP only; B, 10 mM cNADP and 10 mM cAl(III).
In the
31P-NMR spectra in
Figure 10, the phosphorus resonance signal appears at 11.3 ppm in NADP. In the binary Al(III)-NADP complex system, three new signals appear in the upper field at −15.4, −19.3 and −26.0 ppm. The phenomenon is similar to the findings by Karlik
et al. [
27]. The complexation of Al(III) with glucose-6-phosphate also causes a similar upfield shift pattern at −12.9, −16.8 and 19.0 ppm [
22]. This result indicates there are least three complexation configurations.
Figure 9 also shows the
1H-NMR spectra of the binary system CIP and NADP (E) and the ternary system Al(III)-CIP-NADP (F). In the binary system, the hydrogens on the adenine –NH
2 group shift upfield from 8.09 ppm to 7.96 ppm. This may be due to the hydrogen bonding between the –NH
2 group and the –COOH group on CIP. Such interaction also causes the red shift of the UV-visible and fluorescence spectra. The spectrum of the ternary system shows the characteristic peaks of both the Al(III)-CIP complex and the Al(III)-NADP complex and may be seen as a Al(III)-CIP-NADP complex.
2.4. Electrospray Ionization Mass Spectrometric Studies and Computational Modeling
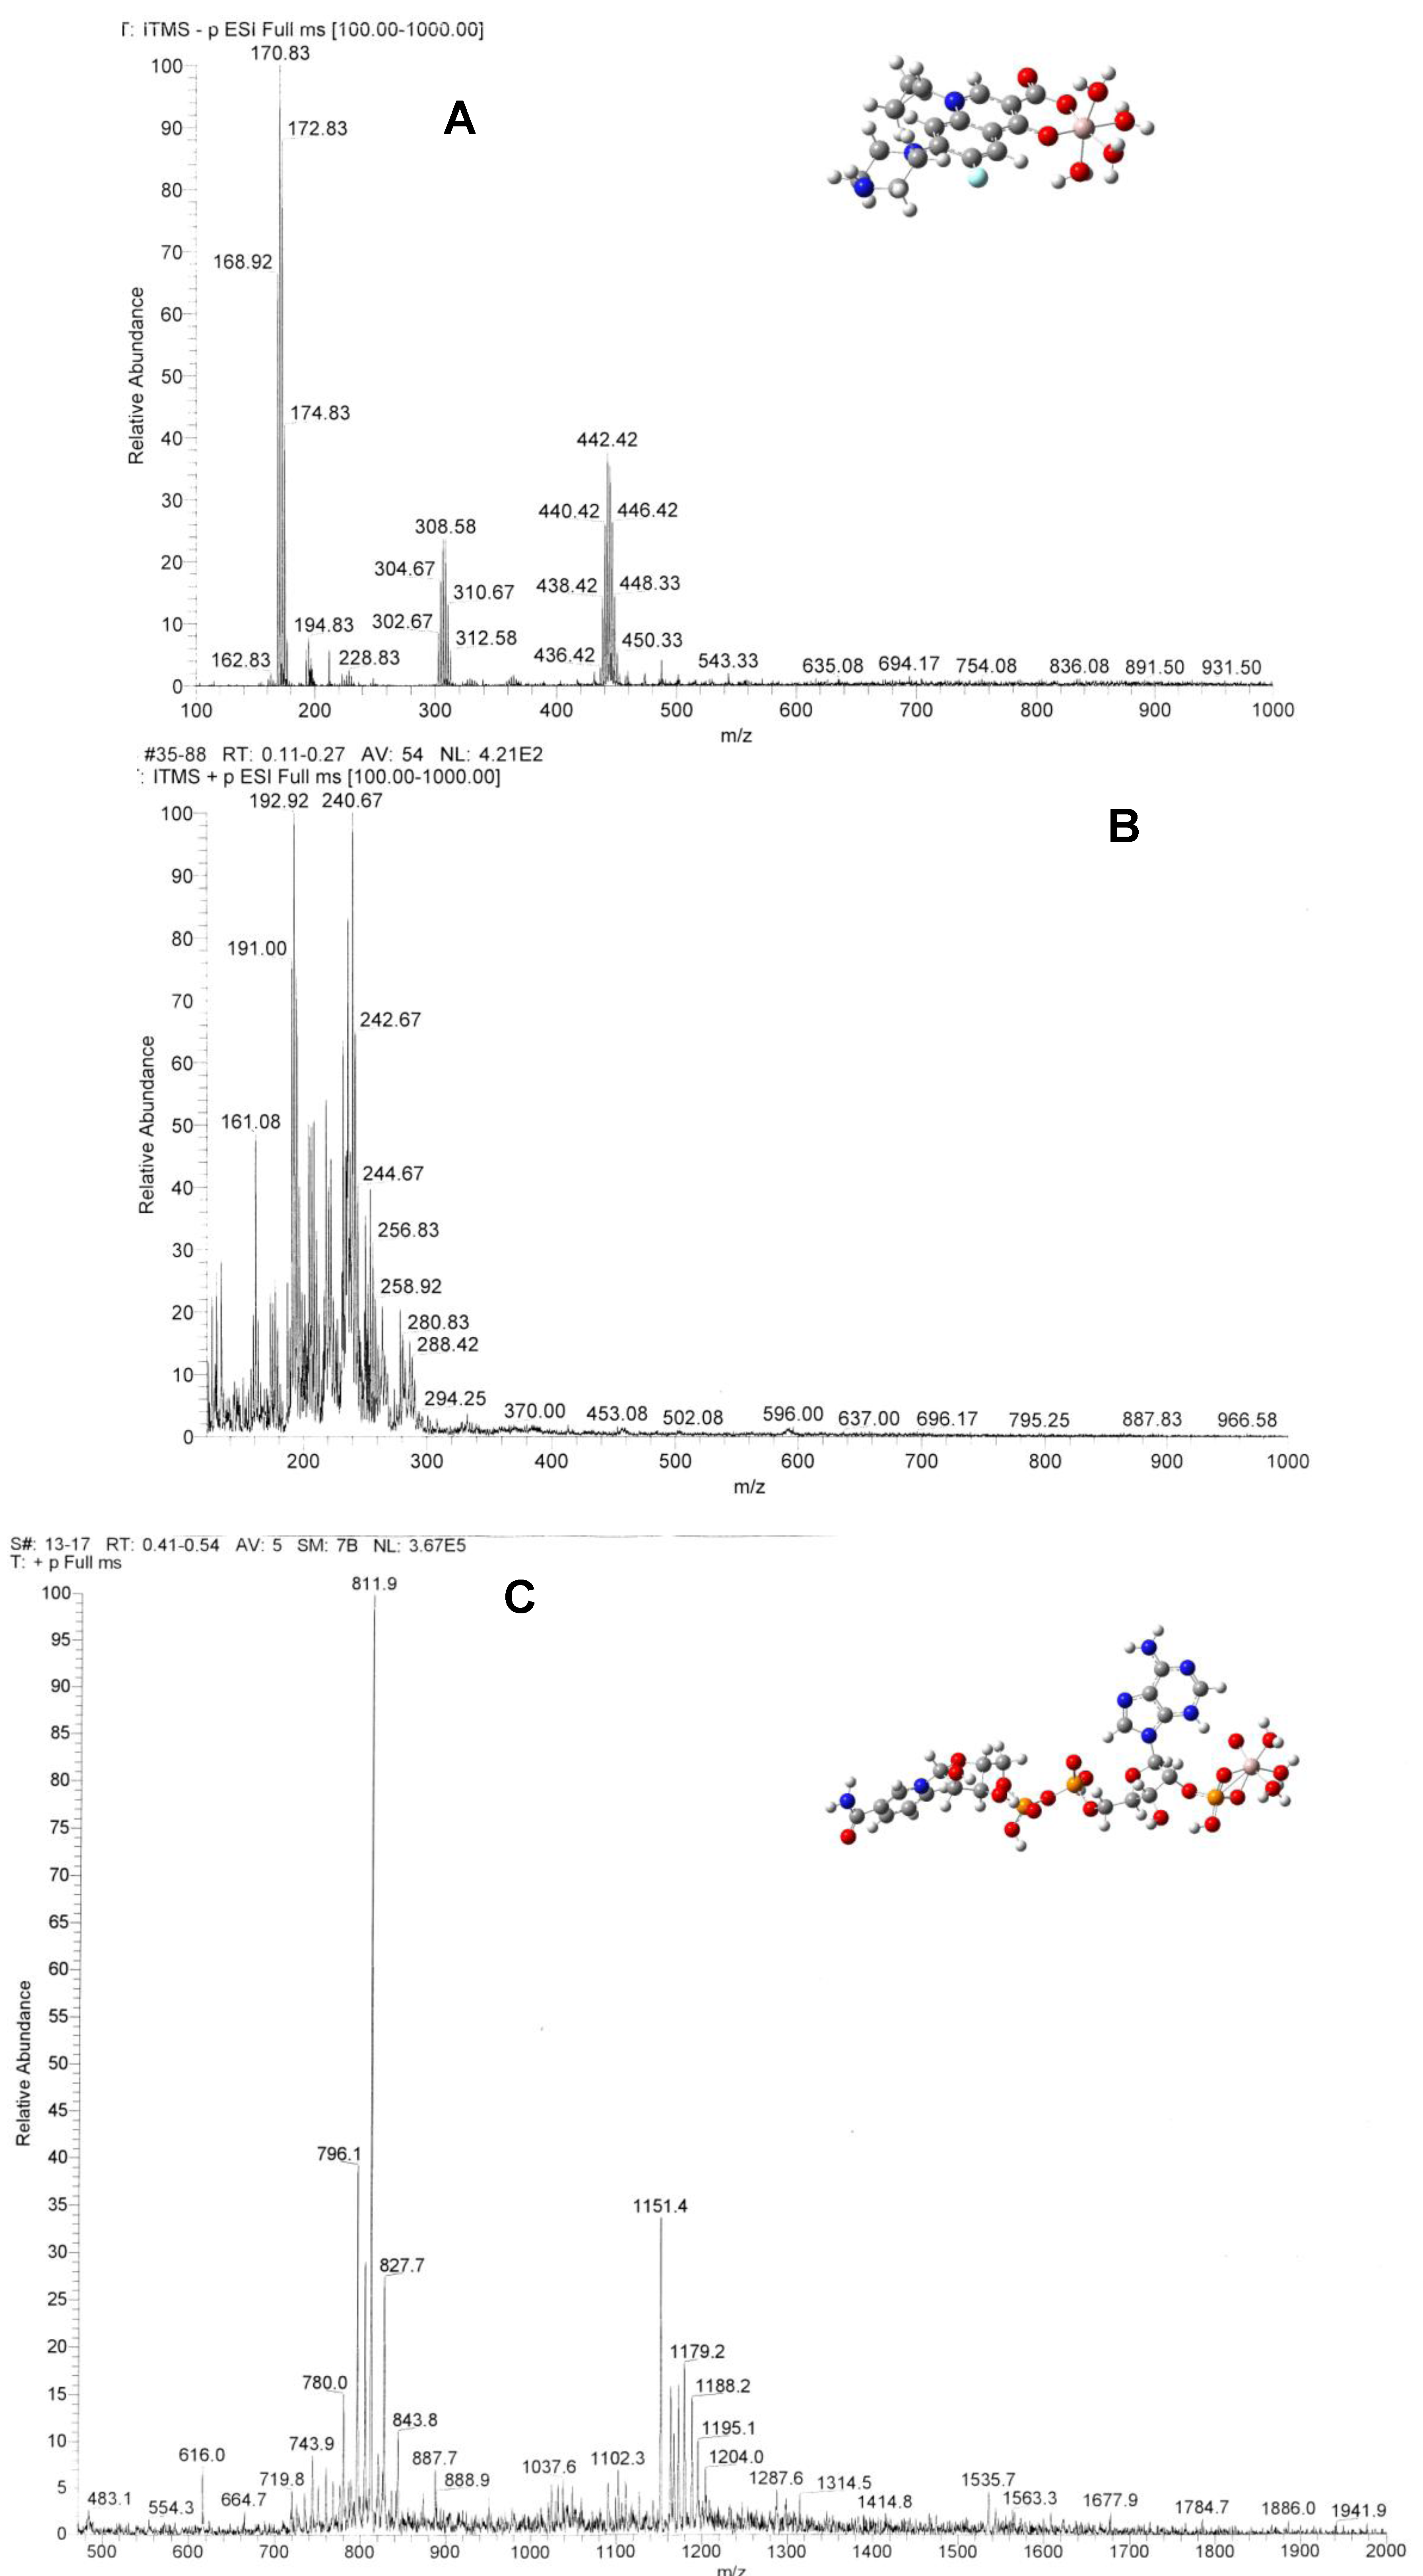
Electrospray ionization mass spectrometry (ESI-MS) was used to characterize the species in the complex systems. 11A, B shows the spectra of the Al(III)-CIP complex solution in Tris-HCl buffer solution at pH = 7.0, measured in the negative and positive ion modes, respectively. In spectrum A, the complex [Al(CIP)(H2O)5]− species appears near m/z = 448. A series of de-hydrogenated molecule products appear at m/z = 446, 444, 442, 440 and 438. In spectrum B, the m/z = 161 peak can be assigned to the decomposed complex species, [Al(COO)(H2O)5]+.
Figure 11.
(Color online) Electrospray ionization mass spectra of Al(III)-CIP in negative ion mode (A) in positive ion mode (B) and of Al(III)-NADP (C). The insets of panels A and C showed the optimized structure of the complexes at the B3LYP/6-31G(d)//B3LYP/6-31G(d) level. Color codes: C, dark gray; H, light gray; O, red; N, blue; P, orange; Al, purple.
Figure 11C shows the spectrum of the Al(III)-NADP complex system measured in the positive ion mode in Tris-HCl buffer solution at pH =7.0. The major peak at
m/z = 812 is due to the ligand adduct with three Na ions, [Na
3NADP]
+. The molecular peak of NADP
+ appears at
m/z = 744. The
m/z = 616 peak is due to a loss of the nicotinamide group from the ligand. The
m/z = 804 peak can be assigned to the complex species, [Al(H
2O)
5(NaNADP)]
+. There is no peak representing the M/L = 1:2 complexes.
The insets of
Figure 11A,C show the optimized geometry structure of the complexes in vacuum with the B3LYP/6-31G(d) level of theory. It is found that Al(III) can strongly bind with the keto and carboxylate groups of CIP forming a six-member ring. The electronic structure of the quinolone ring is slightly disturbed, which causes the spectroscopic changes between the ligand and the complexes. Al(III) binds with NADP through the complexation with the nonbridging phosphate group in a bidentate configuration. Although aluminium ion is not directly connected to the adenine ring, it is found that the complexation causes the adenine ring to turn about 90 deg around the C-N bond. Such conformational change would change the superconjugation effect between the aromatic adenine and the ribose ring and explain the spectroscopic changes of Al(III)-NADP complex compared with the ligand itself.
2.5. Speciation on the Ternary Al(III)-CIP- NADP Systems
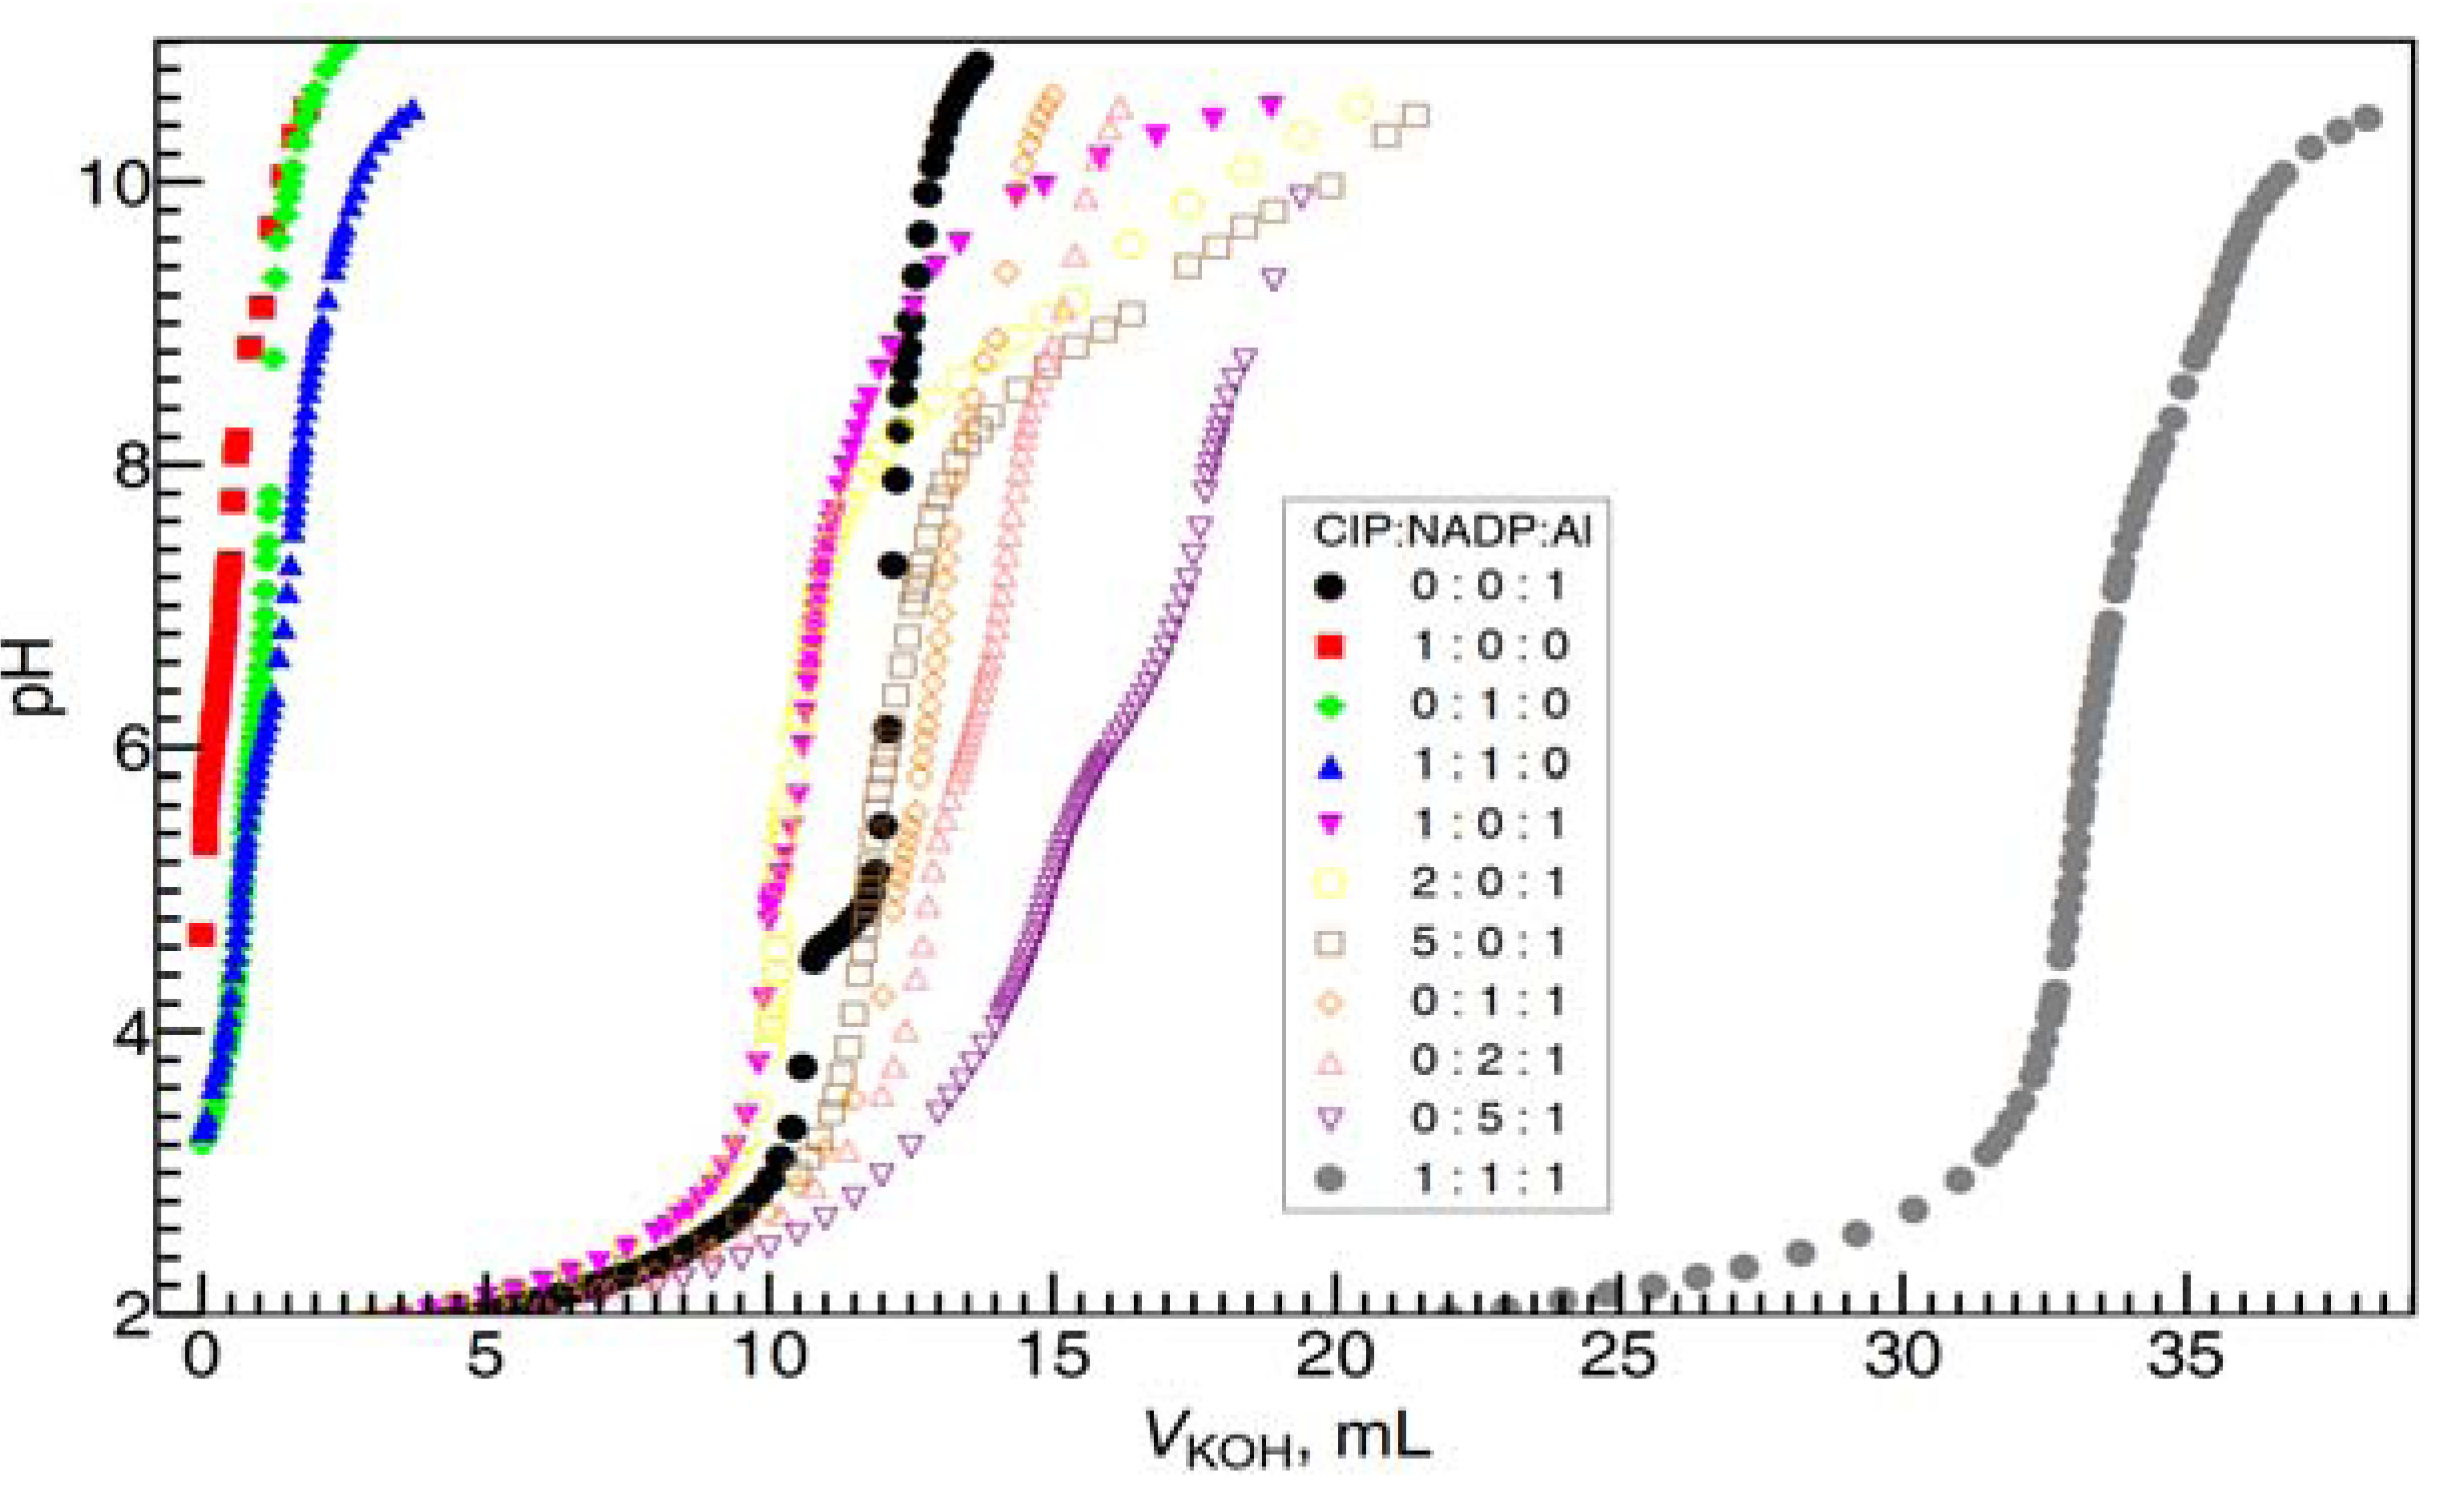
In order to investigate the possibility formation of mixed-ligand complexes, especially, the Al(III)-CIP-NADP ternary systems, and the complexation species formation constants, pH-potentiometric titrations and computational modeling of the mixed-ligand complexes were performed in aqueous solution. In
Figure 12, the pH-potentiometric titration of different various metal ion to ligand ratios of Al, CIP and NADP were well carried out from pH = 2 to pH = 11. Our macroscopic constants (
Table 1) are in accordance with those obtained by other authors [
24]. These values are in agreement with those reported in the literature for the same molecular. The small difference of this work and literature [
25] may due to the corresponding thermodynamic data obtained at different ionic strength. The results of potentiometric data of the complexation equilibriums between NADP, CIP and Al are shown in
Table 1.
Figure 12.
Titration data points measured in the Al(III)-NADP-CIP complex systems (C
Al = 0.001 M, C
KOH = 0. 1026 M) at various metal ion to ligand ratios in 0.20 M KCl medium at 25 °C The fitted formation constants of the complexes are given in
Table 1.
Figure 12.
Titration data points measured in the Al(III)-NADP-CIP complex systems (C
Al = 0.001 M, C
KOH = 0. 1026 M) at various metal ion to ligand ratios in 0.20 M KCl medium at 25 °C The fitted formation constants of the complexes are given in
Table 1.
Table 1.
Proton and Al(III) stability constants for CIP and NADP binary and ternary complexes at 25 °C and I = 0.20 M (KCl) a.
Table 1.
Proton and Al(III) stability constants for CIP and NADP binary and ternary complexes at 25 °C and I = 0.20 M (KCl) a.
| Complex species | CIP | NADP | CIP and NADP |
|---|
| This work | Reference [24] | This work | Reference [25] | This work |
|---|
| Protonation | | | | | |
| HL | 8.60(0.03) | 8.54 | 9.93(0.03) | 11.50 | |
| H2L | 14.76(0.03) | 14.61 | 16.09(0.04) | 16.44 | |
| H3L | | | 19.90(0.06) | 20.19 | |
| H4L | | | | 21.39 | |
| Binary complexes | | | | | |
| AlL | 9.36(0.03) | | 10.71(0.02) | | |
| Al(HL) | 15.85(0.08) | | 16.01(0.01) | | |
| Al(H2L) | | | 19.16(0.04) | | |
| AlL(HL) | 21.38(0.03) | | | | |
| Al(H2L)2 | | | 37.84(0.06) | | |
| AlL2(HL) | | | 29.82(0.02) | | |
| Al(H2L)3 | | | 57.53(0.04) | | |
| Ternary complexes | | | | | |
| Al(CIP)(HNADP) | | | | | 26.56(0.02) |
| Al(HCIP)(HNADP) | | | | | 32.49(0.02) |
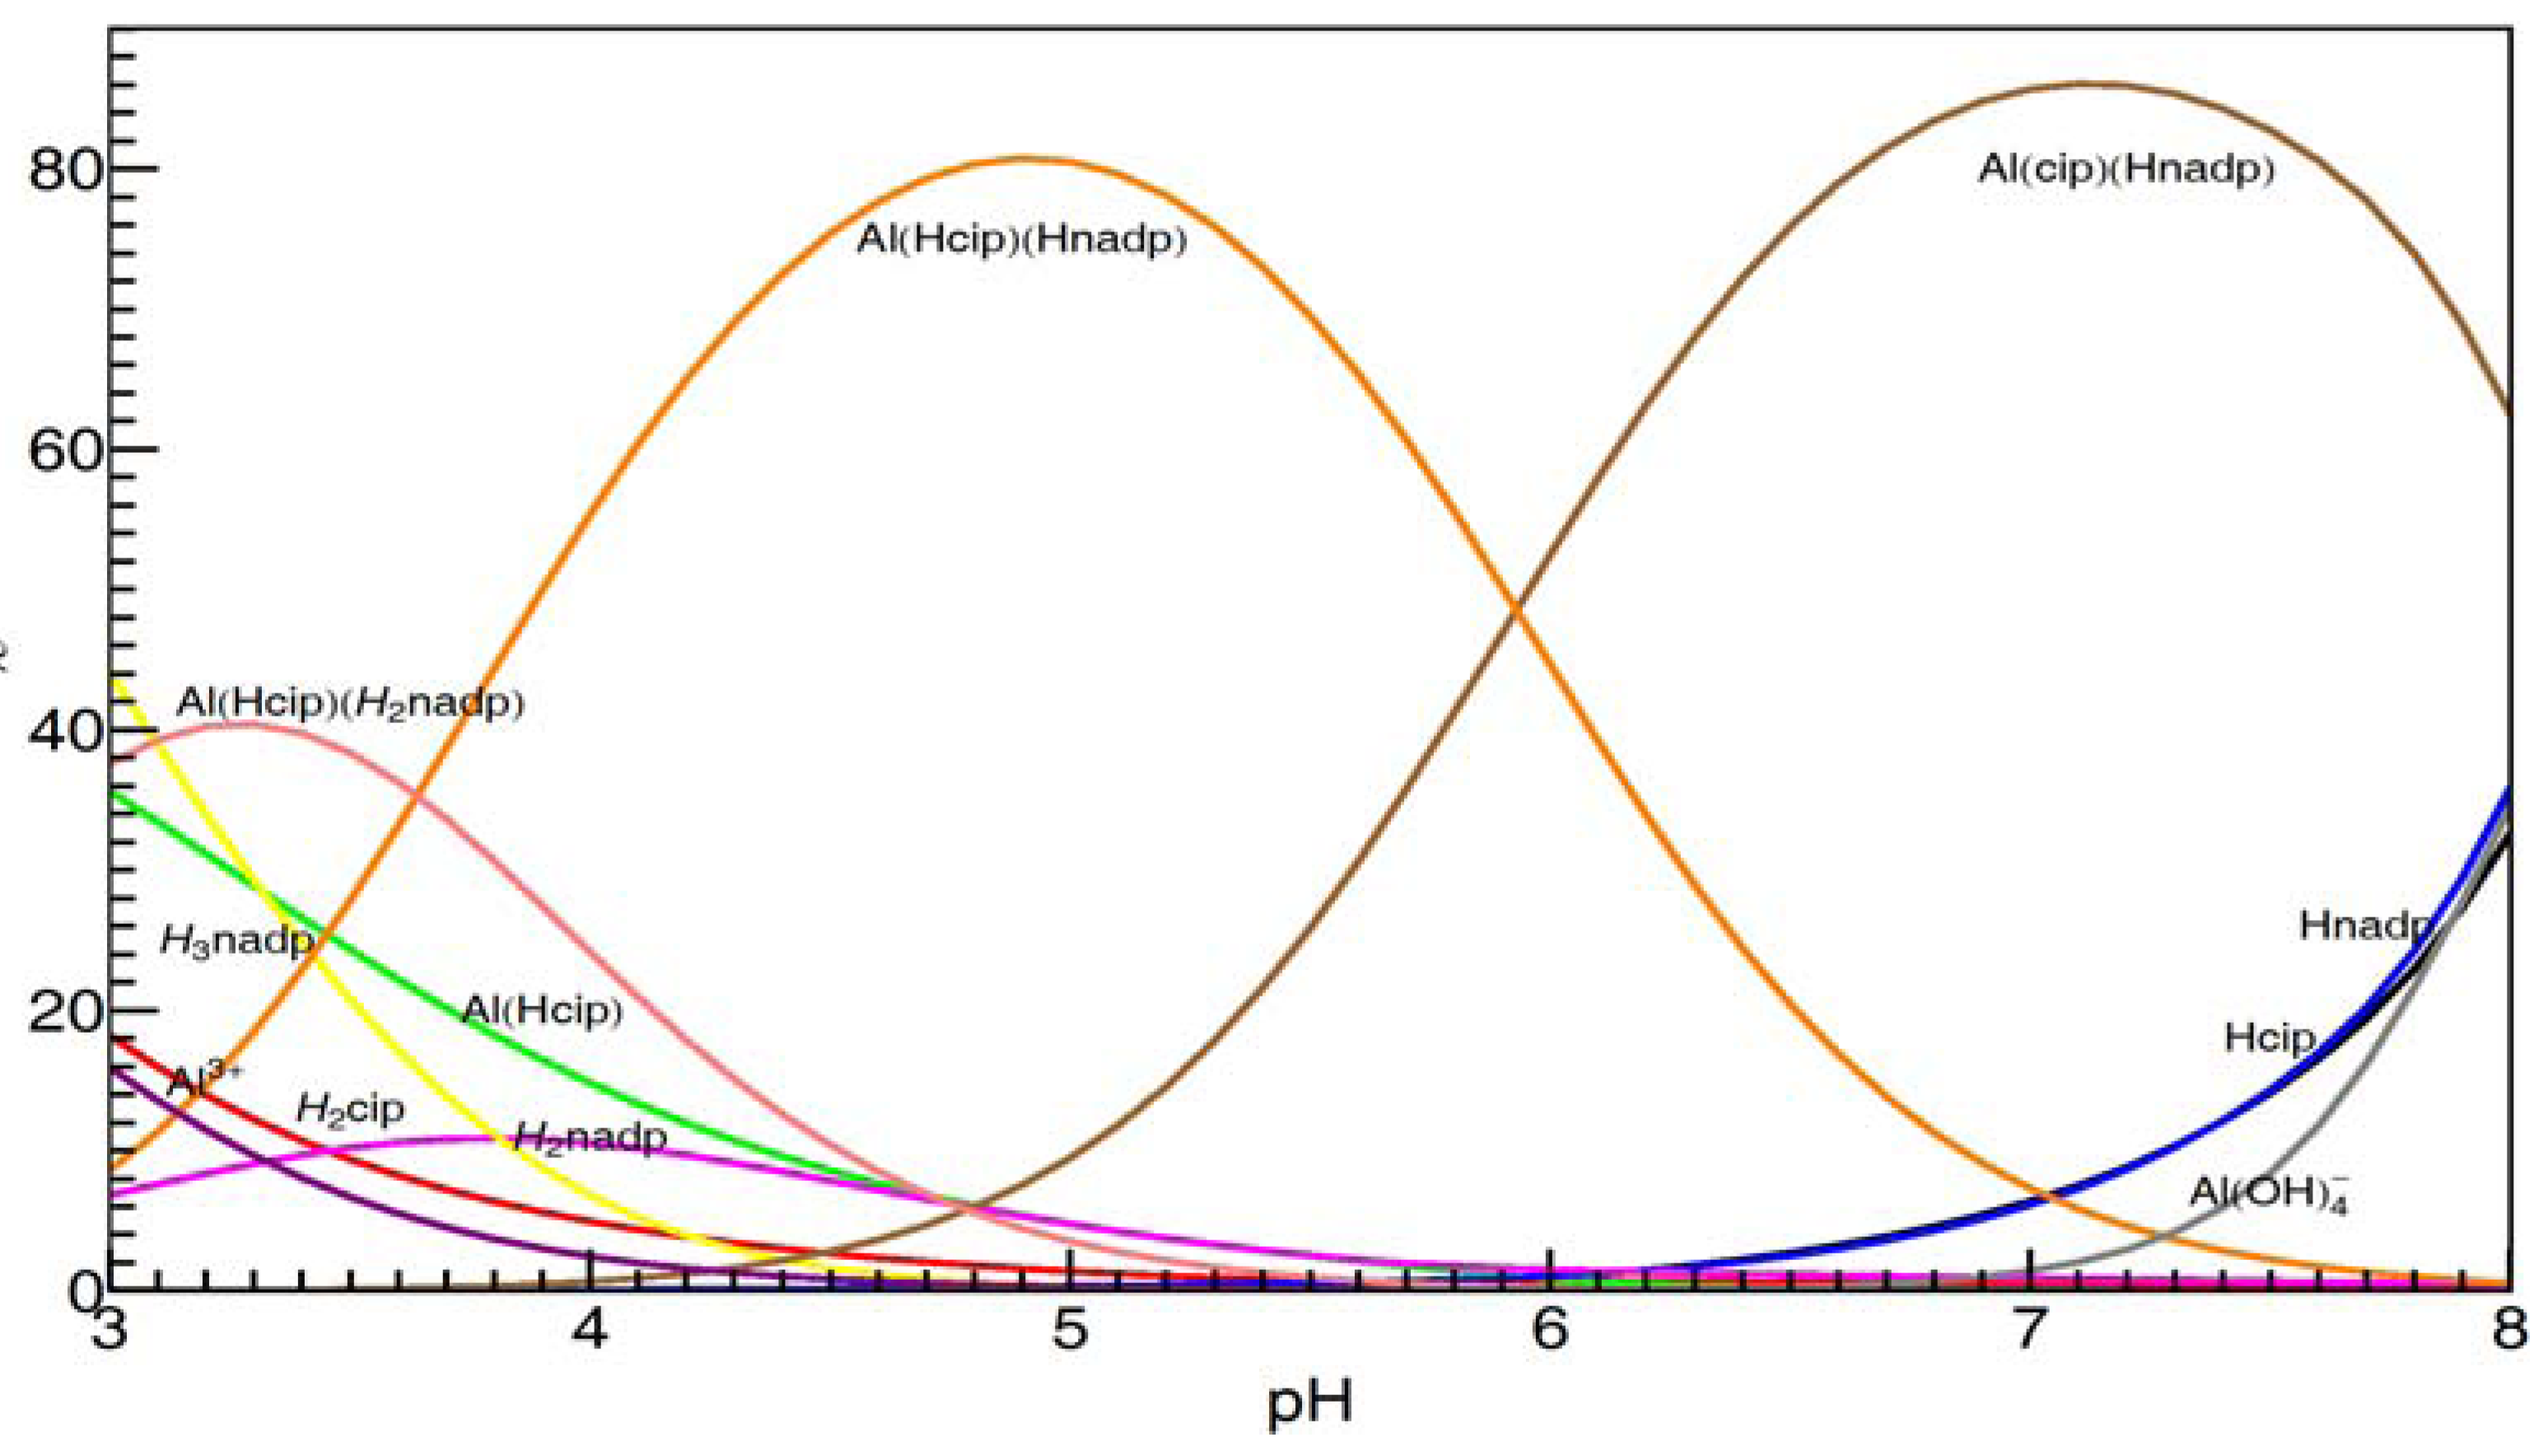
Also,
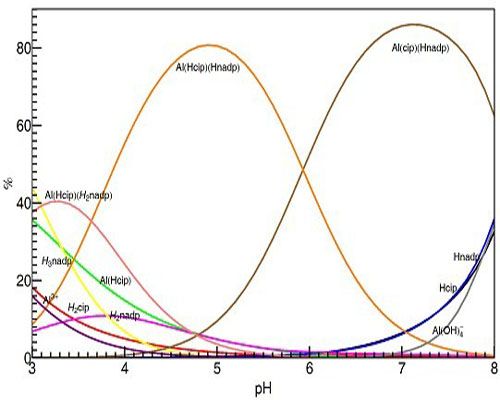
Figure 13 shows the calculated distribution diagram of Al with CIP and NADP solutions, from pH 3.0 to pH 8.0, 25 °C 0.2 M KCl, at the concentration of Al is 10 mM in the case of Al: NADP:CIP = 1:1:1 system.
Figure 13.
Species distribution curves for the complexes formed in the Al(III)-NADP-CIP complex system, at 25 °C, 0.2 M KCl and the concentration of Al is 10 mM in the case of Al: NADP:CIP = 1:1:1 system.
Figure 13.
Species distribution curves for the complexes formed in the Al(III)-NADP-CIP complex system, at 25 °C, 0.2 M KCl and the concentration of Al is 10 mM in the case of Al: NADP:CIP = 1:1:1 system.
Different with former spectral studies, our pH-potentiometric studies show, in the Al(III)-CIP-NADP ternary systems, at mM concentration level, the 1:1:1 ternary complexes are the predominant species in acidic aqueous solution. At pH 3.0, the 1:1:1 complex [Al(HCIP)(H2NADP)] is the predominant species, while, at pH 5.0, the other 1:1:1 complex [Al(HCIP)(HNADP)] becomes the major species. Finally, at around neutral pH, the 1:1:1 complex [Al(CIP)(HNADP)], in which the CIP is deprotonated, became the major species under physiological pH. These results are proved by the 1H-NMR spectra above.


