2. Results and Discussion
Three new multiflorane-type triterpenes
1–
3 and three known multiflorane-type triterpenes
4–
6 were isolated from the MeOH extract of
C. maxima seeds (
Figure 1).
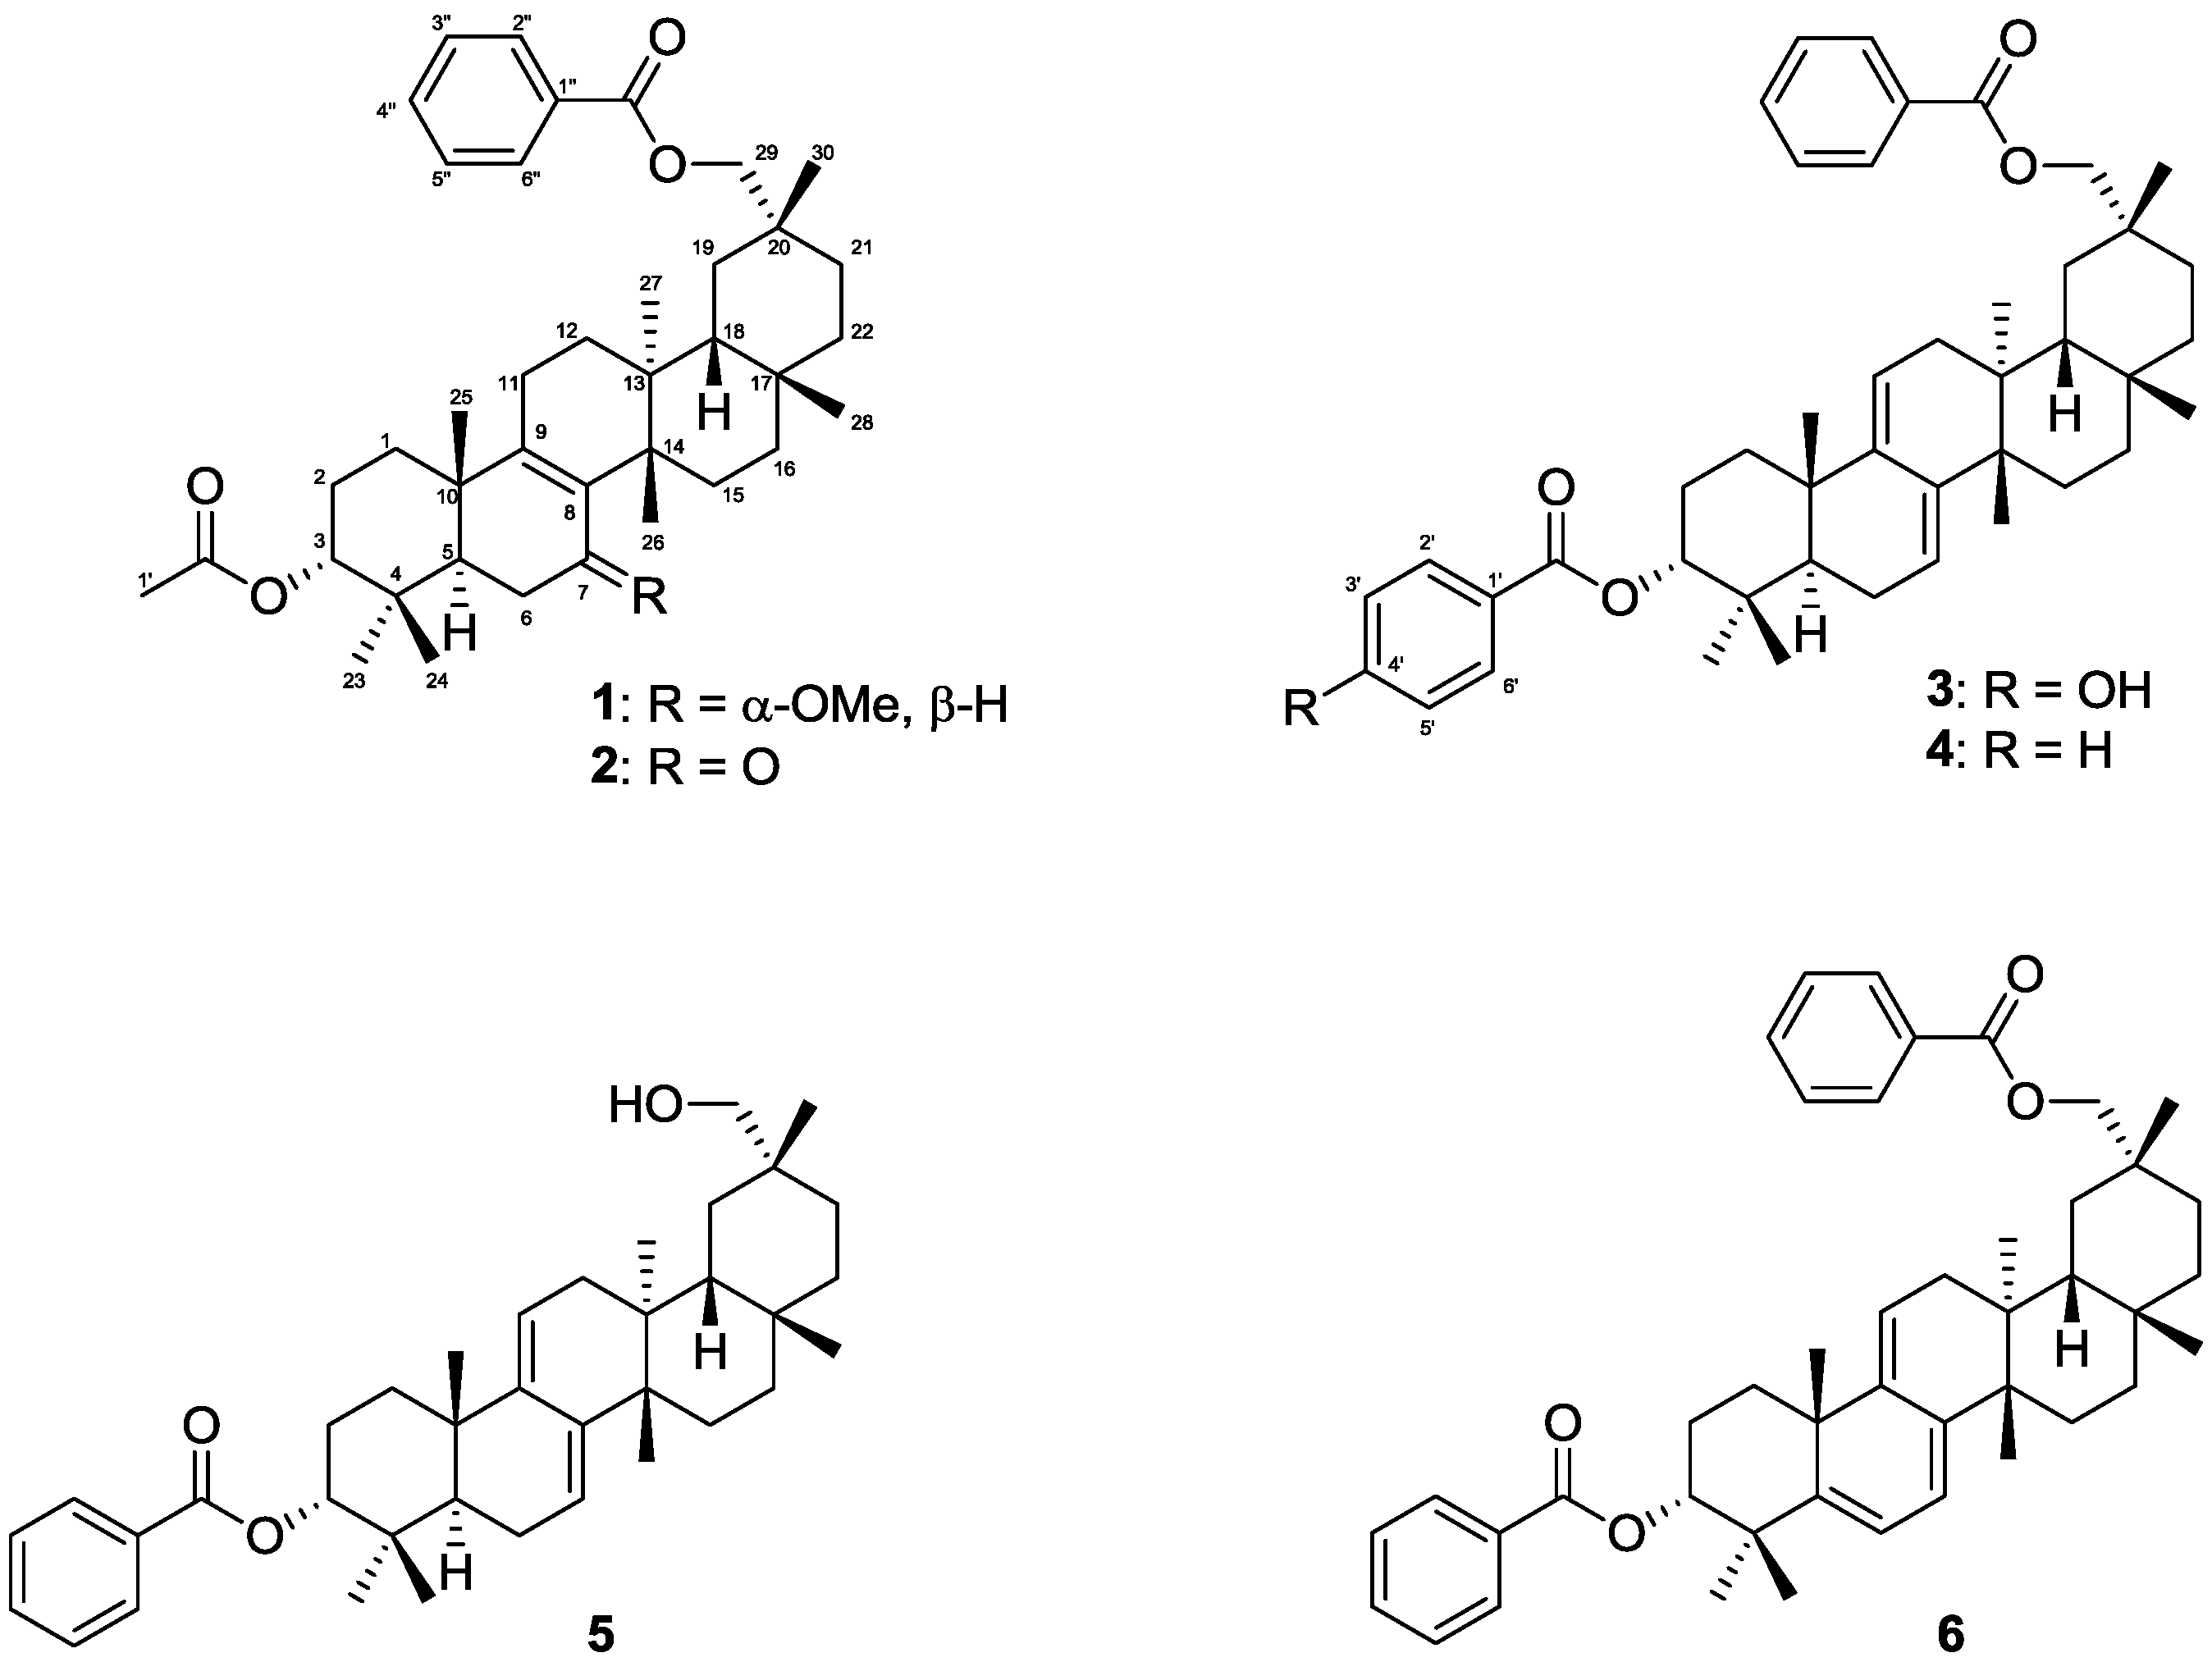
Figure 1.
Chemical structures of isolated compounds 1–6.
Figure 1.
Chemical structures of isolated compounds 1–6.
The compound
1 was obtained as an amorphous solid with a molecular ion at
m/z 618.4282 [M]
+ (calcd. for C
40H
58O
5, 618.4285) in the HREIMS. The IR spectrum showed absorptions indicating two carbonyl groups [ν
max 1743 (C=O), 1724 (C=O), 1267 (C–O), 1247 (C–O) cm
−1]. The
1H- and
13C-NMR spectra (δ
H and δ
C in ppm,
Table 1) displayed signals for seven tertiary methyl groups [δ
H 0.88, 0.93, 0.94, 1.04, 1.06, 1.08, 1.13 (each s)], an oxymethylene [δ
H 4.11, 4.15 (each d); δ
C 73.0 (t)], two oxymethines [δ
H 3.53 (brs), 4.68 (t); δ
C 74.0 (d), 77.2 (d)], a tetrasubstituted olefin [δ
C 135.2 (s), 140.0 (s)], an acetoxy group [2.06 (s); δ
C 21.5 (q), 171.1 (s)], a benzoyl group [δ
H 7.46 (2H, tt), 7.57 (1H, tt), 8.06 (2H, dd); δ
C 128.3 (d), 129.5 (d), 130.7 (s), 132.7 (d), 166.6 (s)], and a methoxyl group [δ
H 3.24 (s); 55.0 (q)]. In the HMBC experiment (
Figure 2), the following correlations were observed: Me-23 [δ
H 0.88 (s)] to C-3 [δ
c 77.2 (d)], C-4, C-5, and C-24; Me-24 [δ
H 0.93 (s)] to C-3, C-4, C-5, and Me-23; Me-25 [δ
H 0.94 (s)] to C-1, C-5, C-9 [δ
C 140.0 (s)], and C-10; Me-26 [δ
H 1.04 (s)] to C-8 [δ
C 135.2 (s)], C-13, C-14, and C-15; Me-27 [δ
H 1.06 (s)] to C-12, C-13, C-14, and C-18; Me-28 [δ
H 1.13 (s)] to C-16, C-17, C-18, and C-22; H
2-29 [δ
H 4.11, 4.15 (each d)] to C-19, C-20, C-21, C-30, and 29-O
CO [δ
C 166.6 (s)]; Me-30 [δ
H 1.08 (s)] to C-19, C-20, C-21, and C-29 [δ
C 73.0 (t)]; H-3 [δ
H 4.68 (t)] to 3-O
CO [δ
C 171.1 (s)]; H-5, H-6β, and 7-O
Me [δ
H 3.24 (s)] to C-7 [δ
C 74.0 (d)]; H-6β, H-11, and Me-26 to C-8 [δ
C 135.2 (s)]; and H-11 and Me-25 to C-9 [δ
C 140.0 (s)] (
Figure 2).
Table 1.
1H (500 MHz) and 13C (125 MHz) NMR spectroscopic data of compounds 1–3 (CDCl3) a.
Table 1.
1H (500 MHz) and 13C (125 MHz) NMR spectroscopic data of compounds 1–3 (CDCl3) a.
| Position | 1 | 2 | 3 |
|---|
| δC (ppm), type | δH (ppm) (J in Hz) | δC (ppm), type | δH (ppm) (J in Hz) | δC (ppm), type | δH (ppm) (J in Hz) |
|---|
| 1 | 29.7, t | α, 1.39, m | 29.5, t | 1.59, m | 31.8, t | α, 1.97, m |
| | β, 1.45, m | | | | β, 1.58 m |
| 2 | 23.4, t | α, 1.64, m | 22.9, t | α, 1.75, m | 23.1, t | α, 1.87, m |
| | β, 1.85, m | | β, 1.95, m | | β, 1.98, m |
| 3 | 77.2, d | 4.68, t (2.8) | 76.9, d | 4.71, t (2.5) | 78.8, d | 4.82, brd (3.2) |
| 4 | 36.2, s | | 36.5, s | | 37.6, s | |
| 5 | 39.7, d | 1.99, dd (12.5, 1.1) | 42.6, d | 2.07, dd (7.5, 3.9) | 43.9, d | 1.94, m |
| 6 | 22.4, t | α, 1.89, m | 36.2, t | 2.35, m | 23.7, t | α, 2.14, brt (5.0) |
| | β, 1.30, m | | | | β, 2.08, m |
| 7 | 74.0, d | 3.53, brs | 198.3, s | | 119.4, d | 5.60, brd (5.9) |
| 8 | 135.2, s | | 142.5, s | | 142.3, s | |
| 9 | 140.0, s | | 163.3, s | | 145.8, s | |
| 10 | 38.5, s | | 39.2, s | | 36.4, s | |
| 11 | 21.0, t | 1.95, 2H, m | 22.2, t | α, 2.30, m | 114.8, d | 5.29, brd (5.9) |
| | | | β, 2.14, m | | |
| 12 | 31.2, t | α, 1.34, m | 29.8, t | α, 1.38, m | 39.1, t | α, 2.08, m |
| | β, 1.60, m | | β, 1.59, m | | β, 1.79, m |
| 13 | 37.0, s | | 38.0, s | | 37.5, s | |
| 14 | 41.7, s | | 39.1, s | | 40.4, s | |
| 15 | 25.4, t | α, 2.18, m | 29.4, t | α, 2.43, m | 27.6, t | α, 1.63, m |
| | β, 1.25, m | | β, 1.59, m | | β, 1.42, m |
| 16 | 36.9, t | 1.56, 2H, m | 35.9, t | α, 1.39, m | 37.2, t | α, 1.76, m |
| | | | β, 1.63, m | | β, 1.49, m |
| 17 | 31.1, s | | 31.1, s | | 31.9, s | |
| 18 | 44.0, d | 1.59, m | 41.3, d | 1.66, m | 45.1, d | 1.68, m |
| 19 | 28.8, t | α, 1.84, m | 30.2, t | α, 1.63, m | 29.6, t | α, 1.76, m |
| | β, 1.30, m | | β, 1.29, dd (15.7, 3.9) | | β, 1.30, m |
| 20 | 31.9, s | | 32.4, s | | 29.9, s | |
| 21 | 29.5, t | 1.51, 2H, m | 28.3, t | α, 1.56, m | 30.1, t | 1.63, 2H, m |
| | | | β, 1.47, m | | |
| 22 | 35.7, t | α, 1.79, m | 38.5, t | α, 1.50, m | 33.0, t | α, 1.89, m |
| | β, 0.97, m | | β, 1.03, m | | β, 0.95, m |
| 23 | 27.2, q | 0.88, s | 26.7, q | 0.87, s | 28.0, q | 0.90, s |
| 24 | 22.3, q | 0.93, s | 21.4, q | 0.99, s | 21.6, q | 1.03, s |
| 25 | 18.2, q | 0.94, s | 18.0, q | 1.03, s | 21.1, q | 1.01, s |
| 26 | 26.1, q | 1.04, s | 26.7, q | 1.39, s | 21.2, q | 0.94, s |
| 27 | 18.9, q | 1.06, s | 18.3, q | 0.99, s | 19.9, q | 1.03, s |
| 28 | 31.2, q | 1.13, s | 30.6, q | 1.22, s | 31.4, q | 1.11, s |
| 29 | 73.0, t | a, 4.15, d (10.8) | 75.0, t | a, 4.05, d (10.5) | 74.2, t | a, 4.34, d (10.7) |
| | b, 4.09, d (10.8) | | b, 4.02, d (10.5) | | b, 4.12, d (10.7) |
| 30 | 29.7, q | 1.08, s | 26.5, q | 1.15, s | 31.3, q | 1.16, s |
| 3-OCO | 171.1, s | | 170.6, s | | 165.4, s | |
| 1' | 21.5, q | 2.06, s | 21.3, q | 2.07, s | 123.1, s | |
| 2', 6' | | | | | 131.9, d | 7.85, 2H, dd (8.4, 2.8) |
| 3', 5' | | | | | 115.3, d | 6.84, 2H, dd (8.4, 2.8) |
| 4' | | | | | 160.8, s | |
| 29-OCO | 166.6, s | | 166.8, s | | 168.5, s | |
| 1'' | 130.7, s | | 130.6, s | | 130.2, s | |
| 2'', 6'' | 129.5, d | 8.06, 2H, dd (7.4, 1.3) | 129.5, d | 8.06, 2H, dd (8.0, 1.4) | 129.6, d | 8.04, 2H, dd (7.4, 1.4) |
| 3'', 5'' | 128.3, d | 7.46, 2H, tt (7.4, 1.3) | 132.8, d | 7.46, 2H, tt (8.0, 1.4) | 128.8, d | 7.46, 2H, tt (7.4, 1.4) |
| 4'' | 132.7, d | 7.57, tt (7.4, 1.3) | 128.4, d | 7.58, tt (8.0, 1.4) | 133.6, d | 7.56, tt (7.4, 1.4) |
| 7-OMe | 55.0, q | 3.24, s | | | | |
| 4'-OH | | | | | | 7.49, brs |
Figure 2.
Key HMBC (
![Molecules 18 05568 i001]()
) and
1H-
1H COSY (
![Molecules 18 05568 i002]()
) correlations of
1.
Figure 2.
Key HMBC (
![Molecules 18 05568 i001]()
) and
1H-
1H COSY (
![Molecules 18 05568 i002]()
) correlations of
1.
In the
1H-
1H COSY experiment, H-7 [δ
H 3.53 (brs)] correlated with H
2-6 [δ
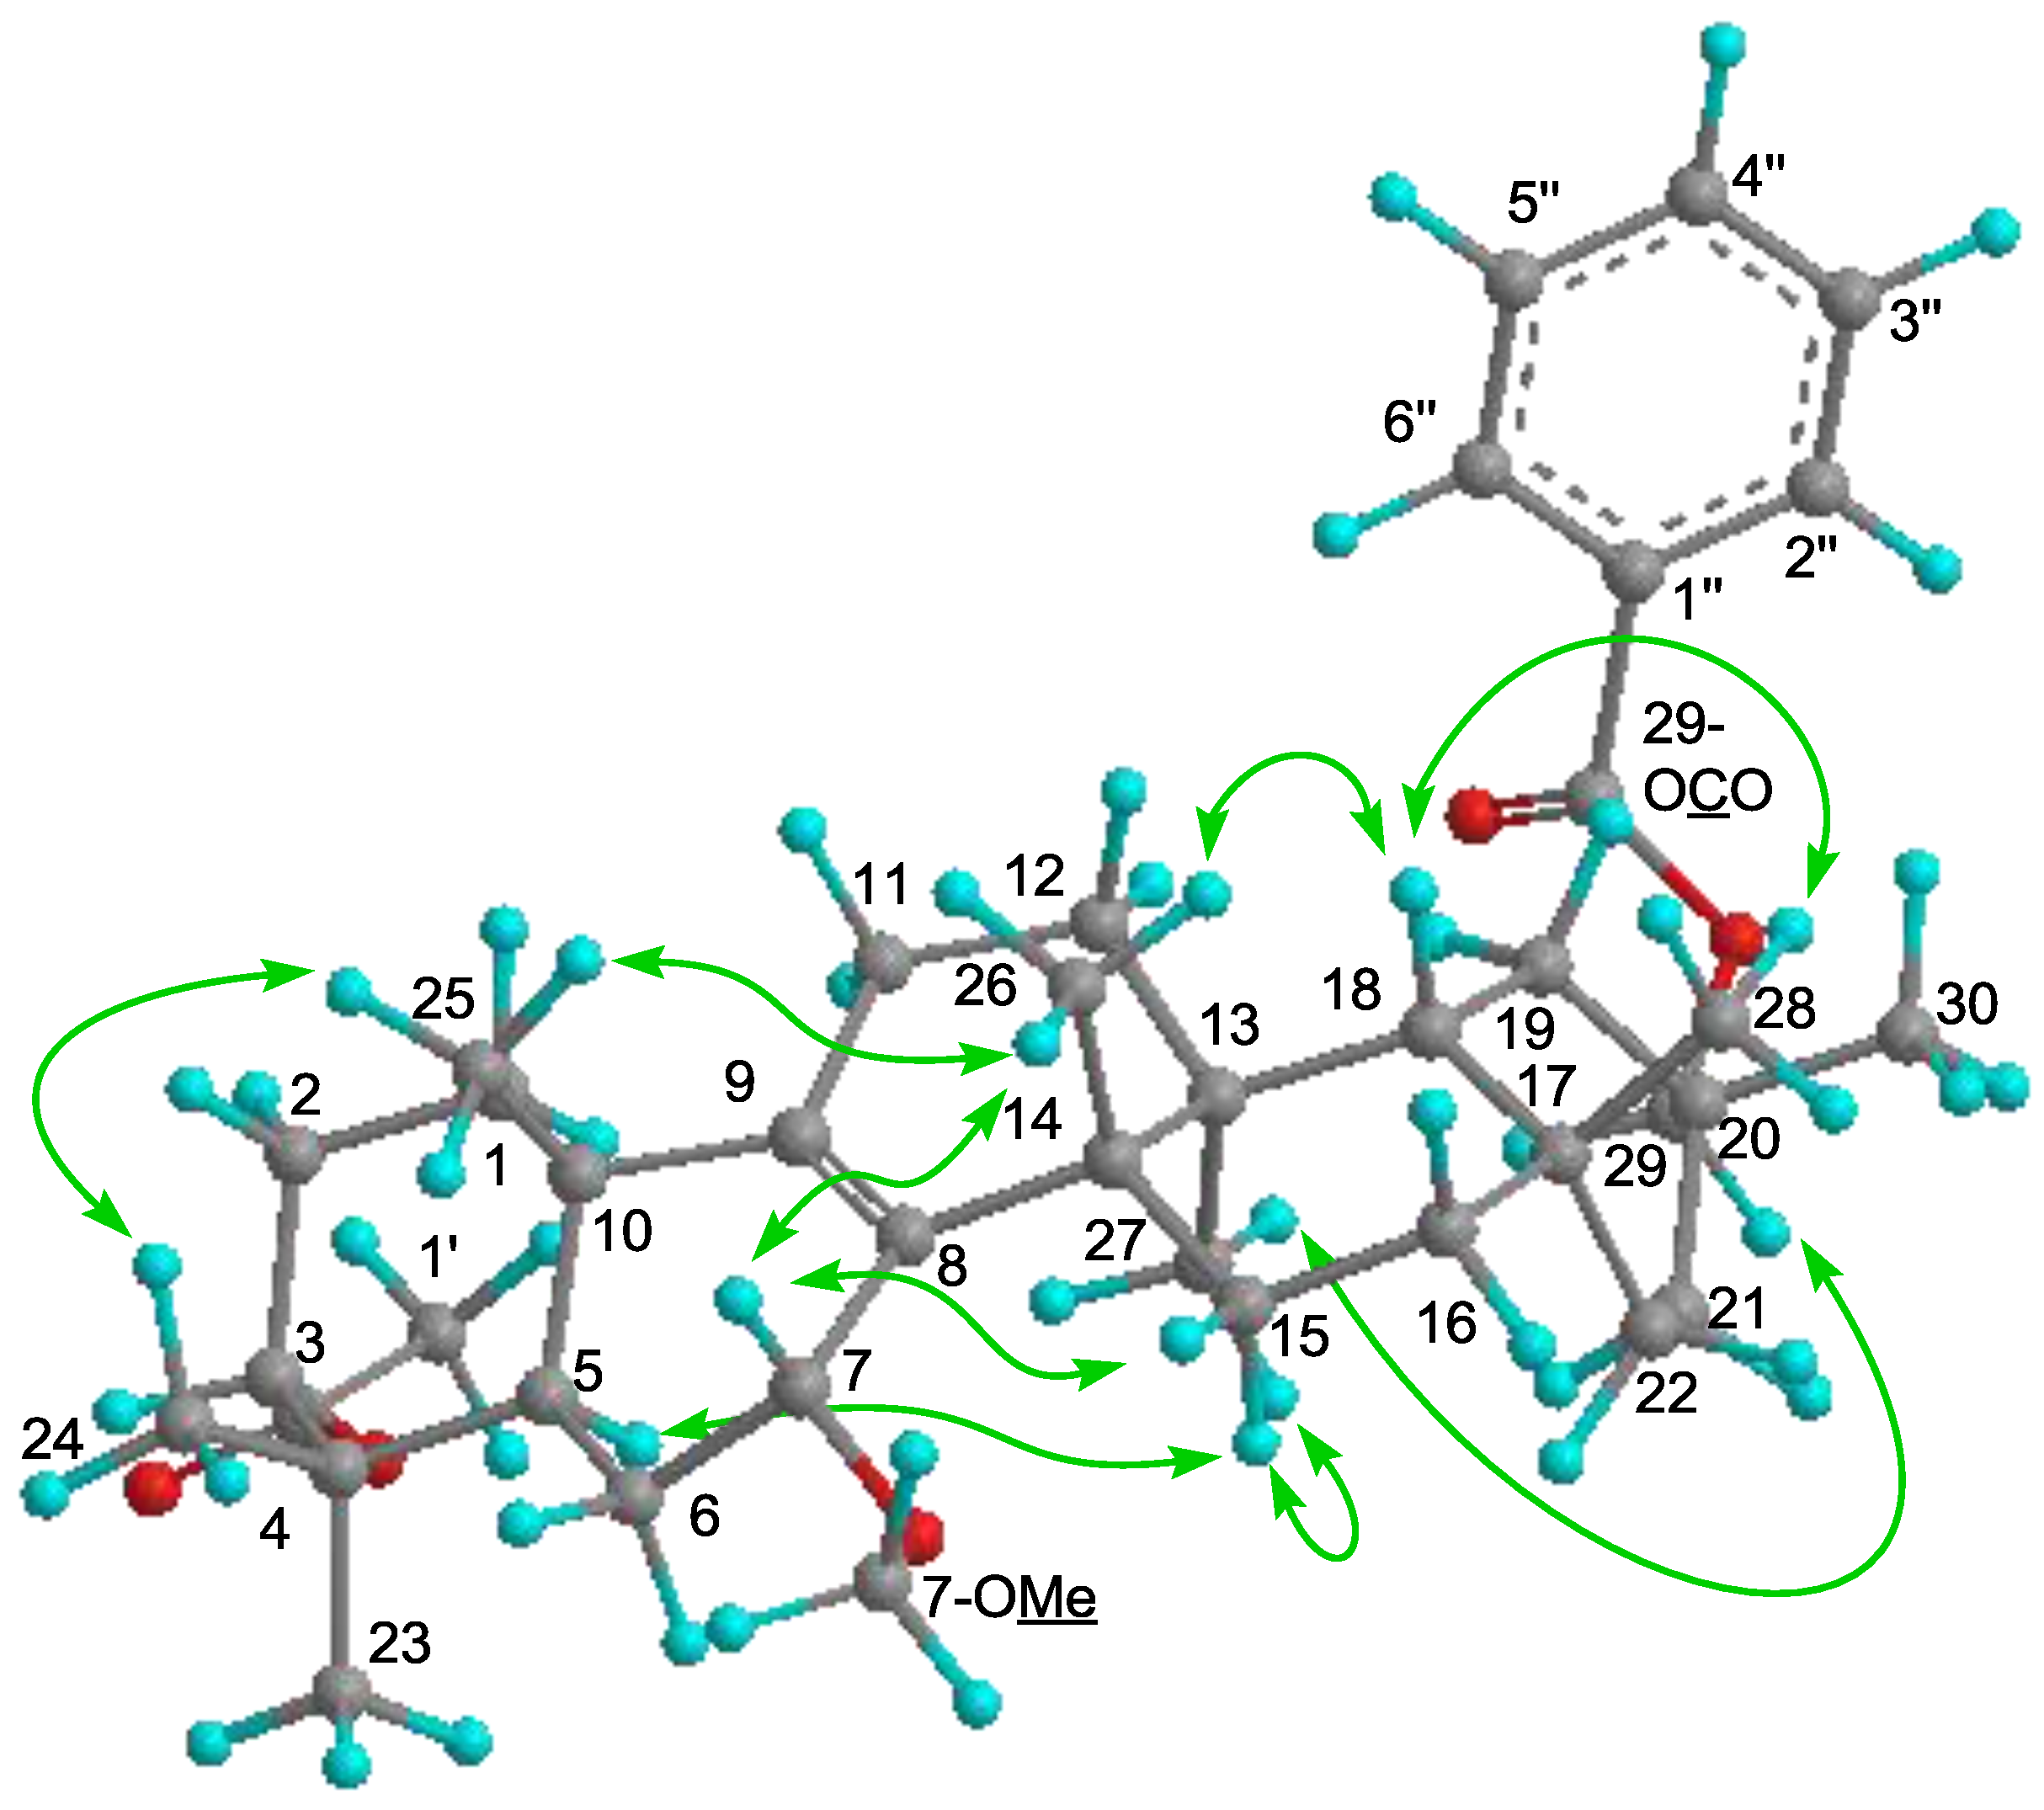
H 1.30, 1.89]. The following significant NOE interactions were observed in
1: H-5/H-15α; H-15α/Me-27; Me-27/H
2-29; Me-26/H-7, Me-25, and H-18; H-18/Me-28 (
Figure 3). Therefore, the methoxy group at C-7 had the α (axial)-orientation. The configuration of the acetoxy group at C-3 was established as the α (axial)-orientation due to the NOE correlations between H-3 and Me-23 and Me-24, and the coupling constants of H-3 [δ
H 4.68 (t,
J3β.2α;3β,2β = 2.8 Hz)]. Therefore,
1 was determined as 7α-methoxymultiflor-8-ene-3α,29-diol 3-acetate-29-benzoate.
Figure 3.
Key NOE (
![Molecules 18 05568 i003]()
) correlations of
1.
Figure 3.
Key NOE (
![Molecules 18 05568 i003]()
) correlations of
1.
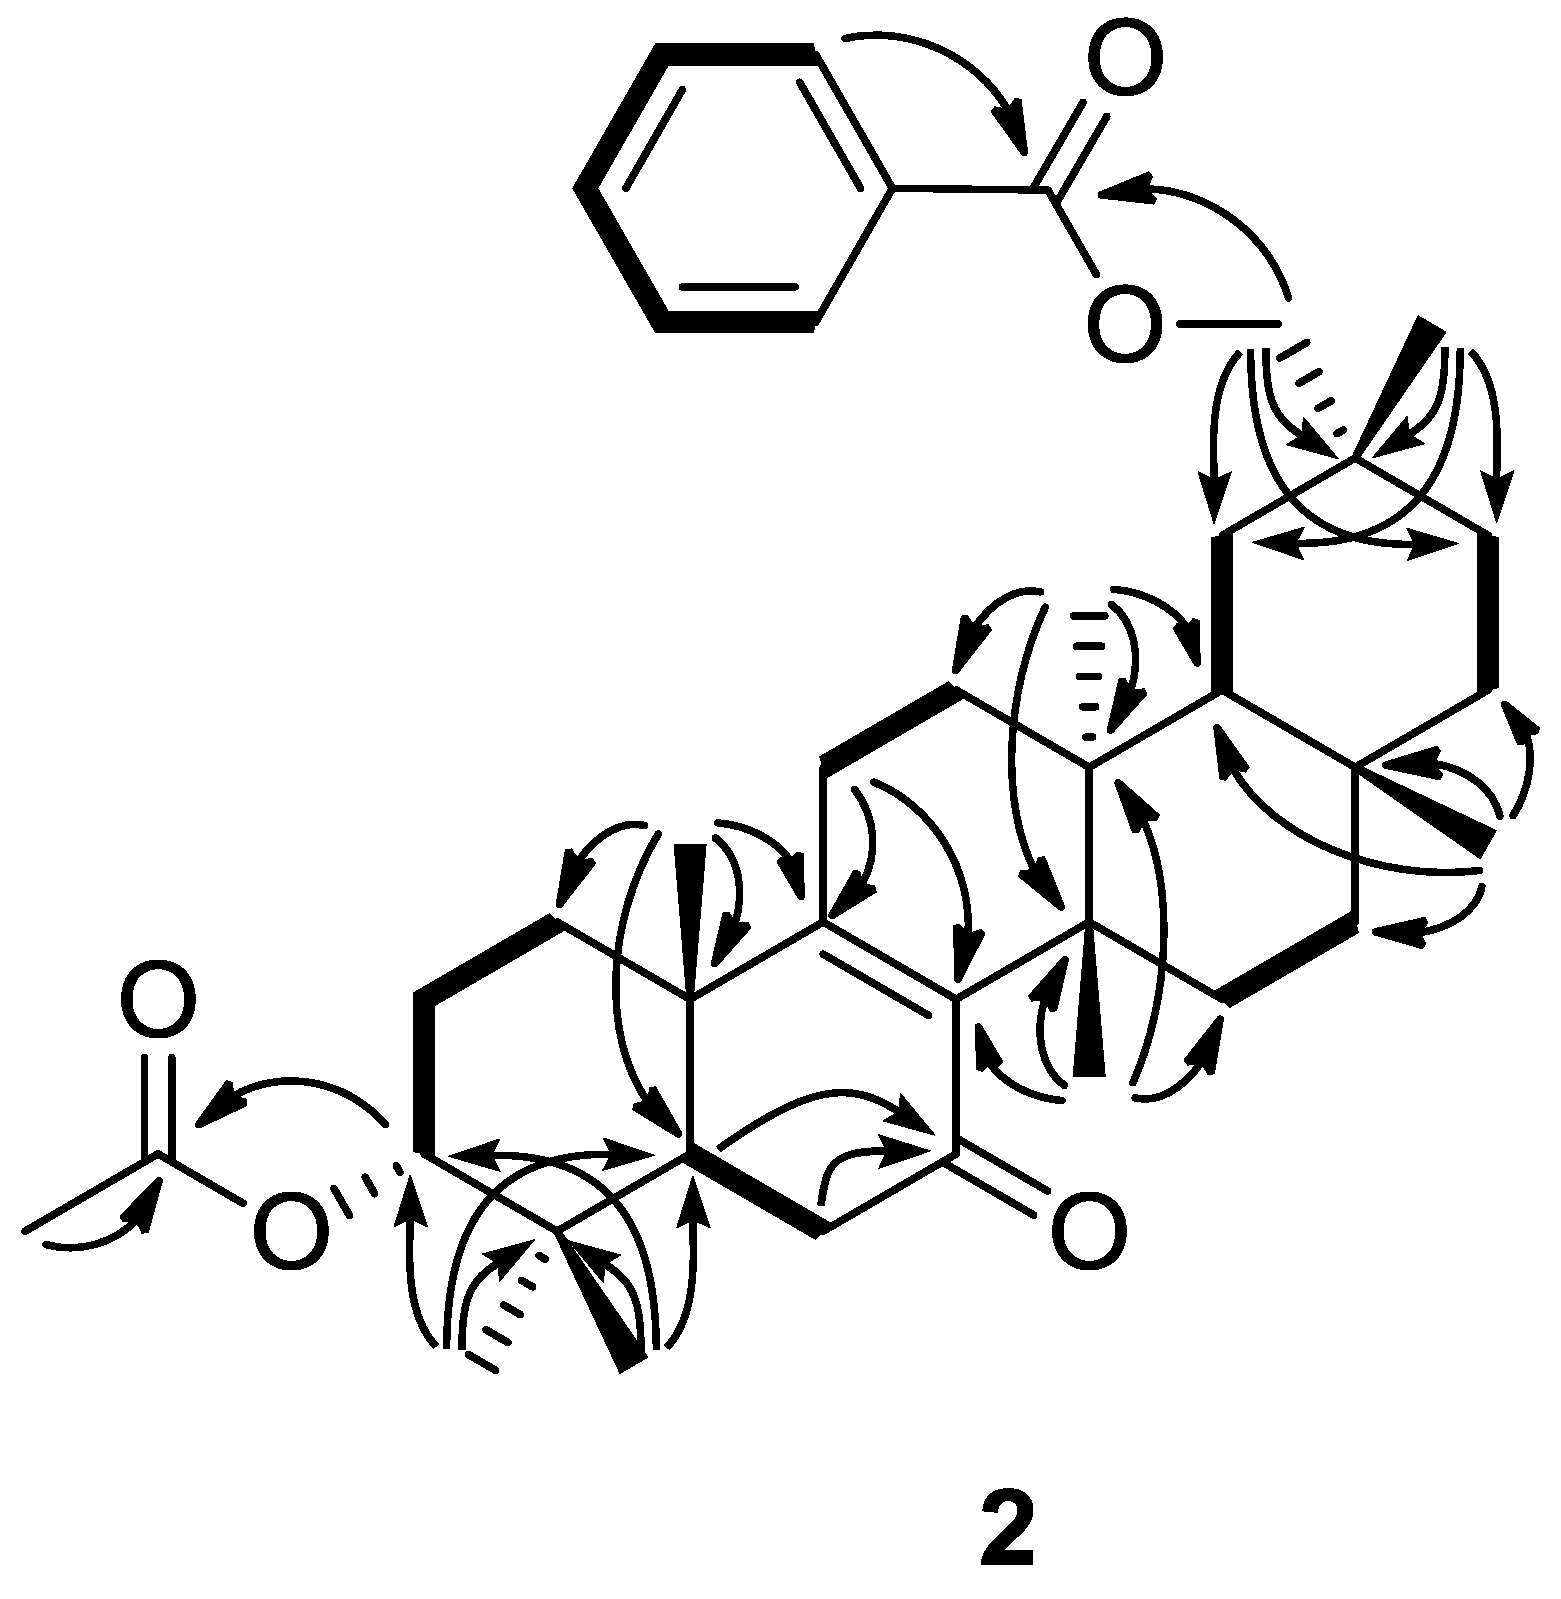
Compound
2 exhibited a [M]
+ ion in the HREIMS data at
m/z 602.3975 whose molecular formula was C
39H
54O
5(calcd. 602.3972). The IR and UV spectra showed absorptions indicating two carbonyl groups [ν
max 1739 (C=O), 1723 (C=O), 1270 (C−O), 1245 (C−O) cm
−1] and an α,β-unsaturated six-membered ring ketone [ν
max 1658 cm
−1; λ
max 233.0 nm (log ε 3.91)].
2 is similar to
1 according to the
1H- and
13C-NMR spectra (δ
H and δ
C in ppm). In the HMBC experiment, cross-peaks were observed from H-5 and H-6 to C-7 [δ
C 198.3 (s)]; and from H
2-11 to C-8 [δ
C 142.5 (s)] and C-9 [δ
C 163.3 (s)] (
Figure 4). In the
1H-
1H COSY experiment, H
2-11 [δ
H 2.14, 2.30] correlated with H
2-12 [δ
H 1.38, 1.59], but H
2-6 [δ
H 2.35 (2H)] correlated with only H-5 [δ
H 2.07 (dd)] (
Figure 4). NOESY experiments revealed that the relative of
2 to have the same conformation as
1. As a result,
2 was determined to be 7-oxomultiflor-8-ene-3α,29-diol 3-acetate-29-benzoate.
Figure 4.
Key HMBC (
![Molecules 18 05568 i001]()
) and
1H-
1H COSY (
![Molecules 18 05568 i002]()
) correlations of
2.
Figure 4.
Key HMBC (
![Molecules 18 05568 i001]()
) and
1H-
1H COSY (
![Molecules 18 05568 i002]()
) correlations of
2.
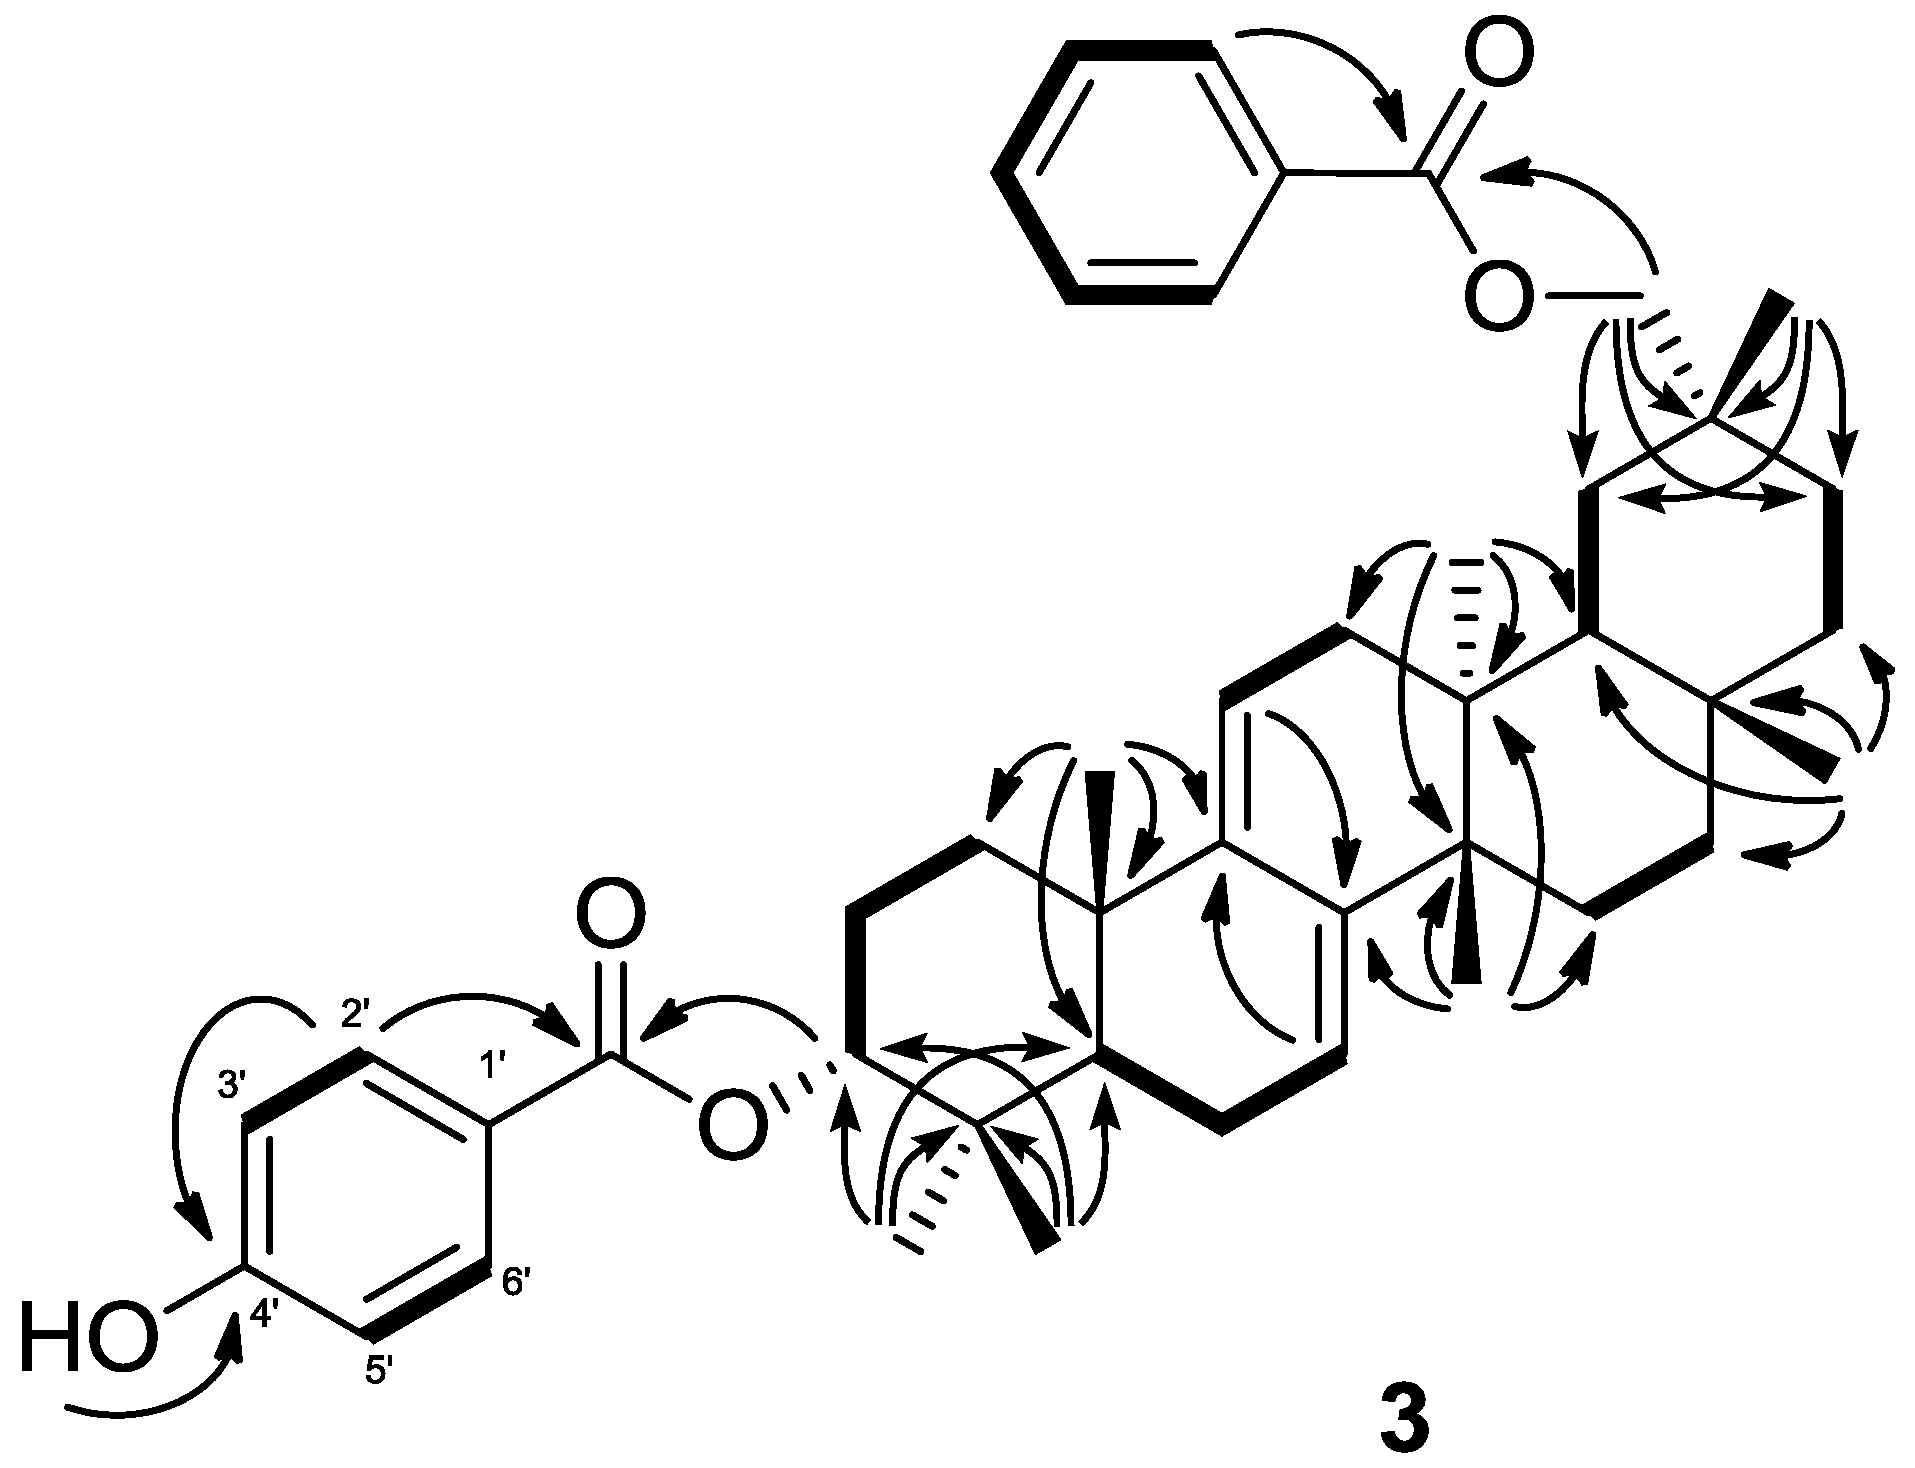
The molecular formula of
3 was determined as C
44H
56O
5 based on the HREIMS (
m/z 664.4127, calcd. 664.4127). In addition,
m/z 526 [M−C
7H
6O
3]
+ indicated the presence of a hydroxybenzoyloxy group. The IR spectrum showed the existence of a hydroxy group (ν
max3436 cm
−1) and aryl esters (ν
max 1716, 1683, 1509, 1456, 1274 cm
−1). The
1H- and
13C NMR spectra of
3 displayed signals for seven tertiary methyl groups [δ
H 0.90, 0.94, 1.01, 1.03 (6H), 1.11, 1.16 (each s)], an oxymethylene [δ
H 4.12, 4.34 (each d); δ
C 74.2 (t)], an oxymethine [δ
H 4.82 (brd); δ
C 78.8 (d)], a heteroannular diene [δ
H 5.29, 5.60 (each brd); δ
C 114.8 (d), 119.4 (d), 142.3 (s), 145.8 (s)], two aryl ester groups [δ
H 6.84 (dd), 7.46 (tt), 7.56 (tt), 7.85 (dd), 8.04 (dd); δ
C 115.3 (d), 123.1 (s), 128.8 (d), 129.6 (d), 130.2 (s), 131.9 (d), 133.6 (d), 160.8 (s), 165.4 (s), 168.5 (s)], and a hydroxyl group [δ
H 7.49 (brs)]. The
1H and
13C-NMR spectra of
3 were similar to those of multiflora-7,9(11)-diene-3α-29-diol 3,29-dibenzoate (
4) except for the signal of the C-4' [δ
C 160.8 (s) in
3, δ
C 133.6 (s) in
4]. In the HMBC experiment, the correlations were observed from 4'-O
H [δ
H 7.49 (brs)] to C-4' (
Figure 5). Therefore the structure of
3 was determined to be multiflora-7,9(11)-diene-3α,29-diol 3-
p-hydroxybenzoate-29-benzoate.
The known compounds
4 [
7,
8] and
5 [
9] were identified by comparing MS and
1H and
13C-NMR data with published data, and
6 [
7] by MS and
1H NMR data
.
Figure 5.
Key HMBC (
![Molecules 18 05568 i001]()
) and
1H-
1H COSY () correlations of
3.
Figure 5.
Key HMBC (
![Molecules 18 05568 i001]()
) and
1H-
1H COSY () correlations of
3.
The six multiflorane triterpenes
1−
6 from
C. maxima were evaluated for inhibitory activities against α-MSH-induced melanogenesis in B16 melanomas (
Table 2). At a low concentration (10 μM),
5 inhibited melanogenesis (76.9% of melanin content) with low cytotoxicity (99.5% of cell viability).
5 also inhibited melanogenesis (70.9% of melanin content) with low cytotoxicity (97.7% cell viability) at 30 μM. At a high concentration (100 μM),
3 and
5 exhibited inhibitory activities (51.8 and 67.4% of melanin content, respectively) with low cytotoxicity (95.1 and 99.6% of cell viability, respectively). The activity levels of compounds
5 at 10 and 30 μM were comparable with or superior to those of the positive control, arbutin, which has been recognized as a useful depigmentation compound for skin whitening in the cosmetic industry [
10]. It appears that two multiflorane-type triterpenes,
5 from
C. maxima seeds, may be valuable as potential skin-whitening agents. The melanogenesis inhibitory activity of
2 (28.1% of melanin content at 100 μM) is thought to be due to their cytotoxic action (69.0% of cell viability at 100 μM).
Table 2.
Melanogenesis inhibitory activity and cytotoxicity in B16 mouse melanoma cells of multiflorane-type triterpenes isolated from Cucurbita maxima seeds a.
Table 2.
Melanogenesis inhibitory activity and cytotoxicity in B16 mouse melanoma cells of multiflorane-type triterpenes isolated from Cucurbita maxima seeds a.
| Compound | mean ± S.D. (%) at 10 μM | mean ± S.D. (%) at 30 μM | mean ± S.D. (%) at 100 μM |
|---|
| Melanin content | Cell viability | Melanin content | Cell viability | Melanin content | Cell viability |
|---|
| 1 | 94.8 ± 0.5 | 92.7 ± 2.2 | 77.1 ± 3.8 | 84.4 ± 4.0 | 73.7 ± 3.6 | 84.3 ± 5.2 |
| 2 | 106.8 ±9.3 | 106.3 ± 8.0 | 92.2 ± 5.4 | 107.1 ± 7.4 | 28.1 ± 2.3 | 69.0 ± 4.5 |
| 3 | 91.2 ± 2.2 | 107.2 ± 5.1 | 81.8 ± 4.0 | 105.6 ± 3.1 | 51.8 ± 8.0 | 95.1 ± 4.3 |
| 4 | 98.4 ± 3.2 | 110.8 ± 4.3 | 102.2 ± 11.7 | 103.0 ± 8.2 | 95.4 ± 8.4 | 101.1 ± 5.9 |
| 5 | 76.9 ± 4.0 | 99.5 ± 3.3 | 70.9 ± 0.1 | 97.7 ± 3.1 | 67.4 ± 3.6 | 99.6 ± 2.0 |
| 6 | 107.8 ± 2.6 | 91.0 ± 1.6 | 111.8 ± 7.1 | 81.8 ± 2.1 | 82.0 ± 5.1 | 74.4 ± 3.2 |
| arbutin b | 88.9 ± 2.3 | 100.0 ± 2.7 | 72.3 ± 3.1 | 94.4 ± 1.2 | 55.3 ± 1.0 | 89.9 ± 0.3 |
Six triterpenes and a reference compound, 5-fluorouracil (5-FU), were also evaluated for cytotoxic activities against human leukemia (HL-60) and murine leukemia (P388) cell lines by means of the MTT assay (
Table 3). Compound
2 exhibited single-digit micromolar cytotoxicity with IC
50 values of 7.0 and 9.5 μM against HL-60 and P388 cells, respectively. It was slightly less cytotoxic than 5-FU [IC
50 2.3 (HL-60); 1.9 (P388) μM] (
Table 3).
Table 3.
Cytotoxic activities of multiflorane-type triterpenes from Cucurbita maxima seeds.
Table 3.
Cytotoxic activities of multiflorane-type triterpenes from Cucurbita maxima seeds.
| Compound | IC50 (μM) a |
|---|
| HL-60 | P388 |
|---|
| (human leukemia) | (murine leukemia) |
|---|
| 1 | >100 | >100 |
| 2 | 7.0 ± 1.1 | 9.5 ± 1.1 |
| 3 | 55.9 ± 1.1 | 92.6 ± 1.3 |
| 4 | >100 | >100 |
| 5 | >100 | >100 |
| 6 | 54.1 ± 1.3 | 46.7 ± 1.2 |
| 5-fluorouracil b | 2.3 ± 0.2 | 1.9 ± 0.2 |
3. Experimental
3.1. General Procedures
Chemicals and reagents were purchased as follows: fetal bovine serum (FBS) from Invitrogen Co. (Carlsbad, CA, USA), 3-(4,5-dimethyl-2-thiazolyl)-2,5-diphenyl-2H-tetrazolium bromide (MTT) from Sigma-Aldrich Japan Co. (Tokyo, Japan), and 5-fluorouracil (5-FU) (purity ≥ 98.5%), arbutin (purity ≥ 95.0%), Roswell Park Memorial Institute (RPMI) 1640 medium, Dulbecco’s modified Eagle’s medium (D-MEM), and antibiotics from Nacalai Tesque, Inc. (Kyoto, Japan). All other chemicals and reagents were of analytical grade. Melting points were determined on a Yanagimoto micro-melting point apparatus and are uncorrected. Optical rotations were measured with a JASCO DIP-1000 digital polarimeter. IR spectra were recorded on a Perkin-Elmer 1720X FTIR spectrophotometer. The 1H (500 MHz) and 13C (125 MHz) NMR spectra were recorded on a Varian INOVA 500 spectrometer in CDCl3 with tetramethylsilane as the internal standard. The EIMS was recorded on a Hitachi 4000H double-focusing mass spectrometer (70 eV). Silica gel (70–230 mesh, Merck) and silica gel 60 (230–400 mesh, Nacalai Tesque, Inc., Kyoto, Japan) were used for column chromatography and medium-pressure liquid chromatography, respectively. The 20% AgNO3/SiO2 (w/w) used for chromatography was prepared from silica gel 60 and AgNO3 (Nacalai Tesque, Inc., Kyoto, Japan). HPLC was carried out on an SiO2 column (Cosmosil 5SL-II column, 25 cm × 20 mm i.d., Nacalai Tesque, Inc., Kyoto, Japan) at 25 °C with n-hexane/EtOAc [10:1 (HPLC system I) and 5:1 (HPLC system II), flow rate 8.0 mL/min].
3.2. Plant Material
The seeds of Cucurbita maxima, produced in Japan (Nara prefecture), were purchased from JA (Japan Agricultural Co-operation)-Takatsuki in 2011. A voucher specimen was deposited in the Herbarium of the Laboratory of Medicinal Chemistry, Osaka University of Pharmaceutical Sciences.
3.3. Extraction and Isolation
The seeds of Cucurbita maxima (3 kg) were subjected to extraction with MeOH (10 L) under reflux (1 week, 4 times). After concentration the MeOH extract (102.2 g) was then partitioned between Et2O and H2O. The Et2O-soluble fraction (62.2 g) was subjected to SiO2 column chromatography (CC) [SiO2 (1.5 kg); CHCl3/EtOAc 1:0, 5:1, 2:1, 0:1 and MeOH, in increasing order of polarity] resulting in seven fractions (Fr. A–G). Fr. B, eluted with CHCl3, was subjected to SiO2 CC to yield 10 fractions, B1–B10. Among them, Fr. B3, eluted with hexane/EtOAc (5:1), was subjected to SiO2 CC to yield 11 fractions; B3-1–B3-11. Preparative HPLC of B3-4 (123.0 mg), eluted with hexane/EtOAc (5:1), gave 4 (15.5 mg; tR 11.2 min) (HPLC system I). Fr. C, eluted with CHCl3, was subjected to SiO2 CC to yield 22 fractions, C1–C22. Preparative HPLC of C3 (14.8 mg), eluted with hexane/EtOAc (10:1), gave 4 (5.1 mg) and 6 (3.1 mg; tR 12.0 min), respectively (HPLC system I). Fr. C11 (1.3 g), eluted with hexane/EtOAc (10:1), was subjected to CC with 20% AgNO3/SiO2 to give C11-1–C11-11, followed by CC of C11-4 (795.6 mg), eluted with hexane/CHCl3 (20:1), with 20% AgNO3/SiO2 to yield C11-4-1–C11-4-9. Preparative HPLC of C11-4-3 (15.0 mg), eluted with hexane/EtOAc (2:1), gave 2 (2.0 mg; tR 18.9 min) (HPLC system II). Fr. D, eluted with CHCl3, was fractionated with SiO2 CC to D1–D16. Fr. D4 (1369.0 mg), eluted with hexane/EtOAc (5:1) was subjected to SiO2 CC to yield D4-1–D4-12. Preparative HPLC of D4-5 (10.0 mg), eluted with hexane/EtOAc (5:1), gave 1 (1.6 mg; tR 15.3 min) (HPLC system II). Fr. D4-7 (194.3 mg), eluted with hexane/EtOAc (5:1), was subjected to SiO2 CC to yield D4-7-1–D4-7-7, followed by preparative HPLC of D4-7-2 (99.9 mg), eluted with hexane/EtOAc (5:1), for the isolation of 2 (3.0 mg; tR 22.2 min) and 1 (1.4 mg) (HPLC system II). Fr. D6 (265.4 mg), eluted with hexane/EtOAc (5:1) was subjected to SiO2 CC to yield D6-1–D6-11, followed by preparative HPLC of D6-2 (6.7 mg), eluted with hexane/EtOAc (10:1), for the isolation of 5 (3.6 mg; tR 35.6 min) (HPLC system I). Fr. D7 (176.3 mg), eluted with hexane/EtOAc (10:1), was subjected to SiO2 CC with hexane/EtOAc (10:1) for fractionation to D7-1–D7-12. SiO2 CC of D7-8 gave 3 (1.7 mg).
7α-Methoxymultiflor-8-ene-3α,29-diol 3-acetate-29-benzoate (
1). Amorphous solid; [α]22
D −74.8 (
c 0.1, CHCl
3); UV (EtOH) λ
max (logε) 206.0 (3.58), 228.5 (3.68), 271 (2.81) nm; IR (KBr) ν
max: 2,924, 2,855, 1,743, 1,724, 1,467, 1,452, 1,374, 1,267, 1,247, 1,110, 1,072 cm
−1;
1H- and
13C-NMR spectroscopic data (in ppm), see
Table 1; EIMS
m/z 618 [M]
+ (10), 586 (26), 526 (30), 511 (100), 483 (9), 389 (13), 105 (66); HREIMS
m/z 618.4282 (calcd for C
40H
58O
5, 618.4285).
7-Oxomultiflor-8-ene-3α,29-diol 3-acetate-29-benzoate (
2). Amorphous solid; [α]22
D −67.4 (
c 0.1, CHCl
3); UV (EtOH) λ
max (logε) 233.0 (3.91), 250.5 (3.81) nm; IR (KBr) ν
max: 2,937, 2,883, 1,739, 1,723, 1,658, 1,270, 1,245 cm
−1;
1H- and
13C-NMR spectroscopic data (in ppm), see
Table 1; EIMS
m/z 602 [M]
+ (100), 587 (11), 542 (8), 480 (14), 465 (16), 420 (7), 371 (4), 325 (10), 303 (11), 278 (47), 243 (33), 203 (34), 105 (39); HREIMS
m/z 602.3975 (calcd for C
39H
54O
5, 602.3972).
Multiflora-7,9(11)-diene-3α,29-diol 3-p-hydroxybenzoate-29-benzoate (
3). Amorphous solid; [α]22
D −3.9 (
c 0.09, CHCl
3); UV (EtOH) λ
max (logε) 231.0 (4.25), 246.5 (4.12), 266.5 (3.95) nm; IR (KBr) ν
max: 3,436, 2,941, 2,863, 1,716, 1,683, 1,636, 1,509, 1,456, 1,384, 1,274, 1,166, 1,111 cm
−1;
1H- and
13C-NMR spectroscopic data (in ppm), see
Table 1; EIMS
m/z 664 (16) [M]+, 526 (90) [M−C
7H
6O
3]+, 511 (32), 389 (26), 253 (41), 121 (100); HREIMS
m/z 664.4127 (calcd for C
44H
56O
5, 664.4127).
3.4. Cell Cultures
The cell lines HL-60 (human leukemia) and P388 (murine leukemia) were grown in RPMI 1640 medium, while B16 4A5 cells were grown in D-MEM. The medium was supplemented with 10% FBS and antibiotics (100 units/mL penicillin and 100 μg/mL streptomycin). The cells were incubated at 37 °C in a 5% CO2 humidified incubator.
3.5. Determination of B16 4A5 Cells Proliferation
B16 4A5 cell proliferation was examined according to a method reported previously [
11] with slight modifications. Briefly, B16 4A5 cells (obtained from the Riken Cell Bank, Tsukuba, Ibaraki, Japan) (3 × 10
4 cells in 500 μL), preincubated for 24 h were treated for 48h with test samples dissolved in dimethyl sulfoxide (DMSO) at a final concentration of 100, 30, or 10 μM, and MTT solution was added. After 3 h of incubation, 2-propanol containing 0.08 M HCl was added to dissolve the formazan produced in the cells. The absorbance of each well was read at 550 nm using a microplate reader.
3.6. Assay of Melanin Content
The assay of melanin content was performed as described previously [
11] with small modifications. B16 4A5 cells (3 × 10
4 cells in 500 μL) were pre-incubated as above in α-MSH (100 nM)-containing medium. Test samples dissolved in DMSO were added to the medium and the cells were cultured for 48 h. The medium was removed and the cells were dissolved in 2 M NaOH containing 10% DMSO. The amount of melanin was determined spectrophotometrically by measuring absorbance at 450 nm using a microplate reader. The optical density of control cells was assumed to be 100%.
3.7. Cytotoxicity Assay against Cancer Cell Lines
The cytotoxicity assay against HL-60 and P388 cells was determined as described previously [
12].


 ) and 1H-1H COSY (
  ) correlations of 1.
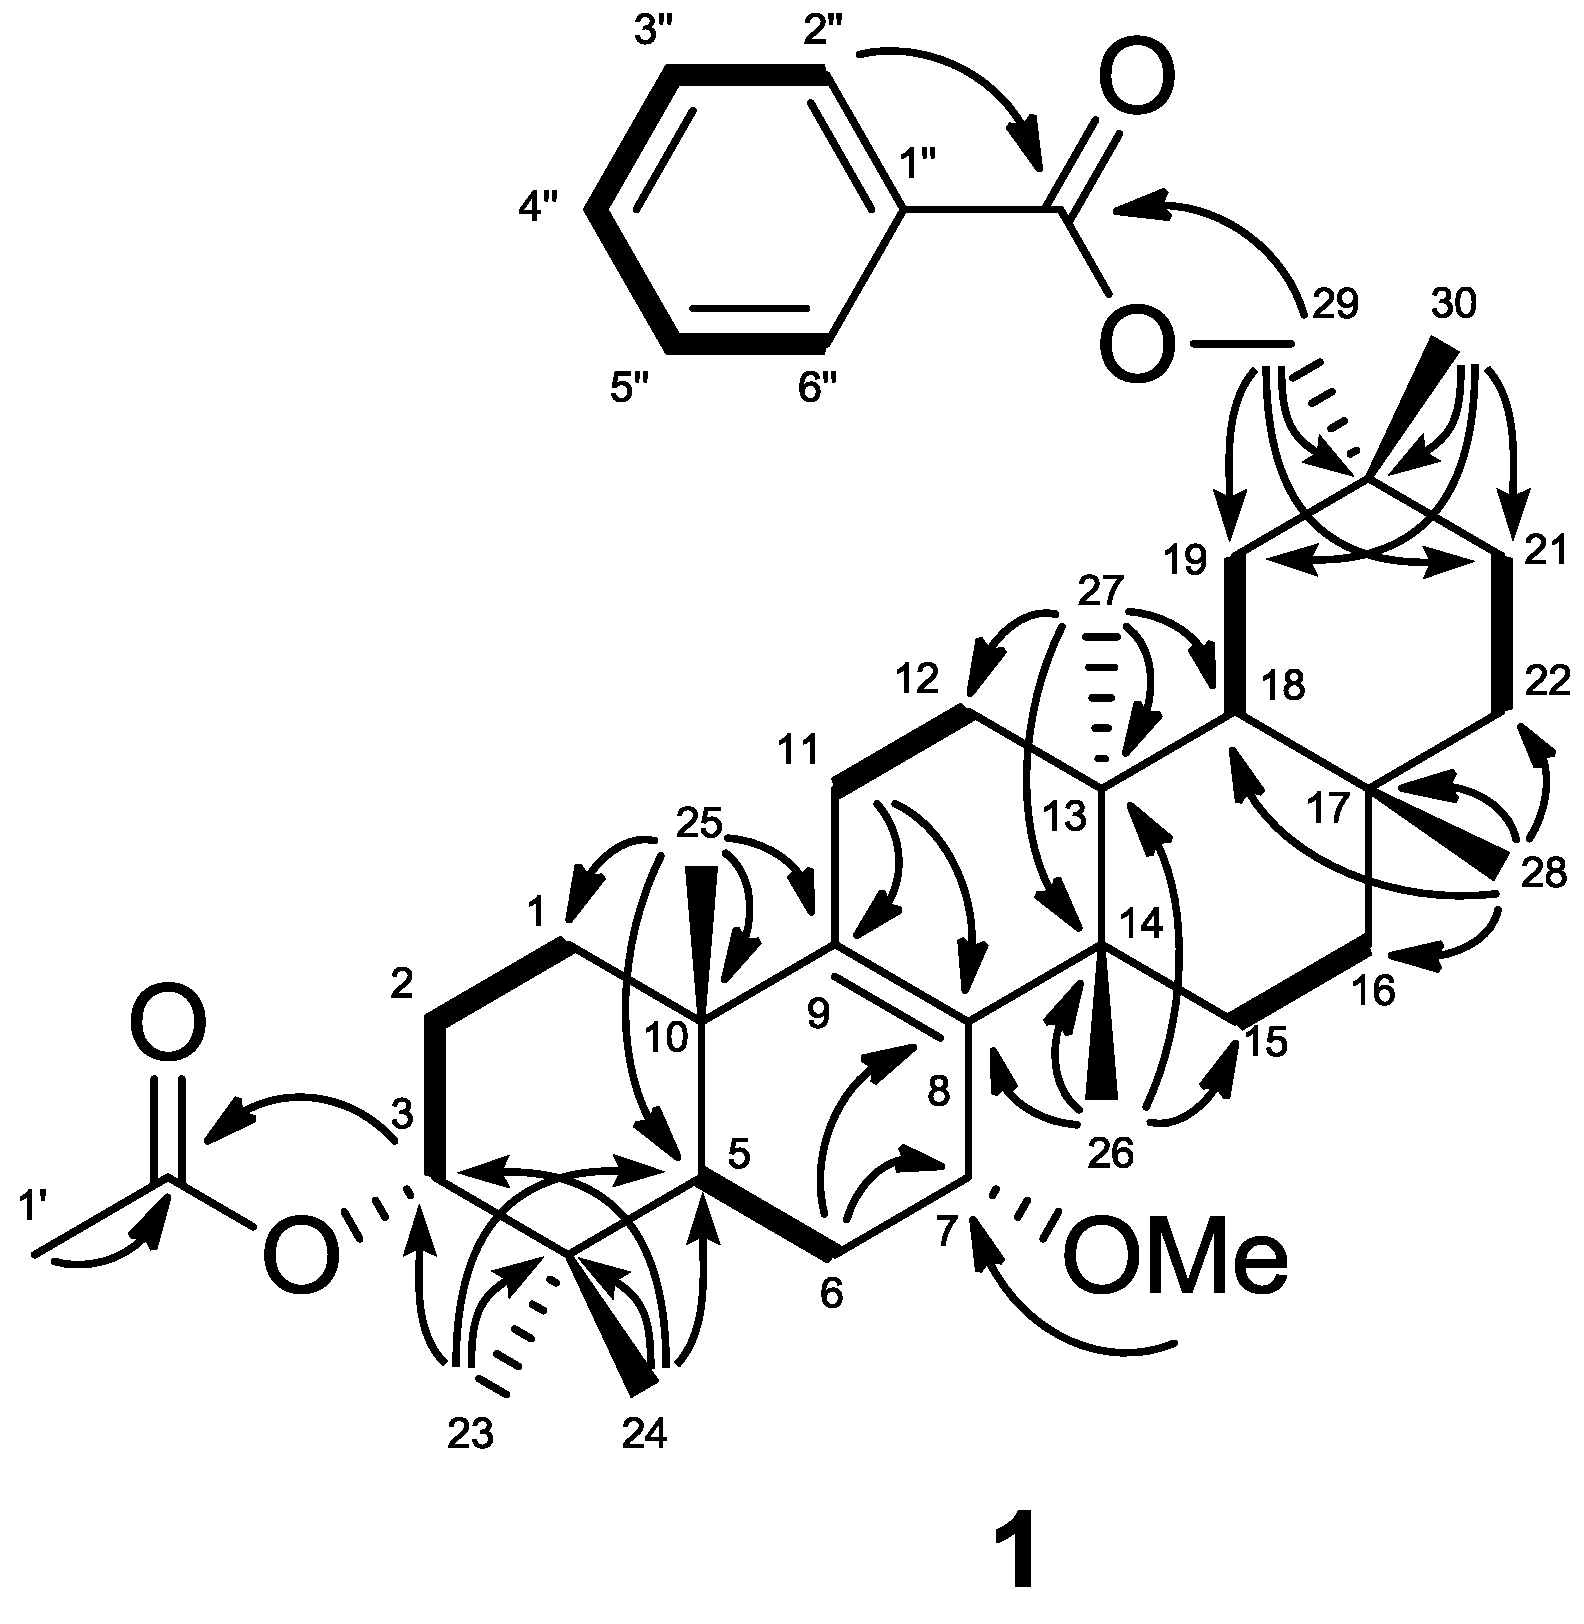
 ) correlations of 1.