1. Introduction
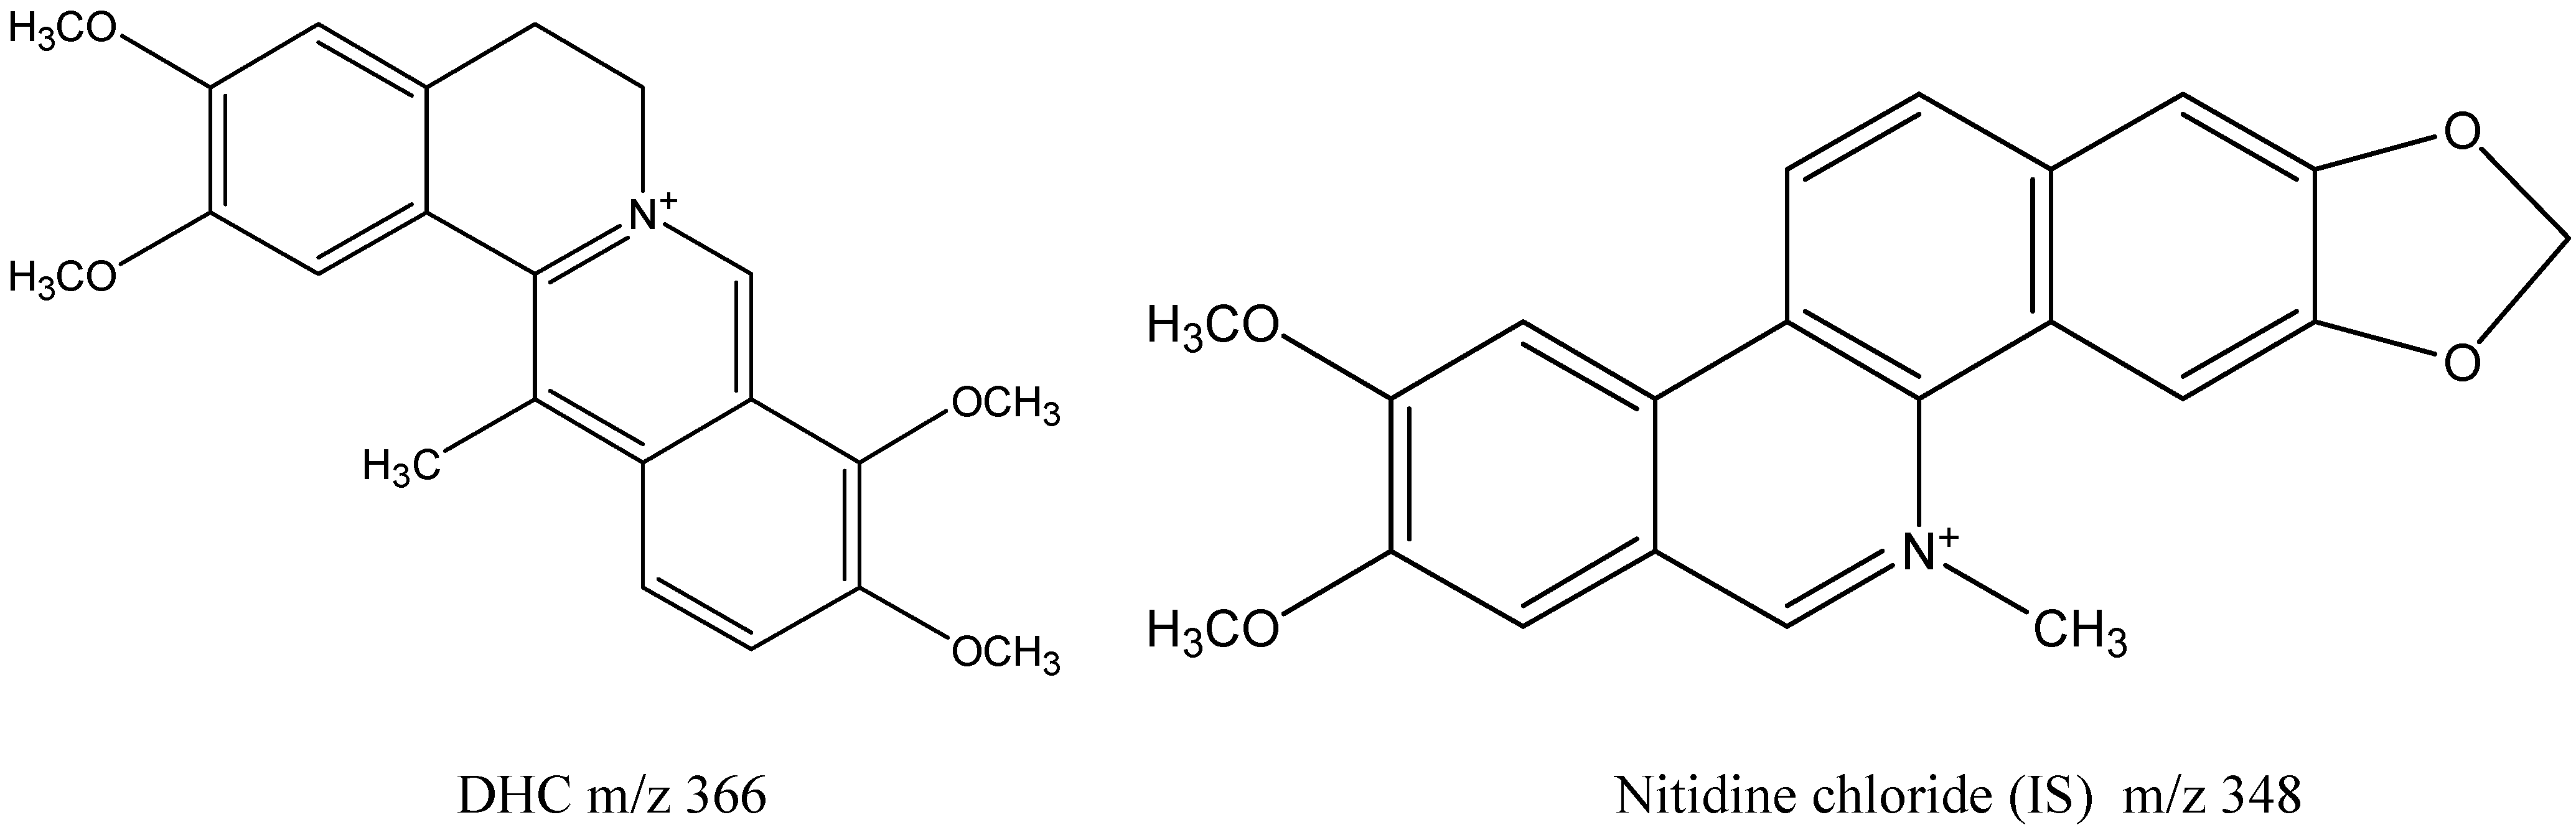
Dehydrocorydaline (DHC), a quaternary protoberberine-type alkaloid (
Figure 1), is an important bioactive component of a very well-known Chinese herbal medicine, Yan-Hu-Suo, which is the tuber of
Corydalis yanhusuo. The herb has been widely used as an analgesic agent for treating spastic, abdominal, and menstrual pains, and for pain due to injury [
1]. It has also been widely used to promote blood circulation and treat coronary heart disease [
2,
3,
4,
5]. Previous studies have identified that quaternary and tertiary alkaloids are the active secondary metabolites of the plant [
6,
7]. The pharmacological effects of the two different types of alkaloid focus on different aspects. Tertiary alkaloids have been found to be effective at alleviating pain (e.g., tetrahydropalmatine, corydaline, and protopine, in order of decreasing efficiency [
1]). In contrast, some quaternary alkaloids, such as DHC, have been found to be more active than tertiary alkaloids in increasing the tolerance of mice to monobasic and hypobaric hypoxia. They also have greater efficacy than tetrahydropalmatine (a tertiary alkaloid) in protecting cardiomyocytes against ischemia in the myocardium
in vitro. As well as two other quaternary alkaloids, berberine and palmatine, it appears that these are the main active ingredients in
Corydalis yanhusuo for the treatment of coronary heart disease [
8,
9,
10].
Figure 1.
Chemical structures of dehydrocorydaline (DHC) and nitidine chloride (IS).
Figure 1.
Chemical structures of dehydrocorydaline (DHC) and nitidine chloride (IS).
Through qualitative and quantitative research on the effective fraction of
Corydalis yanhusuo (EFY) [
11,
12,
13,
14,
15,
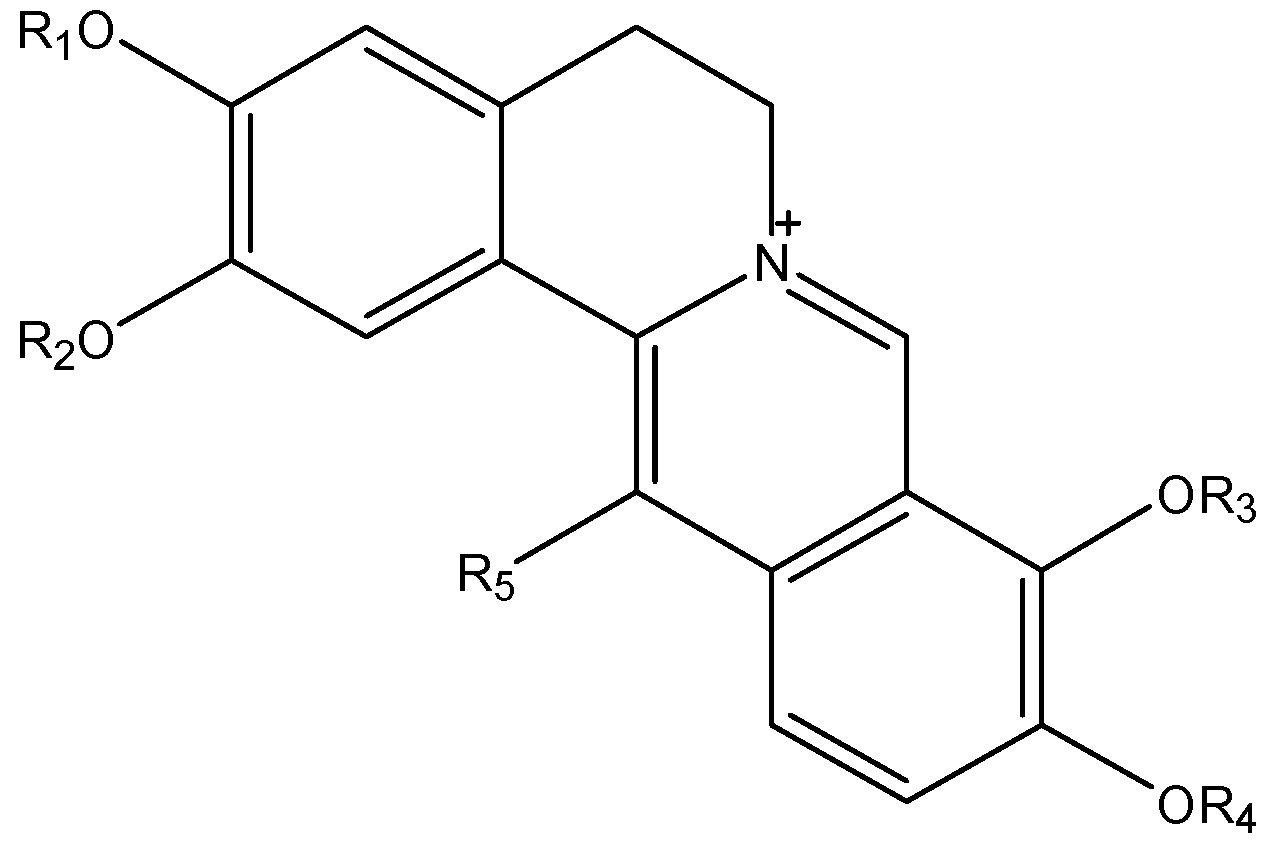
16], we have found that quaternary alkaloids are the main bioactive components (
Figure 2). In addition, our Caco-2 cell experiment [
17] suggested that synergy between the alkaloids in the fraction might promote their oral absorption across the intestinal epithelium. On the other hand, another study showed that the plasma concentration–time curve for DHC can only be obtained when it is given orally in high doses after a total alkaloid extraction from
Rhizoma Corydalis, indicating that DHC is absorbed poorly [
18]. There are, at present, large differences in the studies on the absorption of quaternary protoberberine-type alkaloids.
Figure 2.
The quaternary alkaloids from EFY.
Figure 2.
The quaternary alkaloids from EFY.
| Quaternary Alkaloids | R1 | R2 | R3 | R4 | R5 |
|---|
| 13-methyl-palmatrubine | CH3 | CH3 | H | CH3 | CH3 |
| 13-methyl-dehydrocorydalmine | CH3 | CH3 | CH3 | H | CH3 |
| dehydrocorydaline | CH3 | CH3 | CH3 | CH3 | CH3 |
| dehydrocorybulbine | CH3 | H | CH3 | CH3 | CH3 |
| columbamine | CH3 | H | CH3 | CH3 | H |
| coptisine | -CH2- | -CH2- | H |
| berberine | -CH2- | CH3 | CH3 | H |
| palmatine | CH3 | CH3 | CH3 | CH3 | H |
On the one hand, quaternary protoberberine-type alkaloids are considered to be poorly absorbed because, possibly, of the action of P-glycoprotein (P-gp) inhibitors resulting in trace plasma concentrations after oral administration. On the other hand, it was found that the absorbed amounts of berberine, a quaternary protoberberine-type alkaloid, accounted for 33.6% of the given dose 1 h after oral administration in an
in situ assay of the intestinal loop [
19]. Berberine may be quickly excreted from the blood in rats through bile [
20,
21]. This indicates that DHC can be absorbed well but has a low dosage in systemic circulation. This might be because there may be a very large “first pass” effect in the liver after oral administration. Therefore, data on the cumulative excretion of unchanged quaternary protoberberine-type alkaloids in the bile after oral administration would be very important for clarifying the absorption extent.
Up to now, only two papers investigated the pharmacokinetics of DHC [
18,
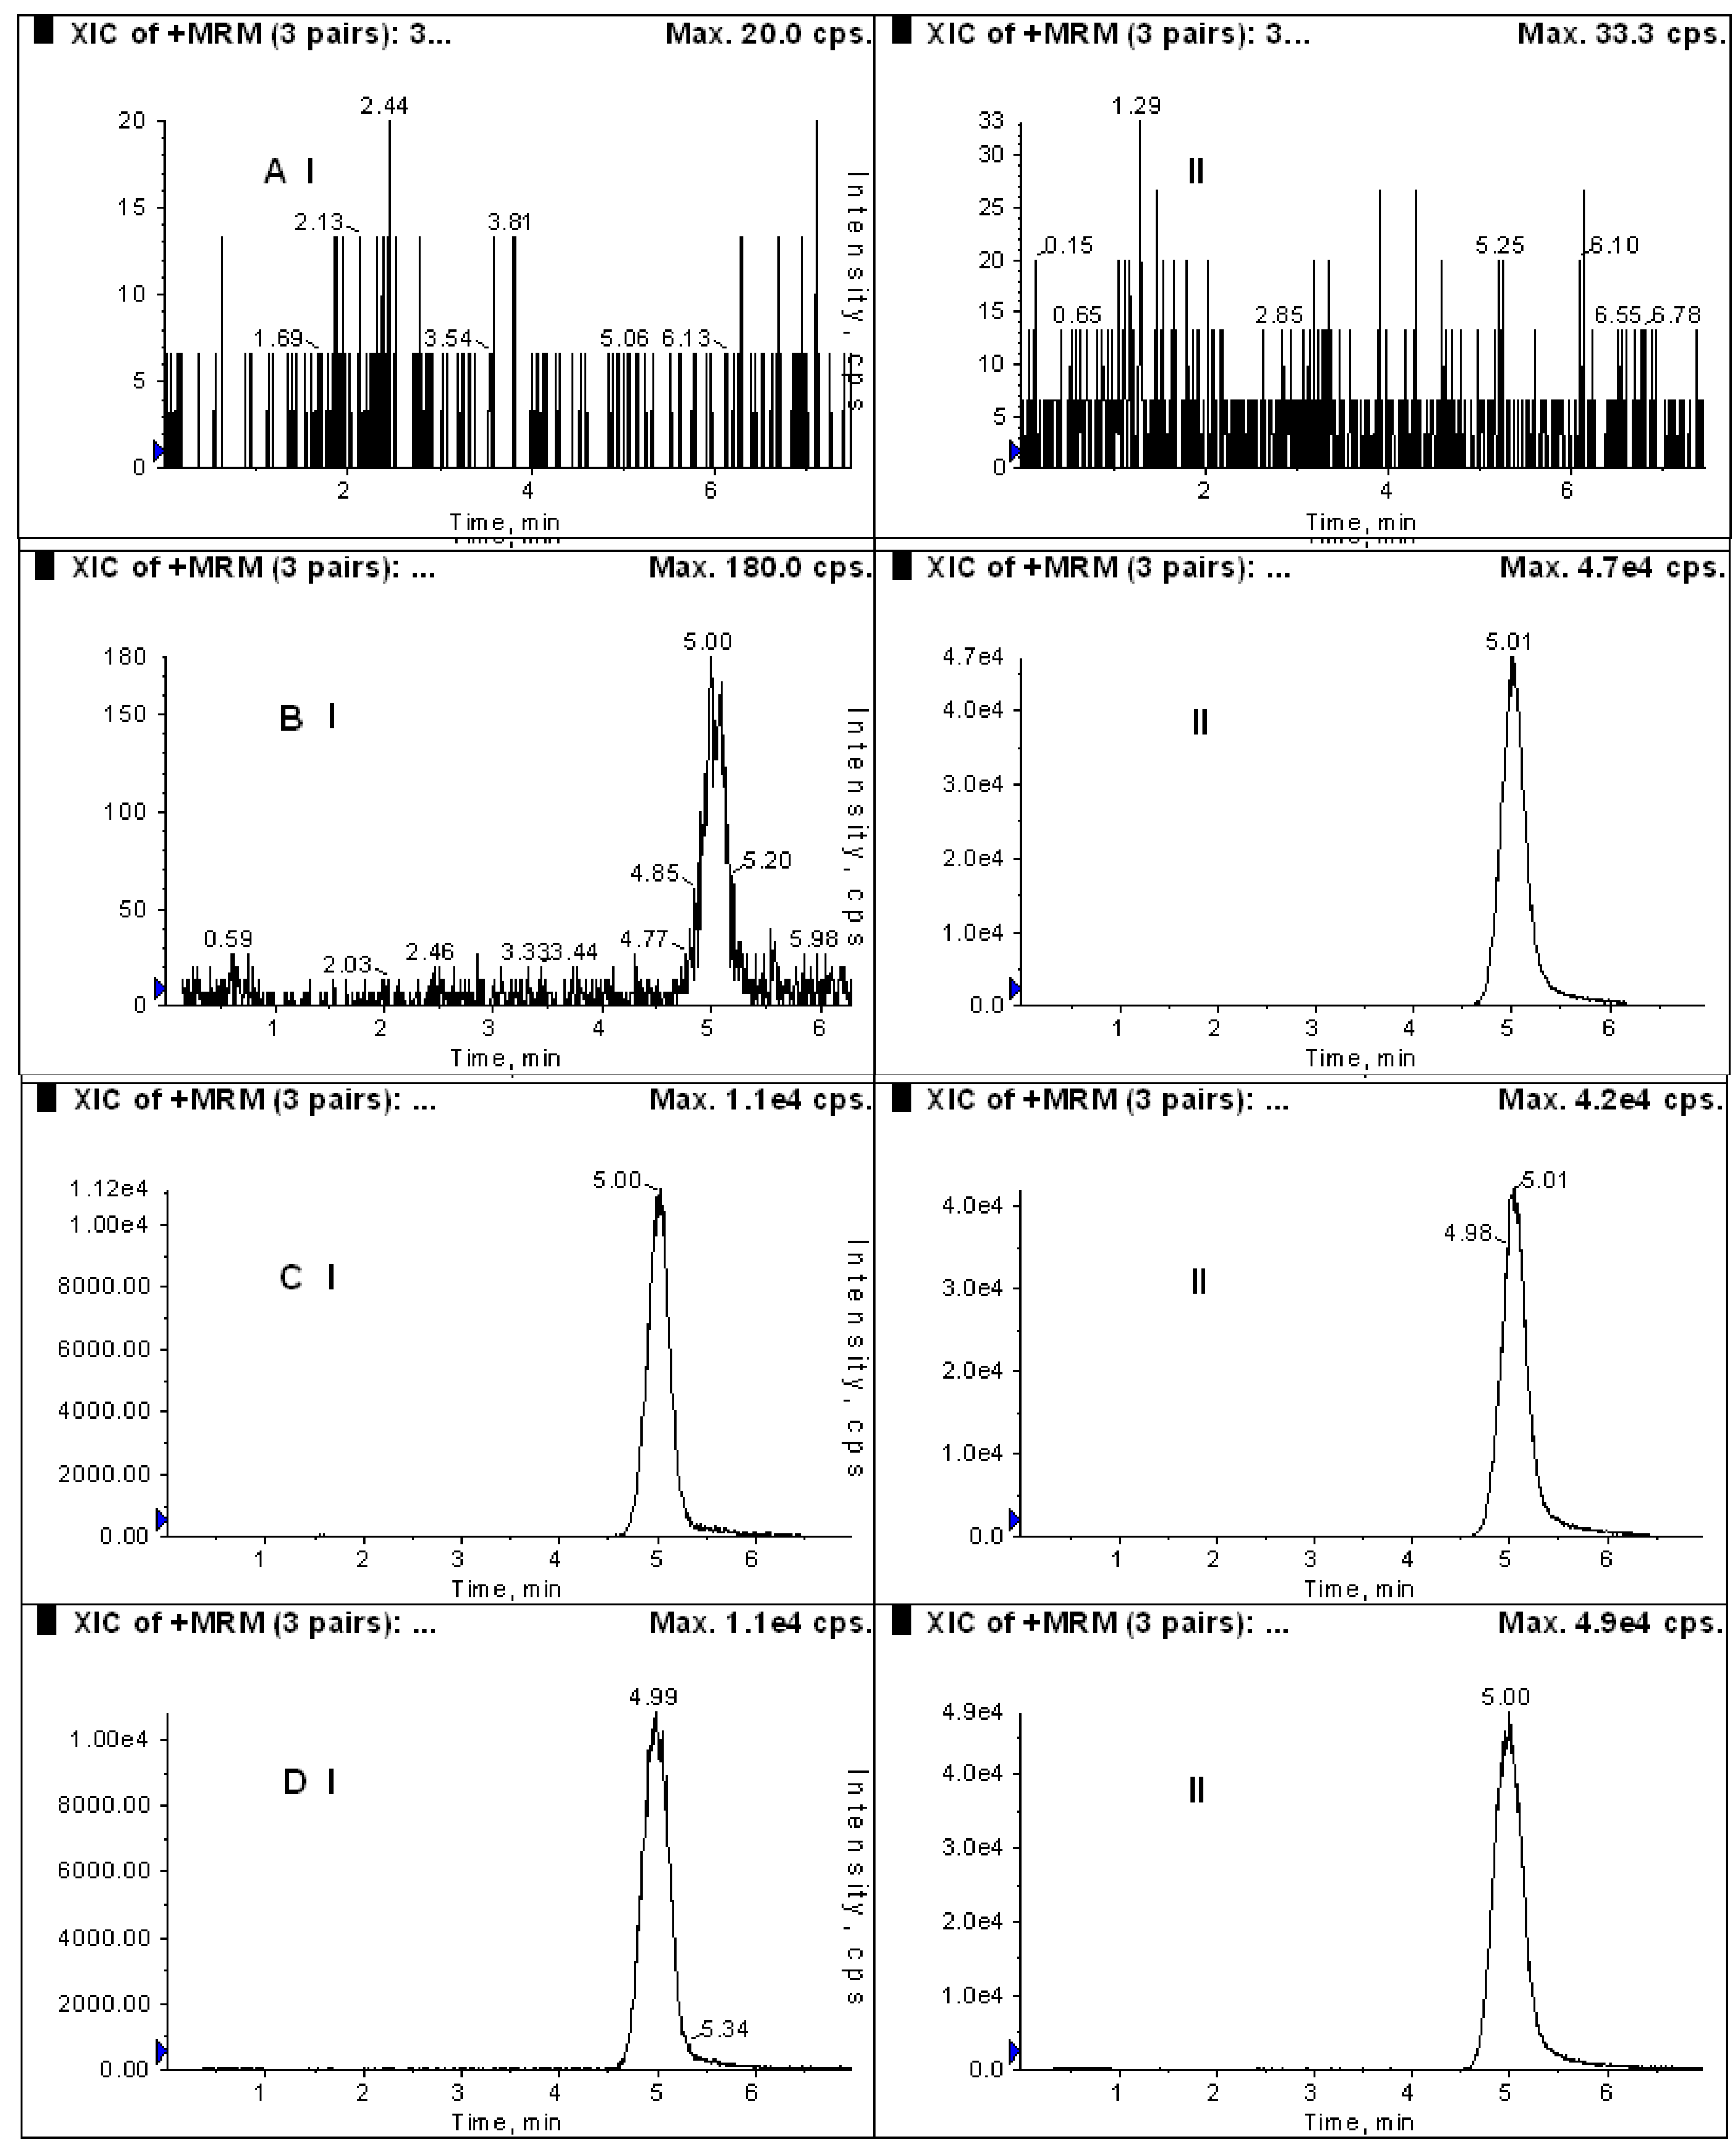
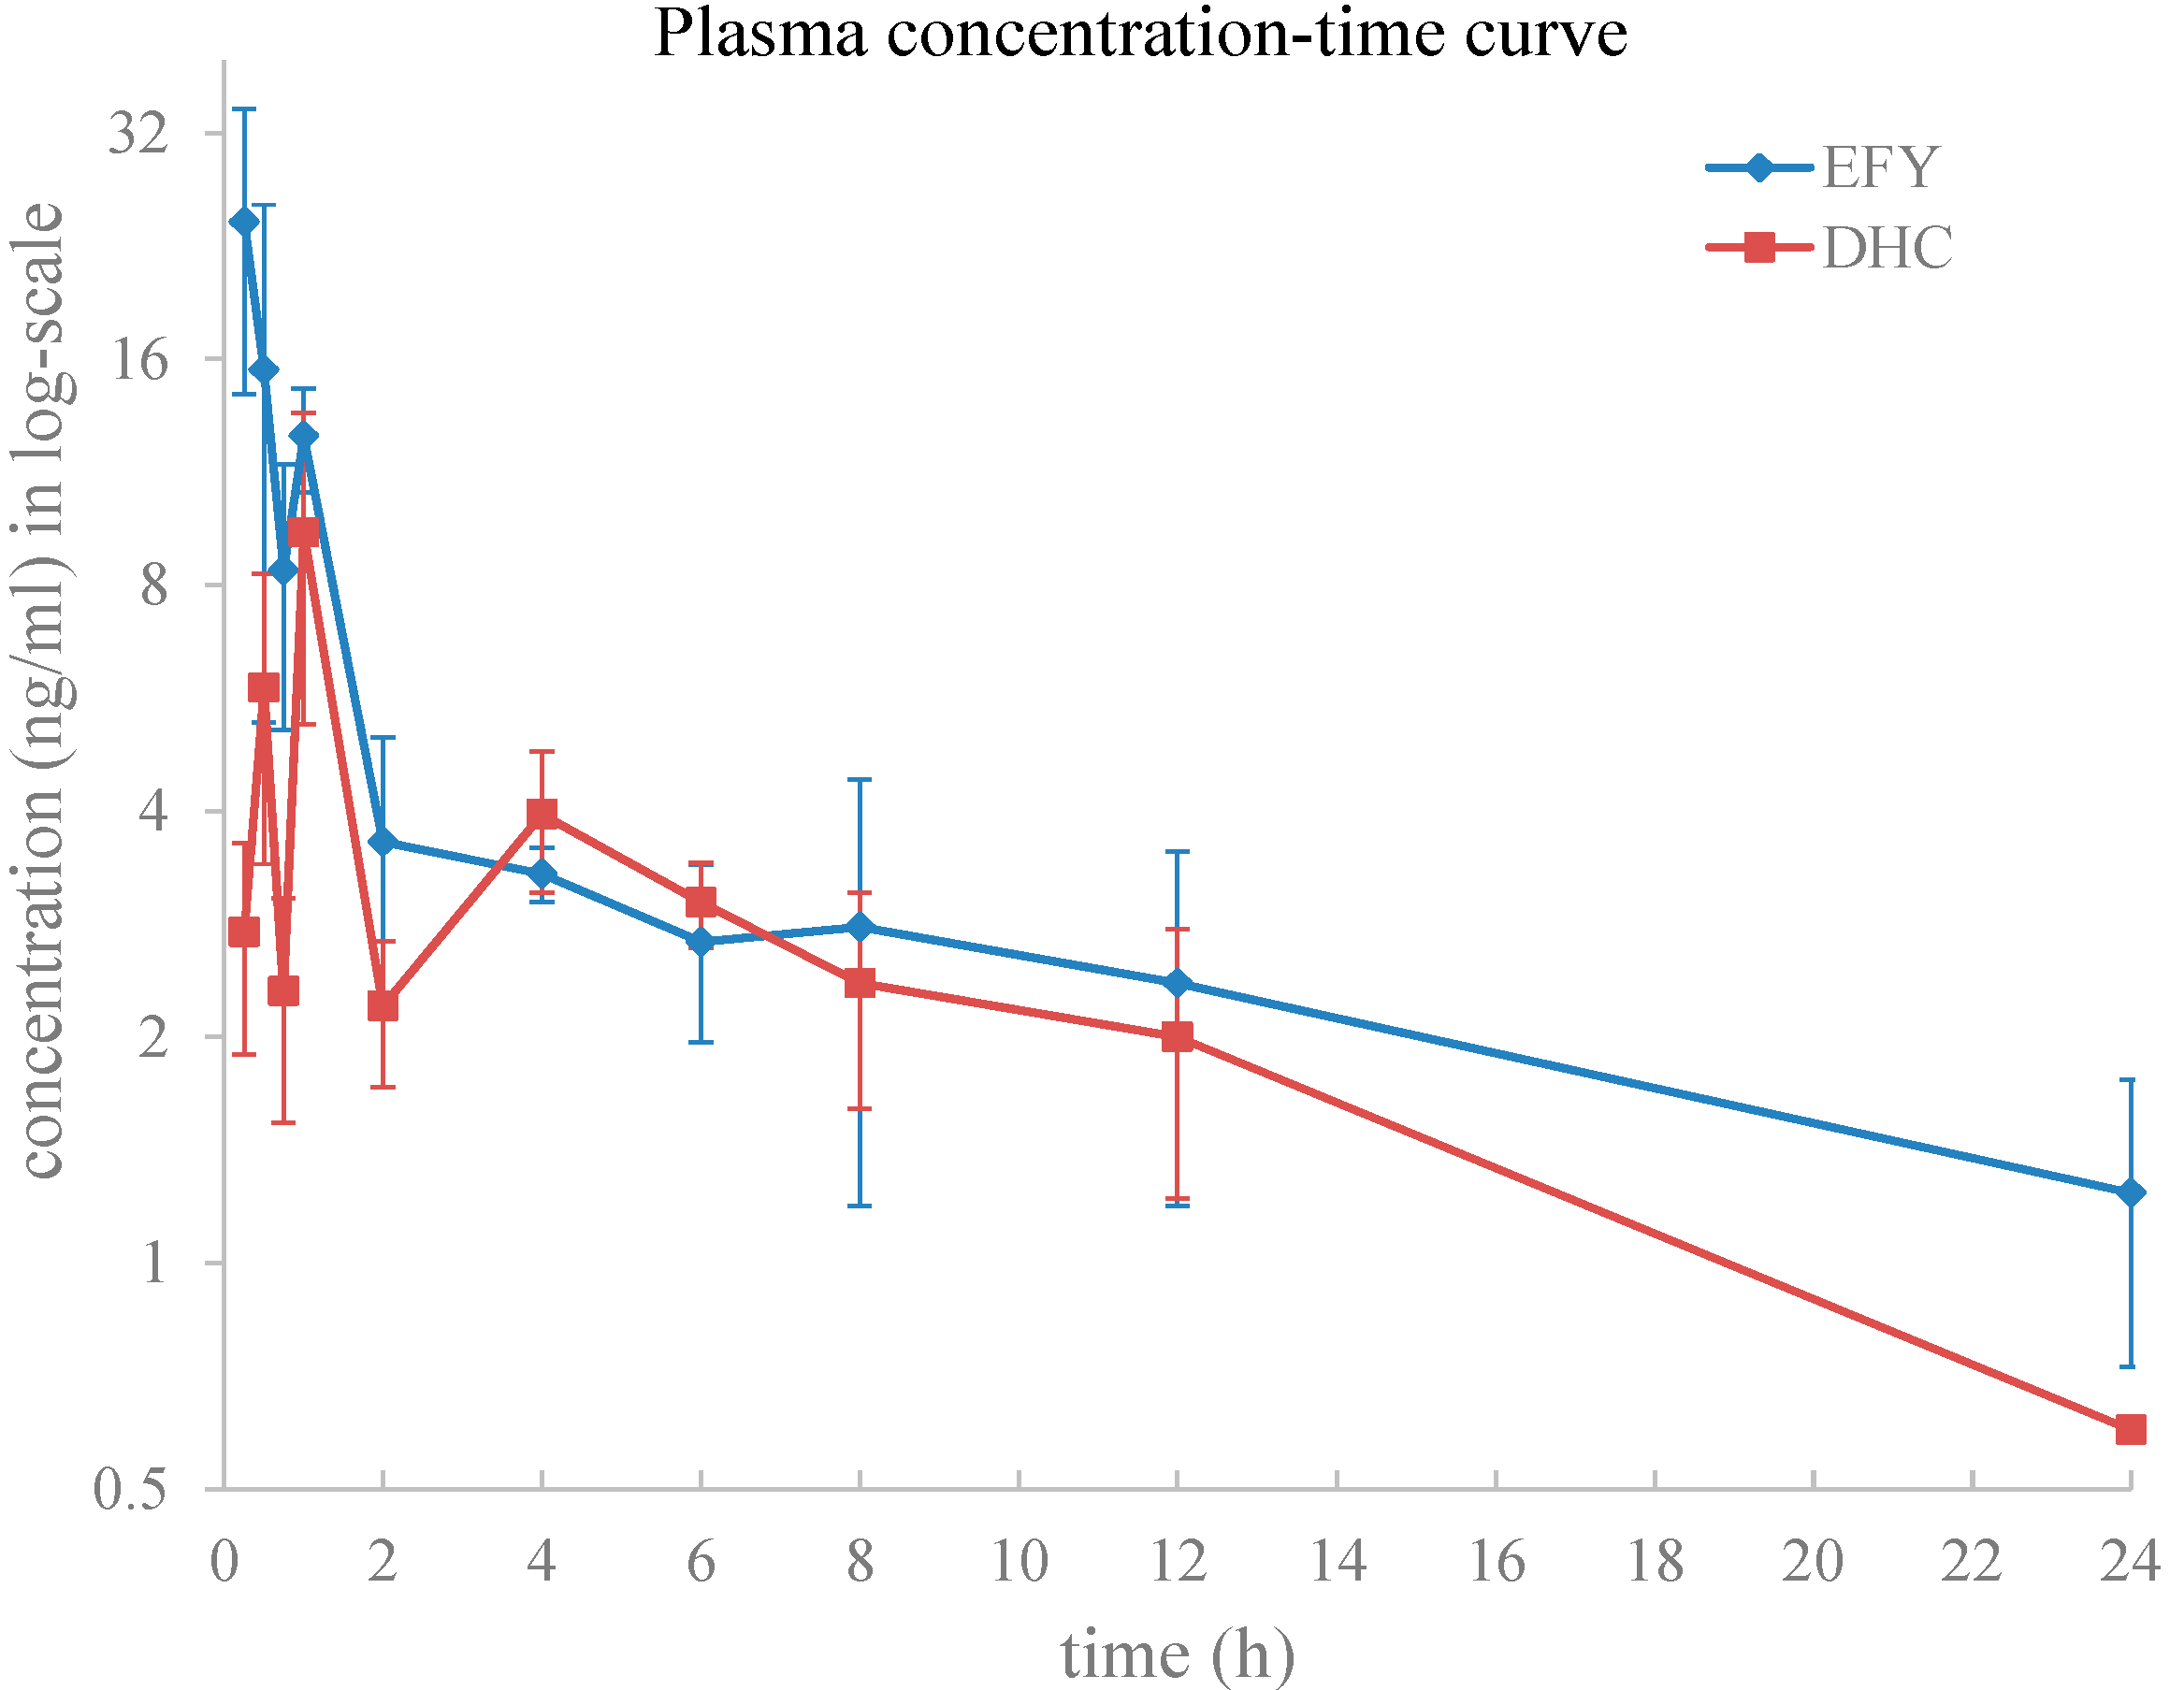
22]. In this paper, a highly sensitive liquid chromatography–tandem mass spectrometry (LC-MS/MS) method is developed for DHC determination. Comparing with the published reports, our method with isocratic elution in R.T. (retention time) is much better, the LLOQ is 0.625 ng/mL. With SPE, we got high recovery and less matrix effect. It is subsequently successfully applied to a pharmacokinetic study of DHC when given to rats in two different dosage forms: one, an effective fraction of
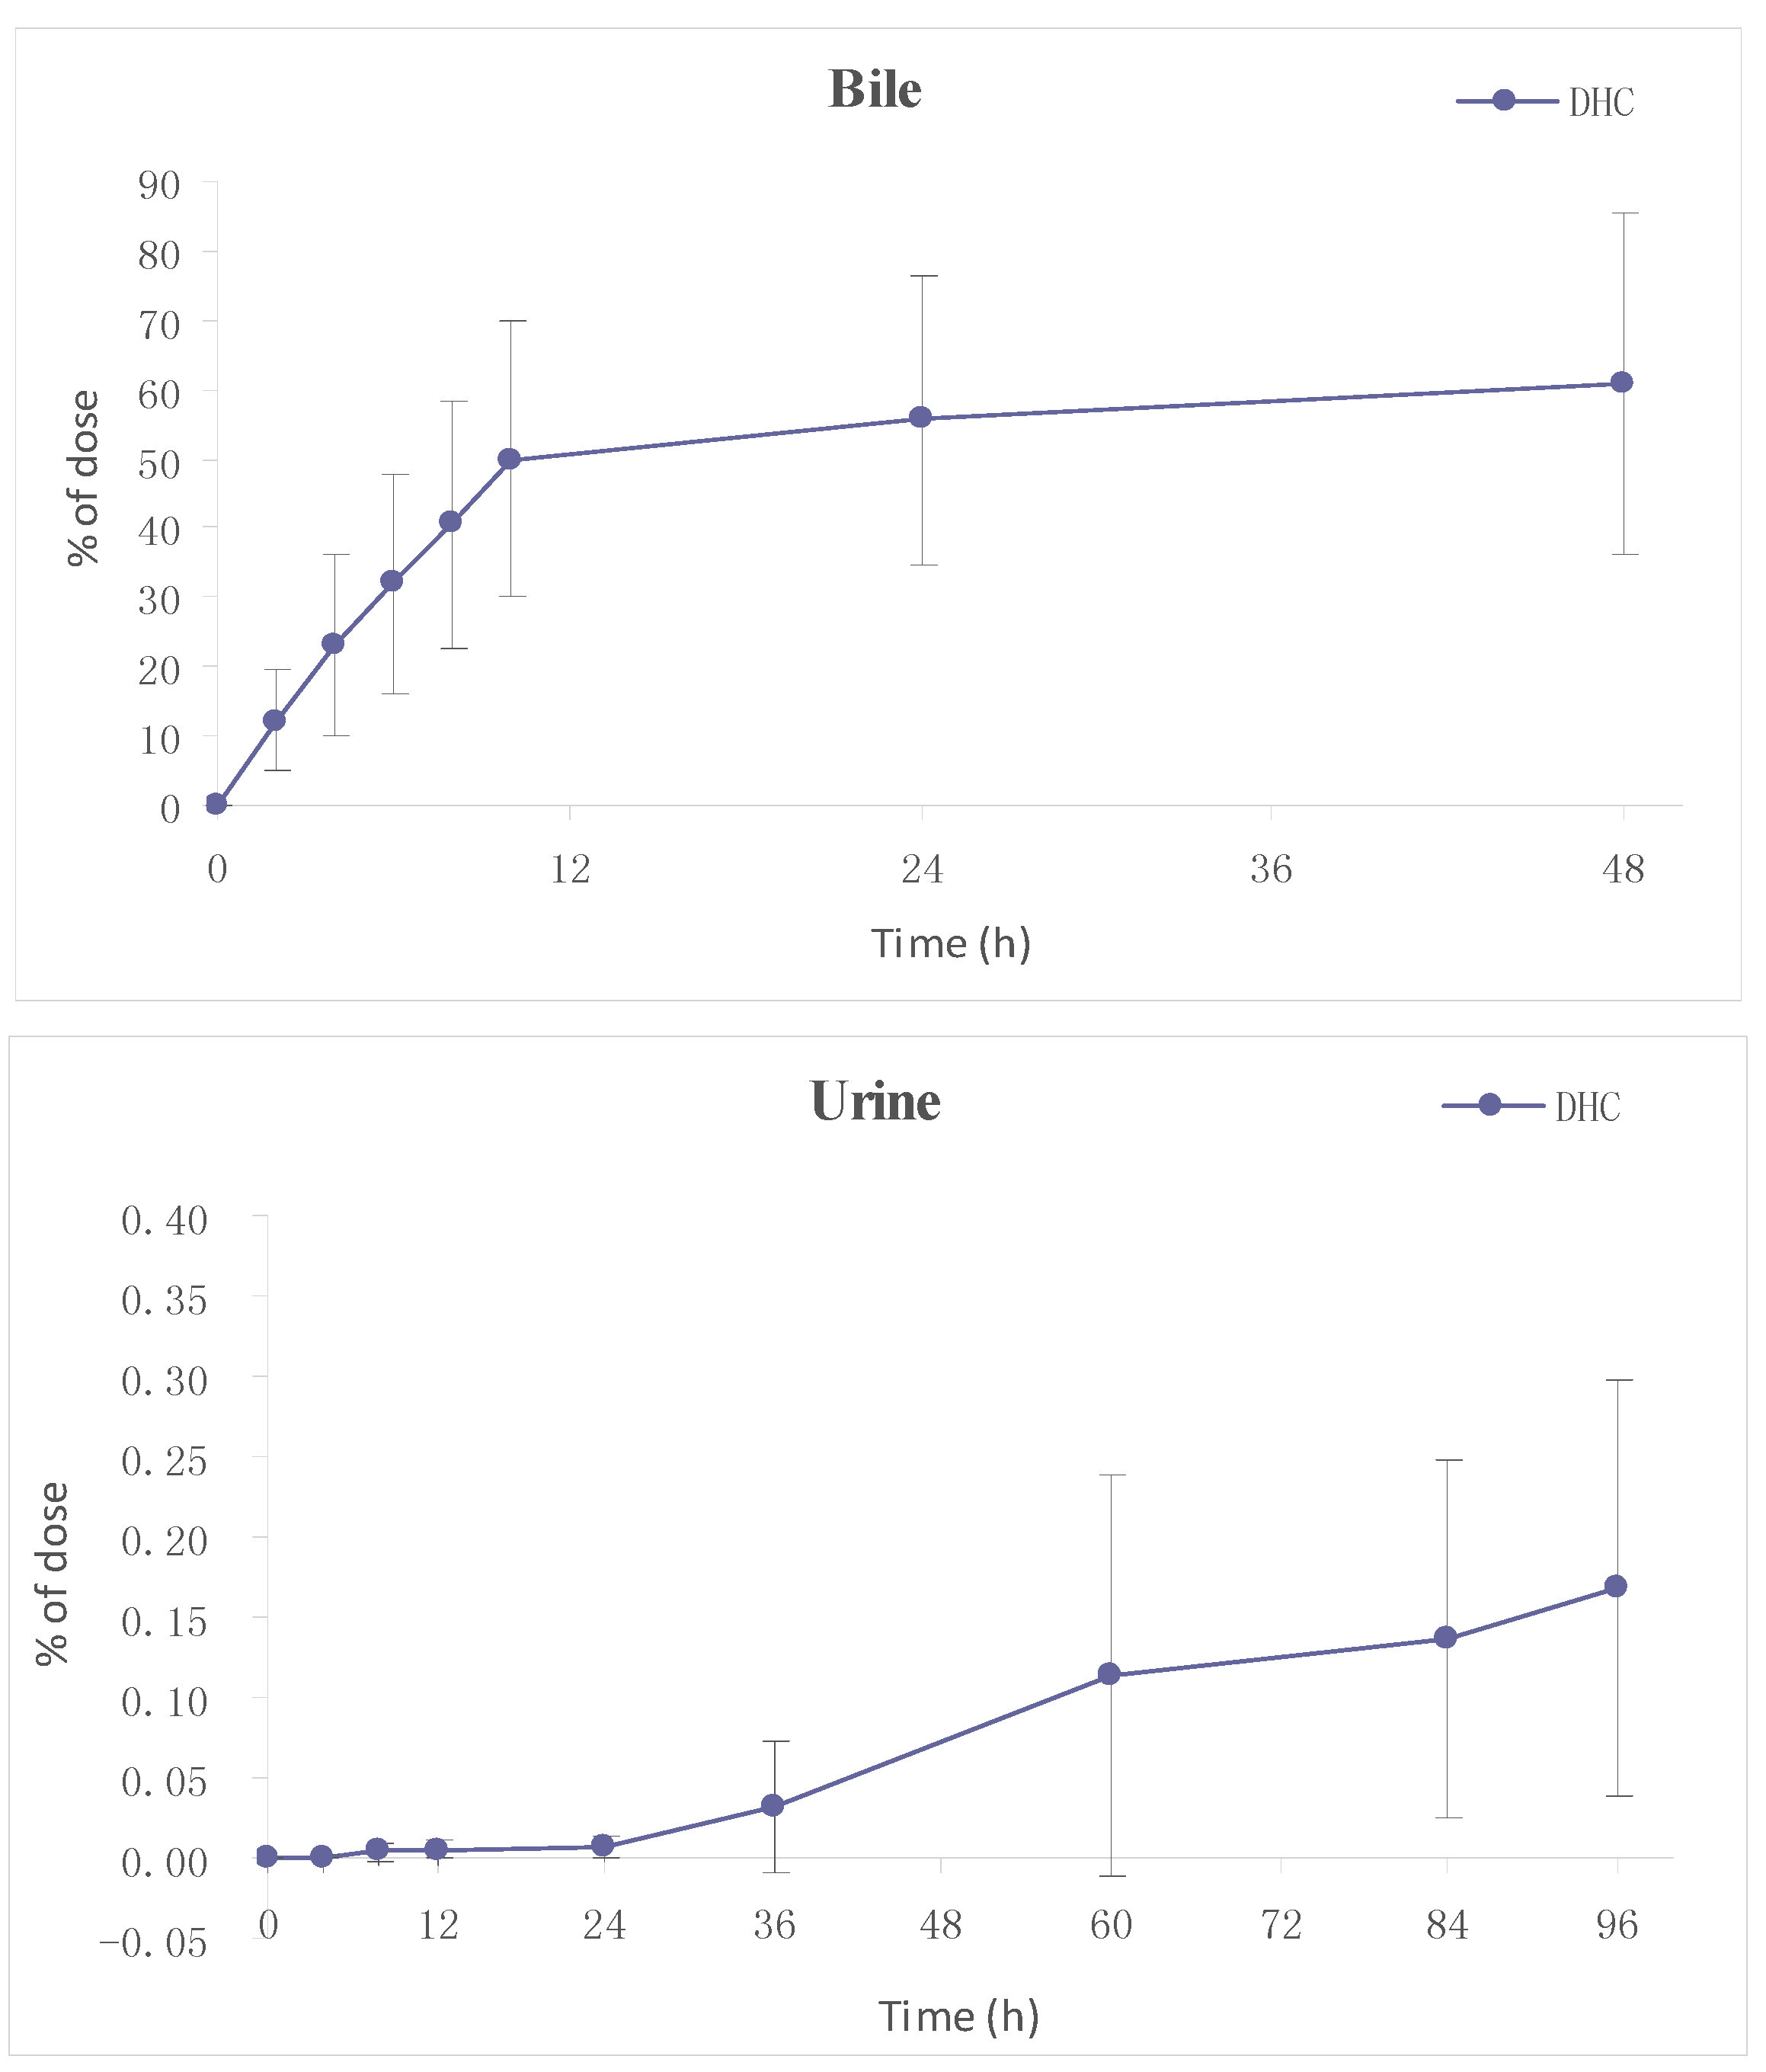
Corydalis yanhusuo, and the other, the pure compound. After oral administration, the results were analyzed to see if there were any synergies between the compounds in EFY and to further assess whether the influence of other compounds in EFY affected the pharmacokinetics and blood concentration of DHC. In addition, excretion of DHC in the bile and urine of the rats was investigated to clarify the pharmacokinetic properties of DHC.
3. Experimental Section
3.1. Chemicals and Reagents
The nitidine chloride used as internal standard (IS) was purchased from the National Institute for the Control of Pharmaceutical and Biological Products (Beijing, China). DHC was isolated from the dried tuber of Corydalis yanhusuo. Its purity was found to be 99.6% using HPLC with photodiode array detection. The effective fraction of Corydalis yanhusuo (containing DHC 20.2%) was prepared in our laboratory. The methanol and acetonitrile used were of HPLC grade and were obtained from Fisher Co. Ltd. (Emerson, IA, USA). The formic acid and other reagents used were of analytical grade and purchased from Beijing Chemical Reagent Company (Beijing, China). Milli-Q water (Milford, MA, USA) was used throughout the study.
3.2. Animals and Doses
Specific pathogen free male Sprague-Dawley rats (weight: 220 ± 20 g) were obtained from the Institute of Laboratory Animal Science, Chinese Academy of Medical Sciences, Beijing, China. They were kept for 7 days in a controlled environment (22–24 °C, 60% relative humidity) under a 12 h light-dark cycle with free access to a soy-free custom diet and tap water. All the rats were fasted for 12–16 h before the experiment. All animal procedures were performed in compliance with the guidelines approved by the Animal Ethnics Committee of the Chinese Academy of Medical Sciences.
For pharmacokinetics study, the rats were divided into two groups (n = 5 per group). Doses of 97.5 mg/kg of DHC or 483 mg/kg of EFY (equivalent to 97.5 mg/kg DHC, 20.19% DHC in EFY) were all gavage administrated. Blood samples (500 μL) were withdrawn from the oculi chorioideae vein into heparinized tubes before dosing and subsequently at 15, 30 and 45 min and then at 1, 2, 4, 6, 8, 12 and 24 h following initial administration. After 1 h and 8 h, 2 mL of normal saline was injected into the caudal vein to compensate for blood loss. After centrifuging at 4000 rpm for 10 min, plasma samples were obtained and frozen at −20 °C until analysis.
For biliary excretion study, four rats were light anesthetized by ether and a PE-10 cannula was implanted into the bile duct to collect bile. A single dose of DHC was administered as described above. Bile samples were collected at 0–2, 2−4, 4−6, 6−8, 8−10, 10−24 and 24−48 h post-dosing and kept at −20 °C after the volume of each collection was recorded.
For urinary excretion study, four rats were used. DHC was administered as described above. The animals were housed in stainless steel metabolic cages with free access to tap water. Urine was collected at 0–4, 4–8, 8–12, 12–24, 24–36, 36–60, 60–84 and 84–96 h post-dosing and kept at −20 °C after the volume of each collection was recorded.
3.3. Preparation of Calibration Standards and Quality Control Samples
Stock solutions of DHC and IS were both prepared in methanol at a final concentration of 1 mg/mL and stored at −80 °C. A series of working standard solutions of DHC ranging from 2.5 to 1000 ng/mL and an IS solution at 800 ng/mL were prepared by diluting their stock solutions with 10% acetonitrile (stored for less than one week at −20 °C for the assay). Calibration standards were prepared using blank rat plasma (200 μL) spiked with 50 μL of DHC working solutions, to yield solutions with concentrations of 0.625, 1.25, 2.5, 6.25, 25, 62.5, 125 and 250 ng/mL. Quality control (QC) samples were prepared in the same way as the calibration samples at 1.25, 25.0 and 250.0 ng/mL, representing low, medium, and high concentrations of DHC in the plasma, respectively. The linearity for DHC in bile and urine established separately to be within 1.25–500 ng/mL and 0.625–250 ng/mL range.
3.4. Sample Preparation
A 200 μL aliquot of plasma was vortex mixed for 3 min with 200 μL of water and 50 μL of IS (800 ng/mL). After centrifugation at 9000 rpm for 10 min, all the supernatant was loaded onto an Oasis HLB cartridge (Waters, Milford, MA, USA), which was pre-conditioned with 1 mL of methanol followed by 1 mL of deionized water. The loaded-cartridge was sequentially washed with 1 mL of water and 1 mL of 20% methanol. The analytes were then eluted with 1 mL of methanol in water containing 2% formic acid. The collected eluate was evaporated to dryness at 40 °C under a gentle stream of nitrogen. The residue was reconstituted in 150 μL of 10% acetonitrile, and 30 μL of the resulting sample was injected into the LC-MS/MS system for assay. Bile and urine samples were all processed in a similar manner as the plasma samples.
3.5. LC-MS/MS Condition
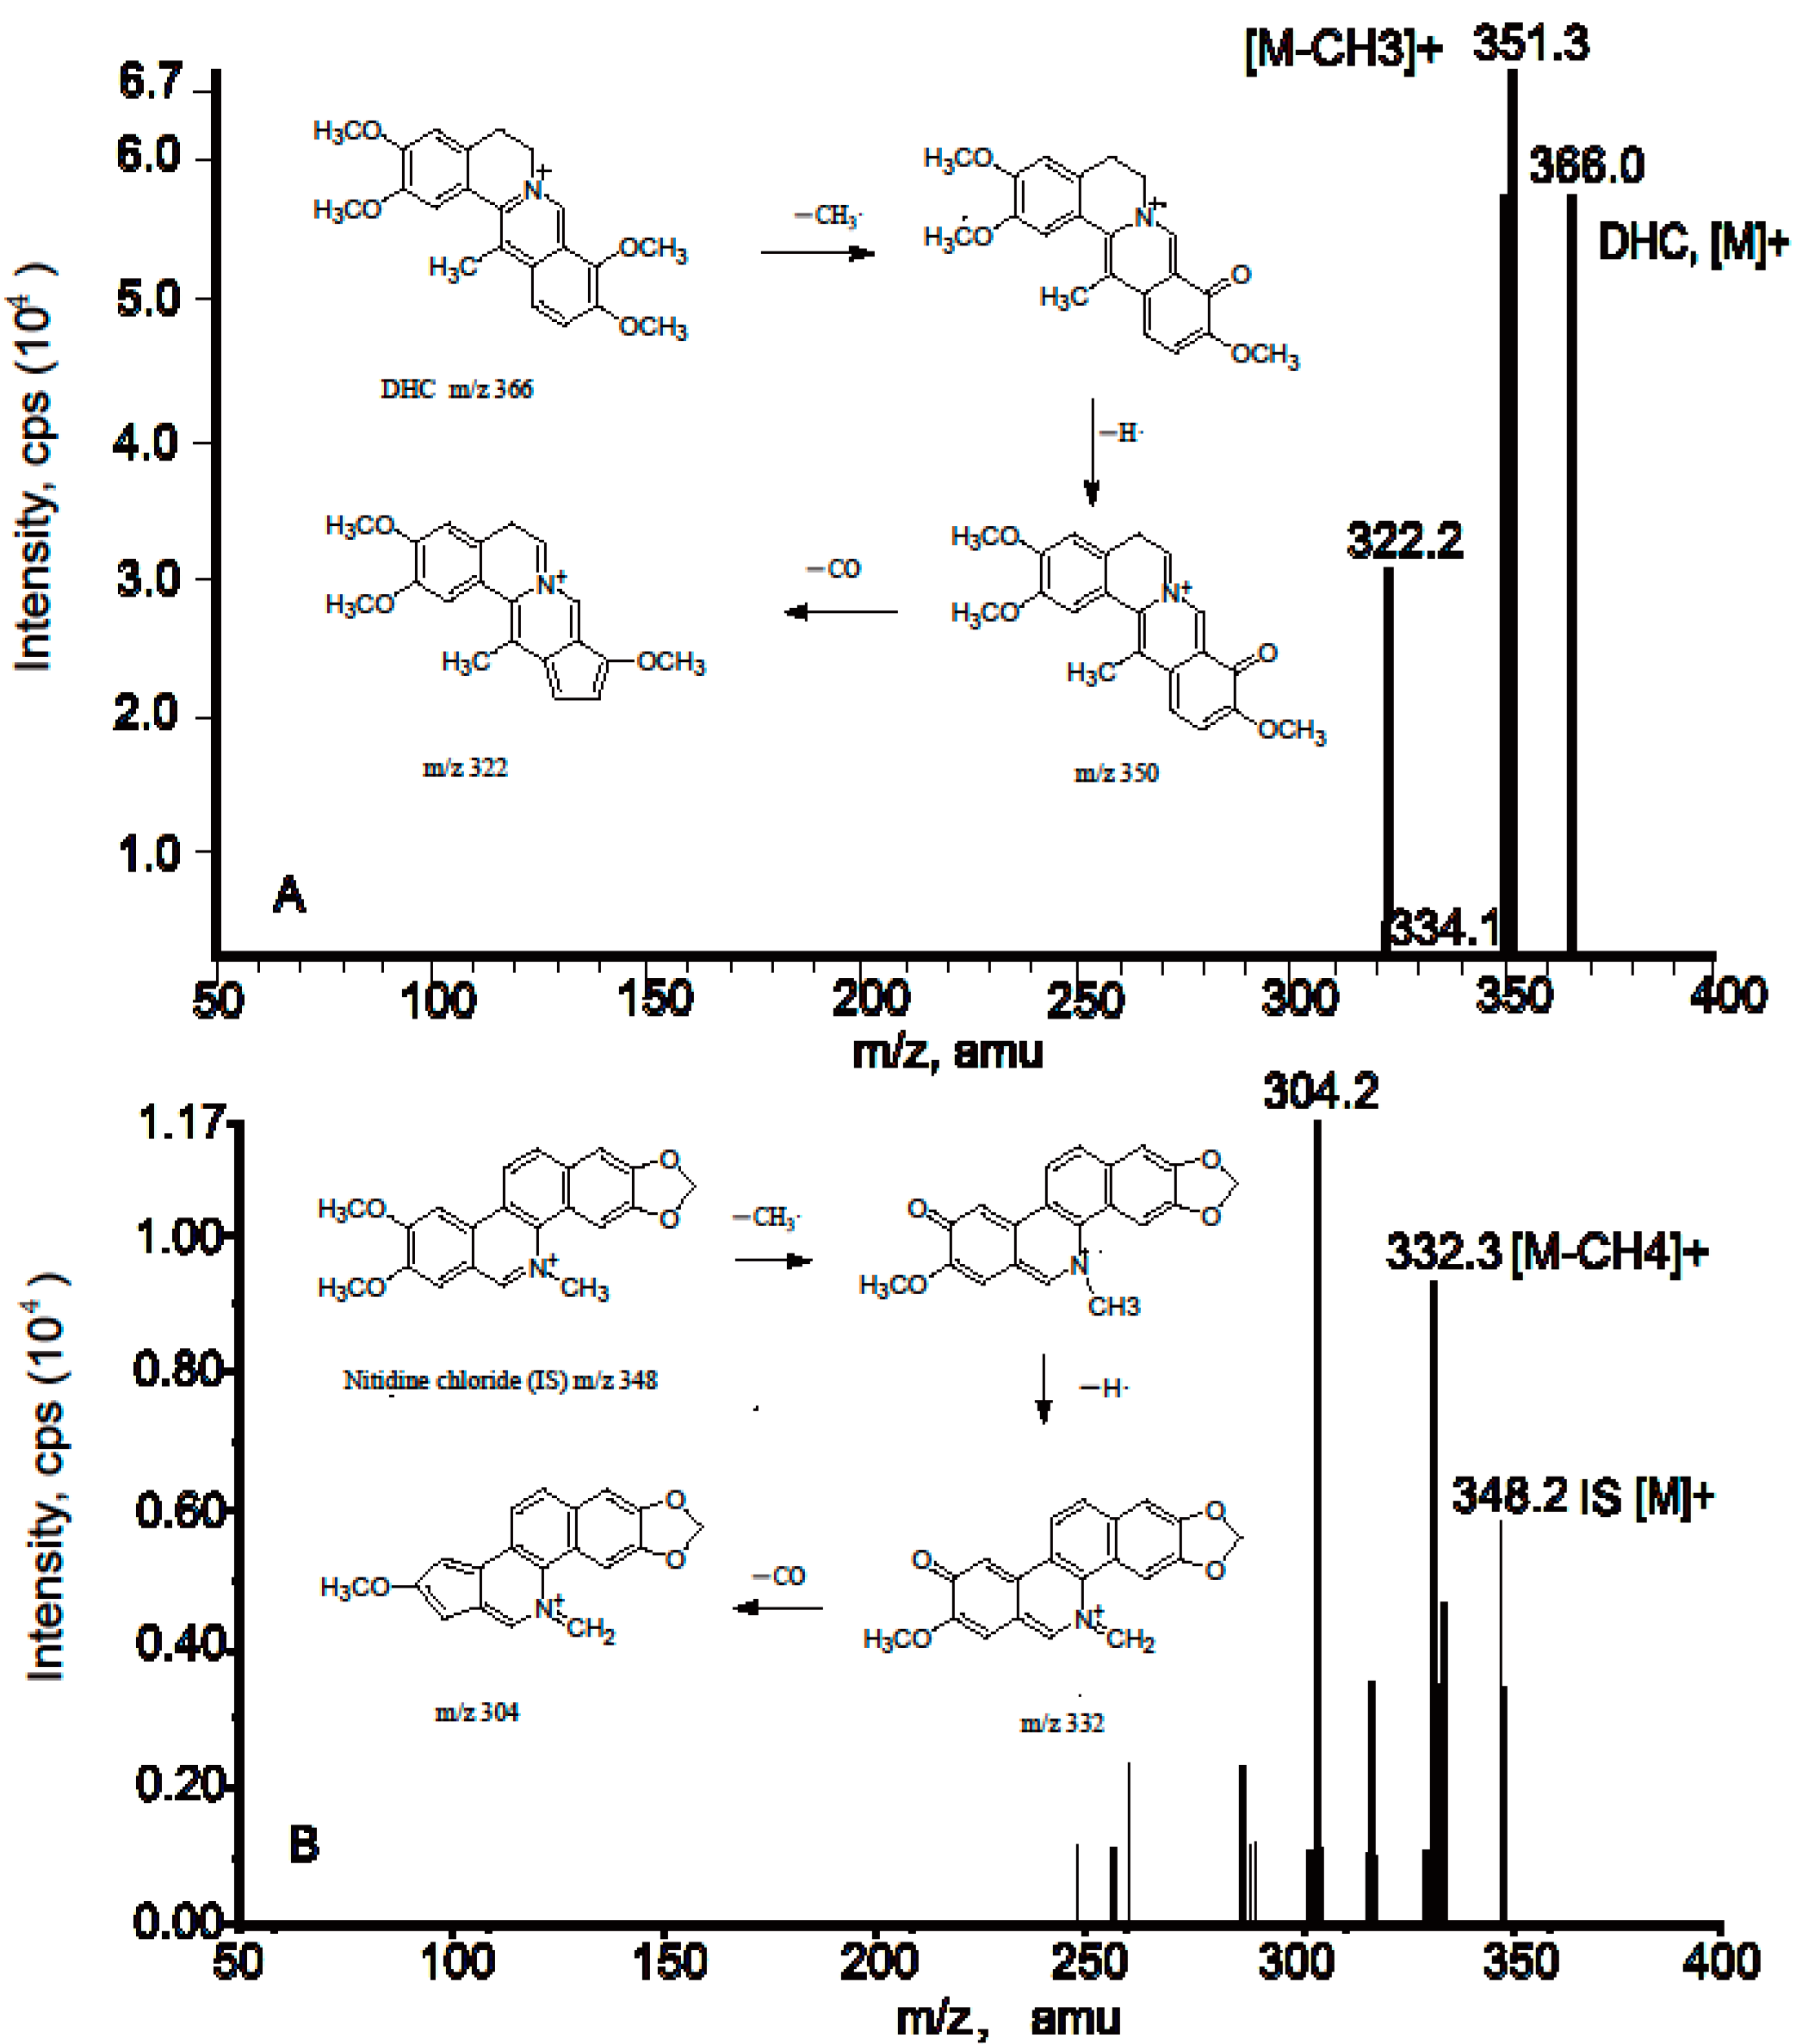
An Agilent 1100 system (Palo Alto, CA, USA) equipped with a vacuum degasser, a quaternary pump, and an auto-sampler were used. Chromatographic separation was achieved on an Atlantis T3 column (100 mm × 2.1 mm, 5 μm; Waters, Milford, MA, USA), which was eluted with a mobile phase of acetonitrile and water (containing 0.8% formic acid and 10 mM ammonium acetate) (28:72, v/v). The mobile phase was delivered at a flow-rate of 0.25 mL/min and 40% of the eluate was introduced into an API 3000 triple-quadrupole mass spectrometer (Applied Biosystems MDS SCIEX, Concord, ON, Canada) equipped with a TurboIonSpray electrospray ionization (ESI) source. Detection was performed using positive-ion electrospray ionization in multiple reaction monitoring (MRM) modes. The transitions from molecular ion to dominant product ion
m/z 366→351[M−CH
3] and
m/z 348→332[M−CH
3−H] [
26,
27,
28] were monitored for DHC and IS, respectively. The optimized working parameters for mass detection were as follows. The nebulizer, curtain, and collision-activated dissociation gases were set at 11, 7 and 11 (instrument units), respectively. The TurboIonSpray voltage and temperature were set at 4.5 kV and 400 °C, respectively. All data acquisition was performed using Analyst software (v1.4, AB MDS SCIEX).
3.6. Method Validation
3.6.1. Calibration Linearity and Low Quantification Limits
A calibration curve for DHC was constructed by plotting the DHC/IS peak-area ratios vs. concentration of DHC in the plasma. Linearity was determined using linear least-squares regression. The lower limit of quantification (LLOQ) of the assay was defined as the lowest concentration on the standard curve that can be quantified with accuracy within ±15% bias of the nominal concentration and precision not exceeding 15% CV for DHC.
3.6.2. Precision, Accuracy and Extraction Recovery
The precision (relative standard deviation) and accuracy (%) of the assay were determined from replicate analyses (n = 6). Three QC analyses were made on the same day (“intra-day”) and the others on 3 consecutive days (“inter-day”). The accuracy was calculated from the nominal concentration (
Cnom) and the mean value of the observed concentration (
Cobs) as follows:
The extraction recovery for DHC and IS was measured by comparing the peak areas of the extracted (pre-spiked) QC samples with those of the unextracted biological samples at an equivalent concentration. The recovery of DHC was determined at three levels (1.25, 25 and 250 ng/mL), while IS at a single concentration of 200 ng/mL. The results were expressed as mean ± standard deviation (SD).
3.6.3. Stability
The stability of DHC in rat plasma was evaluated under conditions that mimicked those likely to be encountered during sample storage and analytical processing. Six replicates of QC samples were analyzed for DHC. The QC samples were frozen and stored at −20 °C for a week. The concentration variation of the DHC in the prepared QC samples was detected after (i) three cycles of freezing and thawing, (ii) placement in an auto-sampler at 4 °C for 24 h, and (iii) storing at ambient temperature for 12 h.
3.6.4. Matrix Effects
Matrix effects (co-eluting undetected endogenous matrix compounds that may influence ionization of the DHC) were examined by comparing the DHC and IS peak-areas between two different sets of samples. In Set 1, standard DHC was dissolved in the reconstitution solvent and analyzed at DHC concentrations of 1.25, 25 and 250 ng/mL and an IS concentration of 200 ng/mL. These analyses were repeated six times at each concentration. In Set 2, blank plasma samples obtained from six rats were extracted and then spiked with the same concentration of DHC and IS dissolved in the reconstitution solvent. Deviation between the mean peak-areas of Set 2
vs. Set 1 indicates the possibility of ionization suppression or enhancement for DHC and IS. This is called an “absolute” matrix effect [
29].
3.7. Pharmacokinetic Study
Pharmacokinetic parameters were established from the plasma concentration–time data using non-compartmental analysis. The terminal elimination rate constant (
Ke) was determined by linear regression of the terminal portion of the plasma concentration-time data. The elimination half-life (
t1/2) was calculated using the expression:
The area under the curve (AUC) for the plasma concentration-time trace from zero to the last plasma drug concentration (AUC
0–t) was calculated using the trapezoidal rule. Extrapolation to infinite time (AUC
0–∞) was calculated using the expression:
where
Ct is the last measurable plasma concentration. The value of the maximal plasma concentration (
Cmax) and time to maximal concentration (
Tmax) were obtained directly from the plasma concentration-time curve.
The statistical significance of the pharmacokinetic parameters obtained from the two different forms (mixture/pure) was estimated using analysis of variance (ANOVA). SPSS 10.0 one-way ANOVA tests were used to compare the pharmacokinetic parameters from DHC and the mixture. A p value of less than 0.05 was considered to be significantly different. All results were expressed as arithmetic mean ± standard deviation.


