2.3. Validation of Quantitative Analytical Method
The HPLC method was validated by defining the limits of detection (LOD) and quantification (LOQ), linearity, inter-day and intra-day precisions, repeatability, stability, and recovery. The calibration curves were plotted on the basis of linear regression analysis of the integrated peak areas (
y)
versus concentrations (
x, mg/L) of the two analytes at five different levels. LOD and LOQ values for each analyte under the present chromatographic conditions were determined in terms of baseline noise, according to the IUPAC definition. LOD was determined as the analyte concentration yielding signal with a single-to-noise (S/N) ratio at 3:1, whereas the LOQ was defined as the analyte concentration yielding signal with S/N ratio at 10:1.The results of regression equations, correlation coefficients, linear ranges, LODs and LOQs for andrographolide and dehydroandrographolide are shown in
Table 1. The correlation coefficient (
R2) of the regression equation for each analyte indicates good linearity, being better than 0.999.
Intra- and inter-day variations were chosen to determine the precision of the developed method. For intra-day variability test, one of the mixed standard solutions (andrographolide, 125 μg/mL; dehydroandrographolide, 125 μg/mL) was analyzed five times within one day, while for inter-day variability, the mixed standard solution was examined in triplicate each day on three consecutive days. The RSDs for the peak areas were calculated as measurements of precisions. The RSDs of intra-day variation for andrographolide and dehydroandrographolide were less than 0.1%, and the RSDs of inter-day variation for the two analytes were less than 3.00%, as shown in
Table 2. Repeatability was evaluated by analyzing five different working solutions prepared from the same sample (AH-01). RSD values were 1.13% and 1.33% for andrographolide and dehydroandrographolide, respectively (
Table 2). Stability was determined using repeated analyses of the same sample solution at different times during storage at room temperature (approx. 25 °C) for 24 h. The RSD values of peak areas of andrographolide and dehydroandrographolide were 1.07% and 1.02%, respectively (
Table 2), indicating that the stability of the sample solution within one day was satisfactory. Recovery test was determined using spiked AH samples. A portion of 0.1000 g of AH sample was individually spiked with 0.1000 mg of andrographolide and 0.8000 mg of dehydroandrographolide, respectively. Five replicate samples were extracted and analyzed according to the procedures described above. As shown in
Table 3, the mean recovery (
n = 5) are 107.02% ± 1.52% and 98.86% ± 1.46%, respectively. These RSD values indicate that the proposed methodology is reproducible and suitable for the quantitative determination of andrographolide and dehydroandrographolide in AH samples.
2.6. Assignments of the Characteristic Peaks
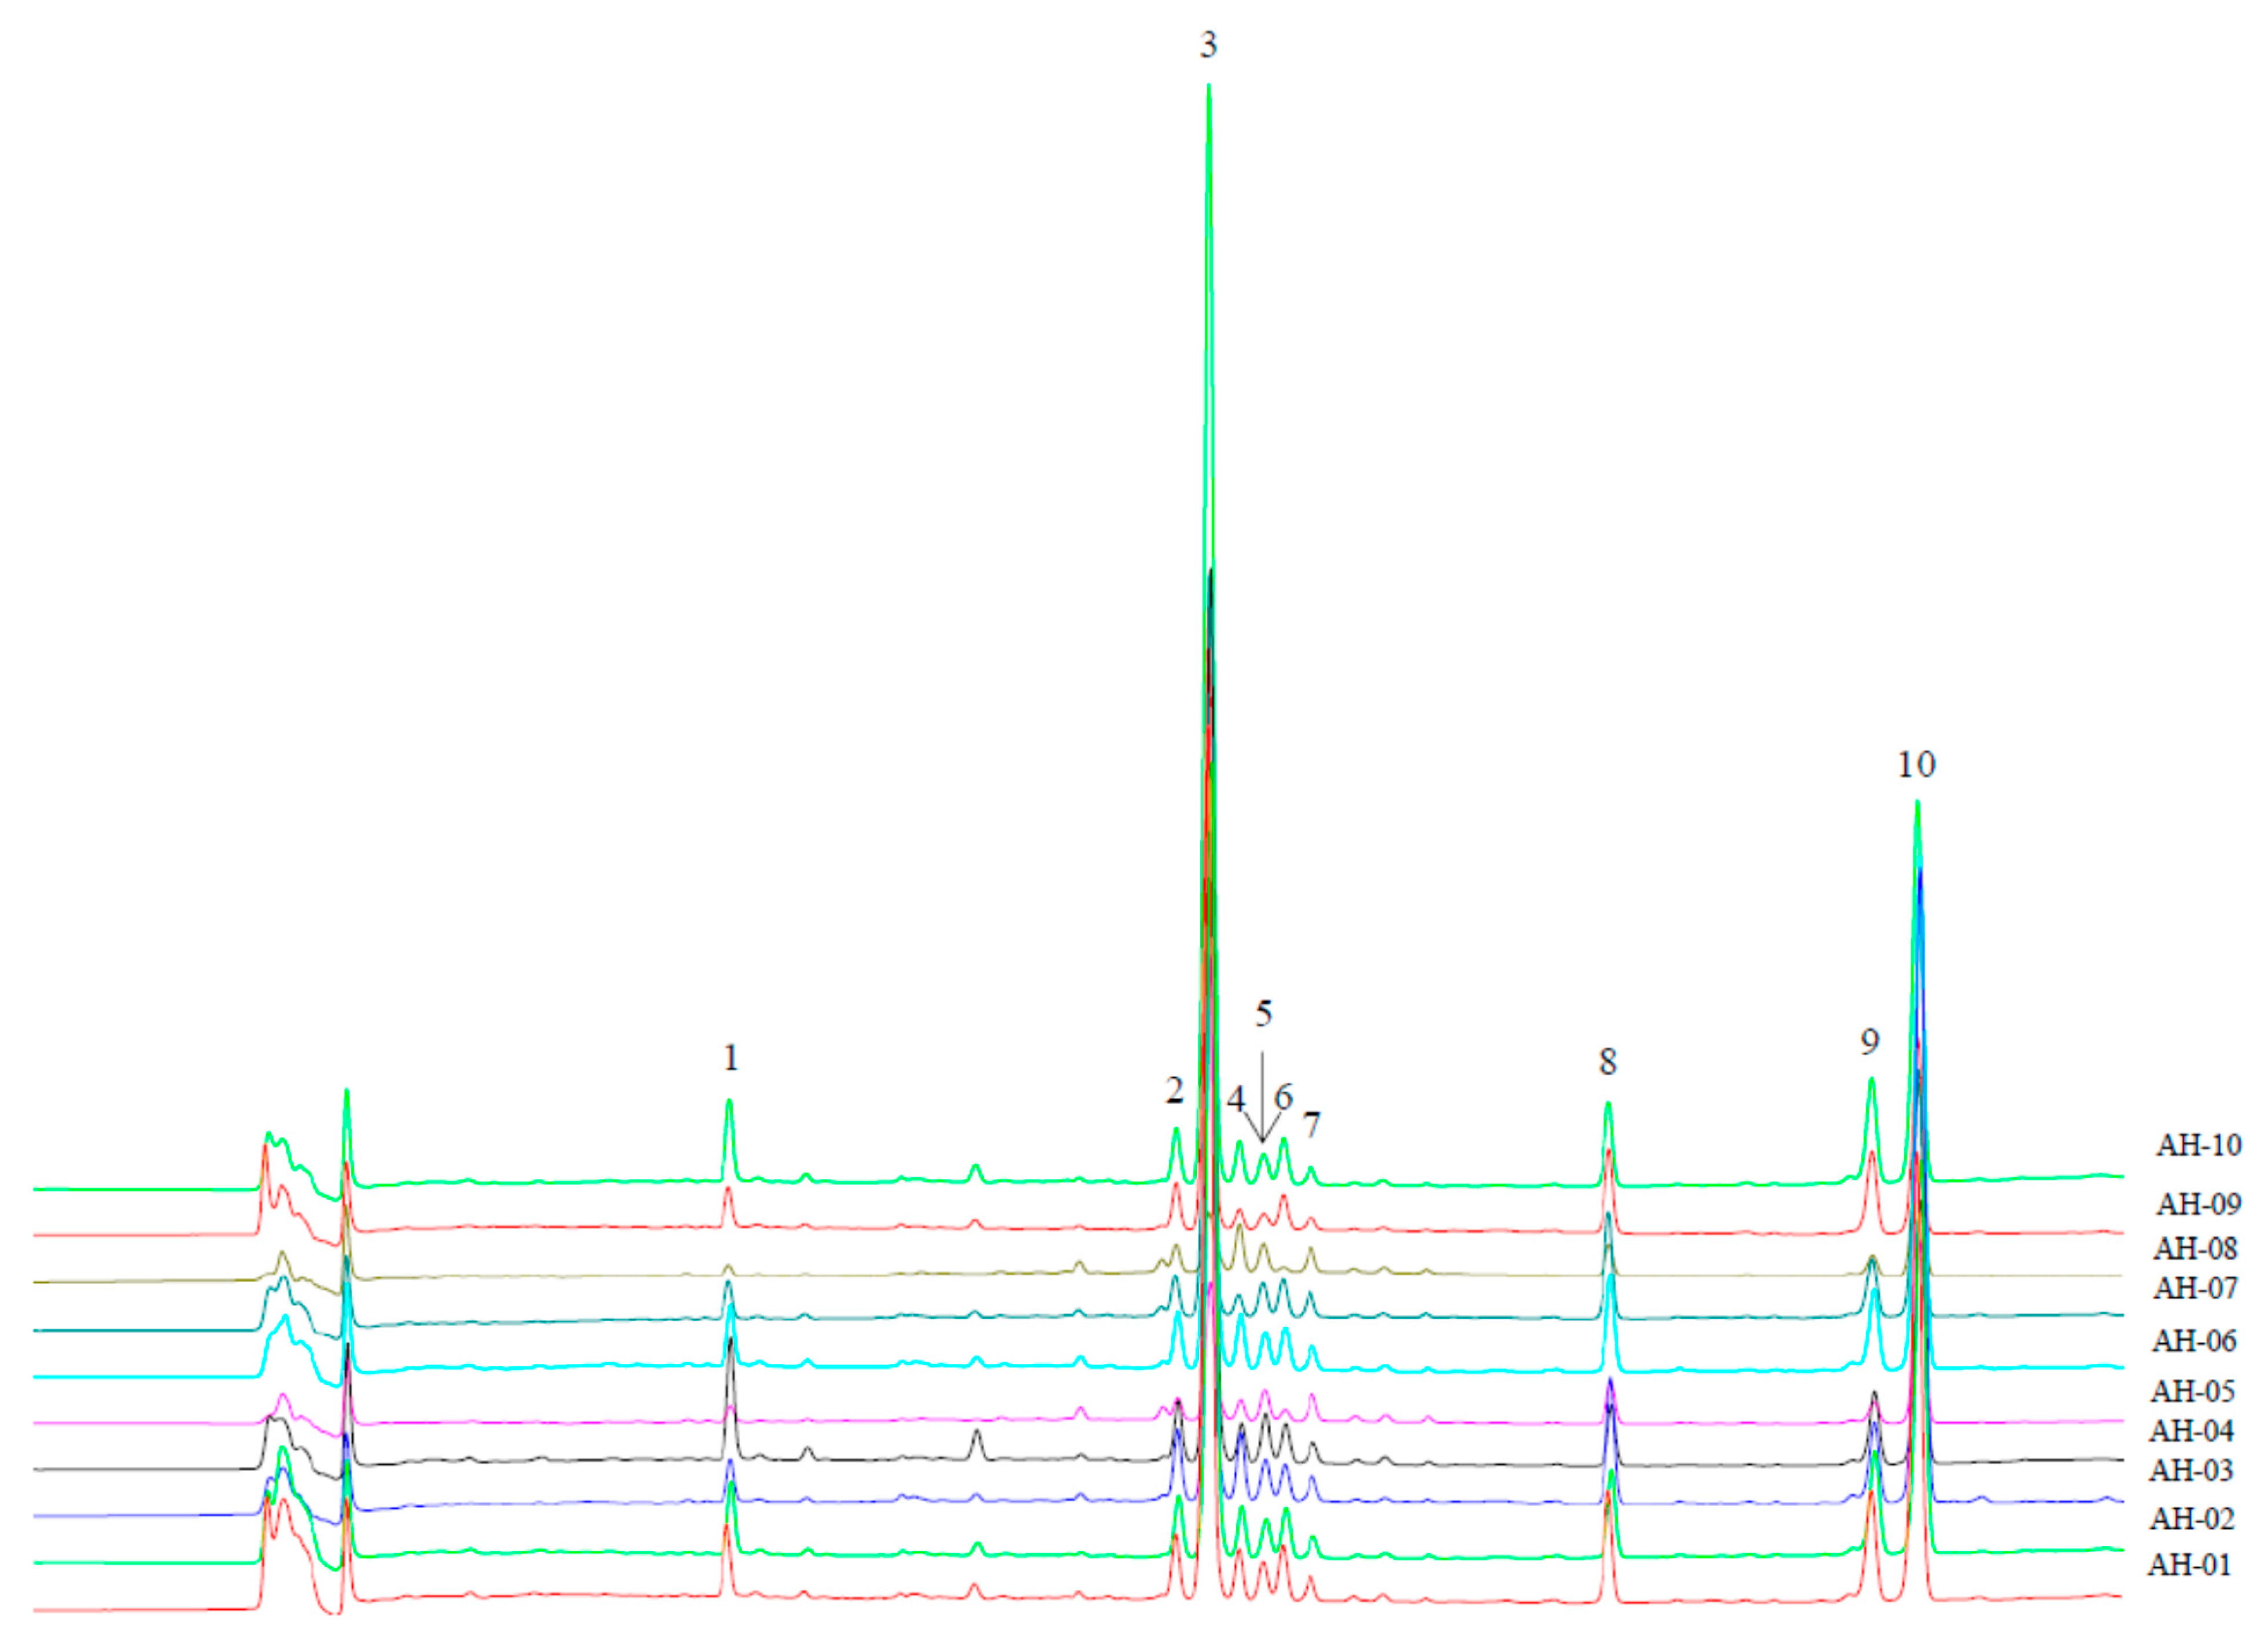
Figure 1 shows the ten characteristic peaks of all the tested samples detected at 225 nm. The structural identification of each peak was performed on the basis of MS and MS
2 experiments (
Table 5). Under the optimized MS conditions, both negative and positive ESI modes were used in our experiment.
Figure 1.
Overlapped chromatograms of AH samples detected at 225 nm.
Figure 1.
Overlapped chromatograms of AH samples detected at 225 nm.
Peak 1 occurs at a retention time of 7.4 min with maximal UV absorption at 225 nm. In negative ion mode, a deprotonated molecular ion at m/z 511 [M−H]−, a formic acid adduct ion at m/z 557 [M−H+HCOOH]− as well as an ion at m/z 493 [M−H−H2O]− were found in its MS spectrum. Fragmentation of the ion at m/z 511 [M−H]− yielded a predominant product ion at m/z 331 arising from the loss of a unit with a molecular weight of 180 amu. In positive ion mode, the protonated molecular ion of the compound did not appear, but its potassium adduct ion at m/z 551 [M+K]+ was found in its MS spectrum. Unfortunately, this peak was not identified despite our efforts.
Peak 2 shows a retention time of 12.0 min with maximal UV absorption at 200 nm. This peak gave a [M−H]− ion at m/z 495, a [M−H+HCOOH]− ion at m/z 541 and a [2M−H]− ion at m/z 991, respectively. The ion at m/z 495 generated a predominant fragment ion in its MS2 spectrum at m/z 333 [M−H−glucosyl]−. In positive ion mode, peak 2 produced a very weak [M+H]+ ion but yielded prominent ions at m/z 519 [M+Na]+ and 535 [M+K]+. Consequently, it was characterized as a glucosyldeoxyandrographolide.
Table 1.
The results of LODs, LOQs, regression equations, correlation coefficients and linearity ranges of andrographolide and dehydroandrographolide.
Table 1.
The results of LODs, LOQs, regression equations, correlation coefficients and linearity ranges of andrographolide and dehydroandrographolide.
| Analyte | Regression Equation | Correlation Coefficient | Linearity Range (μg/mL) | LOD (μg/mL) | LOQ (μg/mL) |
|---|
| Andrographolide | y = 20427x − 4906.5 | 0.9999 | 3.91–250 | 0.06 | 0.21 |
| Dehydroandrographolide | y = 15967x − 11707 | 0.9999 | 15.62–250 | 0.12 | 0.49 |
Table 2.
Results of precision, repeatability and stability tests.
Table 2.
Results of precision, repeatability and stability tests.
| Analyte | Precision (RSD, %) | Repeatability (RSD, %) | Stability (RSD, %) |
|---|
| Intra-day (n = 5) | Inter-day (n = 5) |
|---|
| Andrographolide | 0.08 | 2.28 | 1.13 | 1.07 |
| Dehydroandrographolide | 0.07 | 2.69 | 1.33 | 1.02 |
Table 3.
Accuracy of HPLC-UV method for determination of andrographolide and dehydroandrographolide.
Table 3.
Accuracy of HPLC-UV method for determination of andrographolide and dehydroandrographolide.
| Analyte | Sample Weight (g) | Original (mg) | Spiked (mg) | Found (mg) | Recovery (%) | Mean Recovery (%) | RSD (%) |
|---|
| Andrographolide | 0.1002 | 1.1373 | 1.0000 | 2.2264 | 108.92 | 107.02 | 1.52 |
| 0.1015 | 1.1520 | 1.0000 | 2.2198 | 106.78 |
| 0.1019 | 1.1566 | 1.0000 | 2.2368 | 108.02 |
| 0.1023 | 1.1611 | 1.0000 | 2.2070 | 104.59 |
| 0.1034 | 1.1736 | 1.0000 | 2.2417 | 106.81 |
| Dehydroandrographolide | 0.1002 | 0.8427 | 0.8000 | 1.6436 | 100.11 | 98.86 | 1.46 |
| 0.1015 | 0.8536 | 0.8000 | 1.6423 | 98.58 |
| 0.1019 | 0.8570 | 0.8000 | 1.6616 | 100.57 |
| 0.1023 | 0.8603 | 0.8000 | 1.6409 | 97.57 |
| 0.1034 | 0.8696 | 0.8000 | 1.6491 | 97.44 |
Table 4.
Contents of andrographolode and dehydroandrographolide in AH samples and similarity values of each sample compared to the reference fingerprint generated.
Table 4.
Contents of andrographolode and dehydroandrographolide in AH samples and similarity values of each sample compared to the reference fingerprint generated.
| Sample No. | Content a (%) | Similarity |
|---|
| Correlation Coefficient | Angle Cosin |
|---|
| Andrographolide | Dehydroandrographolide | Total | Mean Value b | Median Value c | Mean Value | Median Value |
|---|
| AH-01 | 1.2504 | 0.9214 | 2.1718 | 0.9953 | 0.9963 | 0.9964 | 0.9972 |
| AH-02 | 1.1316 | 0.8053 | 1.9368 | 0.9937 | 0.9948 | 0.9952 | 0.9961 |
| AH-03 | 0.8043 | 1.3472 | 2.1515 | 0.9422 | 0.9382 | 0.9590 | 0.9558 |
| AH-04 | 1.2835 | 0.5493 | 1.8328 | 0.9601 | 0.9623 | 0.9688 | 0.9706 |
| AH-05 | 0.2235 | 0.3991 | 0.6226 | 0.9177 | 0.9127 | 0.9412 | 0.9371 |
| AH-06 | 1.1932 | 1.1167 | 2.3100 | 0.9998 | 0.9995 | 0.9998 | 0.9996 |
| AH-07 | 0.7361 | 0.5217 | 1.2578 | 0.9916 | 0.9930 | 0.9939 | 0.9950 |
| AH-08 | 0.1122 | 0.4195 | 0.5317 | 0.6526 | 0.6435 | 0.7605 | 0.7530 |
| AH-09 | 0.9147 | 0.4269 | 1.3415 | 0.9669 | 0.9702 | 0.9739 | 0.9765 |
| AH-10 | 1.5926 | 0.8157 | 2.4083 | 0.9759 | 0.9783 | 0.9794 | 0.9815 |
Table 5.
Assignment of the characteristic peaks in AH samples.
Table 5.
Assignment of the characteristic peaks in AH samples.
| No. | RT (min) | UV (nm) | MS in Neg. Mode | MS2 in Neg. Mode | MS in Pos. Mode | MS2 in Pos. Mode | Assignment | References |
|---|
| 1 | 7.4 | 225 | 511 [M−H]− | 331 | 551 [M+K]+ | | | |
| 493 [M−H−H2O]− | | | |
| 557 [M−H+HCOOH]− | | | |
| 2 | 12.0 | 200 | 495 [M−H]− | 333 [M−H−glucosyl]− | 519 [M+Na]+ | | Glucosyl-deoxyandrographolide | |
| 541 [M−H+HCOOH]− | | 535 [M+K]+ | |
| 991 [2M−H]− | | | |
| 3 | 12.4 | 225 | 349 [M−H]− | 331 [M−H−H2O]− | 297 [M+H−3H2O]+ | | Andrographolide | [16,17,18,19,20,25] |
| 331 [M−H−H2O]− | | 315 [M+H−2H2O]+ | |
| 395 [M−H+HCOOH]− | | 333 [M+H−H2O]+ | |
| 4 | 12.7 | 251 | 495 [M−H]− | 333 [M−H−glucosyl]− | 519 [M+Na]+ | | Glucosyl-deoxyandrographolide | |
| 541 [M−H+HCOOH]− | | 535 [M+K]+ | |
| 5 | 12.9 | 287 | 495 [M−H]− | 333 [M−H−glucosyl]− | 519 [M+Na]+ | | Glucosyl-deoxyandrographolide | |
| 541 [M−H+HCOOH]− | | 535 [M+K]+ | |
| 6 | 13.1 | 227 | 349 [M−H]− | 331 [M−H−H2O]− | 315 [M+H−2H2O]+ | | Isoandrographolide | [17,25] |
| 331 [M−H−H2O]− | | | |
| 395 [M−H+HCOOH]− | | | |
| 7 | 13.4 | 264 | 347 [M−H]− | | 349 [M+H]+ | | 14-deoxy-11-oxoandrographolide | [16] |
| | | 313 [M+H−2H2O]+ | |
| | | 331 [M+H−H2O]+ | |
| 8 | 16.6 | 201 | 479 [M−H]− | 317 [M−H−glucosyl]− | 481 [M+H]+ | 319 [M+H−glucosyl]+ | Neoandrographolide | [16,17,18,19,25] |
| 525 [M−H+HCOOH]− | | 301 [M+H−glucosyl−H2O]+ | |
| 959 [2M−H]− | | 319 [M+H−glucosyl]− | |
| | | 503 [M+Na]+ | |
| | | 519 [M+K]+ | |
| 9 | 19.3 | 200 | 333 [M−H]− | 305 [M−H−CO]− | 335 [M+H]+ | 299 [M+H−2H2O]+ | Deoxyandrographolide | [16,18,19,25] |
| | | 299 [M+H−2H2O]+ | 317 [M+H−H2O]+ |
| | | 317 [M+H−H2O]+ | |
| 10 | 19.8 | 251 | 331 [M−H]− | 303 [M−H−CO]− | 333 [M+H]+ | | Dehydroandrographolide | [16,19,20,25] |
| | | 297 [M+H−2H2O]+ | |
| | | 315 [M+H−H2O]+ | |
Peak 3 occurs at a retention time of 12.4 min with maximal UV absorption at 225 nm. Ions at
m/z 349, 331 and 395 were observed in its MS spectrum in negative ion mode, which were assigned as [M−H]
−, [M−H−H
2O]
− and [M−H+HCOOH]
− ions, respectively. An ion at
m/z 331 [M−H−H
2O]
− was found in its MS
2 spectrum. The protonated molecular ion was not found in its MS spectrum in positive mode, but fragment ions corresponding to the loss of a series of water molecules at
m/z 297 [M+H−3H
2O]
+, 315 [M+H−2H
2O]
+, and 333 [M+H−H
2O]
+ were found to be predominant ones. Based on the MS data reported in publications [
16,
17,
18,
19,
20,
25] and the comparison of its MS behaviors with that obtained from the reference compound, it was unequivocally identified as andrographolide.
Peak 4 and Peak 5 occur at retention times of 12.7 min and 12.9 min with maximal UV absorptions at 251 nm and 287 nm, respectively. In negative ion ESI experiments, they both yielded prominent deprotonated molecular ions at m/z 495 [M−H]− and 541 [M−H+HCOOH]−. The MS2 spectrum of the ion at m/z 495 showed a characteristic ion at m/z 333 [M−H−glucosyl]−. In positive ion mode, the protonated molecular ion was not found, but the sodium and potassium adduct ions at m/z 519 [M+Na]+ and 535 [M+K]+ were observed as predominant ones. Each of the two peaks was identified as a glucosyldeoxyandrographolide.
Peak 6 shows a retention time of 13.1 min with maximal UV absorption at 227 nm. Characteristic ions at
m/z 349 [M−H]
−, 331 [M−H−H
2O]
− and 395 [M−H+HCOOH]
− were produced from this peak in the MS spectrum in negative ion mode. The deprotonated ion at
m/z 349 [M−H]
− gave a predominant ion at
m/z 331 in the MS
2 spectrum resulting from the loss of a neutral molecule of H
2O. In positive ion mode, we did not find the protonated molecular ion, but it yielded a predominant ion at
m/z 315 [M+H−2H
2O]
+ by losing two water molecules. According to the data in publications [
17,
25], the peak was identified as isoandrographolide.
Peak 7, with a maximal UV absorption at 264 nm, was eluted at a retention time of 13.4 min, and produced a [M−H]
− ion at
m/z 347 in the MS spectrum in negative ion mode. In positive ion mode, the peak yielded a protonated molecular ion at
m/z 349 [M+H]
+ along with ions at
m/z 313 [M+H−2H
2O]
+ and 331 [M+H−H
2O]
+. According to the literature data [
16], the peak was identified as 14-deoxy-11-oxoandrographolide.
Peak 8 was eluted at a retention time of 16.6 min with a maximal UV absorption at 201 nm. DA deprotonated molecular ion at
m/z 479 [M−H]
−, formic acid adduct ion at
m/z 525 [M−H+HCOOH]
− and an ion at
m/z 959 [2M−H]
− were observed in its MS spectrum in negative ion mode. The deprotonated ion at
m/z 497 [M−H]
− gave a predominant ion at
m/z 317 in the MS
2 spectrum resulting from the loss of a glucosyl unit. In positive ion mode, a protonated molecular ion at
m/z 481 [M+H]
+ and its fragment ions at
m/z 301 [M+H−glucosyl−H
2O]
+, 319 [M+H−glucosyl]
+ as well as its sodium adduct ion at
m/z 503 [M+Na]
+ and potassium adduct ion at
m/z 519 [M+K]
+ were observed. A predominant ion at
m/z 319 [M+H−glucosyl]
+ was also found in its MS
2 spectrum in positive ion mode. Based on the MS data reported in [
16,
17,
18,
19,
25], it was identified as neoandrographolide.
Peak 9 shows a retention time of 19.3 min and maximal UV absorption at 200 nm. This peak gave a [M−H]
− ion at
m/z 333 in its MS spectrum and a [M−H−CO]
− ion at
m/z 305 in its MS
2 spectrum in negative ion mode. In positive ion mode, it produced a very week [M+H]
+ ion at
m/z 335, but yielded prominent ions at
m/z 299 [M+H−2H
2O]
+ and
m/z 317 [M+H−H
2O]
+, which were also the characteristic ions in its MS
2 spectrum. Consequently, it was characterized as deoxyandrographolide [
16,
18,
19,
25].
Peak 10 occurs at a retention time of 19.8 min with maximal UV absorption at 251 nm. An ion at
m/z 331 [M−H]
− was observed in its MS spectrum in negative ion mode, which yielded the characteristic ion at
m/z 303 [M−H−CO]
−. A protonated molecular ion at
m/z 333 [M+H]
+ and its fragment ions resulting from the loss of one or two water molecules at
m/z 315 [M+H−H
2O]
+ and 297 [M+H−2H
2O]
+ appeared in its MS spectrum in positive ion mode. Based on the MS data reported in [
16,
19,
20,
25] and the comparison of its MS behavior with that obtained from the reference compound, it was unequivocally identified as dehydroandrographolide.
2.7. Fingerprinting and Chemometrics Analyses
Although the quantification results can confirm the contents of andrographolide and dehydroandrographolide in an AH sample, there is no way to know intuitively how similar an AH sample is to another one on the whole. Fingerprinting and chemometrics analyses, on the other hand, can show the chemical similarities between one and another one holistically and visually. On the one hand, the similarity of each chromatogram to the reference one (generated from all the AH samples) was calculated to show the similarities/differences between the samples. On the other hand, principal component analysis on the basis of the contents of andrographolide and dehydroandrographolide and PA/W values of the remaining eight characteristic peaks was performed. This operation can be thought of as revealing the internal structure of the data in a way which best explains the variance.
In fingerprinting analysis, 10 peaks shown in the overlapped chromatograms (
Figure 1) were assigned as common peaks. The similarity values of the samples are listed in
Table 4. Firstly, in all the samples, the similarity values of AH-08 were the lowest (below 0.80). Looking at the chromatogram of AH-08, we found that the characteristic peaks were smaller than those obtained from other AH samples. Furthermore, the lowest content of andrographolide and the second lowest content of dehydroandrographolide were found in AH-08. These two points mainly account for its lowest similarity values among all the samples. Secondly, the similarity values of AH-03 and AH-05 were between 0.91 and 0.96, and the ones of AH-04, AH-09 and AH-10 were between 0.96 and 0.99. These values were in the middle interval. Thirdly, four samples, AH-01, AH-02, AH-06 and AH-07 had similarity values higher than 0.99, indicating that their chemical profiles were very similar to that of the generated reference fingerprint.
Except for andrographolide and dehydroandrographolide, although other seven peaks were identified, due to the unavailability of reference compounds, they were not quantified. Therefore, the variables of each sample in PCA consisted of the contents of andrographolide and dehydroandrographolide and PA/W values of the rest peaks. The data were exported to Excel (Microsoft, Inc., Belleview, WA, USA) to form a two-dimensional matrix (ten samples
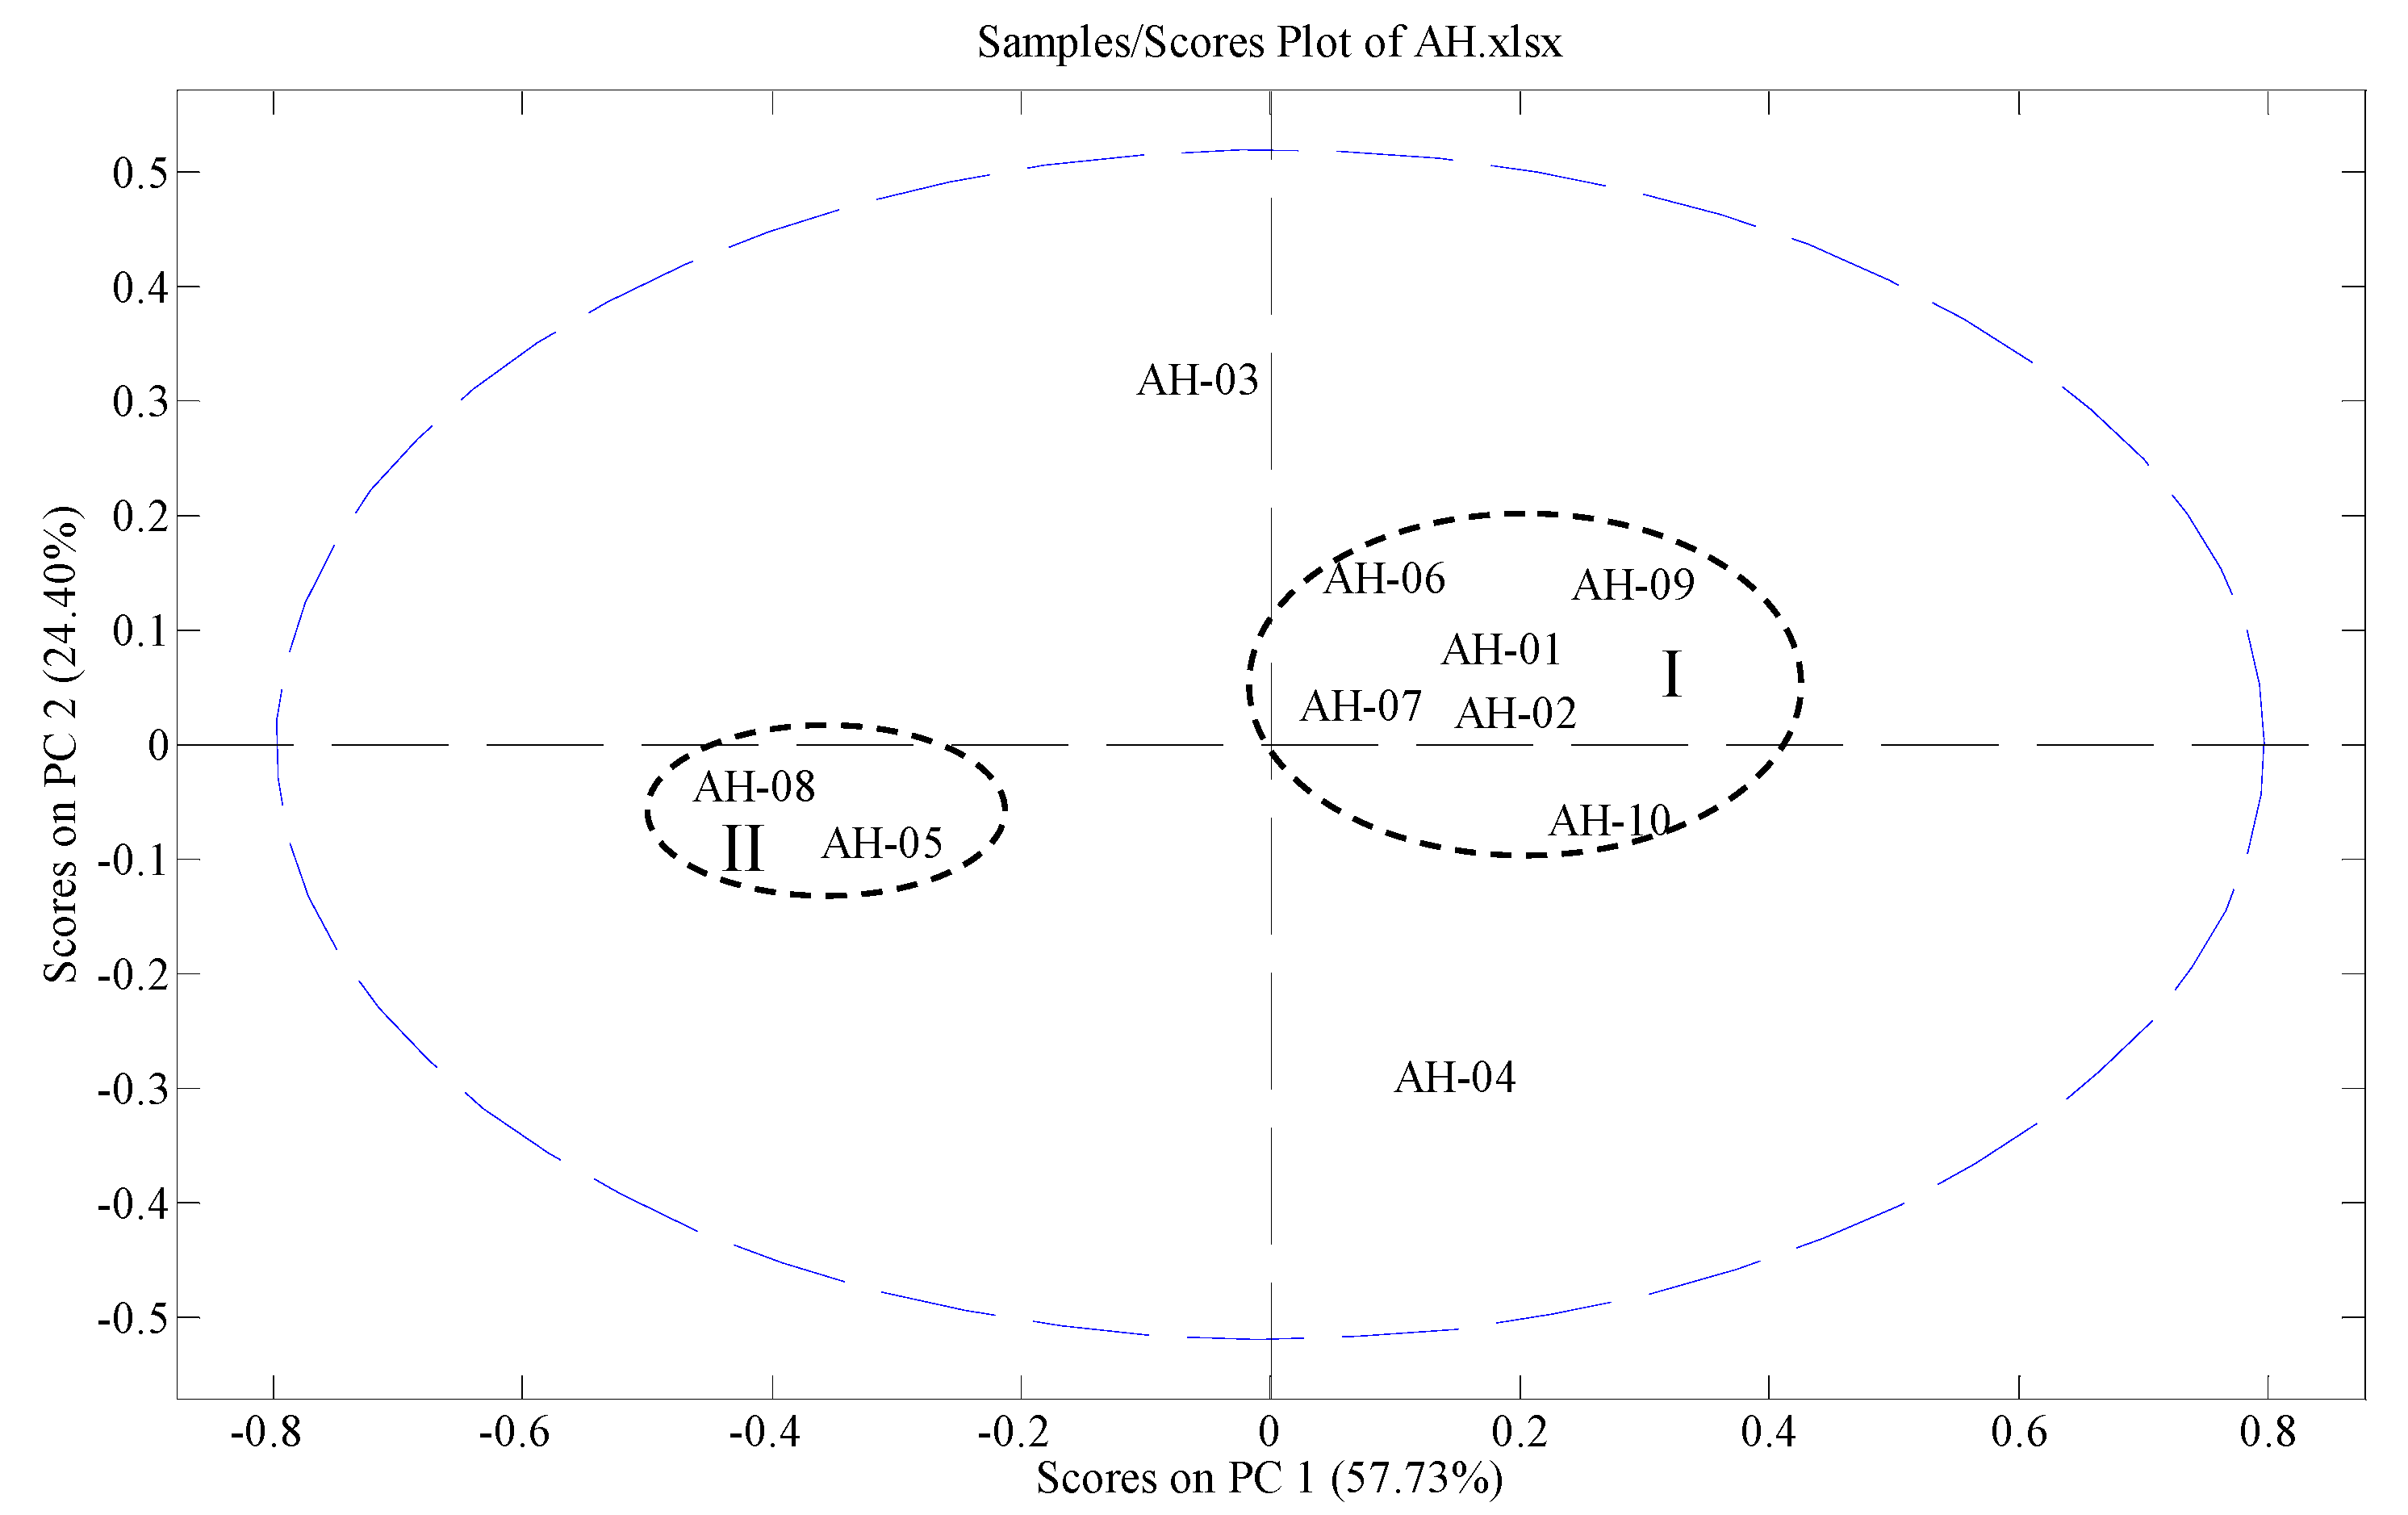
versus ten variables) which was then exported to SOLO for PCA. A two-component (the first two components) model cumulatively accounted for 78.74% of total variance, based on which PCA scores plot (
Figure 2) was generated. From the scores plot, we can see intuitively that AH-01, AH-02, AH-06, AH-07, AH-09 and AH-10 are clustered tightly in group I. They all get PC1 scores higher than zero. AH-05 and AH-08 are clustered in group II. They both get PC1 scores lower than zero. AH-03 and AH-04 are located relatively far away from the two groups.
Figure 2.
PCA scores plot of AH samples.
Figure 2.
PCA scores plot of AH samples.
The distances between AH samples indicate the similarities/differences between their chemical profiles. Those samples with similar chemical profiles are near to each other. In the contrary, differences in chemical profiles lead to larger distances between the samples. To find out how variables contribute to the significant differences between different AH samples, PC1 and PC2 loadings plots were generated. The PC1 loadings plot indicates that peak 3 (andrographolide), peak 6 (isoandrographolide) and peak 9 (deoxyandrographolide) contribute positively to the positions of AH samples on PC1 significantly, whereas, peak 5 (glucosyldeoxyandrographolide) and peak 7 (14-deoxy-11-oxoandrographolide) contribute negatively in PC1. In detail, a higher content of peak 3 (andrographolide) and PA/W values of peak 6 (isoandrographolide) and peak 9 (deoxyandrographolide) lead to higher PC1 scores of a sample in the scores plot, moving its position to the right. Meanwhile, higher PA/W values of peak 5 (glucosyldeoxyandrographolide) and peak 7 (14-deoxy-11-oxoandrographolide) lead to lower PC1 scores of a sample. In our study, AH-10 has the highest content of peak 3 (andrographolide). AH-01 has the highest PA/W values of peak 6 (isoandrographolide) and peak 9 (deoxyandrographolide). AH-02 shows the second highest PA/W values of peak 6 (isoandrographolide) and peak 9 (deoxyandrographolide). Therefore, they are in the rightmost positions following closely after AH-09 which has the lowest PA/W values of peak 5 (glucosyldeoxyandrographolide) and peak 7 (14-deoxy-11-oxoandrographolide). AH-05 was found to have the highest PA/W value of peak 7 (14-deoxy-11-oxoandrographolide) and the lowest PA/W value of peak 9 (deoxyandrographolide). AH-08 was found to have the lowest content of peak 3 (andrographolide). Therefore, the two samples are placed in the leftmost position clustering in group II.
According to the PC2 loadings plot, peak 1, peak 2 (glucosyldeoxyandrographolide), peak 8 (neoandrographolide) and peak 10 (dehydroandrographolide) mainly influence the position of each sample in PC2. Peak 2 (glucosyl-deoxyandrographolide), peak 8 (neoandrographolide) and peak 10 (dehydroandrographolide) contribute to the PC2 positions of AH samples positively, whereas, peak 1 contributes negatively. AH-03 has the highest content of dehydroandrographolide (peak 10) and the highest PA/W values of peak 2 (glucosyldeoxyandrographolide) and peak 8 (neoandrographolide), making it locate on the top in the scores plot. AH-04 was found to have the highest PA/W value of peak 1, resulting in its lowest position in the scores plot. All in all, the scores plot shows the distributions of the tested samples intuitively and clearly, whereas, loadings plots indicate the influences of the variables on the positions of AH samples in the scores plot.


