Mixed Culture Fermentation and Media Optimization by Response Surface Model: Streptomyces and Brachybacterium Species in Bioflocculant Production


Abstract
:1. Introduction
2. Results and Discussion
2.1. The Effects of Nutritional Sources on Bioflocculant Production

| Carbon Source | Glucose | Lactose | Fructose | Sucrose | Maltose | Starch | |
|---|---|---|---|---|---|---|---|
| MFA (%) | 56 | 42 | 48 | 51 | 33 | 46 | |
| BY (g/L) | 2.78 ± 0.15 | 2.34 ± 0.66 | 2.27 ± 0.18 | 2.52 ± 0.44 | 2.09 ± 0.61 | 1.99 ± 0.41 | |
| Nitrogen source | Urea | (NH4)2SO4 | (NH4)2NO3 | (NH4)2Cl4 | Peptone | ||
| MFA (%) | 49 | 36 | 53 | 38 | 42 | ||
| BY (g/L) | 1.96 ± 0.21 | 2.03 ± 0.26 | 2.81 ± 0.37 | 1.99 ± 0.56 | 2.31 ± 0.22 | ||
| Cation source | KCl | NaCl | MgCl2 | CaSO4·H2O | MnCl·4H2O | FeSO4 | FeCl3 |
| MFA (%) | 31 | 29 | 41 | 47 | 32 | 29 | 37 |
| BY (g/L) | 1.58 ± 0.11 | 1.26 ± 0.18 | 1.89 ± 0.21 | 2.19 ± 0.13 | 1.74 ± 0.17 | 1.55 ± 0.29 | 1.82 ± 0.41 |
2.2. Critical Media Components for Bioflocculant Production
| Runs | Coded levels/Concentrations (g/L) | Flocculation Activity (%) | |||||
|---|---|---|---|---|---|---|---|
| Glucose | (NH4)2NO3 | CaSO4·H2O | K2HPO4 | KH2PO4 | Observed | Predicted | |
| 1 | 1(12.5) | 1(1.5) | −1(0.3) | 1(6.5) | 1(2.5) | 49 | 51.67 |
| 2 | 1(12.5) | −1(1.0) | 1(0.5) | 1(6.5) | 1(2.5) | 51 | 51.67 |
| 3 | −1(10.0) | 1(1.5) | 1(0.5) | 1(6.5) | −1(2.0) | 53 | 52.0 |
| 4 | 1(12.5) | 1(1.5) | 1(0.5) | −1(5.0) | −1(2.0) | 57 | 56.33 |
| 5 | 1(12.5) | 1(1.5) | −1(0.3) | −1(5.0) | −1(2.0) | 52 | 54.33 |
| 6 | 1(12.5) | −1(1.0) | −1(0.3) | −1(5.0) | 1(2.5) | 56 | 52.33 |
| 7 | −1(10.0) | −1(1.0) | −1(0.3) | 1(6.5) | −1(2.0) | 47 | 48.0 |
| 8 | −1(10.0) | −1(1.0) | 1(0.5) | −1(5.0) | 1(2.5) | 49 | 52.67 |
| 9 | −1(10.0) | 1(1.5) | −1(0.3) | 1(6.5) | 1(2.5) | 52 | 50.0 |
| 10 | 1(12.5) | −1(1.0) | 1(0.5) | 1(6.5) | −1(2.0) | 53 | 51.67 |
| 11 | −1(10.0) | 1(1.5) | 1(0.5) | −1(5.0) | 1(2.5) | 56 | 54.67 |
| 12 | −1(10.0) | −1(1.0) | −1(0.3) | −1(5.0) | −1(2.0) | 51 | 50.67 |
| No. | Media Components | Estimate | t-value | p-value |
|---|---|---|---|---|
| x1 | Glucose | 0.519 | 6.107 | 0.9421 |
| x2 | (NH4)2NO3 | 0.421 | 2.426 | 0.8894 |
| x3 | CaSO4·H2O | 0.119 | 2.561 | 0.1527 |
| x4 | K2HPO4 | −0.327 | −1.336 | 0.3810 |
| x5 | KH2PO4 | −0.244 | −0.349 | 0.1449 |
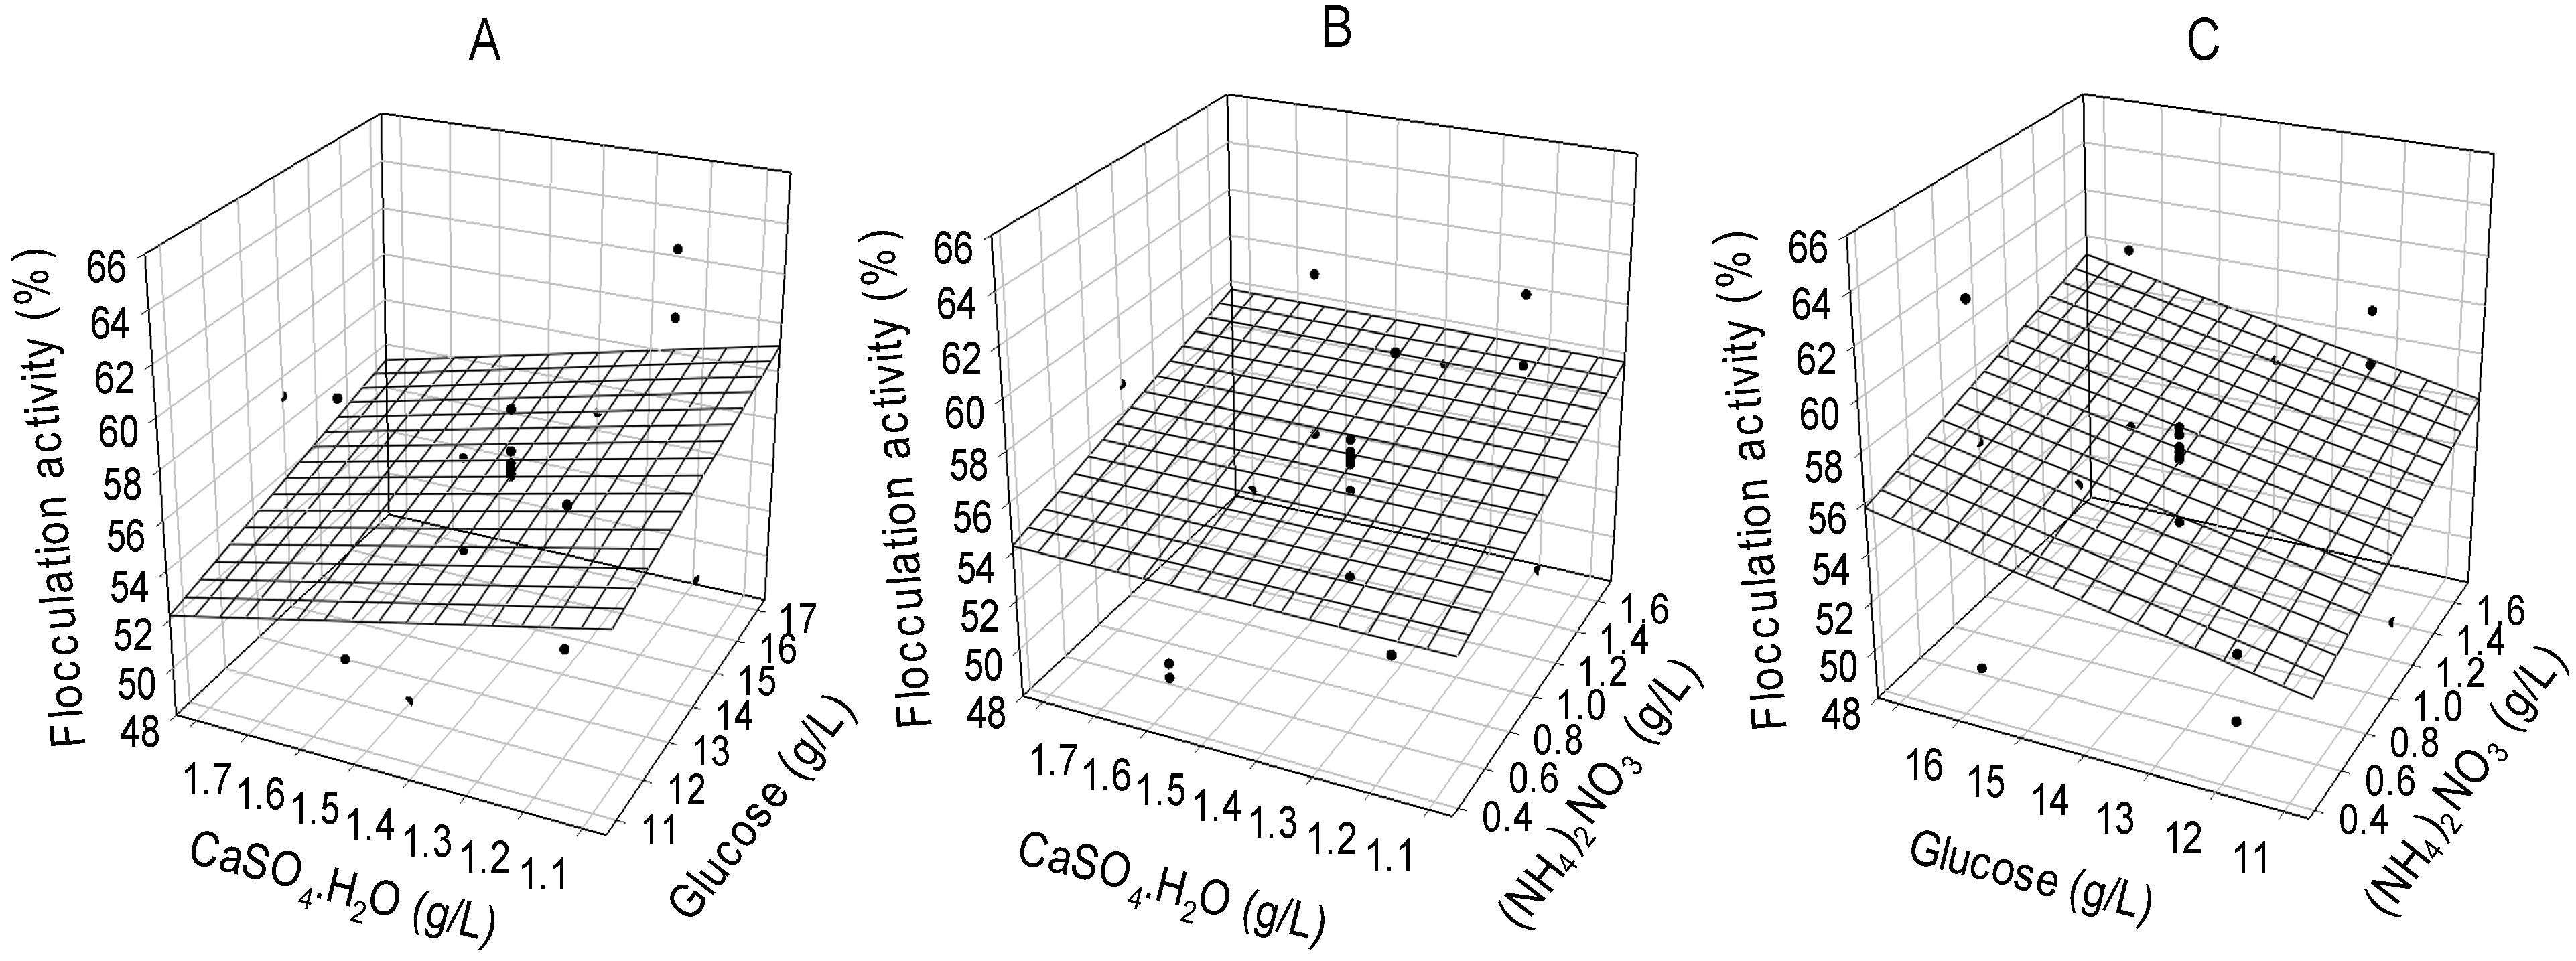
2.3. RSD Optimization of Critical Media Components for the Production of Bioflocculant
| Runs | Glucose | (NH4)2NO3 | CaSO4·H2O | Flocculation Activity (%) | Bioflocculant Yield (g/L) | ||
|---|---|---|---|---|---|---|---|
| Observed | Predicted | Observed | Predicted | ||||
| 1 | 12.0(−1) | 0.5(−1) | 1.2(−1) | 52.5 | 53.68 | 2.53 | 2.48 |
| 2 | 12.0(−1) | 0.5(−1) | 1.6(+1) | 49.8 | 53.68 | 2.31 | 2.39 |
| 3 | 12.0(−1) | 1.5(+1) | 1.2(−1) | 58.1 | 56.12 | 2.92 | 2.74 |
| 4 | 12.0(−1) | 1.5(+1) | 1.6(+1) | 60.3 | 56.12 | 2.88 | 2.87 |
| 5 | 16.0(+1) | 0.5(−1) | 1.2(−1) | 63.7 | 55.53 | 3.02 | 2.93 |
| 6 | 16.0(+1) | 0.5(−1) | 1.6(+1) | 49.2 | 55.53 | 2.17 | 2.25 |
| 7 | 16.0(+1) | 1.5(+1) | 1.2(−1) | 61.0 | 57.97 | 2.92 | 2.74 |
| 8 | 16.0(+1) | 1.5(+1) | 1.6(+1) | 53.4 | 57.97 | 2.33 | 2.28 |
| 9 | 10.64(−1.73) | 1.0(0) | 1.4(0) | 51.2 | 54.27 | 2.46 | 2.51 |
| 10 | 17.36(+1.73) | 1.0(0) | 1.4(0) | 54.8 | 57.39 | 2.29 | 2.39 |
| 11 | 14.0(0) | 0.36(−1.73) | 1.4(0) | 58.6 | 54.26 | 2.61 | 2.54 |
| 12 | 14.0(0) | 1.74(+1.73) | 1.4(0) | 56.1 | 57.64 | 2.57 | 2.81 |
| 13 | 14.0(0) | 1.0(0) | 1.06(−1.73) | 53.3 | 55.83 | 2.48 | 2.74 |
| 14 | 14.0(0) | 1.0(0) | 1.84(+1.73) | 57.2 | 55.83 | 2.33 | 2.26 |
| 15 | 14.0(0) | 1.0(0) | 1.4(0) | 56.4 | 55.83 | 2.31 | 2.44 |
| 16 | 14.0(0) | 1.0(0) | 1.4(0) | 55.9 | 55.83 | 2.47 | 2.44 |
| 17 | 14.0(0) | 1.0(0) | 1.4(0) | 56.2 | 55.83 | 2.56 | 2.44 |
| 18 | 14.0(0) | 1.0(0) | 1.4(0) | 56.9 | 55.83 | 2.34 | 2.44 |
| 19 | 14.0(0) | 1.0(0) | 1.4(0) | 56.0 | 55.83 | 2.71 | 2.44 |
| 20 | 14.0(0) | 1.0(0) | 1.4(0) | 56.2 | 55.83 | 2.36 | 2.44 |
| Source | Flocculation Activity | |||||
|---|---|---|---|---|---|---|
| DF | SS | MS | F-ratio | p-value | R2 | |
| Regression model | 9 | 165.1615 | 18.3513 | 2.13 | 0.127576 | 0.656946 |
| Linear | 3 | 44.2462 | 14.7487 | 1.71 | 0.227695 | 0.175994 |
| Quadratic | 3 | 18.5453 | 6.1818 | 0.72 | 0.564227 | 0.073766 |
| Lin x Lin | 3 | 102.37 | 34.1233 | 3.96 | 0.042518 | 0.407187 |
| Total Error | 10 | 86.2466 | 8.6247 | 0.343054 | ||
| Lack of Fit | 5 | 85.6132 | 17.1226 | 135.18 | 0.000025 | 0.340535 |
| Pure Error | 5 | 0.63333 | 0.12667 | 0.002519 | ||
| Source | Bioflocculant Yield | |||||
| DF | SS | MS | F-ratio | p-value | R2 | |
| Regression model | 9 | 0.7881873 | 875.7637 | 2.43 | 0.091091 | 0.686541 |
| Linear | 3 | 0.3663863 | 0.1221288 | 3.39 | 0.061856 | 0.319137 |
| Quadratic | 3 | 0.122301 | 0.040767 | 1.13 | 0.382087 | 0.106529 |
| Lin x Lin | 3 | 0.2995 | 998.3333 | 2.77 | 0.096567 | 0.260876 |
| Total Error | 10 | 0.3598677 | 359.8677 | 0.313459 | ||
| Lack of Fit | 5 | 0.2403843 | 480.7687 | 2.01 | 0.230646 | 0.209384 |
| Pure Error | 5 | 0.1194833 | 238.9667 | 0.104075 | ||
| Parameter | Estimate | Standard Error | t-Value | p-Value |
|---|---|---|---|---|
| Intercept | −121.1504 | |||
| Glucose | 18.66811 | 6.626398 | 2.82 | 0.018247 |
| (NH4)2NO3 | 2.500087 | 22.24044 | 0.11 | 0.912721 |
| CaSO4·H2O | 63.57429 | 56.72536 | 1.12 | 0.288592 |
| Glucose × Glucose | −0.2474871 | 0.1938682 | −1.28 | 0.230601 |
| (NH4)2NO3 × (NH4)2NO3 | 2.360935 | 4.069187 | 0.58 | 0.574621 |
| CaSO4·H2O × CaSO4·H2O | 3.926695 | 14.69922 | 0.27 | 0.794792 |
| Glucose × (NH4)2NO3 | −1.825 | 1.038307 | −1.76 | 0.109316 |
| Glucose × CaSO4·H2O | −6.75 | 2.595768 | −2.60 | 0.026474 |
| (NH4)2NO3 × CaSO4·H2O | 14.75 | 10.38307 | 1.42 | 0.185859 |

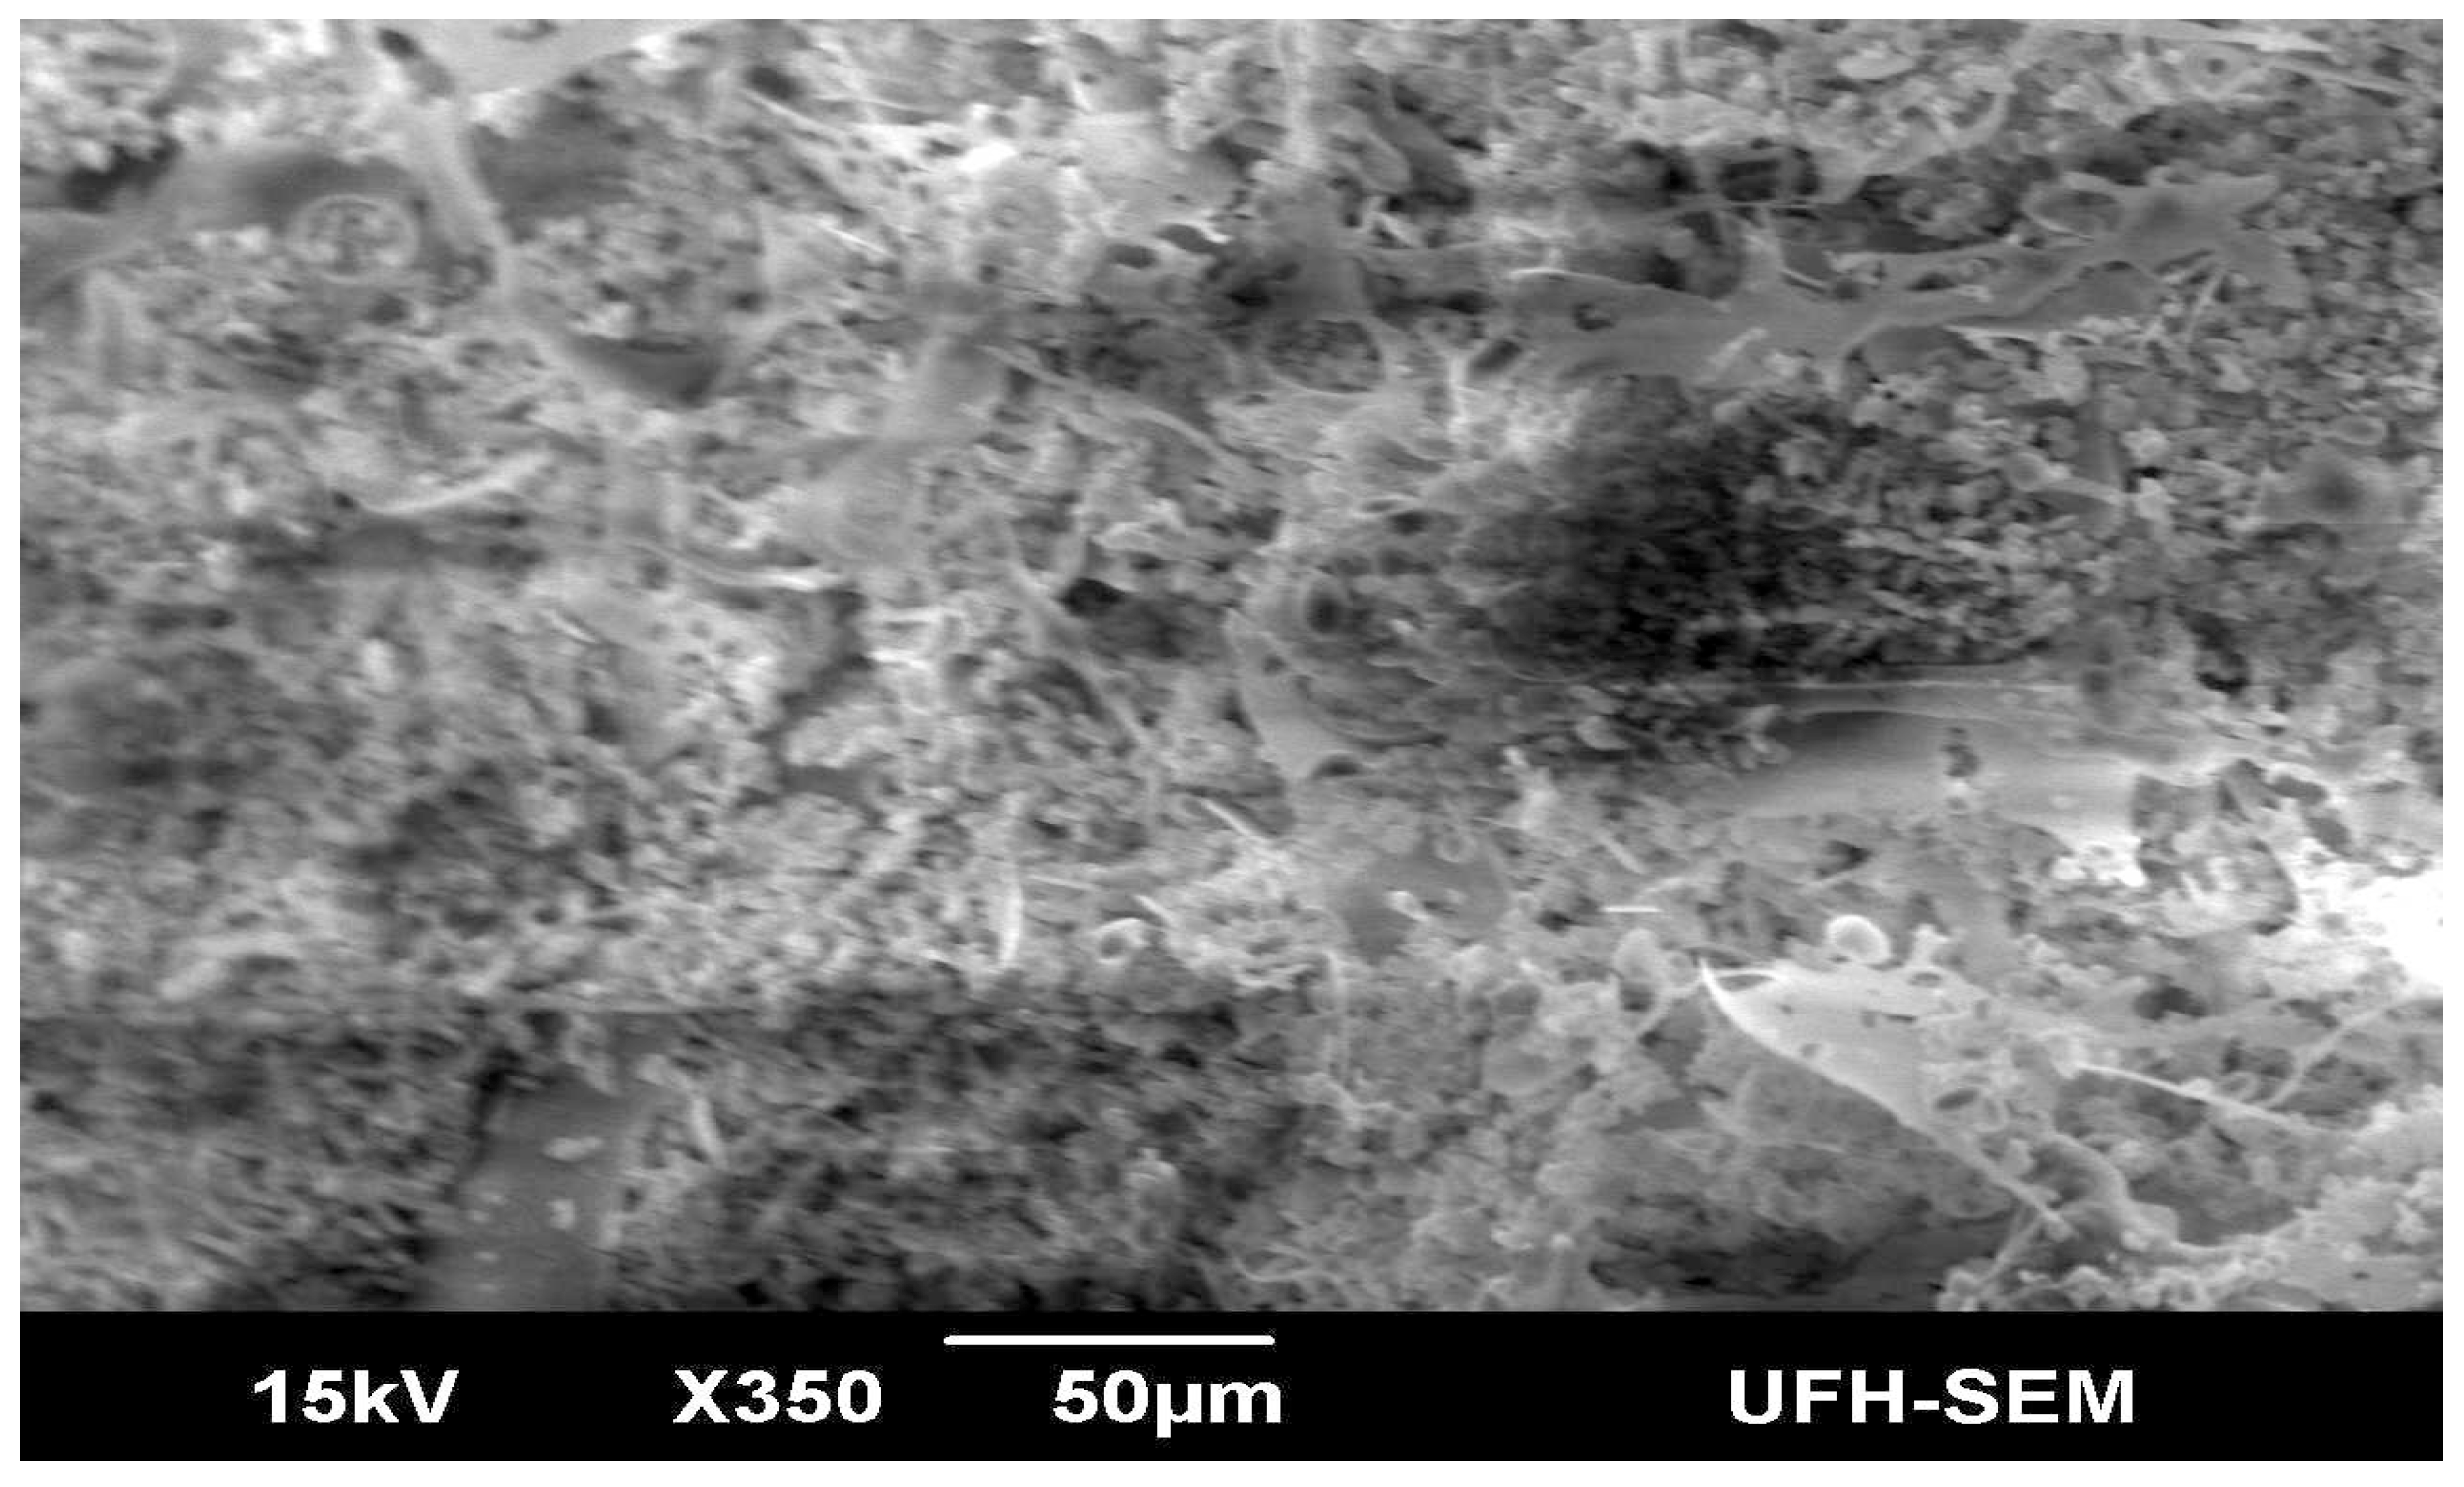
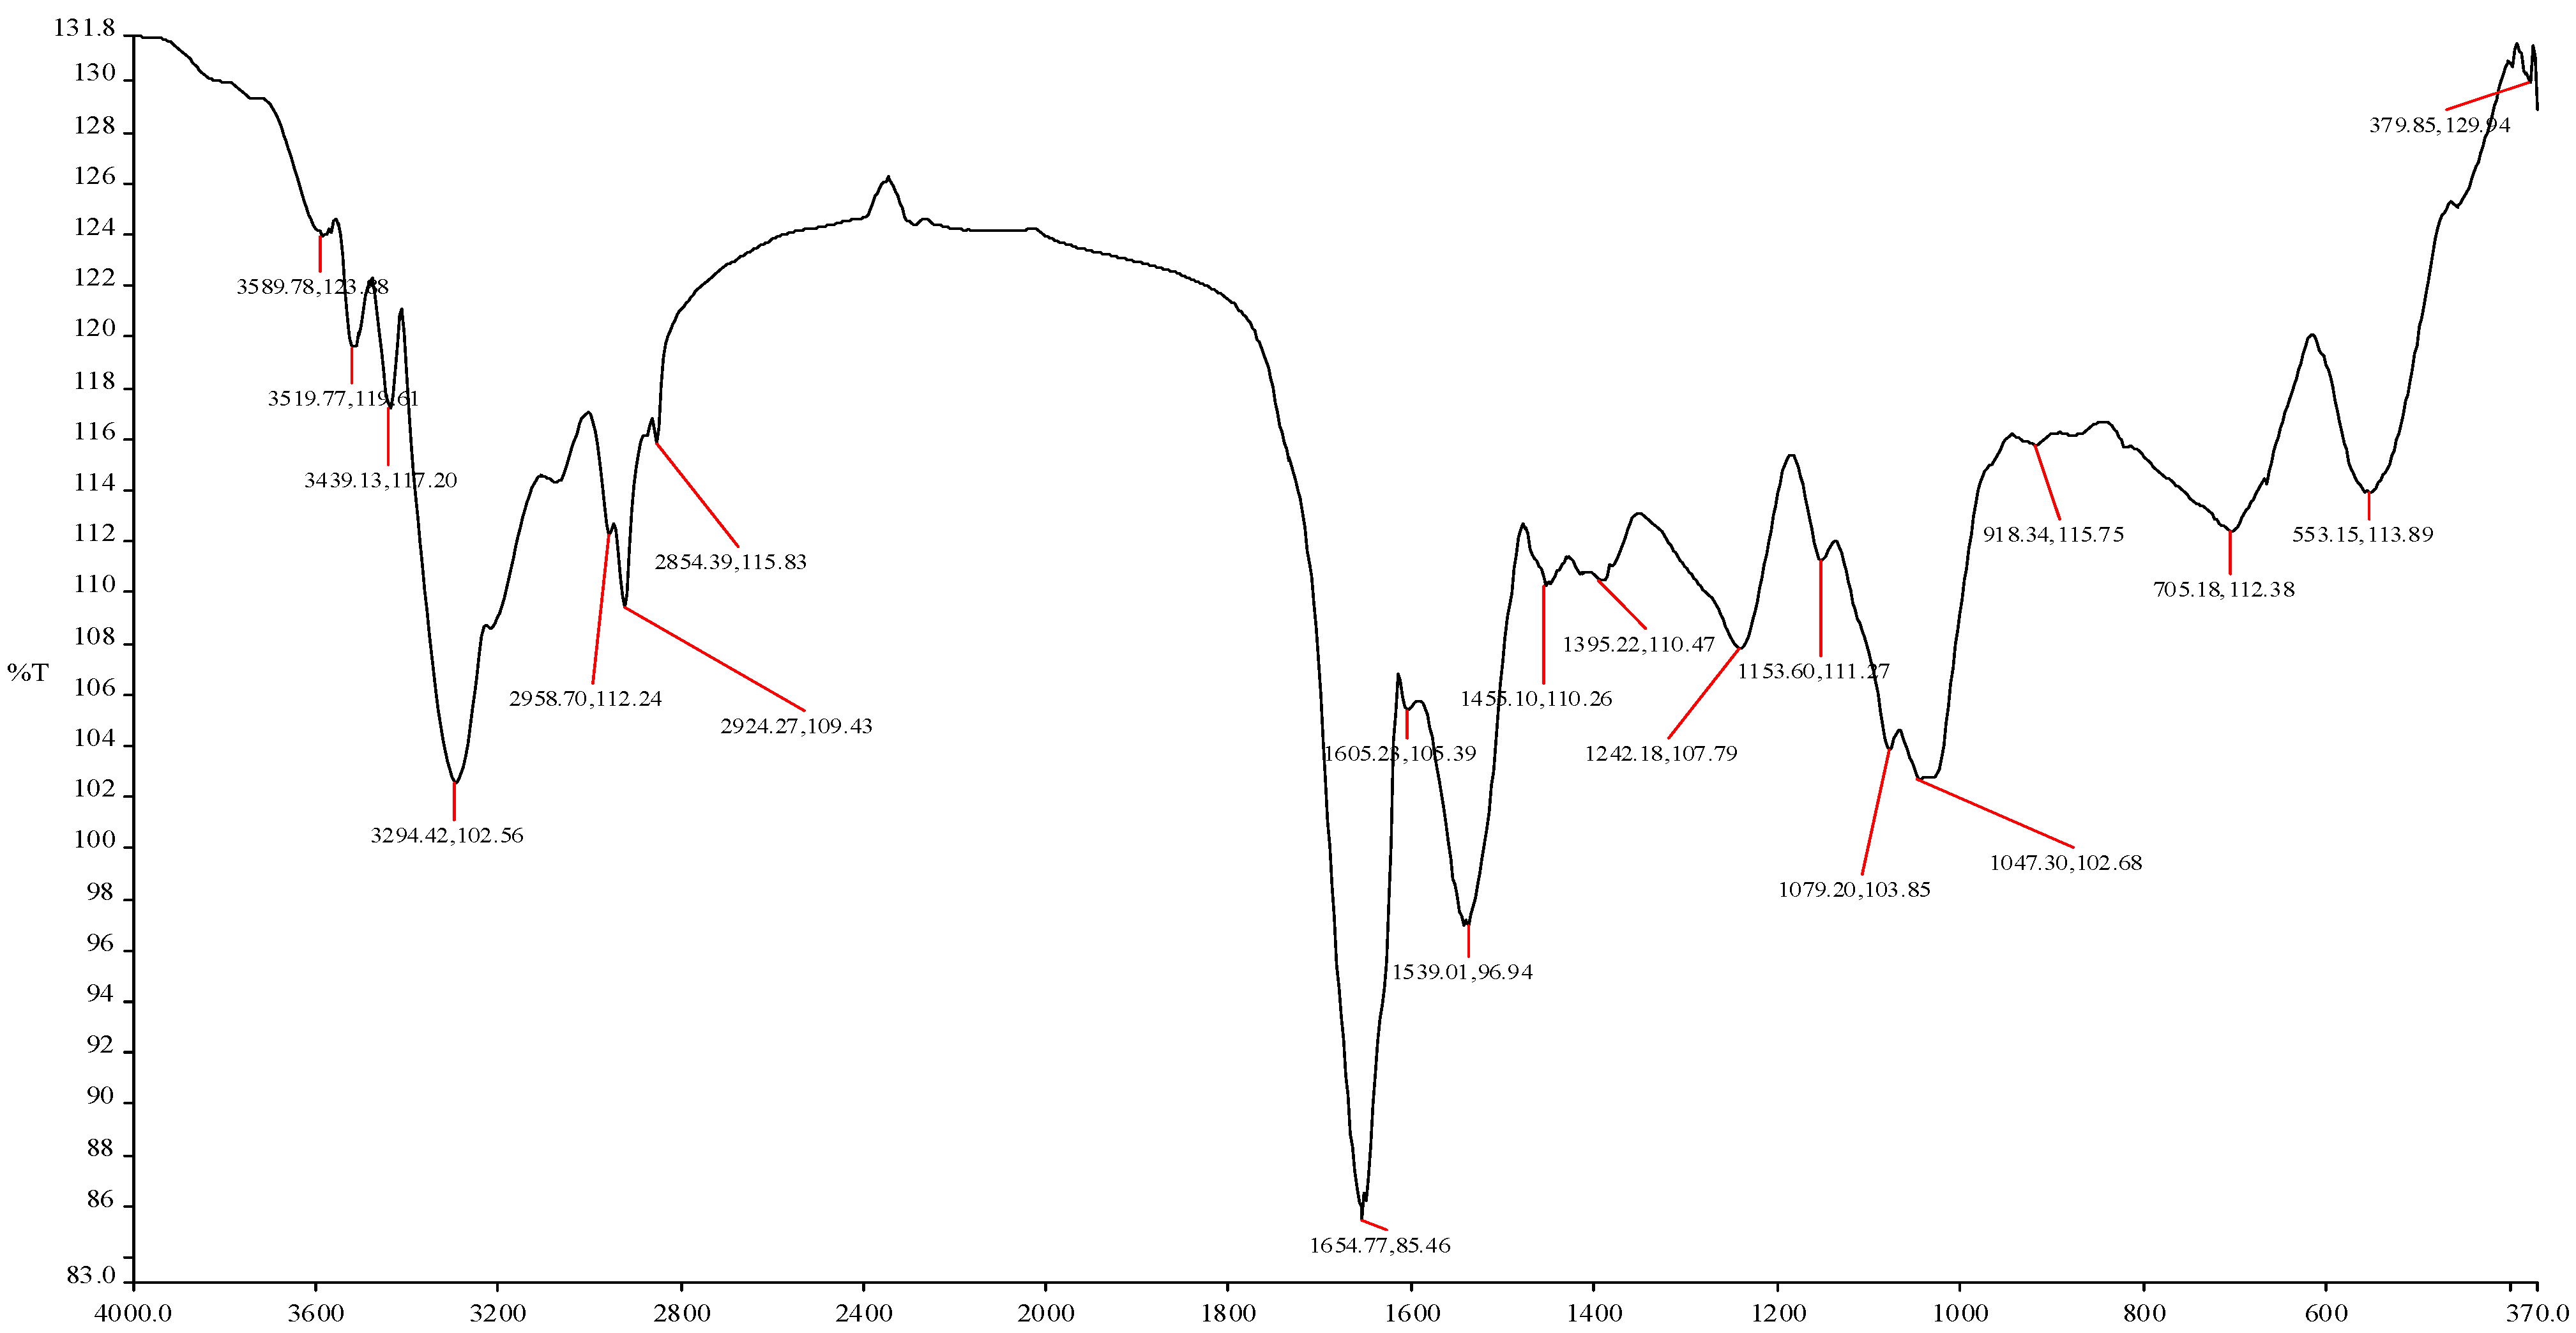
2.4. Micrographic Imaging and Compositional Characteristics of the Purified Bioflocculant


3. Experimental Section
3.1. Test Bacterial Strains
3.2. Evaluating Carbon, Nitrogen and Cation Sources for Bioflocculant Production
3.3. Determination of Flocculation Activity
3.4. Critical Media Components Determination via Plackett-Burman Design

3.5. Critical Media Components Optimization through the Central Composite Design

3.6. Bioflocculant Purification
3.7. SEM Imaging and FTIR Spectroscopy of the Purified Bioflocculant
4. Conclusions
Acknowledgments
Author Contributions
Conflicts of Interest
References
- Yokoi, H.; Natsuda, O.; Sachio, J.H.; Takasaki, Y. Characteristics of a biopolymer flocculant produced by Bacillus sp. PY-90. J. Ferment. Bioeng. 1995, 4, 378–380. [Google Scholar]
- Jang, J.H.; Ike, M.; Kim, S.M.; Fujita, M. Production of a Novel bioflocculant by fed-batch culture of Citrobacter sp. Biotechnol. Lett. 2001, 23, 593–597. [Google Scholar] [CrossRef]
- Haijun, W.; Qingbiao, L.; Rui, L.; Yuanpeng, W.; Xiaoling, Z.; Ning, H. Fed-batch production of a bioflocculant from Corynebacterium glutamicum. J. Ind. Microbiol. Biotechnol. 2010, 37, 1203–1209. [Google Scholar] [CrossRef]
- Luvuyo, N.; Nwodo, U.U.; Mabinya, L.V.; Okoh, A.I. Studies on bioflocculant production by a consortium of two bacterial isolates: Methylobacterium sp. Obi and Actinobacterium sp. Mayor. BMC Biotechnol. 2013, 13, 62. [Google Scholar]
- Nwodo, U.U.; Agunbiade, M.O.; Green, E.; Mabinya, L.V.; Okoh, A.I. A freshwater streptomyces, isolated from Tyume River, produces a predominantly extracellular glycoprotein bioflocculant. Int. J. Mol. Sci. 2012, 13, 8679–8695. [Google Scholar]
- Gao, J.; Bao, H.; Xin, M.; Liu, Y.; Li, Q.; Zhang, Y. Characterization of a bioflocculant from a newly isolated Vagococcus sp. W31. J. Zhejiang Univ. Sci. B 2006, 7, 186–192. [Google Scholar]
- Banks, W.A.; Niehoff, M.L.; Drago, D.; Zatta, P. Aluminum complexing enhances amyloid protein penetration of blood–brain barrier. Brain Res. 2006, 1116, 215–221. [Google Scholar] [CrossRef]
- Dearfield, K.L.; Abernathy, C.O.; Ottley, M.S.; Brantner, J.H.; Hayes, P.F. Acrylamide: Its metabolism, developmental and reproductive effects, genotoxicity and carcinogenicity. Mutant Res. 1988, 195, 45–77. [Google Scholar]
- Polizzi, S.; Pira, E.; Ferrara, M.; Buginani, M.; Papaleo, A.; Albera, R.; Palmi, S. Neurotoxic effects of aluminum among foundry workers and Alzheimer’s disease. Neurotoxicology 2002, 23, 761–774. [Google Scholar] [CrossRef]
- Rudén, C. Acrylamide and cancer risk-expert risk assessments and the public debate. Food Chem. Toxicol. 2004, 42, 335–349. [Google Scholar] [CrossRef]
- Xiong, Y.; Wang, Y.; Yu, Y.; Li, Q.; Wang, H.; Chen, R.; He, N. Production and characterization of a novel bioflocculant from Bacillus licheniformis. Appl. Environ. Microb. 2010, 76, 2778–2782. [Google Scholar] [CrossRef]
- Salehizadeh, H.; Shojaosadati, S.A. Isolation and characterisation of a bioflocculant produced by Bacillus firmus. Biotechnol. Lett. 2002, 24, 35–40. [Google Scholar]
- Kim, D.G.; La, H.J.; Ahn, C.Y.; Park, Y.H.; Oha, H.M. Harvest of Scenedesmus sp. with bioflocculant and reuse of culture medium for subsequent high-density cultures. Bioresour. Technol. 2011, 102, 3163–3168. [Google Scholar] [CrossRef]
- Aljuboori, A.H.R.; Idris, A.; Abdullah, N.; Mohamad, R. Production and characterization of a bioflocculant produced by Aspergillus flavus. Bioresour. Technol. 2013, 127, 489–493. [Google Scholar] [CrossRef]
- He, J.; Zhen, Q.; Qiu, N.; Liu, Z.; Wang, B.; Shao, Z.; Yu, Z. Medium optimization for the production of a novel bioflocculant from Halomonas sp. V3a’ using response surface methodology. Bioresour. Technol. 2009, 100, 5922–5927. [Google Scholar] [CrossRef]
- Piyo, N.; Cosa, S.; Mabinya, V.L.; Okoh, A.I. Assessment of bioflocculant production by Bacillus sp. Gilbert, a marine bacterium isolated from the bottom sediment of Algoa Bay. Mar. Drugs 2011, 9, 1232–1242. [Google Scholar]
- Mabinya, V.L.; Cosa, S.; Nwodo, U.U.; Okoh, A.I. Studies on bioflocculant production by Arthrobacter sp. Raats, a freshwater bacteria isolated from Tyume River, South Africa. Int. J. Mol. Sci. 2012, 13, 1054–1065. [Google Scholar]
- Daolun, L.F.; Shihong, H.X. Characterization of bioflocculant MBF3–3 produced by an isolated Bacillus sp. World J. Microbiol. Biotechnol. 2008, 24, 1627–1632. [Google Scholar] [CrossRef]
- Zhang, Z.; Lin, B.; Xia, S.; Wang, X.; Yang, A. Production and application of a novel bioflocculant by multiple-microorganism consortia using brewery wastewater as carbon source. J. Environ. Sci. 2007, 19, 667–673. [Google Scholar] [CrossRef]
- Park, Y.S.; Kang, S.W.; Lee, J.S.; Hong, S.I.; Kim, S.W. Xylanase production in solid state fermentation by Aspergillus niger mutant using statistical experimental designs. Appl. Microbiol. Biotechnol. 2002, 58, 761–766. [Google Scholar] [CrossRef]
- Mishra, A.; Kumar, S.; Kumar, S. Application of Box-Benhken experimental design for optimization of laccase production by Coriolus versicolor MTCC138 in solid-state fermentation. J. Sci. Ind. Res. 2008, 67, 1098–1107. [Google Scholar]
- Liu, W.; Wang, K.; Li, B.; Yuan, H.; Yang, J. Production and characterization of an intracellular biofloculant by Chryseobacterium daeguense W6 cultured in low nutrition medium. Bioresour. Technol. 2010, 101, 1044–1048. [Google Scholar]
- Wu, J.Y.; Ye, H.F. Characterization and flocculating properties of an extracellular biopolymer produced from a Bacillus subtilis DYU1 isolate. Process Biochem. 2007, 42, 1114–1123. [Google Scholar] [CrossRef]
- Ahamed, A.; Vermette, P. Enhanced enzyme production from mixed cultures of Trichoderma reesei RUT-C30 and Aspergillus niger LMA grown as fed batch in a stirred tank bioreactor. Biochem. Eng. J. 2008, 42, 41–46. [Google Scholar] [CrossRef]
- Fujita, M.; Ike, M.; Tachibana, S.; Kitada, G.; Kim, S.M.; Inoue, Z. Characterization of a bioflocculant produced by Citrobacter sp. TKF04 from acetic and propionic acids. J. Biosci. Bioeng. 2000, 89, 40–46. [Google Scholar] [CrossRef]
- Deng, S.B.; Bai, R.B.; Hu, X.M.; Luo, Q. Characteristics of a bioflocculant produced by Bacillus mucilaginosus and its use in starch wastewater treatment. Appl. Microbiol. Biotechnol. 2003, 60, 588–593. [Google Scholar] [CrossRef]
- Saez, J.M.; Benimeli, C.S.; Amoroso, M.J. Lindane removal by pure and mixed cultures of immobilized actinobacteria. Chemosphere 2012, 89, 982–987. [Google Scholar]
- Nwodo, U.U.; Green, E.; Mabinya, L.V.; Okaiyeto, K.; Rumbold, K.; Obi, L.C.; Okoh, A.I. Bioflocculant production by a consortium of Streptomyces and Cellulomonas species and media optimization via surface response model. Colloids Surf. B Biointerf. 2014, 116, 257–264. [Google Scholar] [CrossRef]
- Yang, Z.H.; Huang, J.; Zeng, G.M.; Ruan, M.; Zhou, C.S.; Li, L.; Rong, Z.G. Optimization of flocculation conditions for kaolin suspension using the composite flocculant of MBFGA1 and PAC by response surface methodology. Bioresour. Technol. 2009, 100, 4233–4239. [Google Scholar] [CrossRef]
- Nwodo, U.U.; Okoh, A.I. Characterization and flocculation properties of biopolymeric flocculant (glycosaminoglycan) produced by Cellulomonas sp. Okoh. J. Appl. Microbiol. 2013, 114, 1325–1337. [Google Scholar] [CrossRef]
- Jeong, J.H.; Kim, J.N.; Weeb, Y.J.; Ryu, H.W. The statistically optimized production of poly(c-glutamic acid) by batch fermentation of a newly isolated Bacillus subtilis RKY3. Bioresour. Technol. 2010, 101, 4533–4539. [Google Scholar] [CrossRef]
- Rodrigues, L.; Teixeira, J.; Oliveira, R.; van der Mei, H.C. Response surface optimization of the medium components for the production of biosurfactants by probiotic bacteria. Process Biochem. 2006, 41, 1–10. [Google Scholar]
- Wang, Q.; Hou, Y.; Xu, Z.; Miao, J.; Li, G. Optimization of cold-active protease production by the psychrophilic bacterium Colwellia sp. NJ341 with response surface methodology. Bioresour. Technol. 2008, 99, 1926–1931. [Google Scholar] [CrossRef]
- Schmitt, J.; Flemming, H. FTIR-spectroscopy in microbial and material analysis. Int. Biodeterior. Biodegrad. 1998, 41, 1–11. [Google Scholar] [CrossRef]
- Coates, J. Interpretation of infrared spectra, a practical approach. Encycl. Anal. Chem. 2000. [Google Scholar] [CrossRef]
- Sample Availability: The samples we used for the studies are available; both the bioflocculants and the actinobacterial species.
© 2014 by the authors. Licensee MDPI, Basel, Switzerland. This article is an open access article distributed under the terms and conditions of the Creative Commons Attribution license ( http://creativecommons.org/licenses/by/3.0/).
Share and Cite
Nwodo, U.U.; Okoh, A.I. Mixed Culture Fermentation and Media Optimization by Response Surface Model: Streptomyces and Brachybacterium Species in Bioflocculant Production. Molecules 2014, 19, 11131-11144. https://doi.org/10.3390/molecules190811131
Nwodo UU, Okoh AI. Mixed Culture Fermentation and Media Optimization by Response Surface Model: Streptomyces and Brachybacterium Species in Bioflocculant Production. Molecules. 2014; 19(8):11131-11144. https://doi.org/10.3390/molecules190811131
Chicago/Turabian StyleNwodo, Uchechukwu U., and Anthony I. Okoh. 2014. "Mixed Culture Fermentation and Media Optimization by Response Surface Model: Streptomyces and Brachybacterium Species in Bioflocculant Production" Molecules 19, no. 8: 11131-11144. https://doi.org/10.3390/molecules190811131
APA StyleNwodo, U. U., & Okoh, A. I. (2014). Mixed Culture Fermentation and Media Optimization by Response Surface Model: Streptomyces and Brachybacterium Species in Bioflocculant Production. Molecules, 19(8), 11131-11144. https://doi.org/10.3390/molecules190811131