2.3. Statistical Analysis and the Model Fitting
To maximize DIZs against
P. italicum and
P. digitatum, extraction conditions were optimized using response surface methodology. A CCD with five-levels-three-factor was used for three extraction variables, such as extraction time, solvent to solid ratio and temperature (
Table 1). To choose the best model agreeing with the data, the analysis of variance and goodness-of-fit by calculating F and
p-value was summarized (
Table 2 and
Table 3). The DIZs against
P. italicum and
P. digitatum ranged from 46.6 to 57.4 mm and 31.8 to 39.5 mm. The maximum DIZs (57.4 and 39.5 mm) were recorded for an extraction time of 60 min, solvent to solid ratio of 30 mL/g and temperature of 50 °C. There is an empirical relationship between the response variable (DIZs against
P. italicum and
P. digitatum) and the test variable under consideration.
As
Table 2 shows, by applying multiple regression analysis to the experiment data, the experimental results of the CCD were fitted with a second-order polynomial regression equations (Equation (1)). The Equation (2) was fitted to the DIZs against
P. digitatum was presented, as follows:
Table 1.
A central composite design for independent variables and their responses.
Table 1.
A central composite design for independent variables and their responses.
| Standard Order | Run Order | Coded Level of Fermentation Condition | DIZs (mm) |
|---|
| X1 (min) | X2 (mL/g) | X3 (°C) | Y1 | Y2 |
|---|
| 1 | 14 | −1 (30) | −1 (20) | −1 (35) | 46.6 | 32.2 |
| 2 | 3 | 1 (90) | −1 (40) | −1 (35) | 51.6 | 33.8 |
| 3 | 12 | −1 (30) | 1 (40) | −1 (35) | 48.0 | 31.8 |
| 4 | 4 | 1 (90) | 1 (40) | −1 (35) | 52.2 | 35.4 |
| 5 | 6 | −1 (30) | −1 (20) | 1 (65) | 49.7 | 33.5 |
| 6 | 20 | 1 (90) | −1 (20) | 1 (65) | 51.5 | 32.0 |
| 7 | 18 | −1 (30) | 1 (40) | 1 (65) | 50.6 | 34.5 |
| 8 | 1 | 1 (90) | 1 (40) | 1 (65) | 50.1 | 34.2 |
| 9 | 13 | −1.68 (9.5) | 0 (30) | 0 (50) | 47.8 | 33.7 |
| 10 | 17 | 1.68 (110.5) | 0 (30) | 0 (50) | 52.2 | 34.4 |
| 11 | 9 | 0 (60) | −1.68 (13.2) | 0 (50) | 50.6 | 32.9 |
| 12 | 7 | 0 (60) | 1.68 (46.8) | 0 (50) | 51.9 | 34.7 |
| 13 | 2 | 0 (60) | 0 (30) | −1.68 (24.8) | 49.3 | 32.5 |
| 14 | 16 | 0 (60) | 0 (30) | 1.68 (75.2) | 51.9 | 33.8 |
| 15 | 5 | 0 (60) | 0 (30) | 0 (50) | 57.3 | 39.2 |
| 16 | 15 | 0 (60) | 0 (30) | 0 (50) | 57.1 | 39.5 |
| 17 | 10 | 0 (60) | 0 (30) | 0 (50) | 56.9 | 39.1 |
| 18 | 8 | 0 (60) | 0 (30) | 0 (50) | 57.4 | 39.0 |
| 19 | 11 | 0 (60) | 0 (30) | 0 (50) | 57.0 | 39.2 |
| 20 | 19 | 0 (60) | 0 (30) | 0 (50) | 56.7 | 39.4 |
Table 2.
Results of regression analysis and corresponding F and p-value of second-order model polynomial regression equation for DIZs against P. italicum and P. digitatum.
Table 2.
Results of regression analysis and corresponding F and p-value of second-order model polynomial regression equation for DIZs against P. italicum and P. digitatum.
| Source | Coefficient | Standard Error | F-Value | p-Value |
|---|
| DIZs against P. italicum |
| Intercept | 57.07 | 0.143 | 281.46 | <0.0001 |
| X1 | 1.31 | 0.095 | 190.5 | <0.0001 |
| X2 | 0.27 | 0.095 | 8.08 | 0.0175 |
| X3 | 0.58 | 0.095 | 36.85 | 0.0001 |
| −2.54 | 0.092 | 753.8 | <0.0001 |
| −2.10 | 0.092 | 514.14 | <0.0001 |
| −2.33 | 0.092 | 633.06 | <0.0001 |
| X1X2 | −0.39 | 0.124 | 9.75 | 0.0108 |
| X1X3 | −0.99 | 0.124 | 63.34 | <0.0001 |
| X2X3 | −0.31 | 0.124 | 6.34 | 0.0305 |
| DIZs against P. digitatum |
| Intercept | 39.23 | 0.105 | 383.18 | <0.0001 |
| X1 | 0.34 | 0.07 | 23.04 | 0.0007 |
| X2 | 0.54 | 0.07 | 60.65 | <0.0001 |
| X3 | 0.23 | 0.07 | 11.16 | 0.0075 |
| −1.81 | 0.068 | 710.76 | <0.0001 |
| −1.90 | 0.068 | 781.78 | <0.0001 |
| −2.13 | 0.068 | 982.25 | <0.0001 |
| X1X2 | 0.40 | 0.091 | 19.22 | 0.0014 |
| X1X3 | −0.87 | 0.091 | 91.97 | <0.0001 |
| X2X3 | 0.25 | 0.091 | 7.51 | 0.0208 |
Table 3.
ANOVA for the effects of extraction time (X1), solvent to solid ratio (X2) and temperature (X3) on DIZs against P. italicum and P. digitatum.
Table 3.
ANOVA for the effects of extraction time (X1), solvent to solid ratio (X2) and temperature (X3) on DIZs against P. italicum and P. digitatum.
| Source | Sum of Squares | Df | Mean Square | F-Value | p-Value |
|---|
| DIZs against P. italicum |
| Model | 234.50 | 9 | 26.06 | 211.56 | <0.0001 |
| Residual | 1.23 | 10 | 0.12 | | |
| Lack of Fit | 0.90 | 5 | 0.18 | 2.69 | 0.1503 |
| Pure Error | 0.33 | 5 | 0.067 | | |
| Cor Total | 235.73 | 19 | | | |
| R2 = 0.9948, Adj. R2 = 0.9901, Pred. R2 = 0.9672, CV = 0.67 |
| DIZs against P. italicum |
| Model | 151.94 | 9 | 16.88 | 253.50 | < 0.0001 |
| Residual | 0.67 | 10 | 0.07 | | |
| Lack of Fit | 0.49 | 5 | 0.10 | 2.84 | 0.1381 |
| Pure Error | 0.17 | 5 | 0.03 | | |
| Cor Total | 152.61 | 19 | | | |
| R2 = 0.9956, Adj. R2 = 0.9917, Pred. R2 = 0.9730, CV = 0.73 |
The significance of each coefficient was determined using
F-test and
p-values as shown in
Table 2. ANOVA analysis was used for checking the signficance and suitability of the model, and a statistical summary is shown in
Table 3. It was considered as signficant if the
F-value becomes greater and the
p-value becomes smaller. Lack of fit was also determined to check the quality of the model. According to
Table 3, the ANOVA for the response surface quadratic regression model showed that the model was highly significant (
p < 0.0001) with a very high
F-value (211.56 and 253.50).
For the model fitting, the coefficient of R
2 (coefficient of determination) and Adj. R
2 (adjustable R
2) as well as Pred. R
2 (predictable R
2) were checked. The R
2 value indicates how well of the model fits the experimental data, and the closer R
2 to one, the more significant the model and the better it predicts the response. The values of R
2 were 0.9948 and 0.9956, indicating that there is a good correlation between the experimental and predicted values and only 0.52% and 0.44% of the total variations (DIZs against
P. italicum and
P. digitatum) was not explained by the response model. In addition, the Adj. R
2 and Pred. R
2 are also essential parameters to check adequate precision. The Adj. R
2 is a modification of R
2 and attempts to yield a more honest value to estimate R
2, the Pred. R
2 is used to indicate how well the model predicts response for new observations. In this case, the values of the Adj. R
2 were 0.9901 and 0.9917, which was also satisfactory to confirm that the model was highly significant. Meanwhile, the values of Pred. R
2 (0.9672 and 0.9730) were in reasonable agreement with the values of Adj. R
2. The
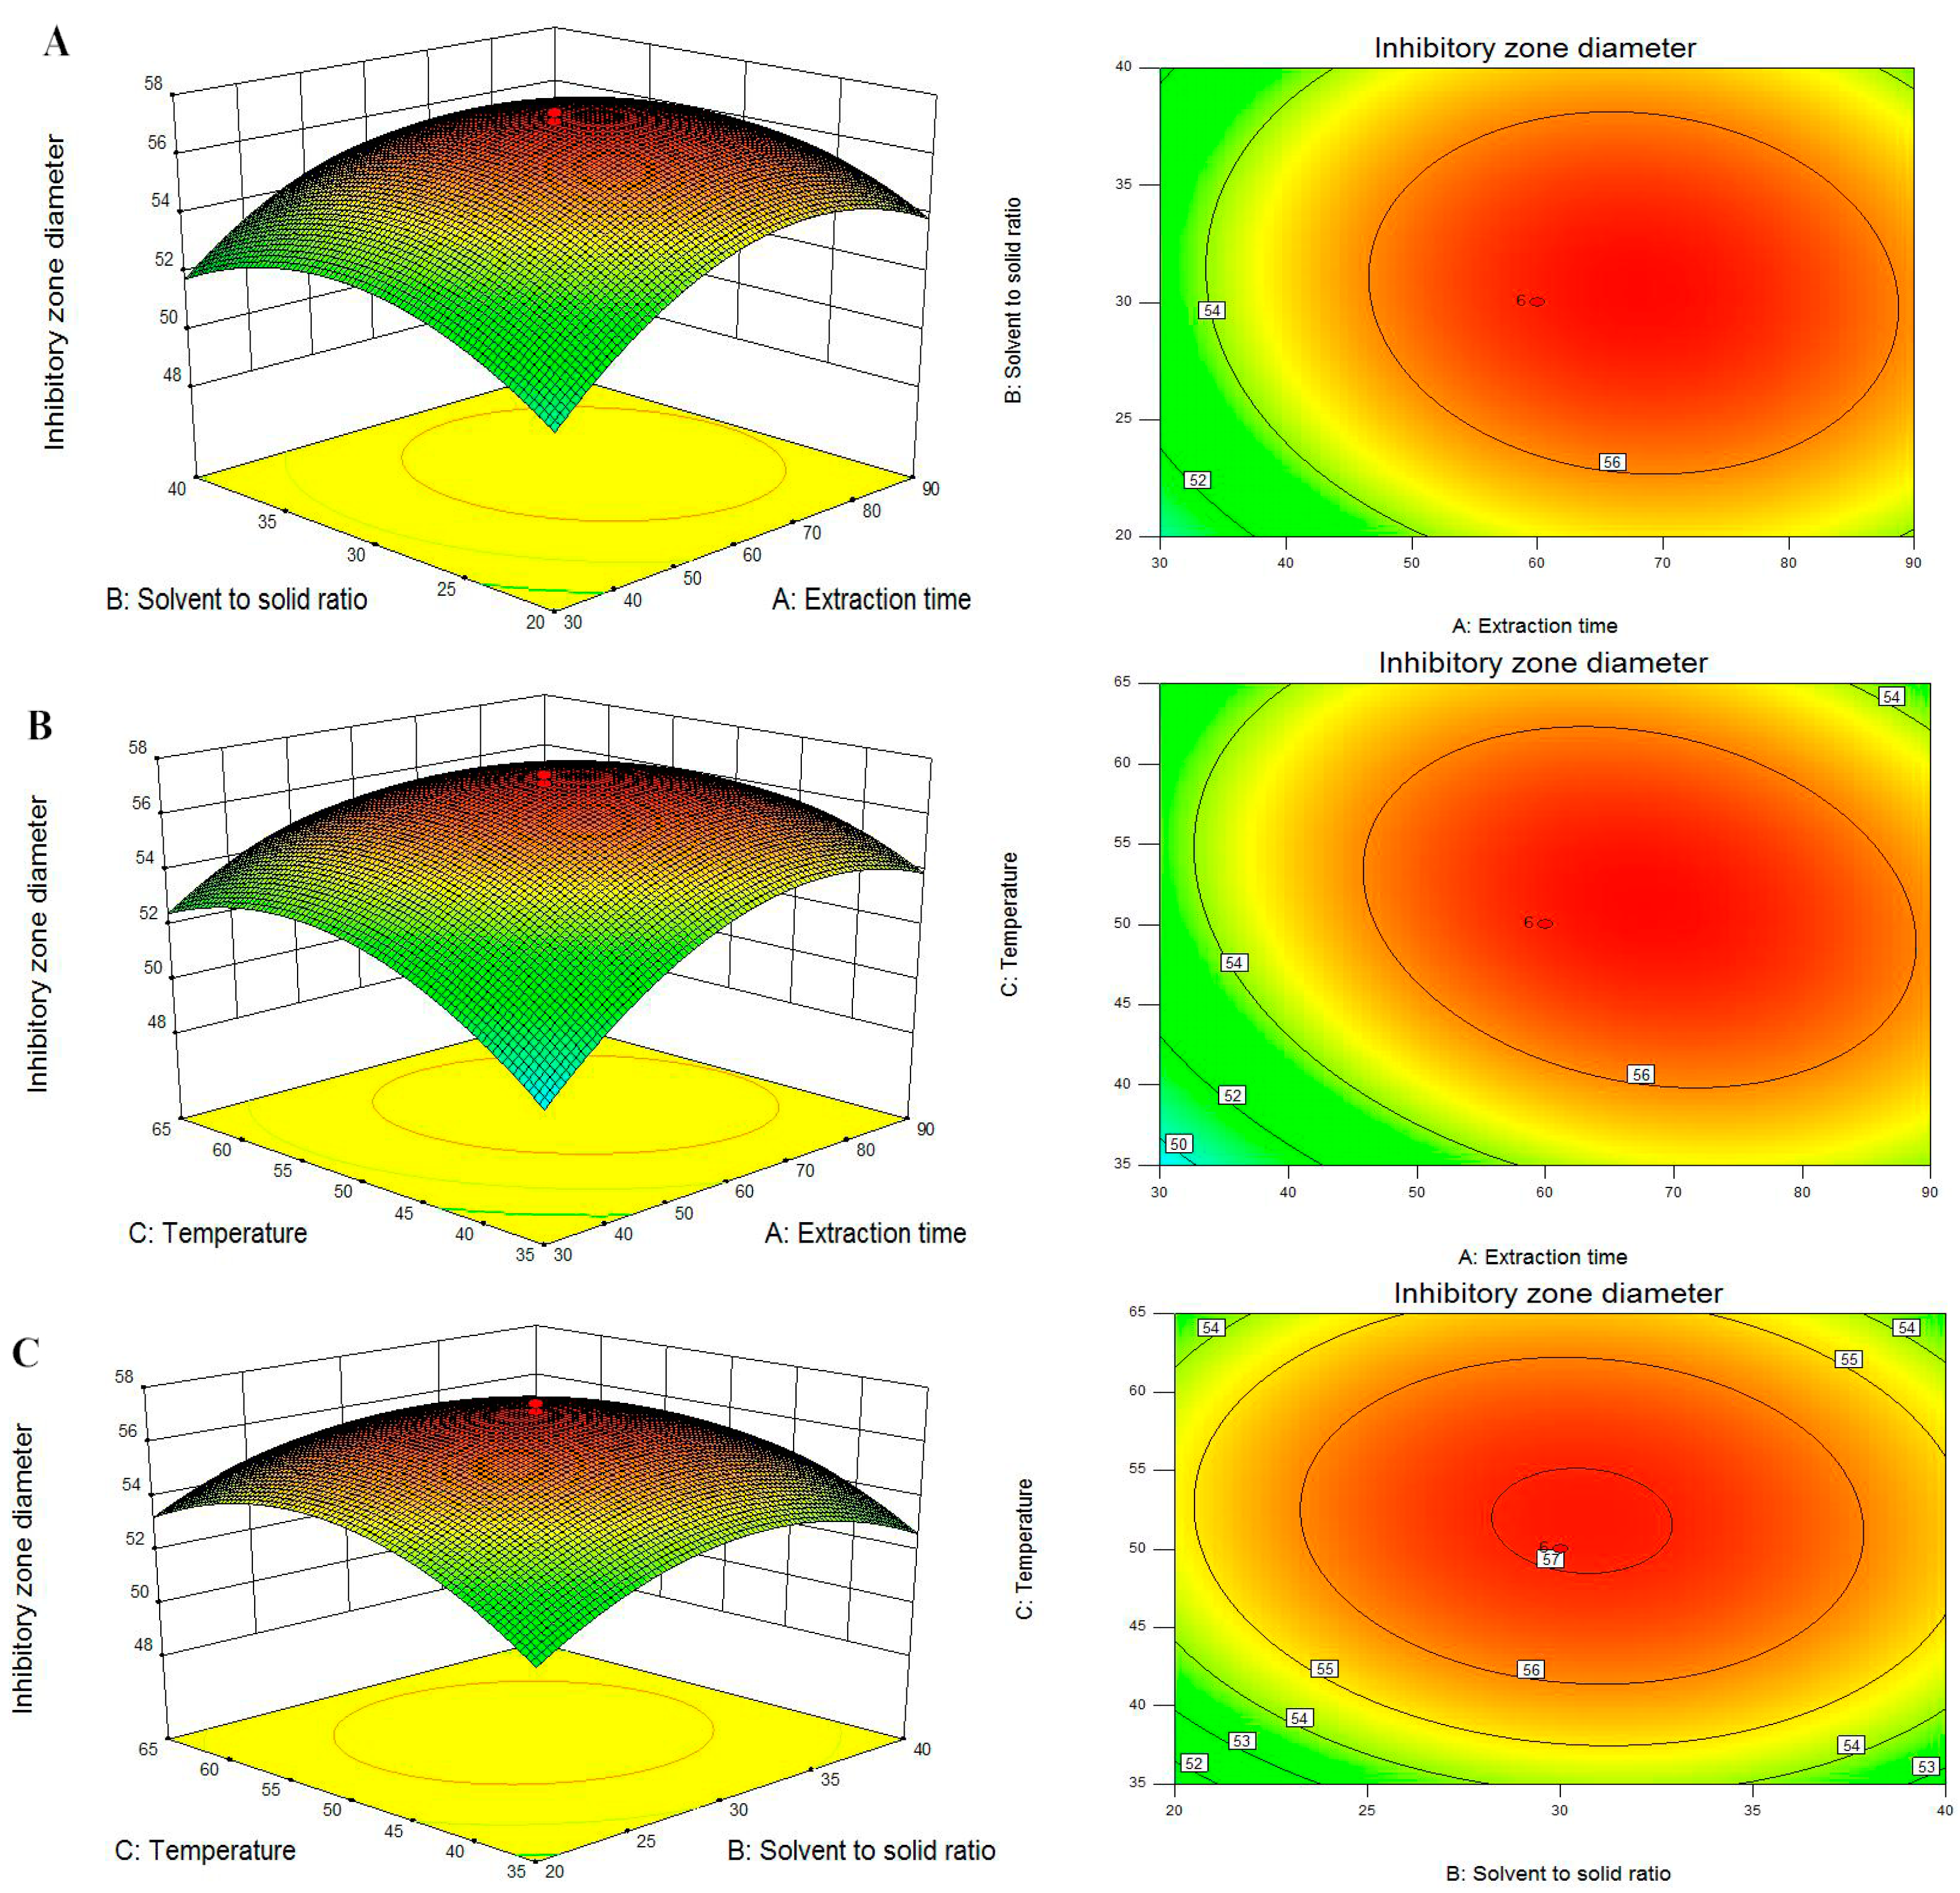
F-values for the lack of fit were 0.1503 and 0.1381, which is insignificant relative to the pure errors, thereby confirming the validity of the model. At the same time, the very low values (0.67 and 0.73) of coefficient of variation (CV) clearly declared a very high degree of precision and a good deal of reliability of the experimental values.The three-dimensional (3D) response surfaces and two-dimensional (2D) contour plots are the graphical representations of regression equation, which provide a method to visually display the relationship between responses and experimental levels of each independent variable and the type of interactions between two test variables [
25]. From the 3D response surfaces and 2D contours shown in
Figure 3 and
Figure 4, each figure shows the effects of the two independent variables and their mutual interactions on the DIZs against
P. italicum and
P. digitatum while the third one was kept at zero level.
Figure 3A and
Figure 4A are the 3D plots and contour plots showing the effect of extraction time and solvent to solid ratio on the response at a fixed temperature. From these figures, it can be clearly seen that DIZs against
P. italicum and
P. digitatum increased with increasing extraction time and solvent to solid ratio, but further increasing the solvent to solid ratio would not significantly increase the DIZs. The results are in accordance with single factor test and the ANOVA analysis (
Table 2). The results are also in agreement with reports by the authors reporting the extraction of continentalic acid from the root of
Aralia continentalis [
26].
Figure 3B and
Figure 4B show the 3D plots and contour plots at varying extraction time and temperature. As shown in these figures, the DIZs against
P. italicum and
P. digitatum increased with increasing extraction time and temperature of the raw material at the initial stage. Any additional increase in the extraction temperature had only a slight effect on DIZs. A similar trend has been reported for
Andrographis paniculata diterpenoids [
27] and
Mangifera indica L. mangiferin [
28].
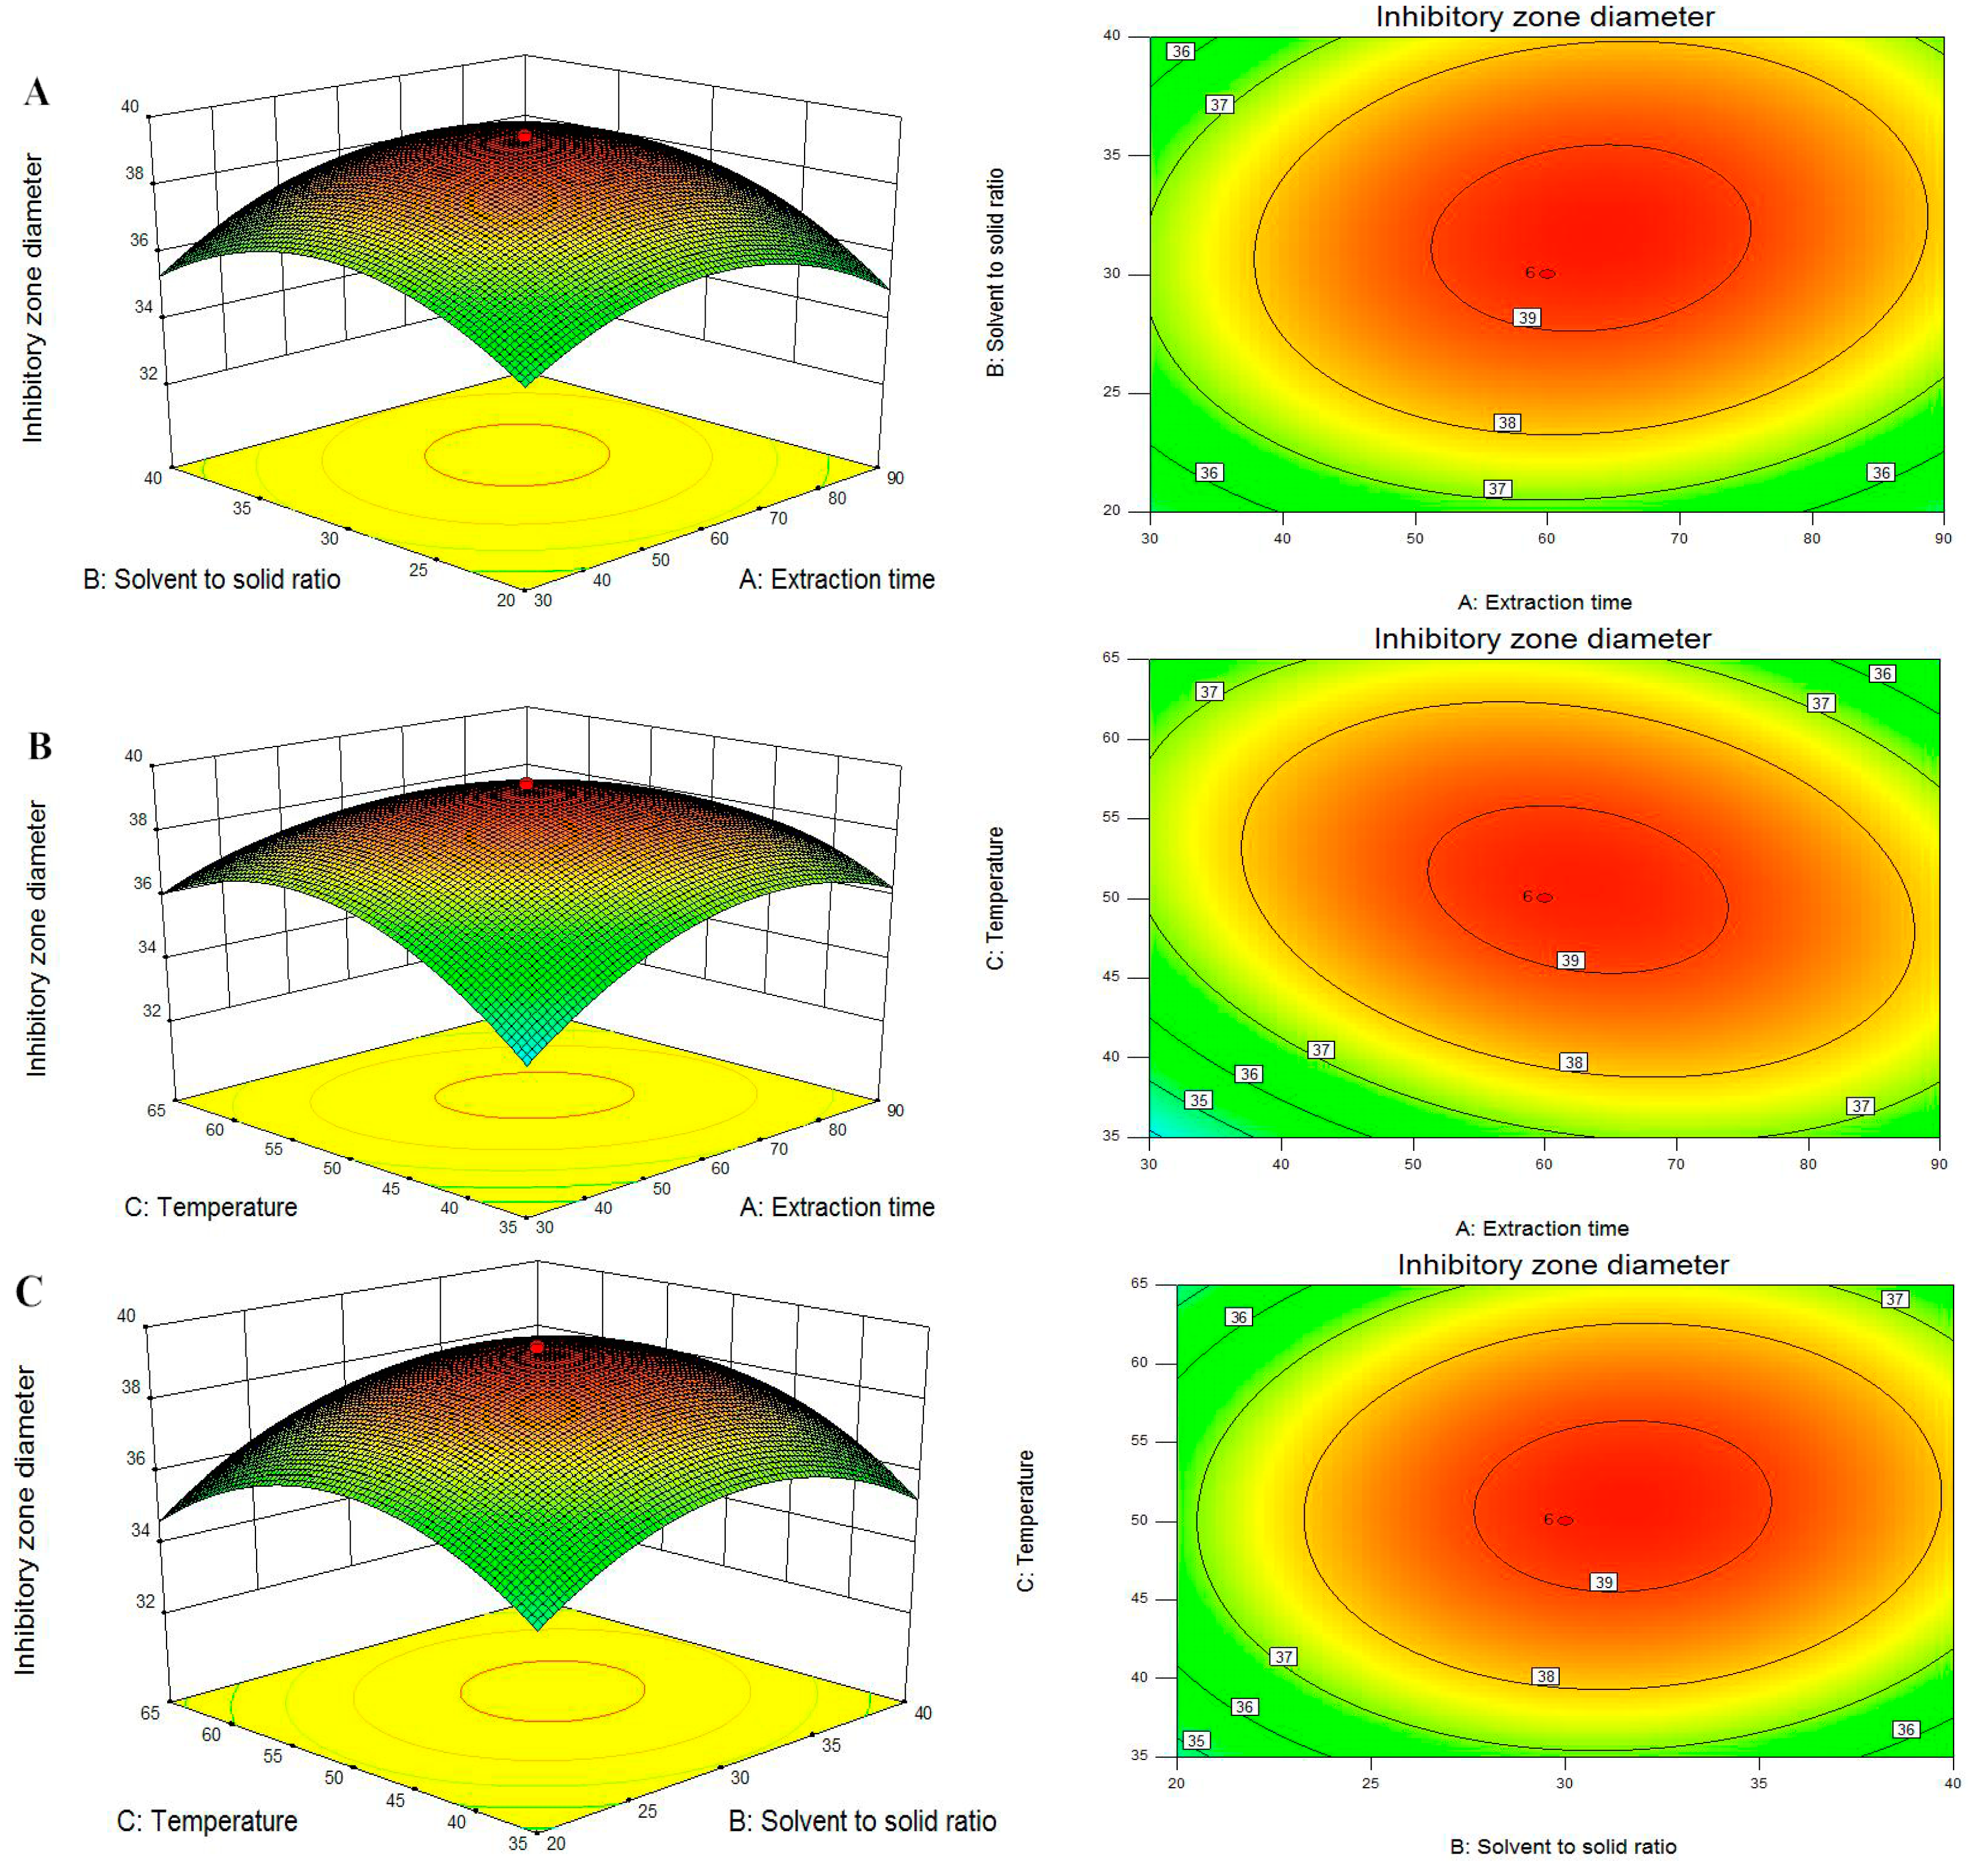
The 3D plots and the contour plots based on the independent variables solvent to solid ratio and extraction temperature are shown in
Figure 3C and
Figure 4C, while the extraction time was kept at zero level (60 min). The variation trends of DIZs against
P. italicum and
P. digitatum reached a maximum, and beyond this point, additional increases in the solvent to solid ratio and extraction temperature did not improve the DIZs.
Figure 3.
Response surface plot and contour plot showing DIZs against P. italicum of extraction time and solvent to solid ratio (A); extraction time and temperature (B) and solvent to solid ratio and temperature (C).
Figure 3.
Response surface plot and contour plot showing DIZs against P. italicum of extraction time and solvent to solid ratio (A); extraction time and temperature (B) and solvent to solid ratio and temperature (C).
Figure 4.
Response surface plot and contour plot showing DIZs against P. digitatum of extraction time and solvent to solid ratio (A); extraction time and temperature (B) and solvent to solid ratio and temperature (C).
Figure 4.
Response surface plot and contour plot showing DIZs against P. digitatum of extraction time and solvent to solid ratio (A); extraction time and temperature (B) and solvent to solid ratio and temperature (C).
To sum up, from the 3D response surfaces and contour plots, the optimum extraction parameters within the experimental ranges were extraction time 67.25 and 62.98 min, solvent to solid ratio 30.38 and 31.37 mL/g, temperature 51.06 and 50.66 °C, respectively. Under these conditions, the maximum predicted DIZs against P. italicum and P. digitatum were 57.26 and 39.29 mm.
2.5. Antifungal Spectrum of FH Extracts
Under the optimal extraction conditions, the FH extracts showed potent
in vitro antifungal effects against the nine phytopathogens, measured as EC
50 values. As shown in
Table 5, the EC
50 values of FH extracts against the tested phytopathogens were found in the range of 5–40 mg/mL. The main reason is that the bioactivities varied depending on the phytopathogens tested, leading to different values of its EC
50. The FH extracts exhibited the more efficient activity against
P. italicum,
A. citri,
P. vexans,
P. cytosporella and
P. digitatum, and had weaker activity against
B. cinerea,
B. dothidea and
A. alternate. In this assay,
P. italicum,
P. digitatum,
A. citri,
P. cytosporella and
G. citri-aurantii, which are the causal agents of postharvest citrus blue mold, green mold, black rot, stem-end rot and sour rot, were found to be extremely susceptible phytopathogens to the FH extracts, with EC
50 values of 5.04, 7.95, 5.15, 7.01 and 13.06 mg/mL. In addition,
B. cinerea,
B. dothidea and
A. alternate showed less susceptibility to the FH extracts with high EC
50 values. FH extract showed strong antifungal activity against the nine phytopathogens under
in vitro conditions and had a broad antifungal spectrum compared with the results of Askarne and Talibi, who have previously reported that 100 mg/mL crude extracts of several Moroccan plants, such as
Trichodesma calcaratum Coss. ex Batt.,
Ruta chalepensis L. and
Cistus crispus L. can effectively inhibited the mycelial growth at 47.4% to 57.7% of citrus blue mold, and also found that 100 mg/mL aqueous extracts from
Cistus crispus L. and
Trichodesma calcaratum Coss. ex Batt. totally inhibited 44.4% and 52.5% of citrus sour rot [
29,
30].
Table 5.
Toxicities of the FH extracts against phytopathogens.
Table 5.
Toxicities of the FH extracts against phytopathogens.
| Species | Toxicity Regression Equation | R2 | EC50 (mg/mL) |
|---|
| P. italicum | Y = 4.1301 + 1.5571X | 0.9963 | 5.04 |
| A. citri | Y = 4.4794 + 0.7442X | 0.9894 | 5.15 |
| P. vexans | Y = 3.3269 + 1.8864X | 0.9940 | 6.98 |
| P. cytosporella | Y = 3.9207 + 1.4206X | 0.9982 | 7.01 |
| P. digitatum | Y = 3.3381 + 1.7307X | 0.9978 | 7.95 |
| G. citri-aurantii | Y = 3.2278 + 1.2738X | 0.9905 | 13.06 |
| B. cinerea | Y = 3.4513 + 1.2602X | 0.9884 | 22.43 |
| B. dothidea | Y = 3.4036 + 1.2048X | 0.9957 | 25.80 |
| A. alternate | Y = 3.1294 + 1.1674X | 0.9914 | 39.21 |


