
Qualitative and Quantitative Analysis of Phenolic Acids, Flavonoids and Iridoid Glycosides in Yinhua Kanggan Tablet by UPLC-QqQ-MS/MS

Abstract
:1. Introduction
2. Results and Discussion
2.1. Optimization of Sample Preparation
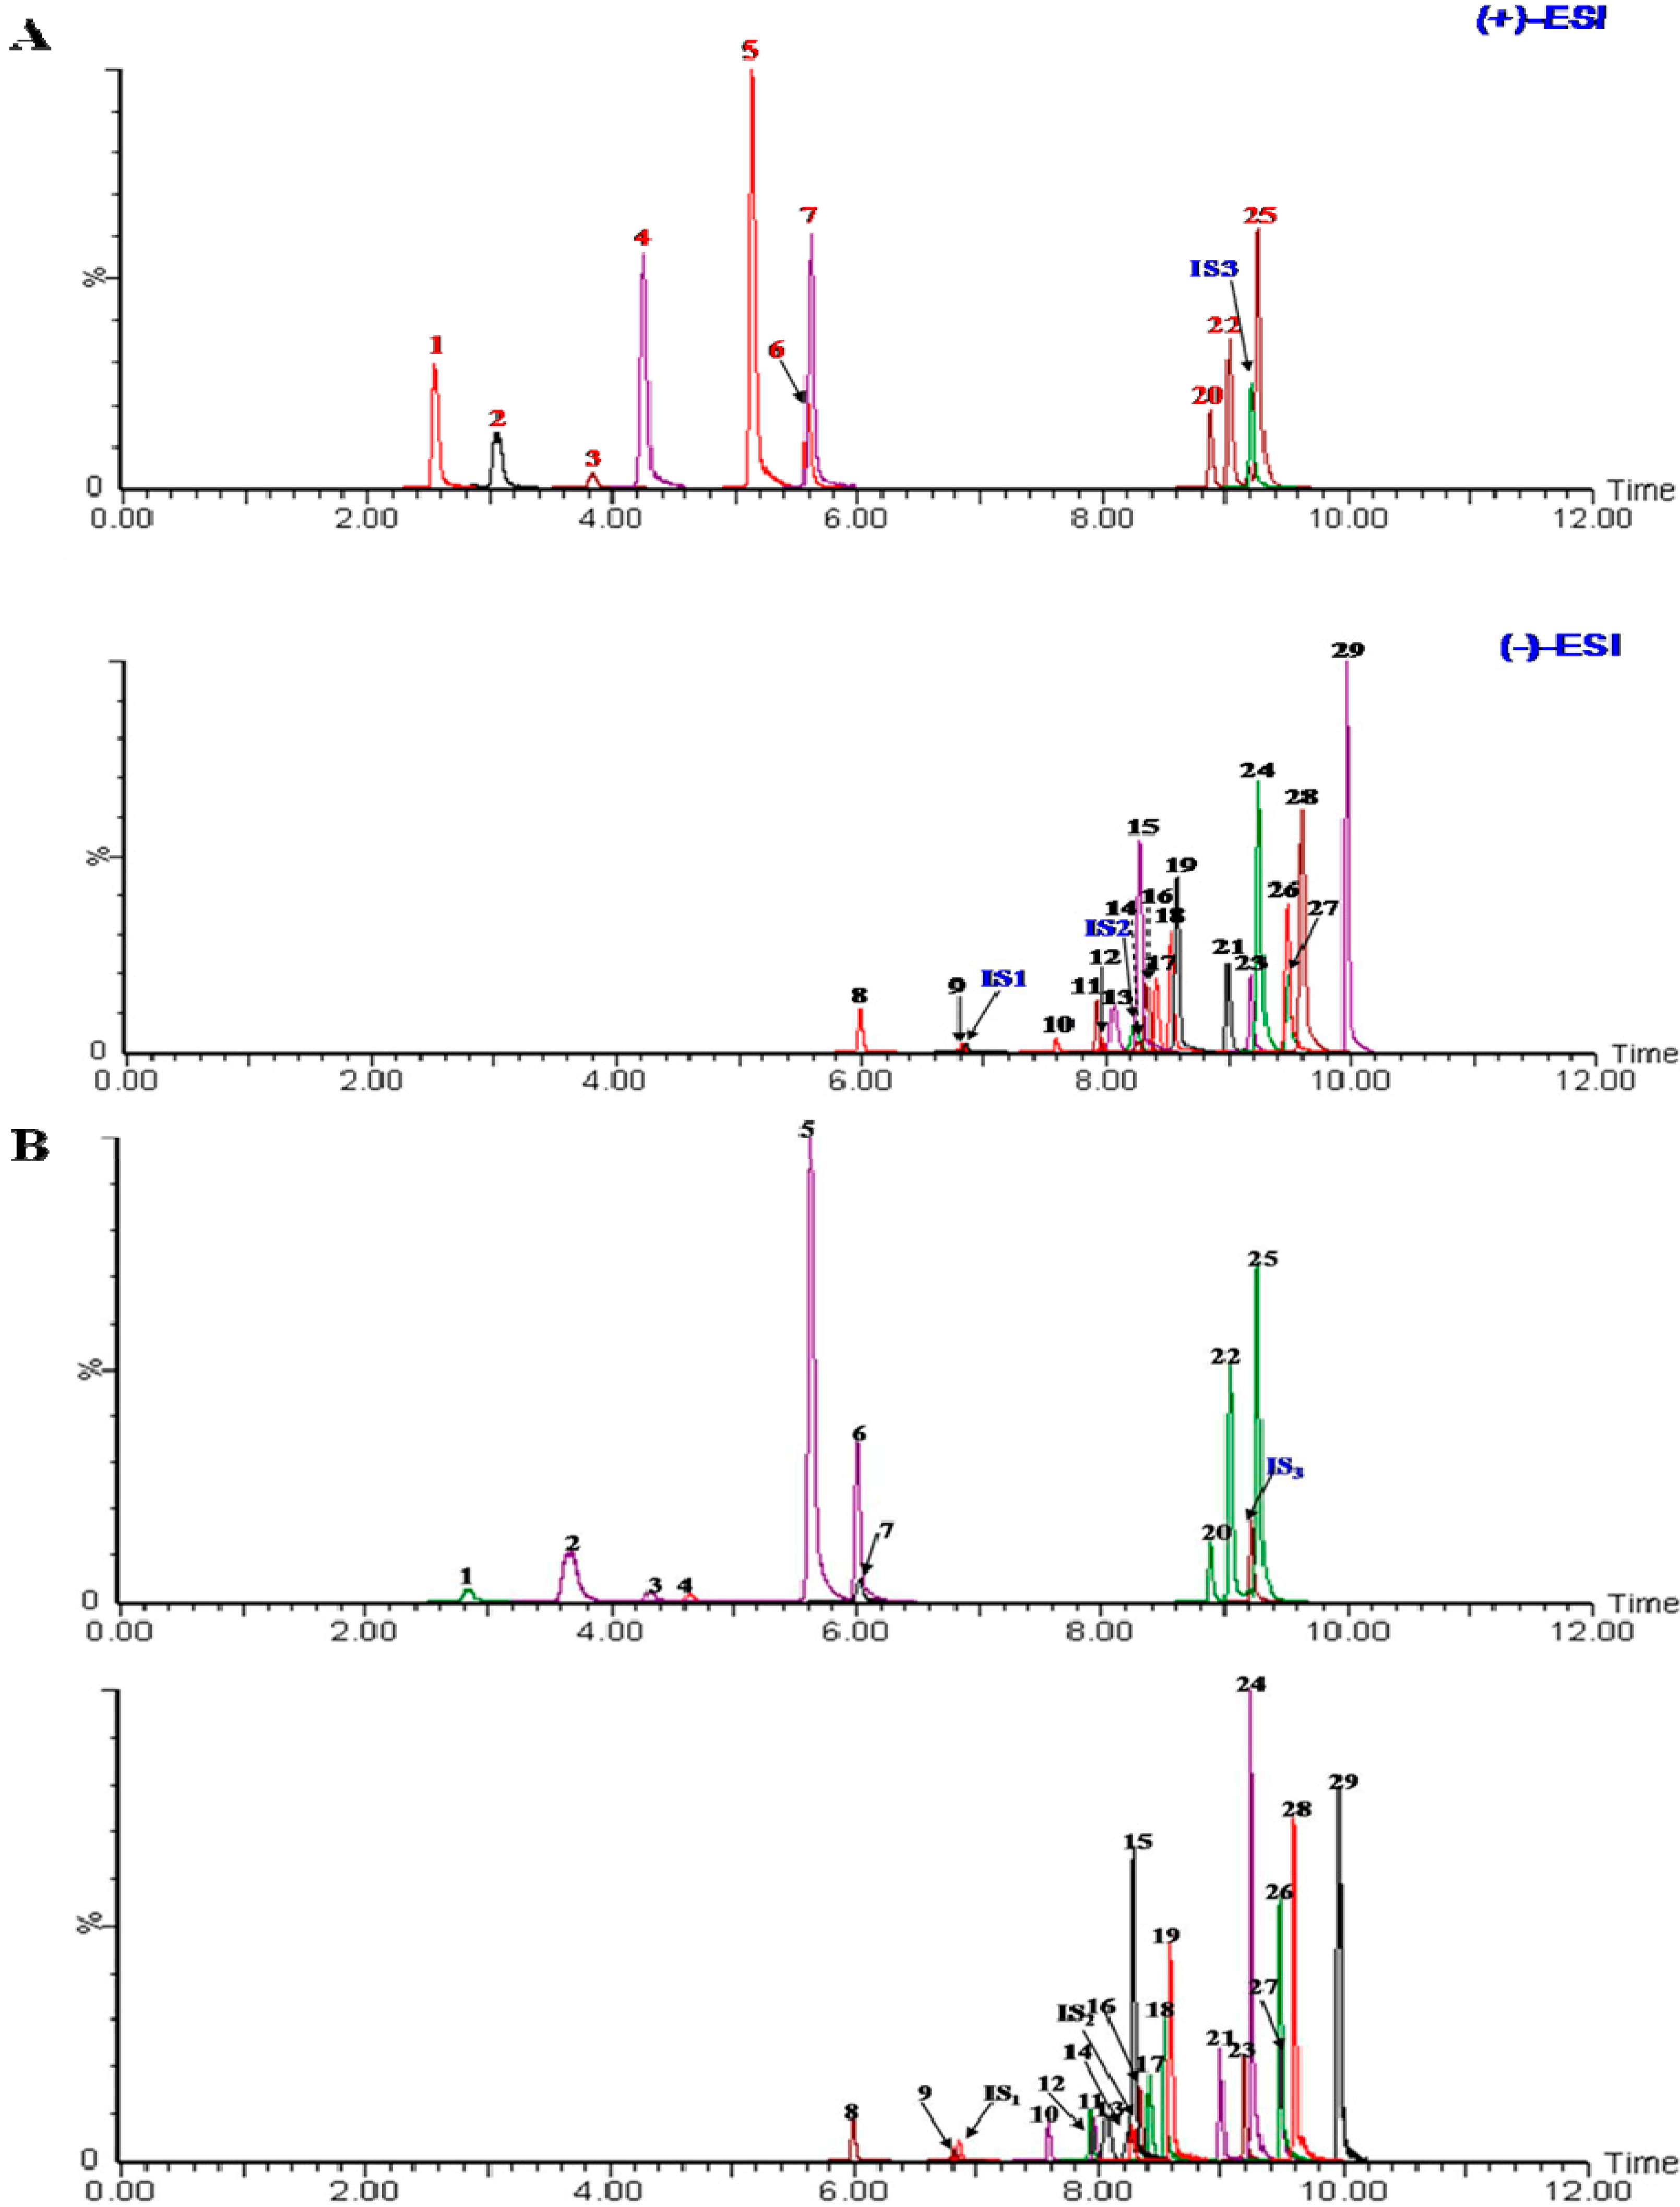
2.2. Optimization of Chromatographic Conditions

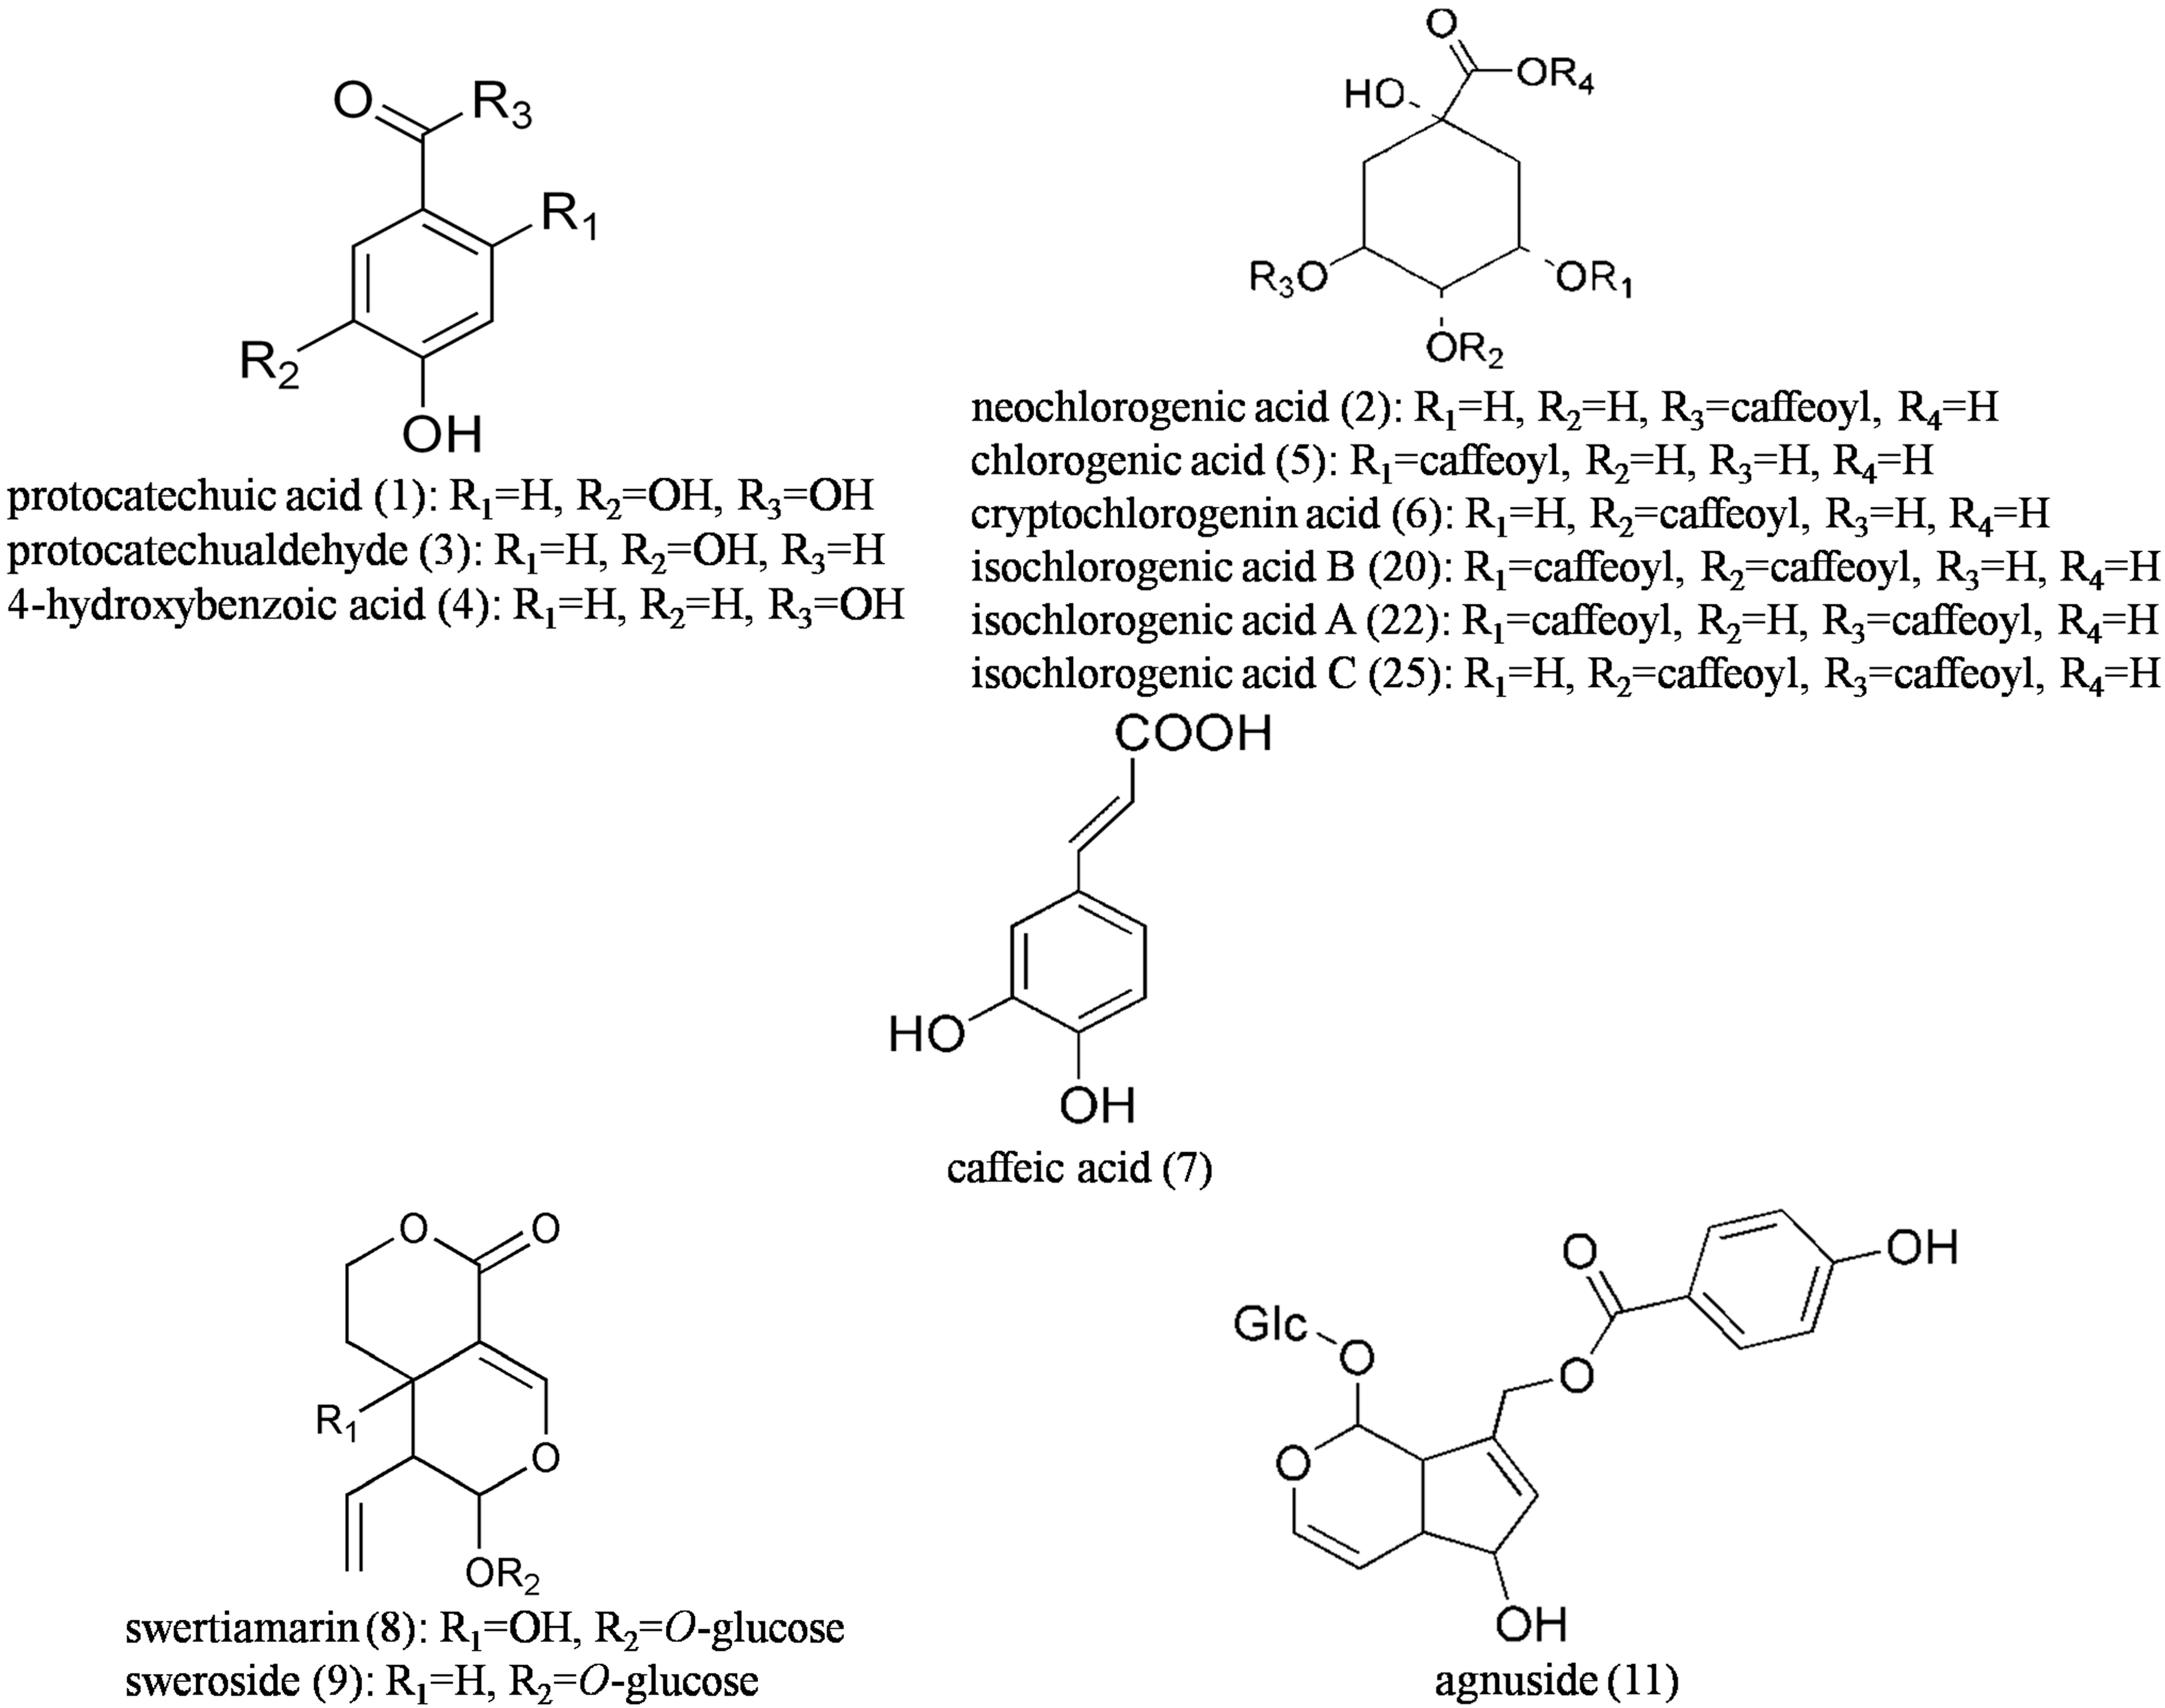
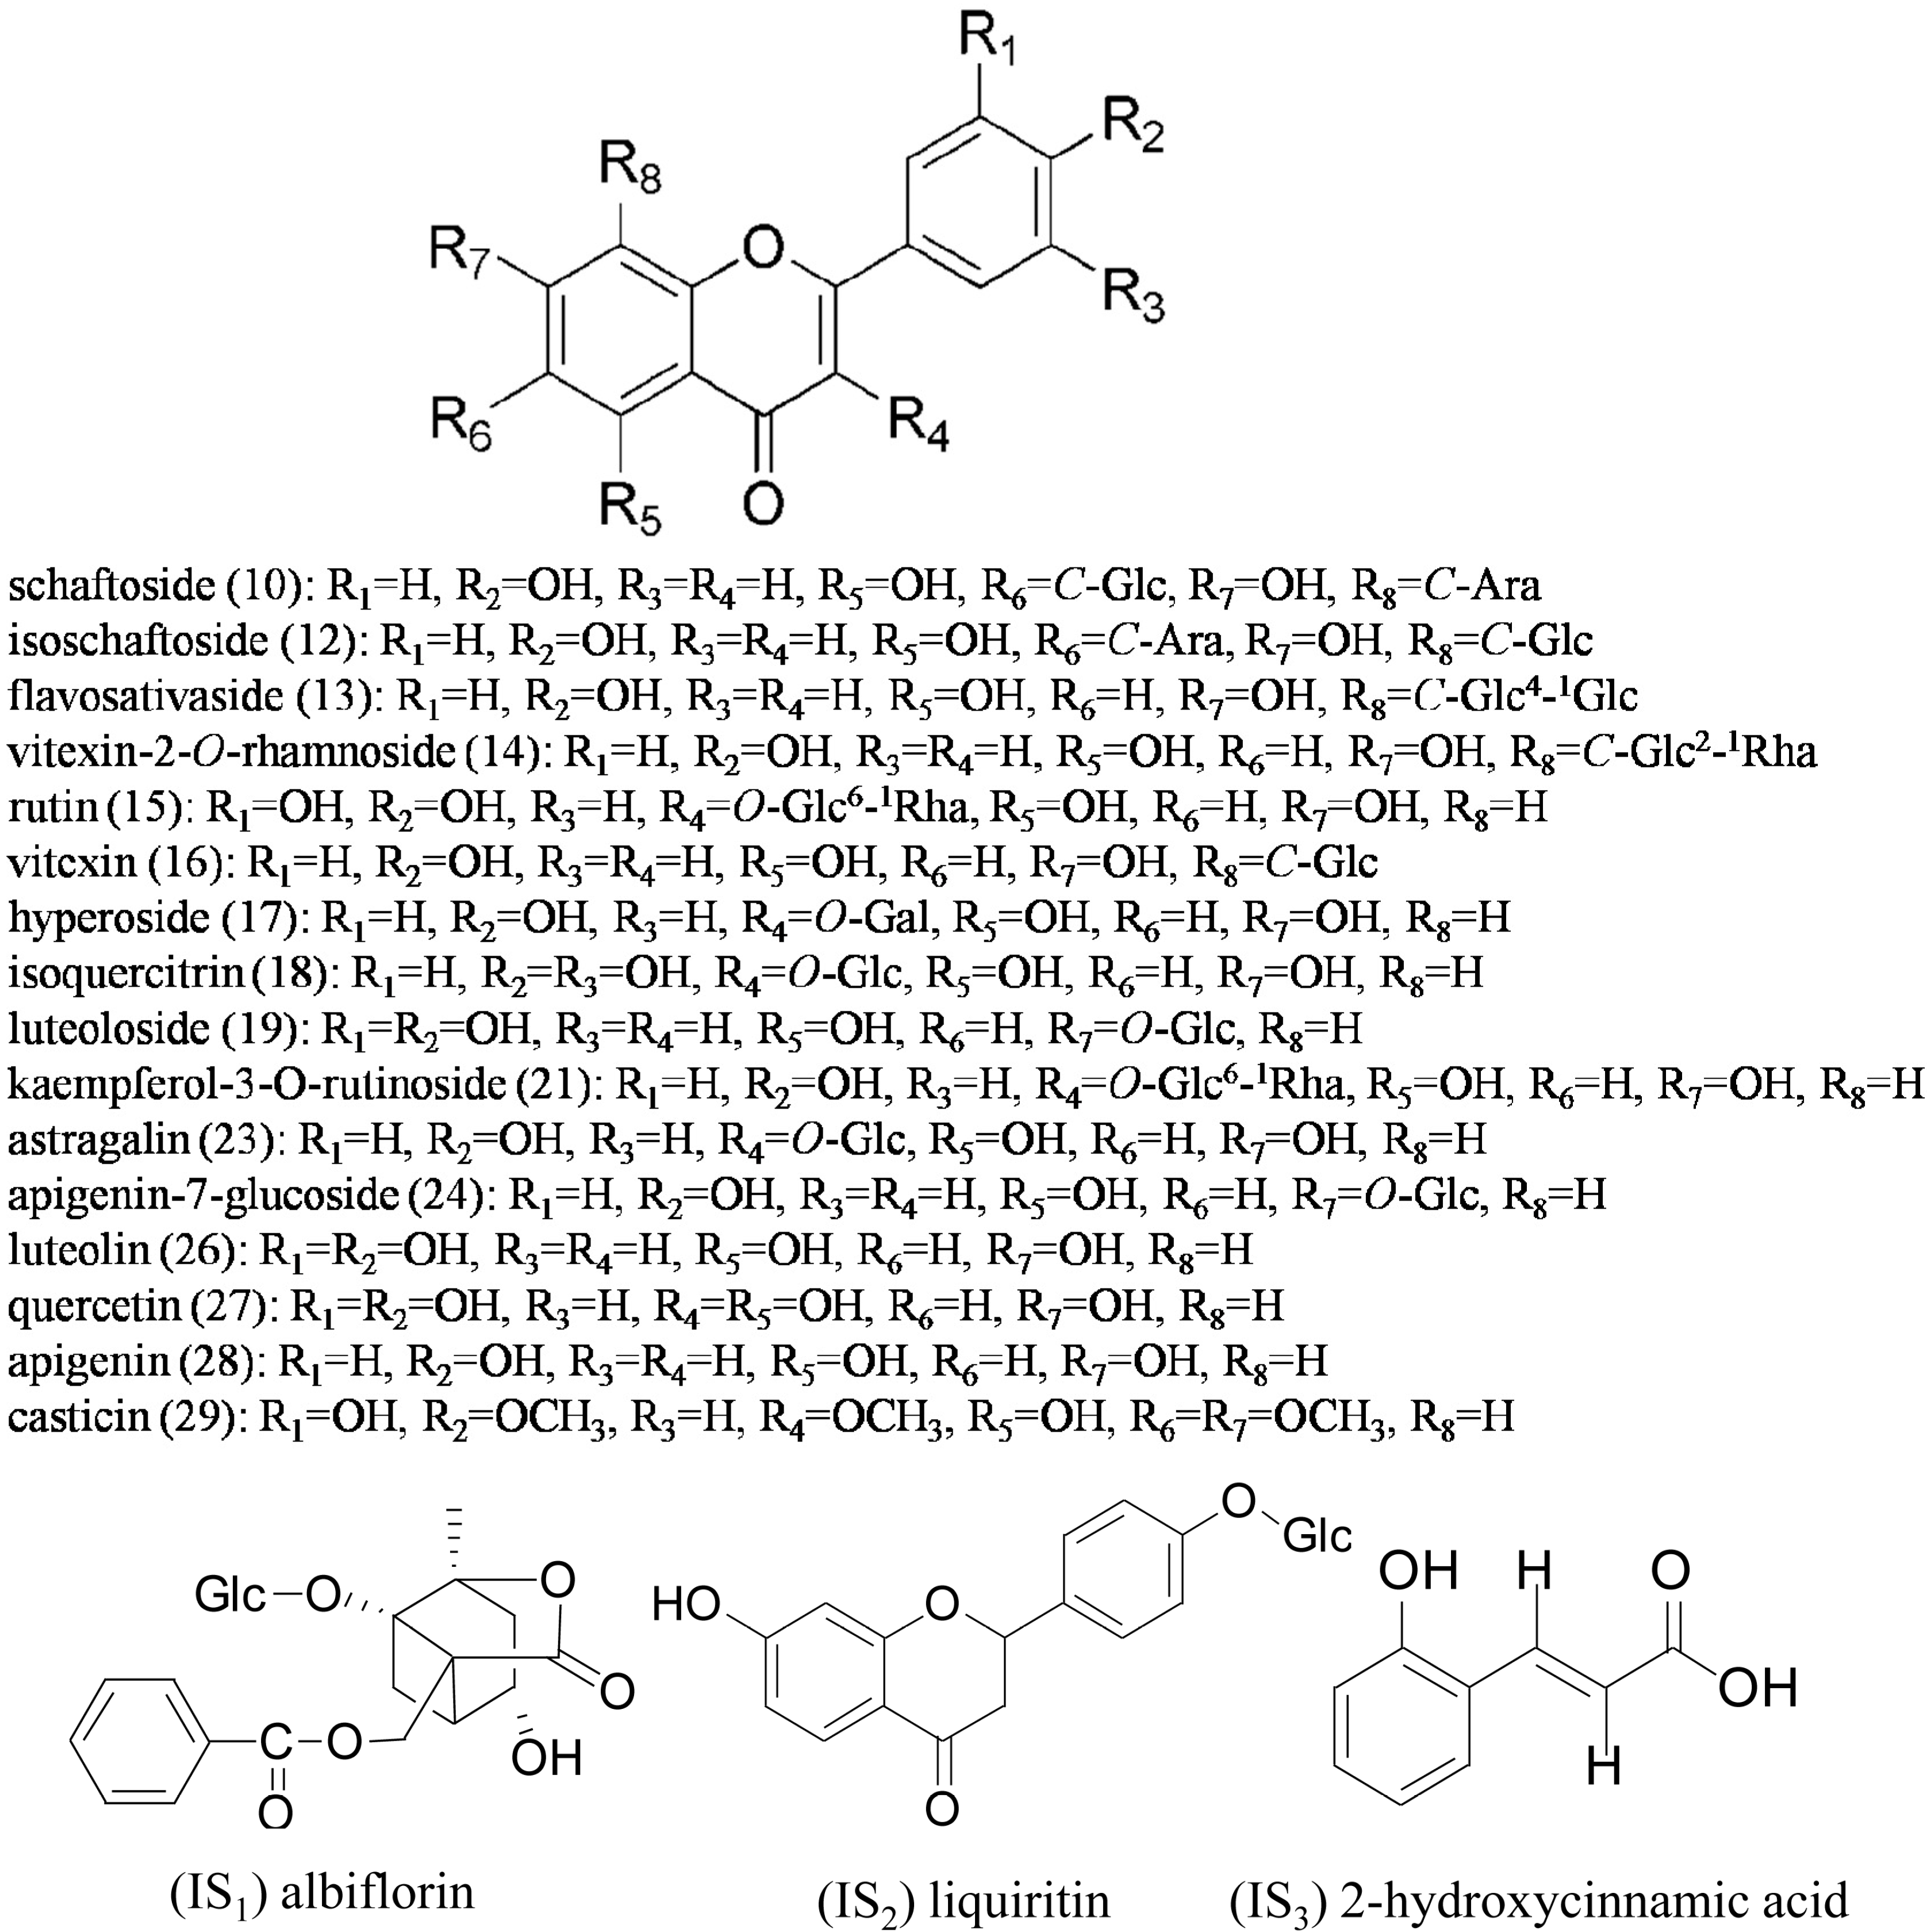
| Compounds | tR (min) | Precursor Ion (m/z) | Product Ion (m/z) | Cone Voltage (V) | Collision Energy (eV) | Polarity |
|---|---|---|---|---|---|---|
| Protocatechuic acid | 2.52 | 155 | 93 | 25 | 12 | Positive |
| Neochlorogenic acid | 3.07 | 355 | 163 | 20 | 18 | Positive |
| Protocatechualdehyde | 3.85 | 139 | 93 | 25 | 15 | Positive |
| p-Hydroxybenzoic acid | 4.25 | 139 | 121 | 15 | 10 | Positive |
| Chlorogenic acid | 5.15 | 355 | 163 | 20 | 18 | Positive |
| Cryptochlorogenin acid | 5.61 | 355 | 163 | 20 | 18 | Positive |
| Caffeic acid | 5.63 | 181 | 163 | 20 | 12 | Positive |
| Swertiamarin | 5.99 | 419 | 179 | 20 | 12 | Negative |
| Sweroside | 6.82 | 403 | 179 | 25 | 12 | Negative |
| Schaftoside | 7.6 | 563 | 443 | 30 | 28 | Negative |
| Agnuside | 7.93 | 465 | 285 | 50 | 22 | Negative |
| Isoschaftoside | 7.97 | 563 | 443 | 30 | 28 | Negative |
| Flavosativaside | 8.00 | 593 | 413 | 50 | 22 | Negative |
| Vitexin 2′′-rhamnoside | 8.28 | 577 | 413 | 40 | 25 | Negative |
| Rutin | 8.33 | 609 | 300 | 35 | 35 | Negative |
| Vitexin | 8.35 | 431 | 311 | 45 | 20 | Negative |
| Hyperoside | 8.42 | 463 | 300 | 45 | 28 | Negative |
| Isoquercitrin | 8.53 | 463 | 300 | 45 | 28 | Negative |
| Luteoloside | 8.58 | 447 | 285 | 50 | 28 | Negative |
| Isochlorogenic acid B | 8.88 | 517 | 163 | 20 | 22 | Positive |
| Kaempferol-3-O-rutinoside | 8.99 | 593 | 285 | 35 | 30 | Negative |
| Isochlorogenic acid A | 9.04 | 517 | 163 | 20 | 22 | Positive |
| Astragalin | 9.19 | 447 | 285 | 35 | 22 | Negative |
| Apigenin-7-glucoside | 9.25 | 431 | 267 | 55 | 35 | Negative |
| Isochlorogenic acid C | 9.26 | 517 | 163 | 20 | 22 | Positive |
| Luteolin | 9.48 | 285 | 133 | 50 | 32 | Negative |
| Quercetin | 9.53 | 301 | 151 | 40 | 25 | Negative |
| Apigenin | 9.59 | 269 | 151 | 45 | 32 | Negative |
| Casticin | 9.97 | 373 | 343 | 35 | 22 | Negative |
| Albiflorin (IS1) | 6.85 | 525 | 121 | 25 | 25 | Negative |
| Liquiritin (IS2) | 8.28 | 417 | 255 | 25 | 20 | Negative |
| 2-Hydroxycinnamic acid (IS3) | 9.22 | 165 | 123 | 15 | 12 | Positive |

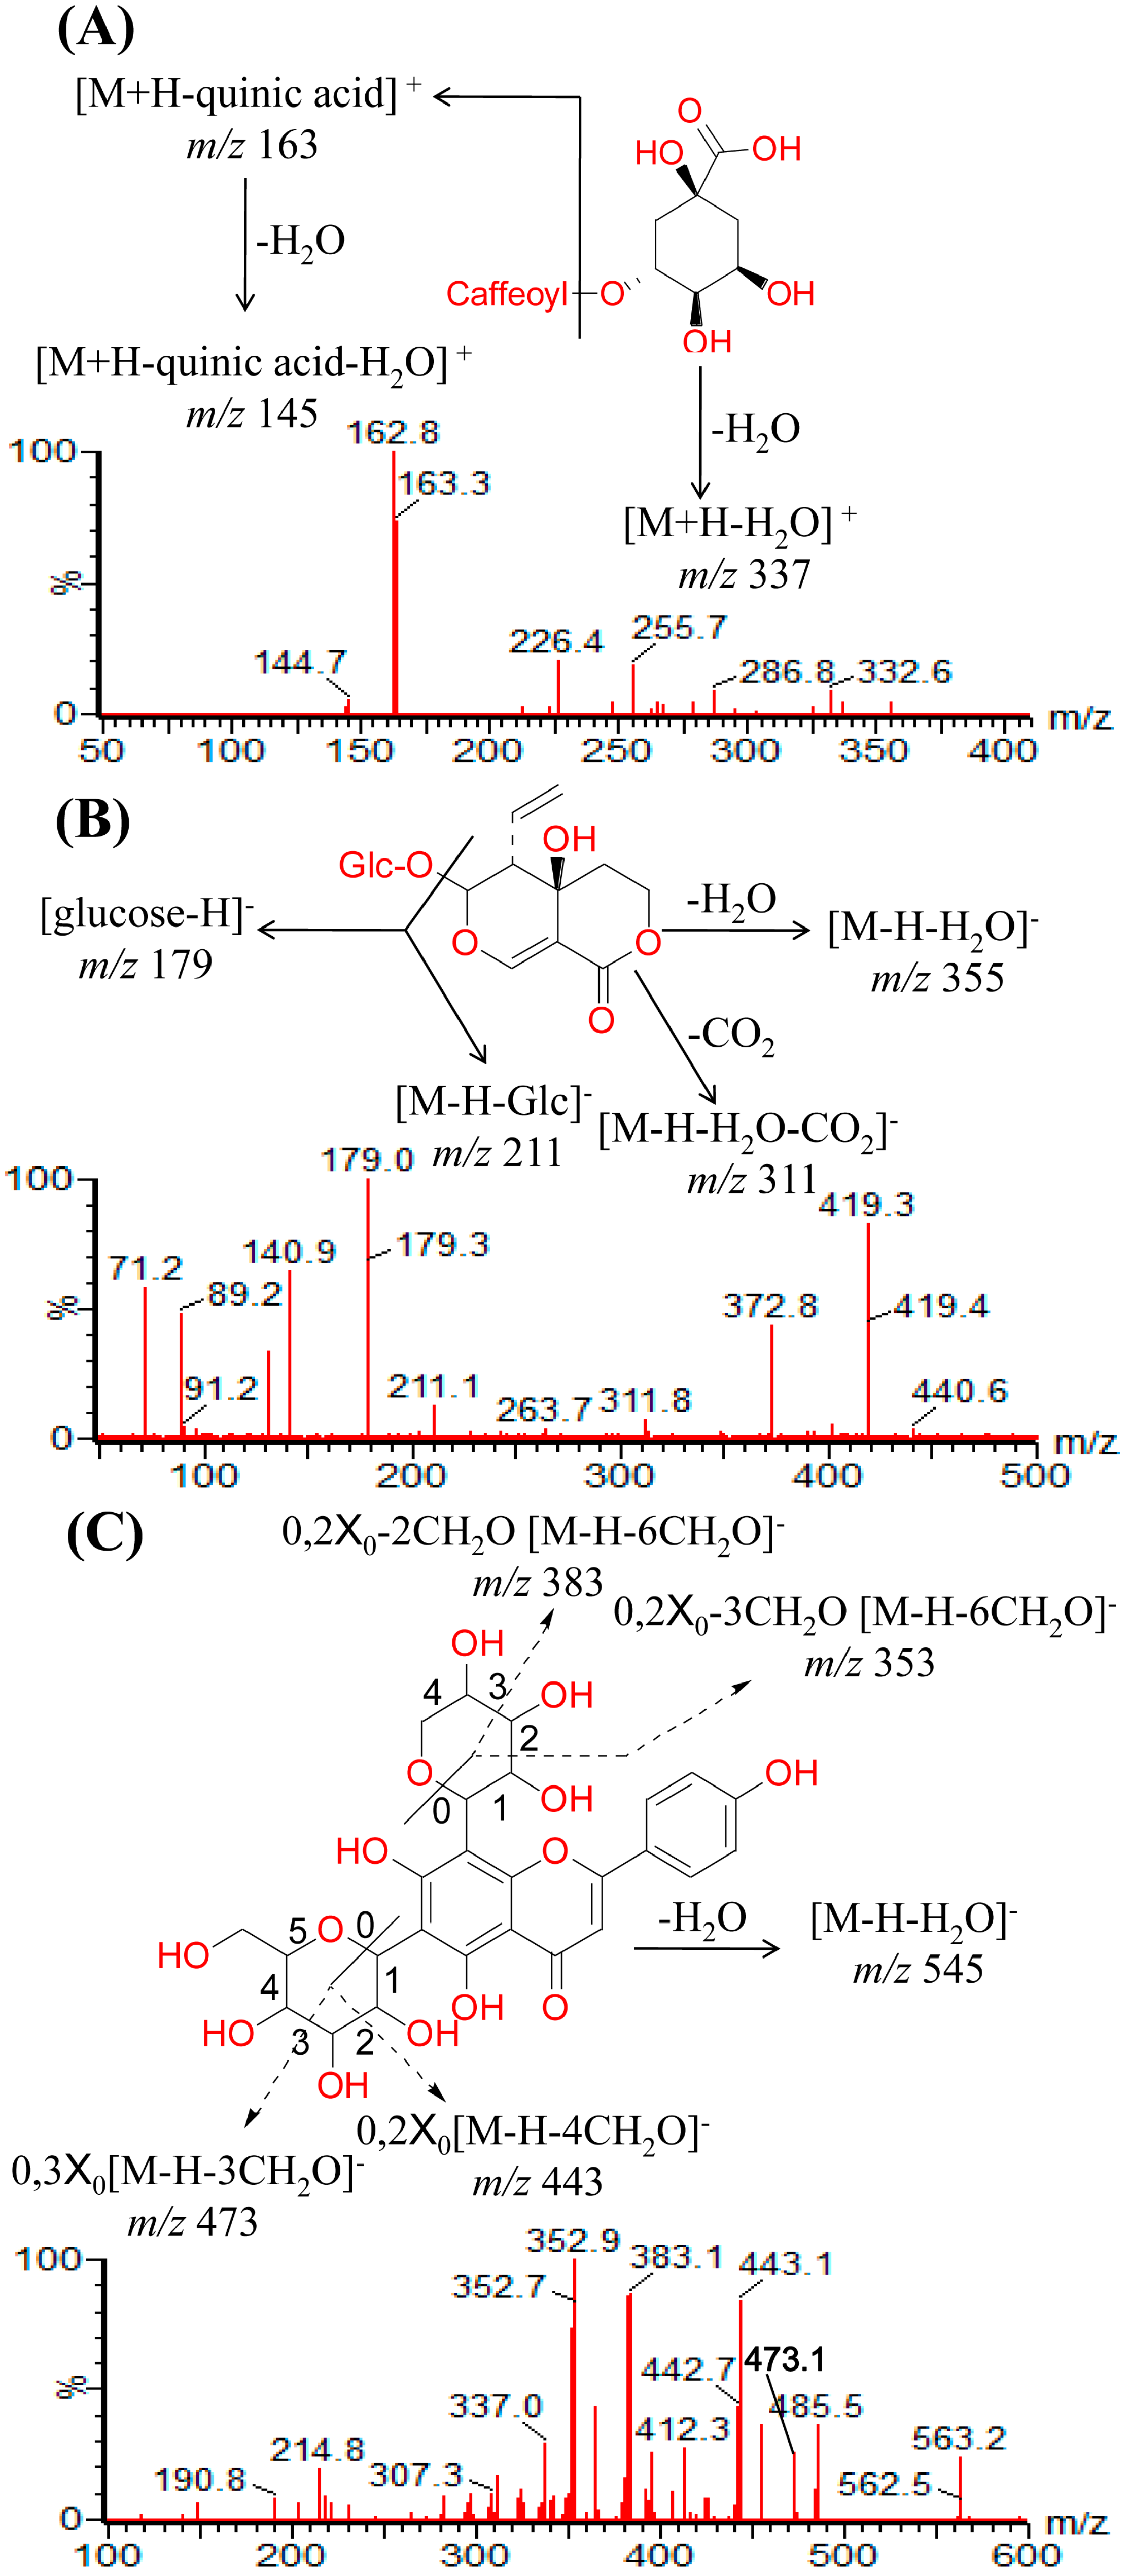
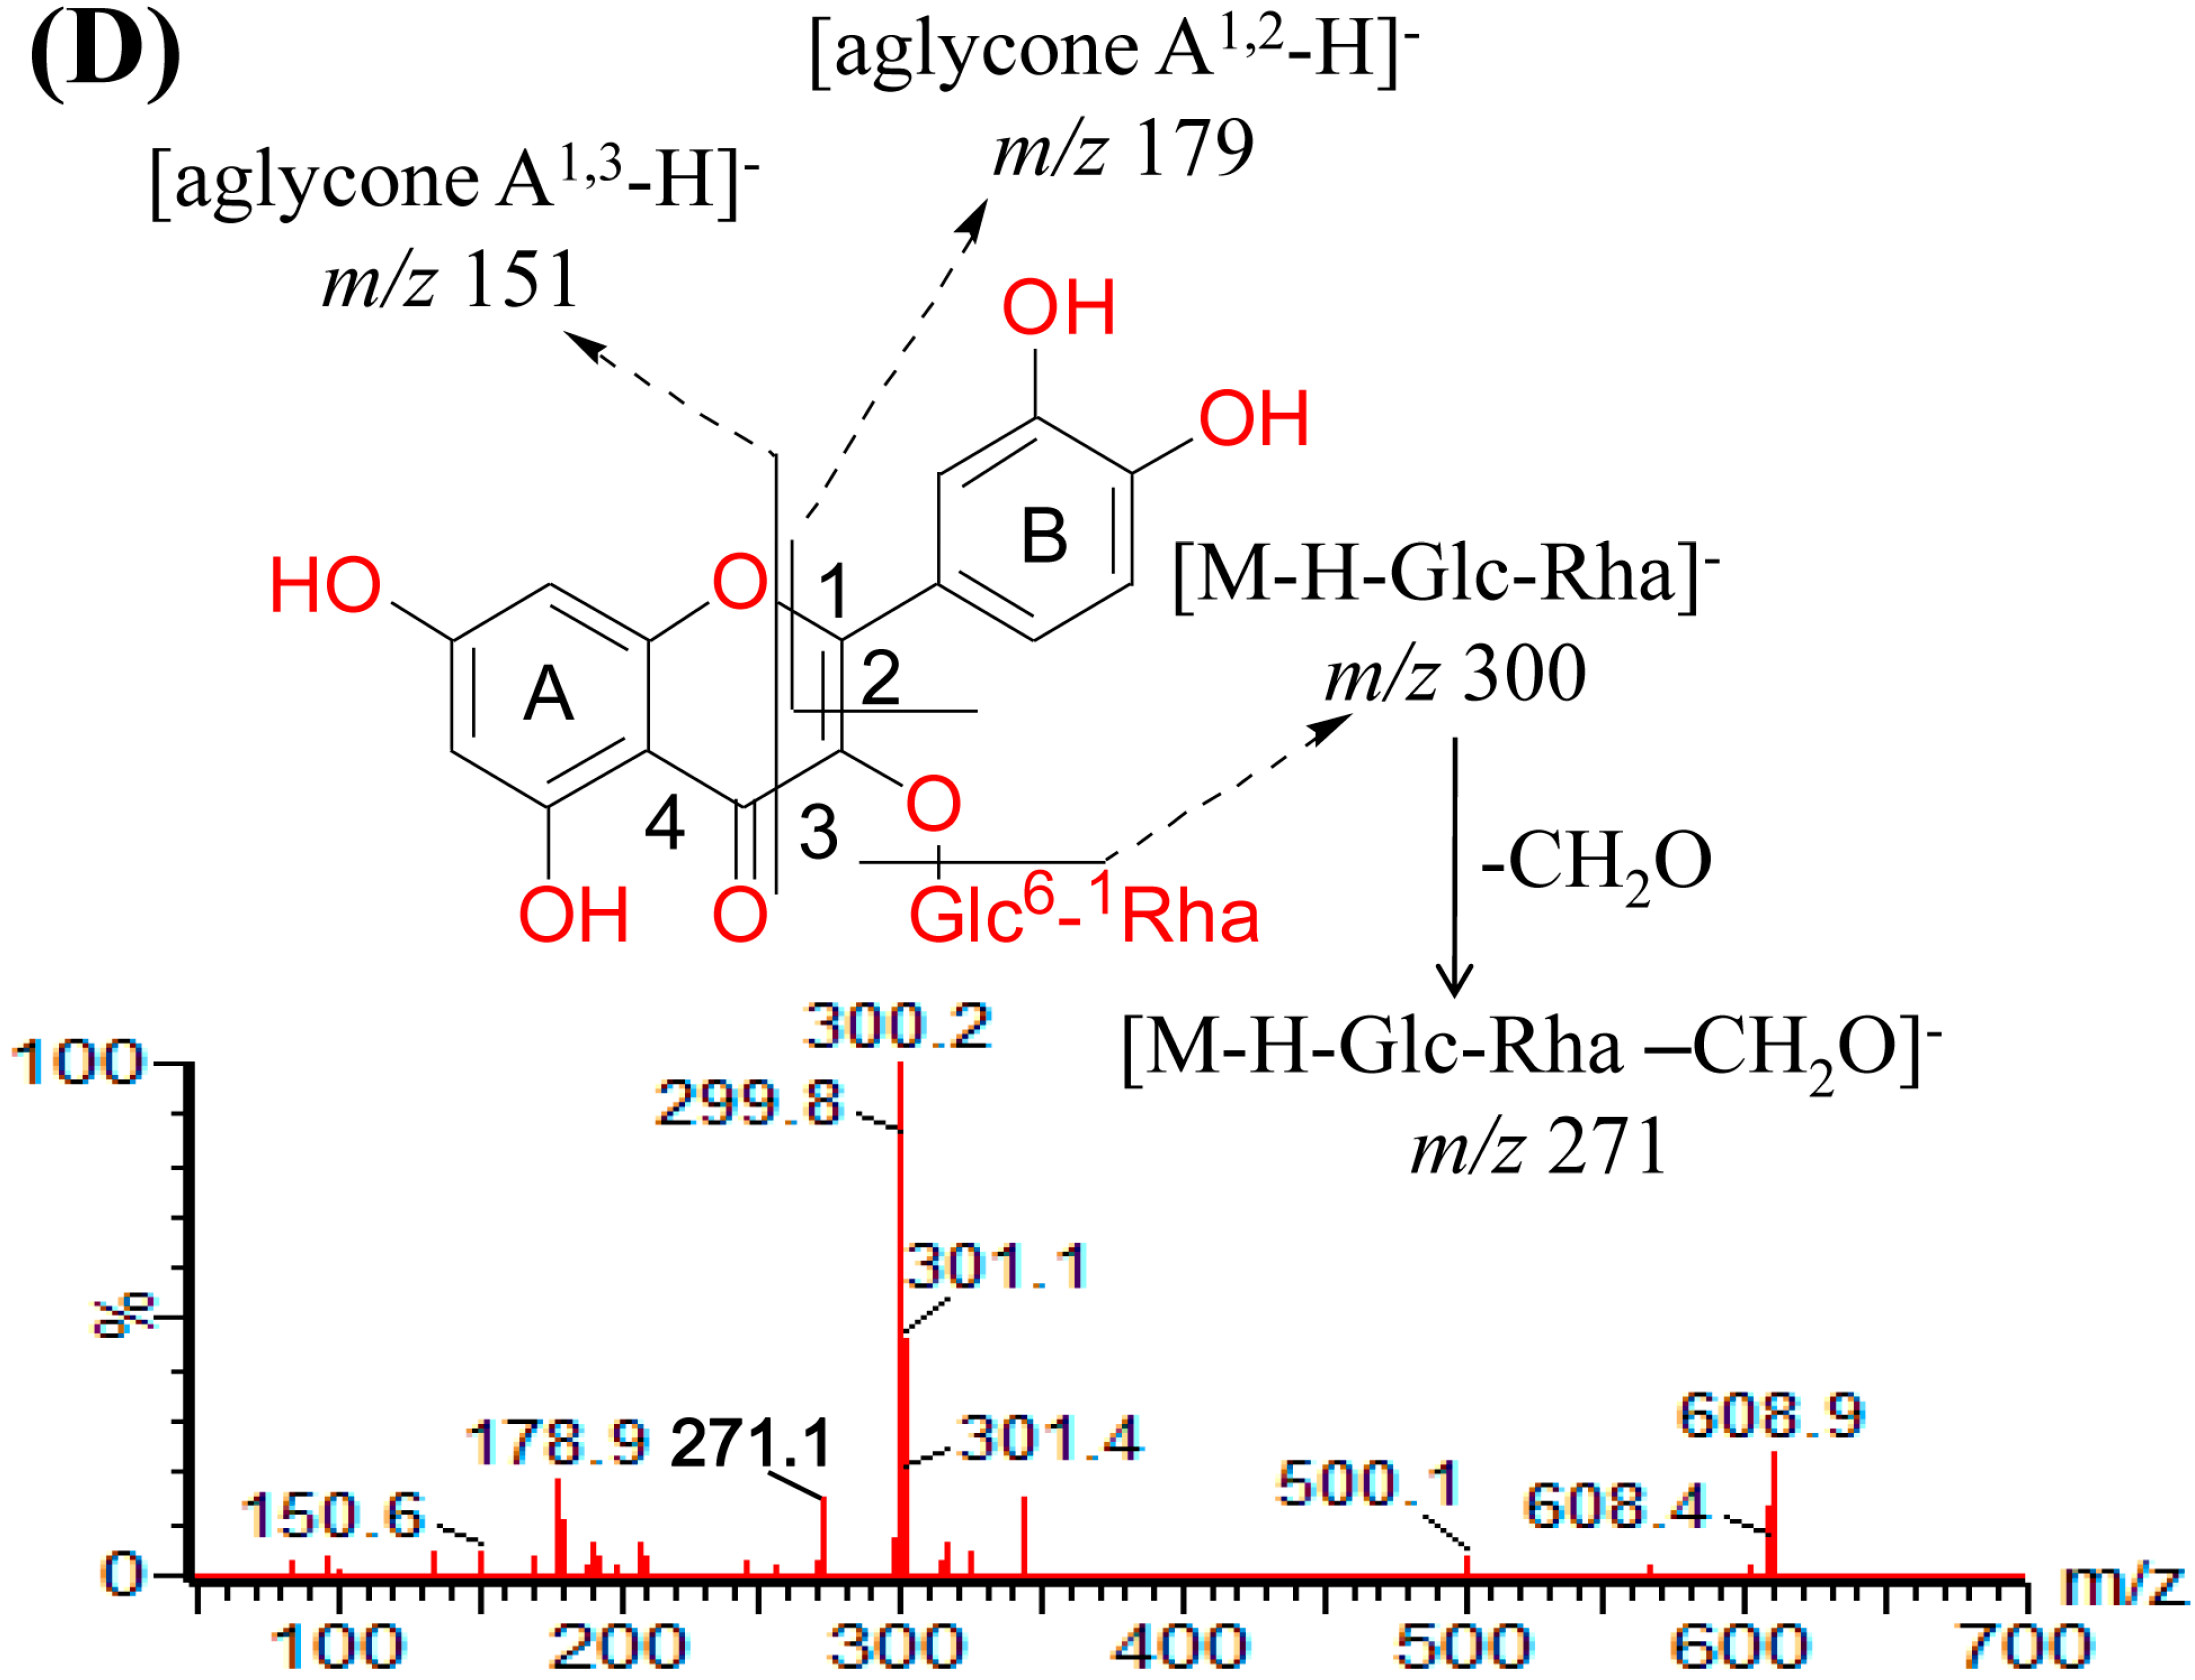
2.3. Identification of Compounds with UPLC-MS/MS


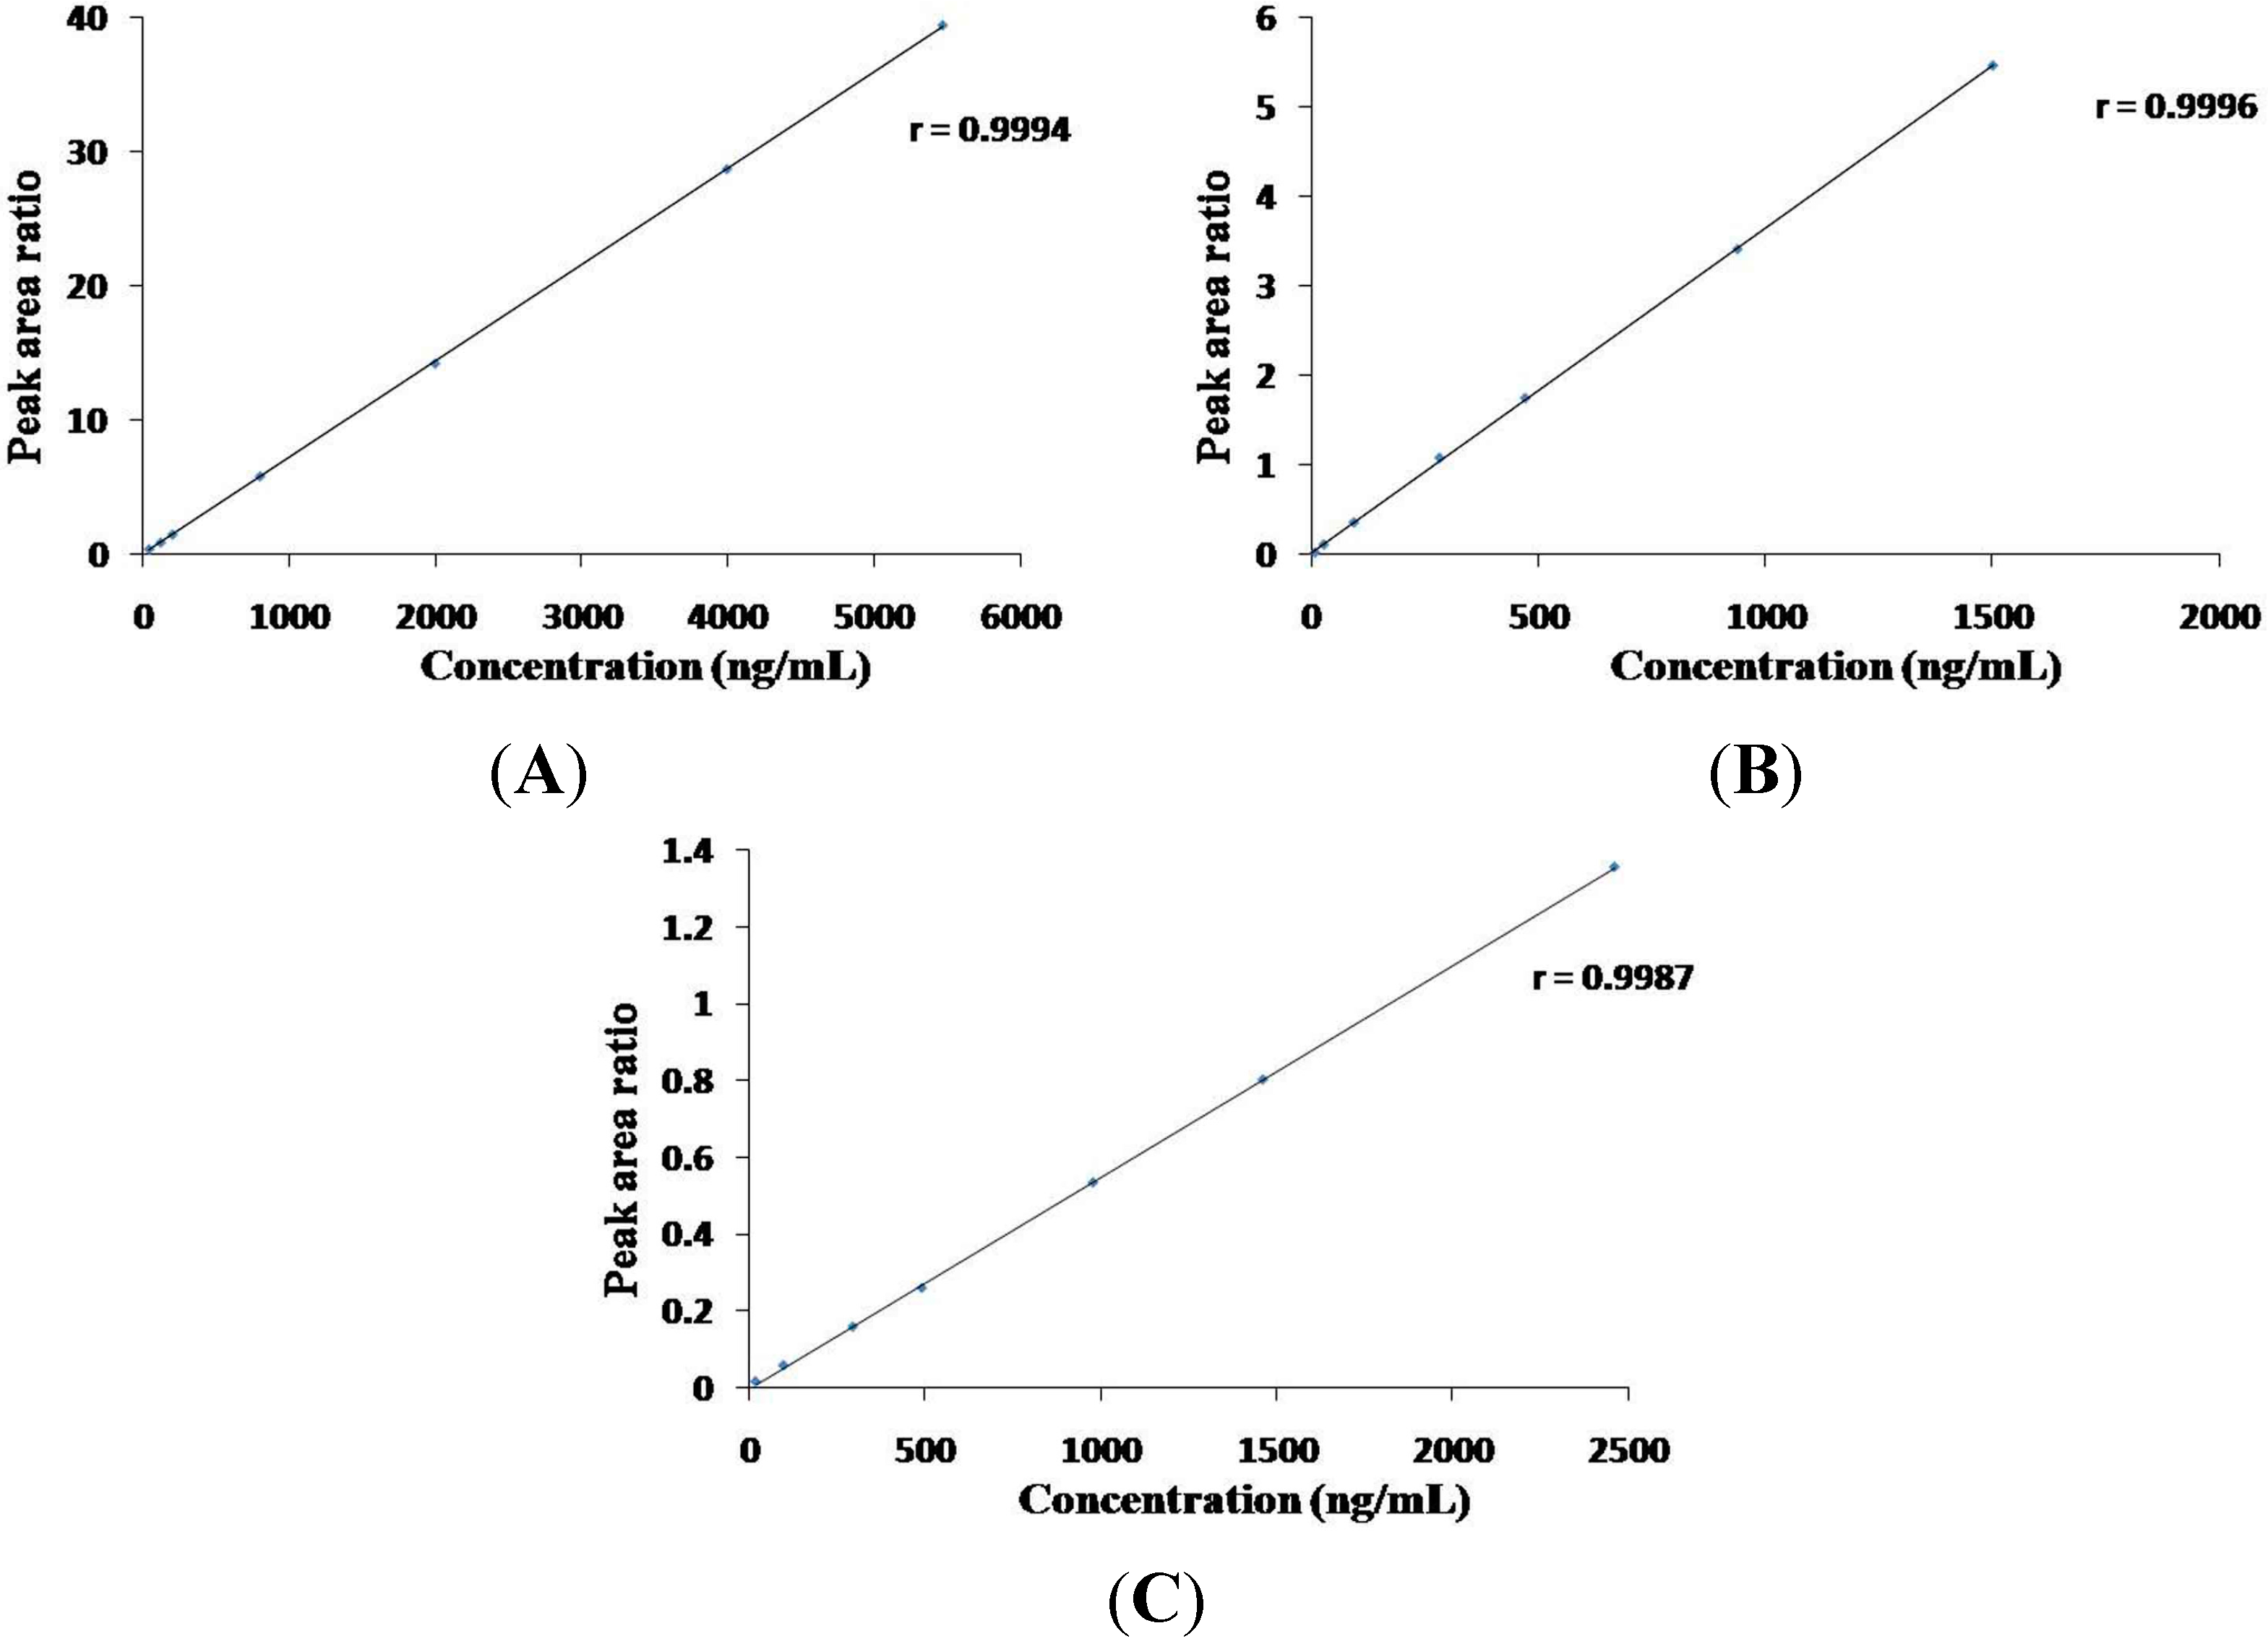
2.4. Method Validation

| Compounds | Precision from Standard Solutions (RSD, %, n = 6) | Precision from Real Samples (YHKGT) (RSD, %, n = 6) | Stability (%) | Concentration (ng/mL) | |
|---|---|---|---|---|---|
| Intra-day | Inter-day | ||||
| Protocatechuic acid | 1.67 | 3.38 | 2.83 | 97.78 ± 3.39 | 399.52 |
| Neochlorogenic acid | 1.29 | 3.21 | 2.27 | 102.45 ± 3.03 | 998.16 |
| Protocatechualdehyde | 2.79 | 4.65 | 2.78 | 99.83 ± 3.01 | 39.95 |
| p-Hydroxybenzoic acid | 1.56 | 2.63 | 2.03 | 98.9 ± 2.95 | 199.45 |
| Chlorogenic acid | 1.70 | 3.55 | 2.34 | 98.34 ± 2.14 | 5992.3 |
| Cryptochlorogenin acid | 2.01 | 3.98 | 2.76 | 103.12 ± 3.84 | 1996.54 |
| Caffeic acid | 2.66 | 3.97 | 2.51 | 101.32 ± 3.94 | 39.95 |
| Swertiamarin | 0.84 | 1.07 | 2.80 | 99.02 ± 1.92 | 19.97 |
| Sweroside | 2.08 | 3.54 | 2.58 | 95.76 ± 3.37 | 998.6 |
| Schaftoside | 1.34 | 1.99 | 3.63 | 98.37 ± 2.68 | 1996.22 |
| Agnuside | 1.92 | 3.20 | 2.87 | 101.56 ± 3.04 | 599.36 |
| Isoschaftoside | 1.12 | 2.54 | 2.67 | 98.45 ± 2.43 | 399.31 |
| Flavosativaside | 1.01 | 1.63 | 2.08 | 102.89 ± 3.29 | 19.22 |
| Vitexin 2′′-rhamnoside | 2.20 | 2.41 | 3.03 | 99.43 ± 2.66 | 19.67 |
| Rutin | 0.87 | 1.51 | 2.33 | 102.36 ± 2.02 | 399.36 |
| Vitexin | 1.94 | 2.75 | 2.54 | 99.43 ± 2.39 | 27.42 |
| Hyperoside | 2.36 | 3.44 | 3.73 | 99.95 ± 3.27 | 50.13 |
| Isoquercitrin | 1.23 | 2.42 | 4.18 | 95.72 ± 2.56 | 297.21 |
| Luteoloside | 2.35 | 3.68 | 2.48 | 101.23 ± 4.27 | 195.87 |
| Isochlorogenic acid B | 2.14 | 3.06 | 2.19 | 98.45 ± 3.67 | 998.82 |
| Kaempferol-3-O-rutinoside | 1.94 | 3.37 | 4.10 | 99.59 ± 3.64 | 99.99 |
| Isochlorogenic acid A | 2.56 | 4.87 | 2.99 | 96.31 ± 4.54 | 1997.97 |
| Astragalin | 2.30 | 3.37 | 2.68 | 99.56 ± 2.76 | 99.1 |
| Apigenin-7-glucoside | 1.86 | 2.89 | 3.16 | 103.45 ± 3.08 | 9.71 |
| Isochlorogenic acid C | 1.22 | 3.90 | 2.93 | 96.34 ± 3.45 | 1996.38 |
| Luteolin | 1.30 | 2.34 | 2.64 | 102.62 ± 3.25 | 28.25 |
| Quercetin | 2.42 | 4.58 | 3.18 | 97.34 ± 3.91 | 196.3 |
| Apigenin | 1.25 | 1.95 | 2.70 | 98.99 ± 2.53 | 9.61 |
| Casticin | 2.04 | 3.76 | 2.99 | 101.25 ± 3.29 | 27.21 |
| Compounds | Original (μg) | Spiked (μg) | Detected (μg) | Recovery (%) | RSD (%) |
|---|---|---|---|---|---|
| Protocatechuic acid | 17.36 | 31.2 | 49.97 | 104.52 | 3.59 |
| 62.4 | 81.83 | 103.32 | 2.33 | ||
| 156 | 180.13 | 104.34 | 2.78 | ||
| Neochlorogenic acid | 60.09 | 29.7 | 89.60 | 99.36 | 3.48 |
| 59.4 | 122.32 | 104.76 | 3.13 | ||
| 148.5 | 215.69 | 104.78 | 2.55 | ||
| Protocatechualdehyde | 4.27 | 29.9 | 35.07 | 103.01 | 3.97 |
| 59.81 | 67.55 | 104.63 | 2.56 | ||
| 149.52 | 150.14 | 97.56 | 3.08 | ||
| p-Hydroxybenzoic acid | 12.47 | 27.6 | 40.14 | 100.25 | 3.86 |
| 55.2 | 66.52 | 97.92 | 2.95 | ||
| 138 | 155.98 | 103.99 | 2.90 | ||
| Chlorogenic acid | 365.29 | 29.85 | 395.29 | 100.50 | 3.40 |
| 59.7 | 426.84 | 103.10 | 2.46 | ||
| 149.24 | 514.22 | 99.79 | 2.14 | ||
| Cryptochlorogenin acid | 87.22 | 29.47 | 117.71 | 103.46 | 2.87 |
| 58.94 | 148.96 | 104.75 | 3.73 | ||
| 147.36 | 240.44 | 103.98 | 2.22 | ||
| Caffeic acid | 5.80 | 29.94 | 34.81 | 96.89 | 3.66 |
| 59.89 | 63.03 | 96.89 | 2.87 | ||
| 149.72 | 159.54 | 102.69 | 2.86 | ||
| Swertiamarin | 1.26 | 28.48 | 28.32 | 97.82 | 4.27 |
| 56.96 | 57.10 | 98.03 | 2.00 | ||
| 142.4 | 146.52 | 102.01 | 2.35 | ||
| Sweroside | 61.19 | 29.38 | 89.31 | 97.07 | 2.11 |
| 58.75 | 120.47 | 100.90 | 2.34 | ||
| 146.88 | 212.87 | 103.27 | 3.88 | ||
| Schaftoside | 85.0 | 29.7 | 116.03 | 101.11 | 2.40 |
| 59.39 | 144.73 | 100.57 | 3.49 | ||
| 148.48 | 232.67 | 99.45 | 2.84 | ||
| Agnuside | 30.10 | 29.94 | 58.91 | 96.23 | 3.12 |
| 59.88 | 88.32 | 97.23 | 2.35 | ||
| 149.7 | 186.40 | 103.74 | 2.33 | ||
| Isoschaftoside | 16.07 | 29.63 | 45.34 | 98.79 | 4.02 |
| 59.26 | 72.80 | 97.42 | 2.47 | ||
| 148.16 | 170.07 | 103.94 | 3.43 | ||
| Flavosativaside | 2.47 | 28.89 | 30.06 | 98.96 | 2.76 |
| 57.78 | 58.70 | 97.32 | 2.50 | ||
| 144.44 | 150.82 | 102.71 | 3.06 | ||
| Vitexin 2′′-rhamnoside | 3.13 | 29.57 | 33.60 | 103.04 | 2.37 |
| 59.14 | 62.91 | 101.08 | 3.10 | ||
| 147.84 | 151.41 | 100.30 | 2.95 | ||
| Rutin | 17.87 | 30.07 | 48.32 | 101.26 | 2.21 |
| 60.14 | 79.54 | 102.54 | 3.73 | ||
| 150.36 | 173.59 | 103.56 | 4.07 | ||
| Vitexin | 1.07 | 41.22 | 43.04 | 101.82 | 3.44 |
| 82.43 | 85.03 | 101.86 | 2.66 | ||
| 206.08 | 215.73 | 104.16 | 3.96 | ||
| Hyperoside | 2.49 | 30.10 | 30.70 | 103.69 | 3.70 |
| 60.19 | 60.32 | 101.06 | 2.60 | ||
| 150.48 | 151.61 | 100.43 | 3.93 | ||
| Isoquercitrin | 12.12 | 29.81 | 42.54 | 102.05 | 4.72 |
| 59.62 | 71.53 | 99.65 | 3.34 | ||
| 149.05 | 162.91 | 101.17 | 3.63 | ||
| Luteoloside | 7.53 | 29.44 | 36.52 | 98.47 | 4.24 |
| 58.88 | 68.42 | 103.41 | 4.59 | ||
| 147.2 | 160.87 | 103.90 | 3.04 | ||
| Isochlorogenic acid B | 65.22 | 27.72 | 93.59 | 102.34 | 4.37 |
| 55.44 | 119.99 | 98.79 | 2.84 | ||
| 138.6 | 208.53 | 103.40 | 2.58 | ||
| Kaempferol-3-O-rutinoside | 17.87 | 30.07 | 48.32 | 101.26 | 3.21 |
| 60.14 | 79.54 | 102.54 | 2.73 | ||
| 150.36 | 173.59 | 103.56 | 3.07 | ||
| Isochlorogenic acid A | 105.61 | 29.57 | 135.18 | 100.00 | 2.41 |
| 59.14 | 165.23 | 100.81 | 3.07 | ||
| 147.84 | 253.38 | 99.95 | 2.19 | ||
| Astragalin | 3.33 | 29.76 | 33.89 | 102.69 | 2.45 |
| 59.52 | 65.60 | 103.88 | 2.86 | ||
| 148.8 | 159.29 | 103.47 | 3.87 | ||
| Apigenin-7-glucoside | 0.56 | 29.16 | 30.63 | 103.12 | 3.98 |
| 58.32 | 54.98 | 101.89 | 2.88 | ||
| 145.8 | 131.72 | 98.88 | 2.24 | ||
| Isochlorogenic acid C | 123.39 | 30.0 | 152.84 | 98.17 | 3.04 |
| 60.0 | 185.91 | 102.53 | 2.36 | ||
| 150.01 | 272.26 | 99.24 | 3.48 | ||
| Luteolin | 0.84 | 28.34 | 29.26 | 100.28 | 2.41 |
| 56.68 | 55.10 | 96.97 | 2.32 | ||
| 141.7 | 148.54 | 103.95 | 4.20 | ||
| Quercetin | 10.03 | 29.5 | 38.60 | 96.85 | 4.69 |
| 59.01 | 67.48 | 97.36 | 2.55 | ||
| 147.5 | 160.25 | 101.84 | 3.56 | ||
| Apigenin | 0.24 | 28.86 | 27.92 | 99.38 | 4.12 |
| 57.72 | 56.93 | 98.22 | 3.15 | ||
| 144.3 | 143.57 | 99.33 | 2.30 | ||
| Casticin | 2.94 | 27.3 | 29.03 | 97.03 | 3.40 |
| 54.6 | 54.63 | 94.67 | 2.30 | ||
| 136.5 | 142.14 | 101.98 | 2.65 |
2.5. Sample Analysis
| Samples | Content of Each Compound in 13 Batches of YHKGP Samples (mg/g) | ||||||||||||||||||||||||||||
|---|---|---|---|---|---|---|---|---|---|---|---|---|---|---|---|---|---|---|---|---|---|---|---|---|---|---|---|---|---|
| No. | 1 a | 2 | 3 | 4 | 5 | 6 | 7 | 8 | 9 | 10 | 11 | 12 | 13 | 14 | 15 | 16 | 17 | 18 | 19 | 20 | 21 | 22 | 23 | 24 | 25 | 26 | 27 | 28 | 29 |
| 1208010 | 0.1580 | 0.5075 | 0.0186 | 0.1248 | 2.9787 | 0.7077 | 0.0211 | 0.0102 | 0.6596 | 0.9358 | 0.2806 | 0.1604 | 0.0056 | 0.0040 | 0.1847 | 0.0131 | 0.0248 | 0.1229 | 0.0767 | 0.5631 | 0.0477 | 0.9640 | 0.0420 | 0.0029 | 1.1698 | 0.0171 | 0.0898 | 0.0051 | 0.0156 |
| 1209015 | 0.1636 | 0.4144 | 0.0214 | 0.0666 | 3.6644 | 0.5157 | 0.0287 | 0.0102 | 0.5304 | 0.4690 | 0.1894 | 0.0890 | 0.0050 | 0.0043 | 0.1984 | 0.0074 | 0.0268 | 0.1084 | 0.0729 | 0.4345 | 0.0419 | 1.4652 | 0.0285 | 0.0034 | 1.1410 | 0.0121 | 0.0771 | 0.0051 | 0.0155 |
| 1211023 | 0.1467 | 0.3324 | 0.0236 | 0.0857 | 3.3666 | 0.5195 | 0.0270 | 0.0101 | 0.4447 | 0.6714 | 0.2512 | 0.1423 | 0.0051 | 0.0039 | 0.1920 | 0.0091 | 0.0257 | 0.1049 | 0.0585 | 0.4418 | 0.0654 | 1.3217 | 0.0494 | 0.0029 | 1.0473 | 0.0081 | 0.0728 | 0.0043 | 0.0152 |
| 1301013 | 0.1652 | 0.5879 | 0.0268 | 0.0801 | 4.1785 | 0.7268 | 0.0480 | 0.0102 | 0.7163 | 0.5082 | 0.2279 | 0.1065 | 0.0056 | 0.0047 | 0.2528 | 0.0078 | 0.0234 | 0.1156 | 0.0959 | 0.6249 | 0.0527 | 1.5898 | 0.0426 | 0.0024 | 1.6397 | 0.0143 | 0.0748 | 0.0046 | 0.0179 |
| 1301014 | 0.1192 | 0.2926 | 0.0130 | 0.0602 | 2.2661 | 0.4318 | 0.0151 | 0.0099 | 0.3370 | 0.6574 | 0.2410 | 0.1313 | 0.0064 | 0.0039 | 0.1998 | 0.0074 | 0.0261 | 0.1069 | 0.0623 | 0.4129 | 0.0636 | 1.2913 | 0.0502 | 0.0021 | 0.7809 | 0.0025 | 0.0701 | 0.0040 | 0.0152 |
| 1302015 | 0.1367 | 0.5406 | 0.0196 | 0.0524 | 3.9758 | 0.7341 | 0.0317 | 0.0102 | 0.5921 | 0.5662 | 0.2158 | 0.0733 | 0.0050 | 0.0045 | 0.2423 | 0.0054 | 0.0221 | 0.1015 | 0.0808 | 0.6398 | 0.0425 | 1.5587 | 0.0335 | 0.0027 | 1.1480 | 0.0044 | 0.0699 | 0.0040 | 0.0172 |
| 1302016 | 0.1636 | 0.5390 | 0.0202 | 0.0701 | 3.4165 | 0.6541 | 0.0231 | 0.0101 | 0.5479 | 0.5190 | 0.1880 | 0.0759 | 0.0054 | 0.0051 | 0.1972 | 0.0066 | 0.0214 | 0.1153 | 0.0879 | 0.4715 | 0.0391 | 1.4159 | 0.0325 | 0.0042 | 1.0685 | 0.0106 | 0.0706 | 0.0041 | 0.0163 |
| 1302017 | 0.1685 | 0.6239 | 0.0274 | 0.0763 | 4.2379 | 0.7716 | 0.0371 | 0.0102 | 0.6172 | 0.5195 | 0.2091 | 0.1073 | 0.0050 | 0.0058 | 0.2065 | 0.0078 | 0.0145 | 0.1033 | 0.0809 | 0.6676 | 0.0420 | 1.6356 | 0.0257 | 0.0029 | 1.2690 | 0.0075 | 0.0698 | 0.0041 | 0.0161 |
| 1302018 | 0.1698 | 0.5489 | 0.0189 | 0.0566 | 3.6544 | 0.7684 | 0.0273 | 0.0101 | 0.6357 | 0.4679 | 0.2182 | 0.0666 | 0.0049 | 0.0042 | 0.1871 | 0.0091 | 0.0209 | 0.1042 | 0.0741 | 0.5110 | 0.0378 | 1.4709 | 0.0269 | 0.0042 | 1.0873 | 0.0069 | 0.0676 | 0.0040 | 0.0162 |
| 1304010 | 0.1693 | 0.5384 | 0.0304 | 0.0751 | 3.5976 | 0.6395 | 0.0235 | 0.0097 | 0.6612 | 0.5151 | 0.1797 | 0.0899 | 0.0048 | 0.0043 | 0.1979 | 0.0064 | 0.0231 | 0.1144 | 0.0799 | 0.4860 | 0.0359 | 1.4387 | 0.0299 | 0.0039 | 1.1153 | 0.0064 | 0.0668 | 0.0040 | 0.0161 |
| 1304023 | 0.1396 | 0.5508 | 0.0174 | 0.0532 | 4.0312 | 0.6471 | 0.0292 | 0.0101 | 0.6498 | 0.4772 | 0.2347 | 0.0739 | 0.0050 | 0.0042 | 0.2095 | 0.0073 | 0.0233 | 0.1046 | 0.0874 | 0.6507 | 0.0410 | 1.5325 | 0.0273 | 0.0017 | 1.2526 | 0.0083 | 0.0723 | 0.0037 | 0.0174 |
| 1304024 | 0.1717 | 0.5322 | 0.0175 | 0.1299 | 3.8052 | 0.7524 | 0.0267 | 0.0102 | 0.4648 | 0.8406 | 0.1597 | 0.1405 | 0.0049 | 0.0054 | 0.1987 | 0.0087 | 0.0174 | 0.1080 | 0.0719 | 0.5950 | 0.0484 | 1.4747 | 0.0317 | 0.0031 | 0.9447 | 0.0109 | 0.0780 | 0.0035 | 0.0155 |
| 1304025 | 0.1509 | 0.4240 | 0.0153 | 0.0941 | 2.7936 | 0.5772 | 0.0163 | 0.0101 | 0.4603 | 0.5562 | 0.2440 | 0.0815 | 0.0052 | 0.0037 | 0.1745 | 0.0071 | 0.0189 | 0.0907 | 0.0614 | 0.4857 | 0.0473 | 0.9683 | 0.0361 | 0.0015 | 0.7741 | 0.0094 | 0.0748 | 0.0035 | 0.0167 |
| Aver. | 0.1556 | 0.4948 | 0.0208 | 0.0789 | 3.5359 | 0.6497 | 0.0273 | 0.0101 | 0.5629 | 0.5926 | 0.2184 | 0.1029 | 0.0052 | 0.0045 | 0.2032 | 0.0080 | 0.0222 | 0.1077 | 0.0762 | 0.5373 | 0.0466 | 1.3944 | 0.0351 | 0.0029 | 1.1106 | 0.0091 | 0.0734 | 0.0042 | 0.0162 |
| RSD (%) | 9.89 | 19.22 | 23.23 | 30.35 | 15.63 | 16.19 | 30.31 | 1.34 | 18.80 | 23.86 | 14.62 | 29.13 | 8.07 | 13.59 | 10.73 | 22.69 | 15.55 | 7.16 | 13.94 | 16.12 | 19.06 | 14.68 | 22.97 | 28.85 | 19.13 | 41.86 | 7.84 | 12.08 | 5.03 |
3. Experimental Section
3.1. Standards, Reagents and Materials


3.2. Preparation of Standard Solution and Samples
3.3. Liquid Chromatography
3.4. Mass Spectrometry
4. Conclusions
Supplementary Materials
Acknowledgments
Author Contributions
Conflicts of Interest
References
- Cos, P.; Maes, L.; Vlietinck, A.; Pieters, L. Plant-derived leading compounds for chemotherapy of human immunodeficiency virus (HIV) infection—An update (1998–2007). Planta Med. 2008, 74, 1323–1337. [Google Scholar] [CrossRef] [PubMed]
- The State Pharmacopoeia Commission of the People’s Republic of China. In Drug Specifications for Traditional Chinese Medicine Promulgated by Ministry of Public Health of China; Chinese Pharmacopoeia Commission Press: Beijing, China, 1997; Volume 12, p. 169.
- Qi, L.W.; Chen, C.Y.; Li, P. Structural characterization and identification of iridoid glycosides, saponins, phenolic acids and flavonoids in Flos Lonicerae Japonicae by a fast liquid chromatography method with diode-array detection and time-of-flight mass spectrometry. Rapid Commun. Mass Spectrom. 2009, 23, 3227–3242. [Google Scholar] [CrossRef] [PubMed]
- Park, S.H.; Roh, E.; Kim, H.S.; Baek, S.I.; Choi, N.S.; Kim, N.; Hwang, B.Y.; Han, S.B.; Kim, Y. Inhibition of IRAK-4 activity for rescuing endotoxin LPS-induced septic mortality in mice by lonicerae flos extract. Biochem. Biophys. Res. Commun. 2013, 442, 183–188. [Google Scholar] [CrossRef] [PubMed]
- Lan, W.; Jun, Z.Z.; Zesheng, Z. Characterization of antioxidant activity of extracts from Flos Lonicerae. Drug Dev. Ind. Pharm. 2007, 33, 841–847. [Google Scholar] [CrossRef] [PubMed]
- Liao, Y.; Dong, S.; Kiyama, R.; Cai, P.; Liu, L.; Shen, H. Flos lonicerae extracts and chlorogenic acid protect human umbilical vein endothelial cells from the toxic damage of perfluorooctane sulphonate. Inflammation 2013, 36, 767–779. [Google Scholar] [CrossRef] [PubMed]
- Ling, T.J.; Ling, W.W.; Chen, Y.J.; Wan, X.C.; Xia, T.; Du, X.F.; Zhang, Z.Z. Antiseptic activity and phenolic constituents of the aerial parts of Vitex negundo var. cannabifolia. Molecules 2010, 15, 8469–8477. [Google Scholar] [CrossRef] [PubMed]
- Luo, Y.J.; Bian, Q.Q.; Zhang, Q.; Liu, Z.R.; Zhang, X.S. Separation of Chemical Compounds in Vitex negundo L. by Preparative High-speed Counter-current Chromatography. J. Instrum. Anal. 2011, 30, 1044–1049. [Google Scholar]
- Gautam, K.; Kumar, P.; Poonia, S. Larvicidal activity and GC-MS analysis of flavonoids of Vitex negundo and Andrographis paniculata against two vector mosquitoes Anopheles stephensi and Aedes aegypti. J. Vector Borne Dis. 2013, 50, 171–178. [Google Scholar] [PubMed]
- Zhang, Y.; Yang, L.J.; Jiang, K.; Tan, C.H.; Tan, J.J.; Yang, P.M.; Zhu, D.Y. Glycosidic constituents from the roots and rhizomes of Melicope pteleifolia. Carbohydr. Res. 2012, 361, 114–119. [Google Scholar] [CrossRef] [PubMed]
- Li, Y.; Ooi, L.S.M.; Wang, H.; But, P.P.; Ooi, V.E.C. Antiviral activities of medicinal herbs traditionally used in southern mainland China. Phytother. Res. 2004, 18, 718–722. [Google Scholar] [CrossRef] [PubMed]
- Liao, Y.; Lin, A.; Xin, L.; Zhu, H.; Huang, C. Pharmacognostical studies on the stem and leaf of Mussaenda pubescens. Zhong Yao Cai 2000, 23, 195–197. [Google Scholar] [PubMed]
- Guo, X.; Wu, Q.N.; Gong, Q.H. Determination of Chlorogenic acid in Yinhuakanggan Tablets by HPLC. Qilu Pharm. Affiairs 2005, 24, 283–284. [Google Scholar]
- Han, Y.Q.; Wang, J.; Cui, Q.X.; Wang, L.Q.; Cheng, B.F.; Zhao, H.Z.; Jiang, M.; Bai, G.; Luo, G.A. Absorption, metabolism and effect of compatibility on absorption of qishenyiqi dropping pill. Biomed. Chromatogr. 2013, 28, 554–563. [Google Scholar] [CrossRef] [PubMed]
- Yang, Y.; Wang, H.J.; Yang, J.; Brantner, A.H.; Lower-Nedza, A.D.; Si, N.; Song, J.F.; Bai, B.; Zhao, H.Y.; Bian, B.L. Chemical profiling and quantification of Chinese medicinal formula Huang-Lian-Jie-Du decoction, a systematic quality control strategy using ultra high performance liquid chromatography combined with hybrid quadrupole-orbitrap and triple quadrupole mass spectrometers. J. Chromatogr. A 2013, 1321, 88–99. [Google Scholar] [PubMed]
- An, H.; Wang, H.; Lan, Y.; Hashi, Y.; Chen, S. Simultaneous qualitative and quantitative analysis of phenolic acids and flavonoids for the quality control of Apocynum venetum L. leaves by HPLC-DAD-ESI-IT-TOF-MS and HPLC-DAD. J. Pharm. Biomed. Anal. 2013, 85, 295–304. [Google Scholar] [CrossRef] [PubMed]
- Wu, X.; Ding, W.; Zhong, J.; Wan, J.; Xie, Z. Simultaneous qualitative and quantitative determination of phenolic compounds in Aloe barbadensis Mill by liquid chromatography-mass spectrometry-ion trap-time-of-flight and high performance liquid chromatography-diode array detector. J. Pharm. Biomed. Anal. 2013, 80, 94–106. [Google Scholar] [CrossRef] [PubMed]
- Li, Q.M.; van den Heuvel, H.; Delorenzo, O.; Corthout, J.; Pieters, L.A.; Vlietinck, A.J.; Claeys, M. Mass spectral characterization of C-glycosidic flavonoids isolated from a medicinal plant (Passiflora incarnata). J. Chromatogr. 1991, 562, 435–446. [Google Scholar] [PubMed]
- Tomczyk, M.; Gudej, J.; Sochacki, M. Flavonoids from Ficaria verna Huds. Z. Naturforsch. C 2002, 57, 440–444. [Google Scholar] [CrossRef] [PubMed]
- Li, H.; Song, F.; Xing, J.; Tsao, R.; Liu, Z.; Liu, S. Screening and structural characterization of alpha-glucosidase inhibitors from hawthorn leaf flavonoids extract by ultrafiltration LC-DAD-MS(n) and SORI-CID FTICR MS. J. Am. Soc. Mass Spectrom. 2009, 20, 1496–1503. [Google Scholar] [CrossRef] [PubMed]
- Cuyckens, F.; Claeys, M. Mass spectrometry in the structural analysis of flavonoids. J. Mass Spectrom. 2004, 39, 1–15. [Google Scholar] [CrossRef] [PubMed]
- De Rijke, E.; Zappey, H.; Ariese, F.; Gooijer, C.; Brinkman, U.A. Liquid chromatography with atmospheric pressure chemical ionization and electrospray ionization mass spectrometry of flavonoids with triple-quadrupole and ion-trap instruments. J. Chromatogr. A 2003, 984, 45–58. [Google Scholar] [CrossRef]
- Granica, S.; Krupa, K.; Klebowska, A.; Kiss, A.K. Development and validation of HPLC-DAD-CAD-MS(3) method for qualitative and quantitative standardization of polyphenols in Agrimoniae eupatoriae herba (Ph. Eur). J. Pharm. Biomed. Anal. 2013, 86, 112–122. [Google Scholar] [CrossRef] [PubMed]
- Hogner, C.; Sturm, S.; Seger, C.; Stuppner, H. Development and validation of a rapid ultra-high performance liquid chromatography diode array detector method for Vitex agnus-castus. J. Chromatogr. B Anal. Technol. Biomed. Life Sci. 2013, 927, 181–190. [Google Scholar] [CrossRef] [PubMed]
- Mathon, C.; Duret, M.; Kohler, M.; Edder, P.; Bieri, S.; Christen, P. Multi-targeted screening of botanicals in food supplements by liquid chromatography with tandem mass spectrometry. Food Chem. 2013, 138, 709–717. [Google Scholar] [CrossRef] [PubMed]
- Aberham, A.; Schwaiger, S.; Stuppner, H.; Ganzera, M. Quantitative analysis of iridoids, secoiridoids, xanthones and xanthone glycosides in Gentiana lutea L. roots by RP-HPLC and LC-MS. J. Pharm. Biomed. Anal. 2007, 45, 437–442. [Google Scholar] [CrossRef] [PubMed]
- Wang, G.F.; Shi, L.P.; Ren, Y.D.; Liu, Q.F.; Liu, H.F.; Zhang, R.J.; Li, Z.; Zhu, F.H.; He, P.L.; Tang, W.; et al. Anti-hepatitis B virus activity of chlorogenic acid, quinic acid and caffeic acid in vivo and in vitro. Antivir. Res. 2009, 83, 186–190. [Google Scholar] [CrossRef] [PubMed]
- Hao, B.J.; Wu, Y.H.; Wang, J.G.; Hu, S.Q.; Keil, D.J.; Hu, H.J.; Lou, J.D.; Zhao, Y. Hepatoprotective and antiviral properties of isochlorogenic acid A from Laggera alata against hepatitis B virus infection. J. Ethnopharmacol. 2012, 144, 190–194. [Google Scholar] [CrossRef] [PubMed]
- Suksamrarn, A.; Kumpun, S.; Kirtikara, K.; Yingyongnarongkul, B.; Suksamrarn, S. Iridoids with anti-inflammatory activity from Vitex peduncularis. Planta Med. 2002, 68, 72–73. [Google Scholar] [CrossRef] [PubMed]
- Savov, V.M.; Galabov, A.S.; Tantcheva, L.P.; Mileva, M.M.; Pavlova, E.L.; Stoeva, E.S.; Braykova, A.A. Effects of rutin and quercetin on monooxygenase activities in experimental influenza virus infection. Exp. Toxicol. Pathol. 2006, 58, 59–64. [Google Scholar] [CrossRef] [PubMed]
- Sample Availability: Samples of the compounds 1–29 are available from the authors.
© 2015 by the authors. Licensee MDPI, Basel, Switzerland. This article is an open access article distributed under the terms and conditions of the Creative Commons Attribution license ( http://creativecommons.org/licenses/by/4.0/).
Share and Cite
Lin, Y.; Xu, W.; Huang, M.; Xu, W.; Li, H.; Ye, M.; Zhang, X.; Chu, K. Qualitative and Quantitative Analysis of Phenolic Acids, Flavonoids and Iridoid Glycosides in Yinhua Kanggan Tablet by UPLC-QqQ-MS/MS. Molecules 2015, 20, 12209-12228. https://doi.org/10.3390/molecules200712209
Lin Y, Xu W, Huang M, Xu W, Li H, Ye M, Zhang X, Chu K. Qualitative and Quantitative Analysis of Phenolic Acids, Flavonoids and Iridoid Glycosides in Yinhua Kanggan Tablet by UPLC-QqQ-MS/MS. Molecules. 2015; 20(7):12209-12228. https://doi.org/10.3390/molecules200712209
Chicago/Turabian StyleLin, Yu, Wen Xu, Mingqing Huang, Wei Xu, Huang Li, Miao Ye, Xun Zhang, and Kedan Chu. 2015. "Qualitative and Quantitative Analysis of Phenolic Acids, Flavonoids and Iridoid Glycosides in Yinhua Kanggan Tablet by UPLC-QqQ-MS/MS" Molecules 20, no. 7: 12209-12228. https://doi.org/10.3390/molecules200712209
APA StyleLin, Y., Xu, W., Huang, M., Xu, W., Li, H., Ye, M., Zhang, X., & Chu, K. (2015). Qualitative and Quantitative Analysis of Phenolic Acids, Flavonoids and Iridoid Glycosides in Yinhua Kanggan Tablet by UPLC-QqQ-MS/MS. Molecules, 20(7), 12209-12228. https://doi.org/10.3390/molecules200712209