2.2. Mitochondrial Function
To examine the effects of RBE on mitochondrial function we used a concentration of 0.3 mg/mL since this concentration proved to be the most effective concentration in previous experiments [
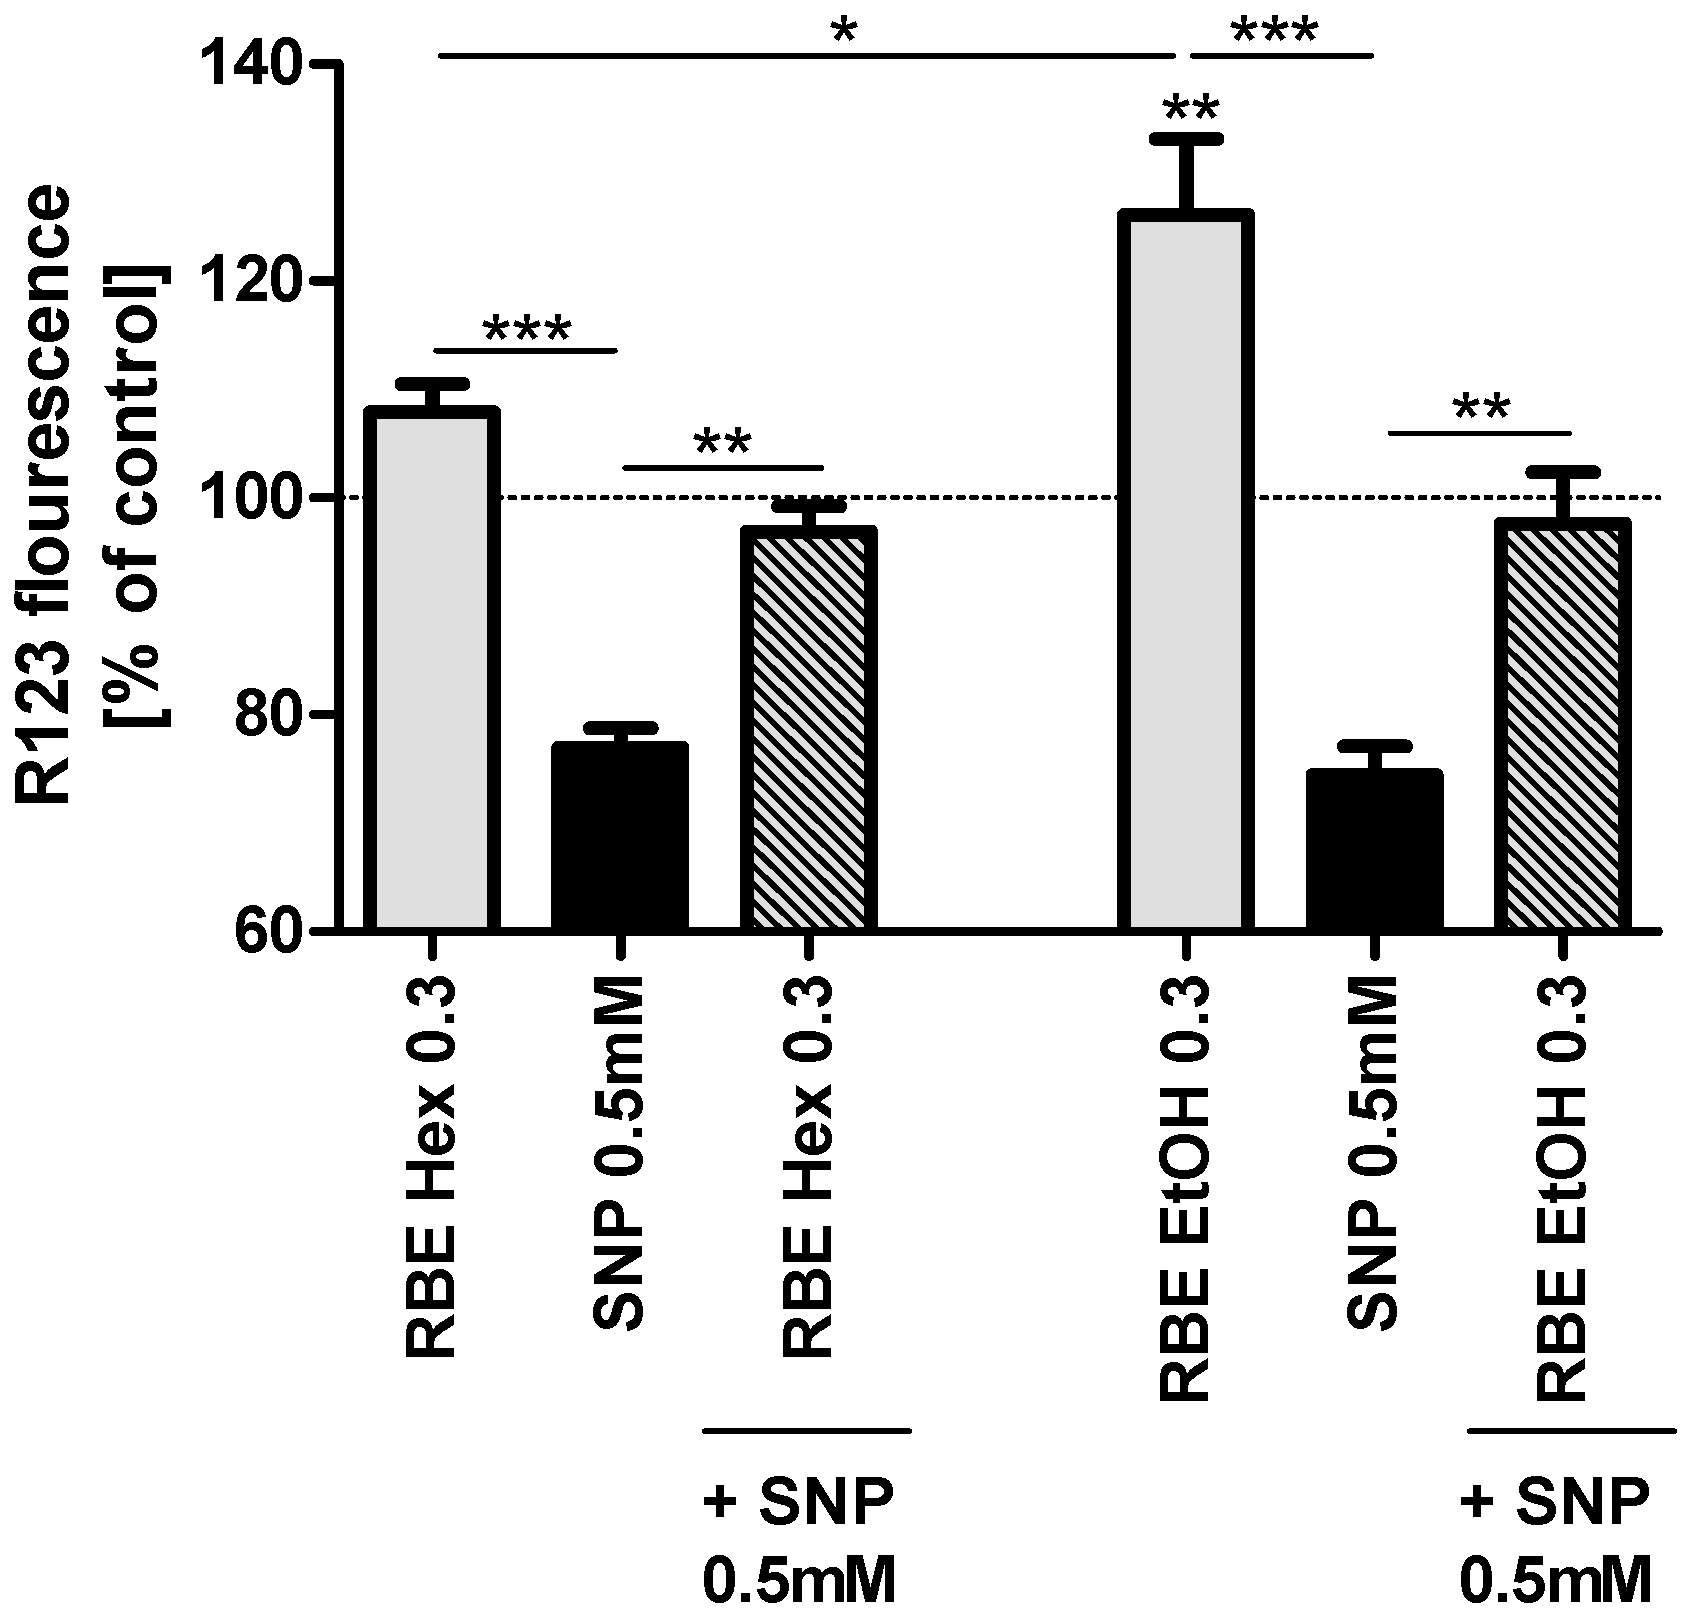
13]. Incubation of PC12 cells for 24 h with the ethanolic RBE (0.3 mg/mL) significantly increased basal mitochondrial membrane potential (MMP,
p < 0.01), while the hexanic RBE increased basal MMP numerically, but not significantly. Insult of PC12 cells with sodium nitroprusside (SNP, 0.5 mM) significantly decreased MMP to around 80% of that of control cells. Preincubation with either ethanolic or hexanic RBE (0.3 mg/mL) counteracted SNP-induced drop in MMP and resulted in MMP similar to control cells (
Figure 1).
A lower concentration of the ethanolic RBE (0.2 mg/mL) also increased MMP (basal and after SNP-stress; p < 0.001 for both) similar to the higher concentration of 0.3 mg/mL. The hexanic RBE, on the other hand, did not affect basal MMP or MMP after insult with SNP at lower concentrations of 0.1 and 0.2 mg/mL (data not shown).
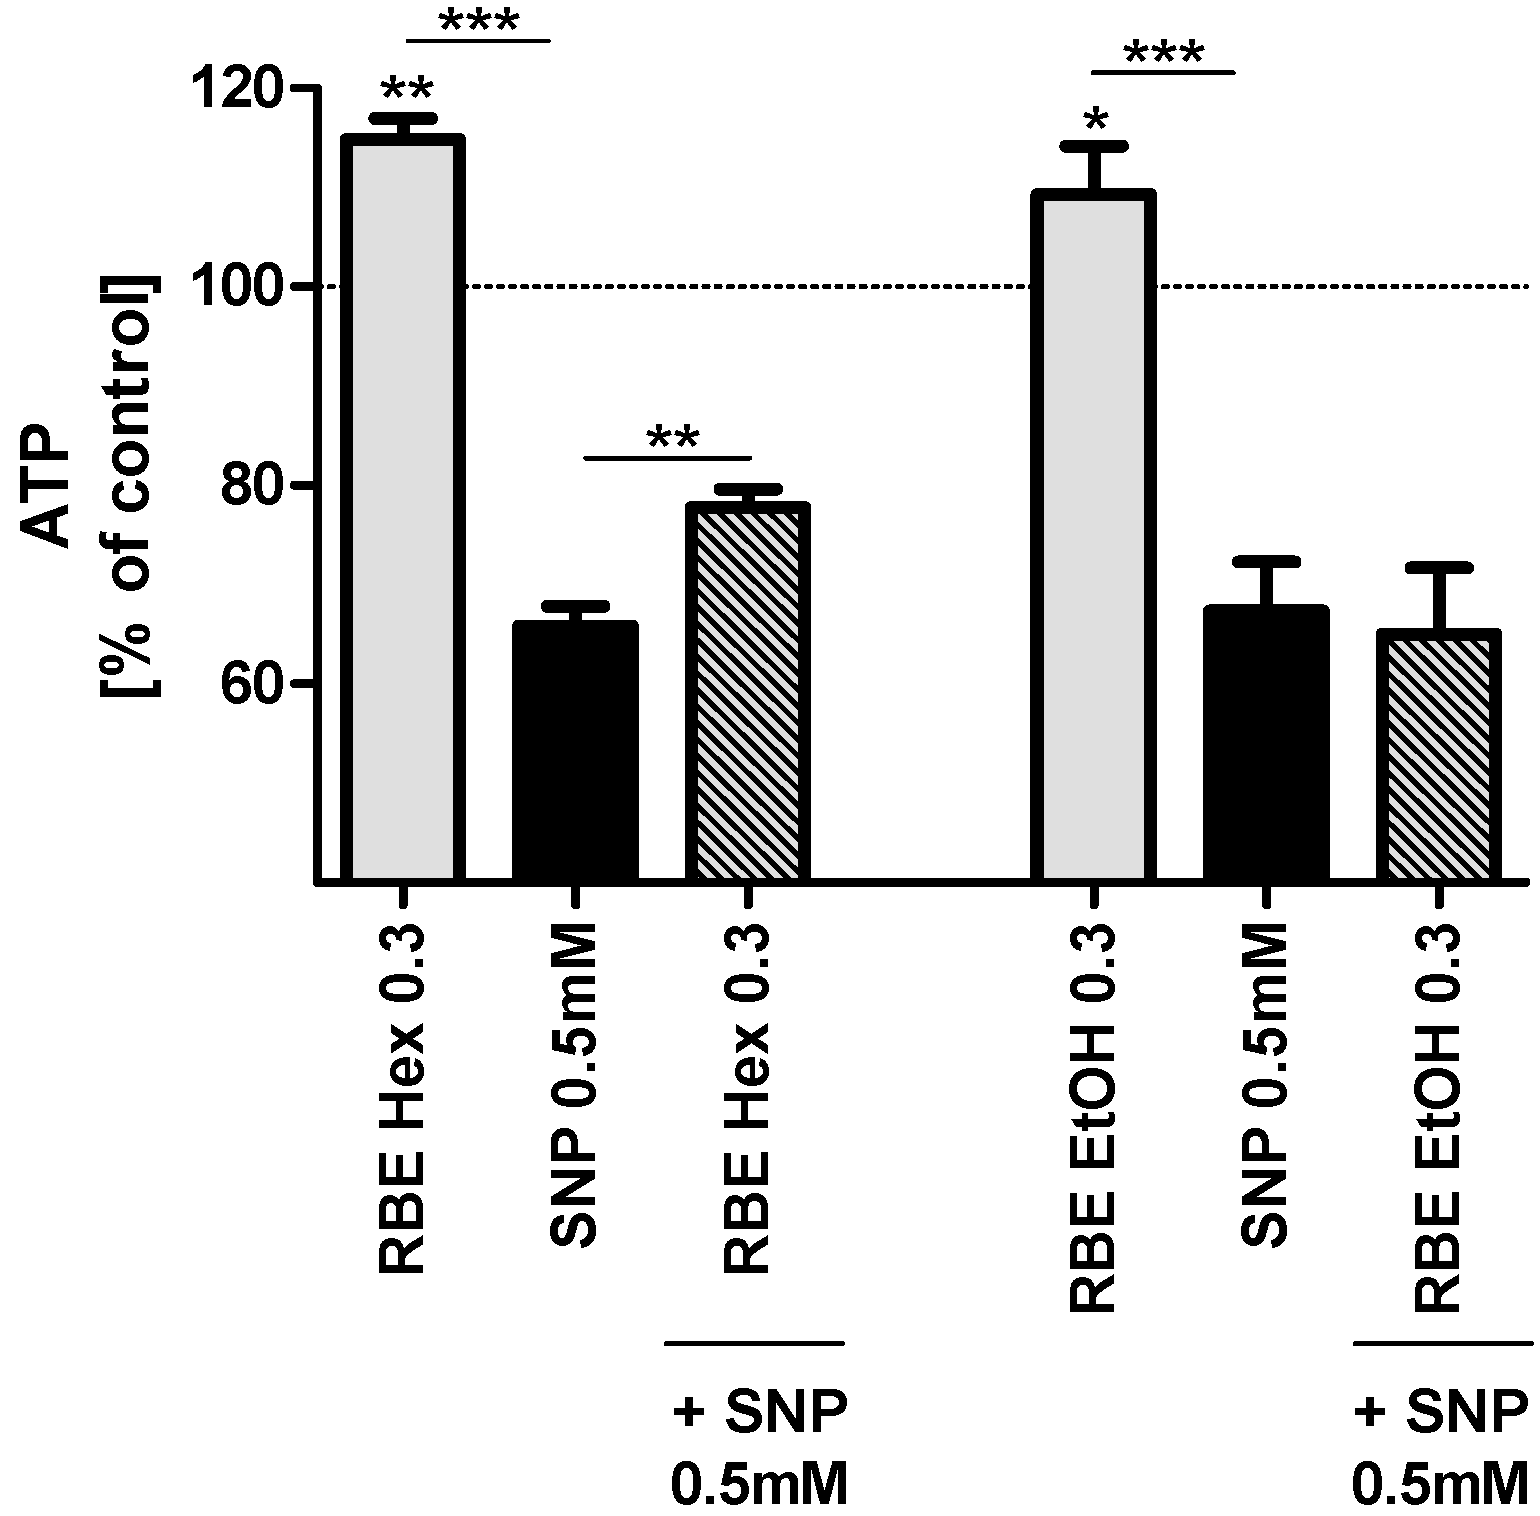
Incubation of PC12 cells with hexanic and ethanolic RBE (0.3 mg/mL) for 24 h significantly increased basal ATP concentrations (
p < 0.01 and
p < 0.05;
Figure 2). Insult of PC12 cells with SNP (0.5 mM) significantly decreased ATP concentrations to around 70% of control cell concentrations. Preincubation with hexanic RBE (0.3 mg/mL) counteracted the SNP-induced drop in MMP concentrations, while preincubation with ethanolic RBE did not have any significant effect (
Figure 2). Smaller concentrations of hexanic or ethanolic RBE did not significantly affect basal ATP concentrations or ATP concentrations after insult of cells with SNP (data not shown).
Protein carbonyls are formed within cells under conditions of oxidative or nitrosative stress [
14]. Protein carbonyl concentrations were not significantly changed by incubation of PC12 cells with hexanic RBE (0.3 mg/mL) for 24 h (see
Figure 3). Protein carbonyl concentrations were not determined after incubation of cells with ethanolic RBE.
Figure 1.
Mitochondrial membrane potential (MMP; gray bars) of PC12 cells after 24-h incubation with 0.3 mg/mL hexanic (RBE Hex) or ethanolic (RBE EtOH) rice bran extract (RBE); MMP after insult with sodium nitroprusside (SNP, 0.5 mM) for 24 h (black bars) and MMP after preincubation of PC12 cells with ethanolic or hexanic RBE for 1 h and insult with SNP (0.5 mM) for 24 h (striped bars); cells treated with cell culture medium served as control for normalization (100%); there were no differences in MMP between medium treated and DMSO or ethanol treated cells (data not shown); n = 5–6; mean ± SEM; ANOVA with Tukey’s post-test; * p < 0.05; ** p < 0.01; *** p< 0.001.
Figure 2.
ATP concentrations of PC12 cells after 24-h incubation with 0.3 mg/mL hexanic (RBE Hex) or ethanolic (RBE EtOH) rice bran extract (RBE, grey bars); ATP concentrations after insult with sodium nitroprusside (SNP, 0.5 mM) for 6 h (black bars) and ATP concentrations after preincubation of PC12 cells with ethanolic or hexanic RBE for 1 h and insult with SNP (0.5 mM) for 6 h (striped bars); cells treated with cell culture medium served as control for normalization (100%); there were no differences in ATP between medium treated and DMSO or ethanol treated cells (data not shown); n = 6–7; mean ± SEM; ANOVA with Tukey’s post-test; * p < 0.05; ** p < 0.01; *** p < 0.001.
Figure 3.
Protein carbonyl concentrations in PC12 cells after 24-h incubation with 0.3 mg/mL hexanic rice bran extract (RBE) or the respective DMSO control; cells treated with cell culture medium served as control for normalization (100%); n = 8; mean ± SEM.
Figure 3.
Protein carbonyl concentrations in PC12 cells after 24-h incubation with 0.3 mg/mL hexanic rice bran extract (RBE) or the respective DMSO control; cells treated with cell culture medium served as control for normalization (100%); n = 8; mean ± SEM.
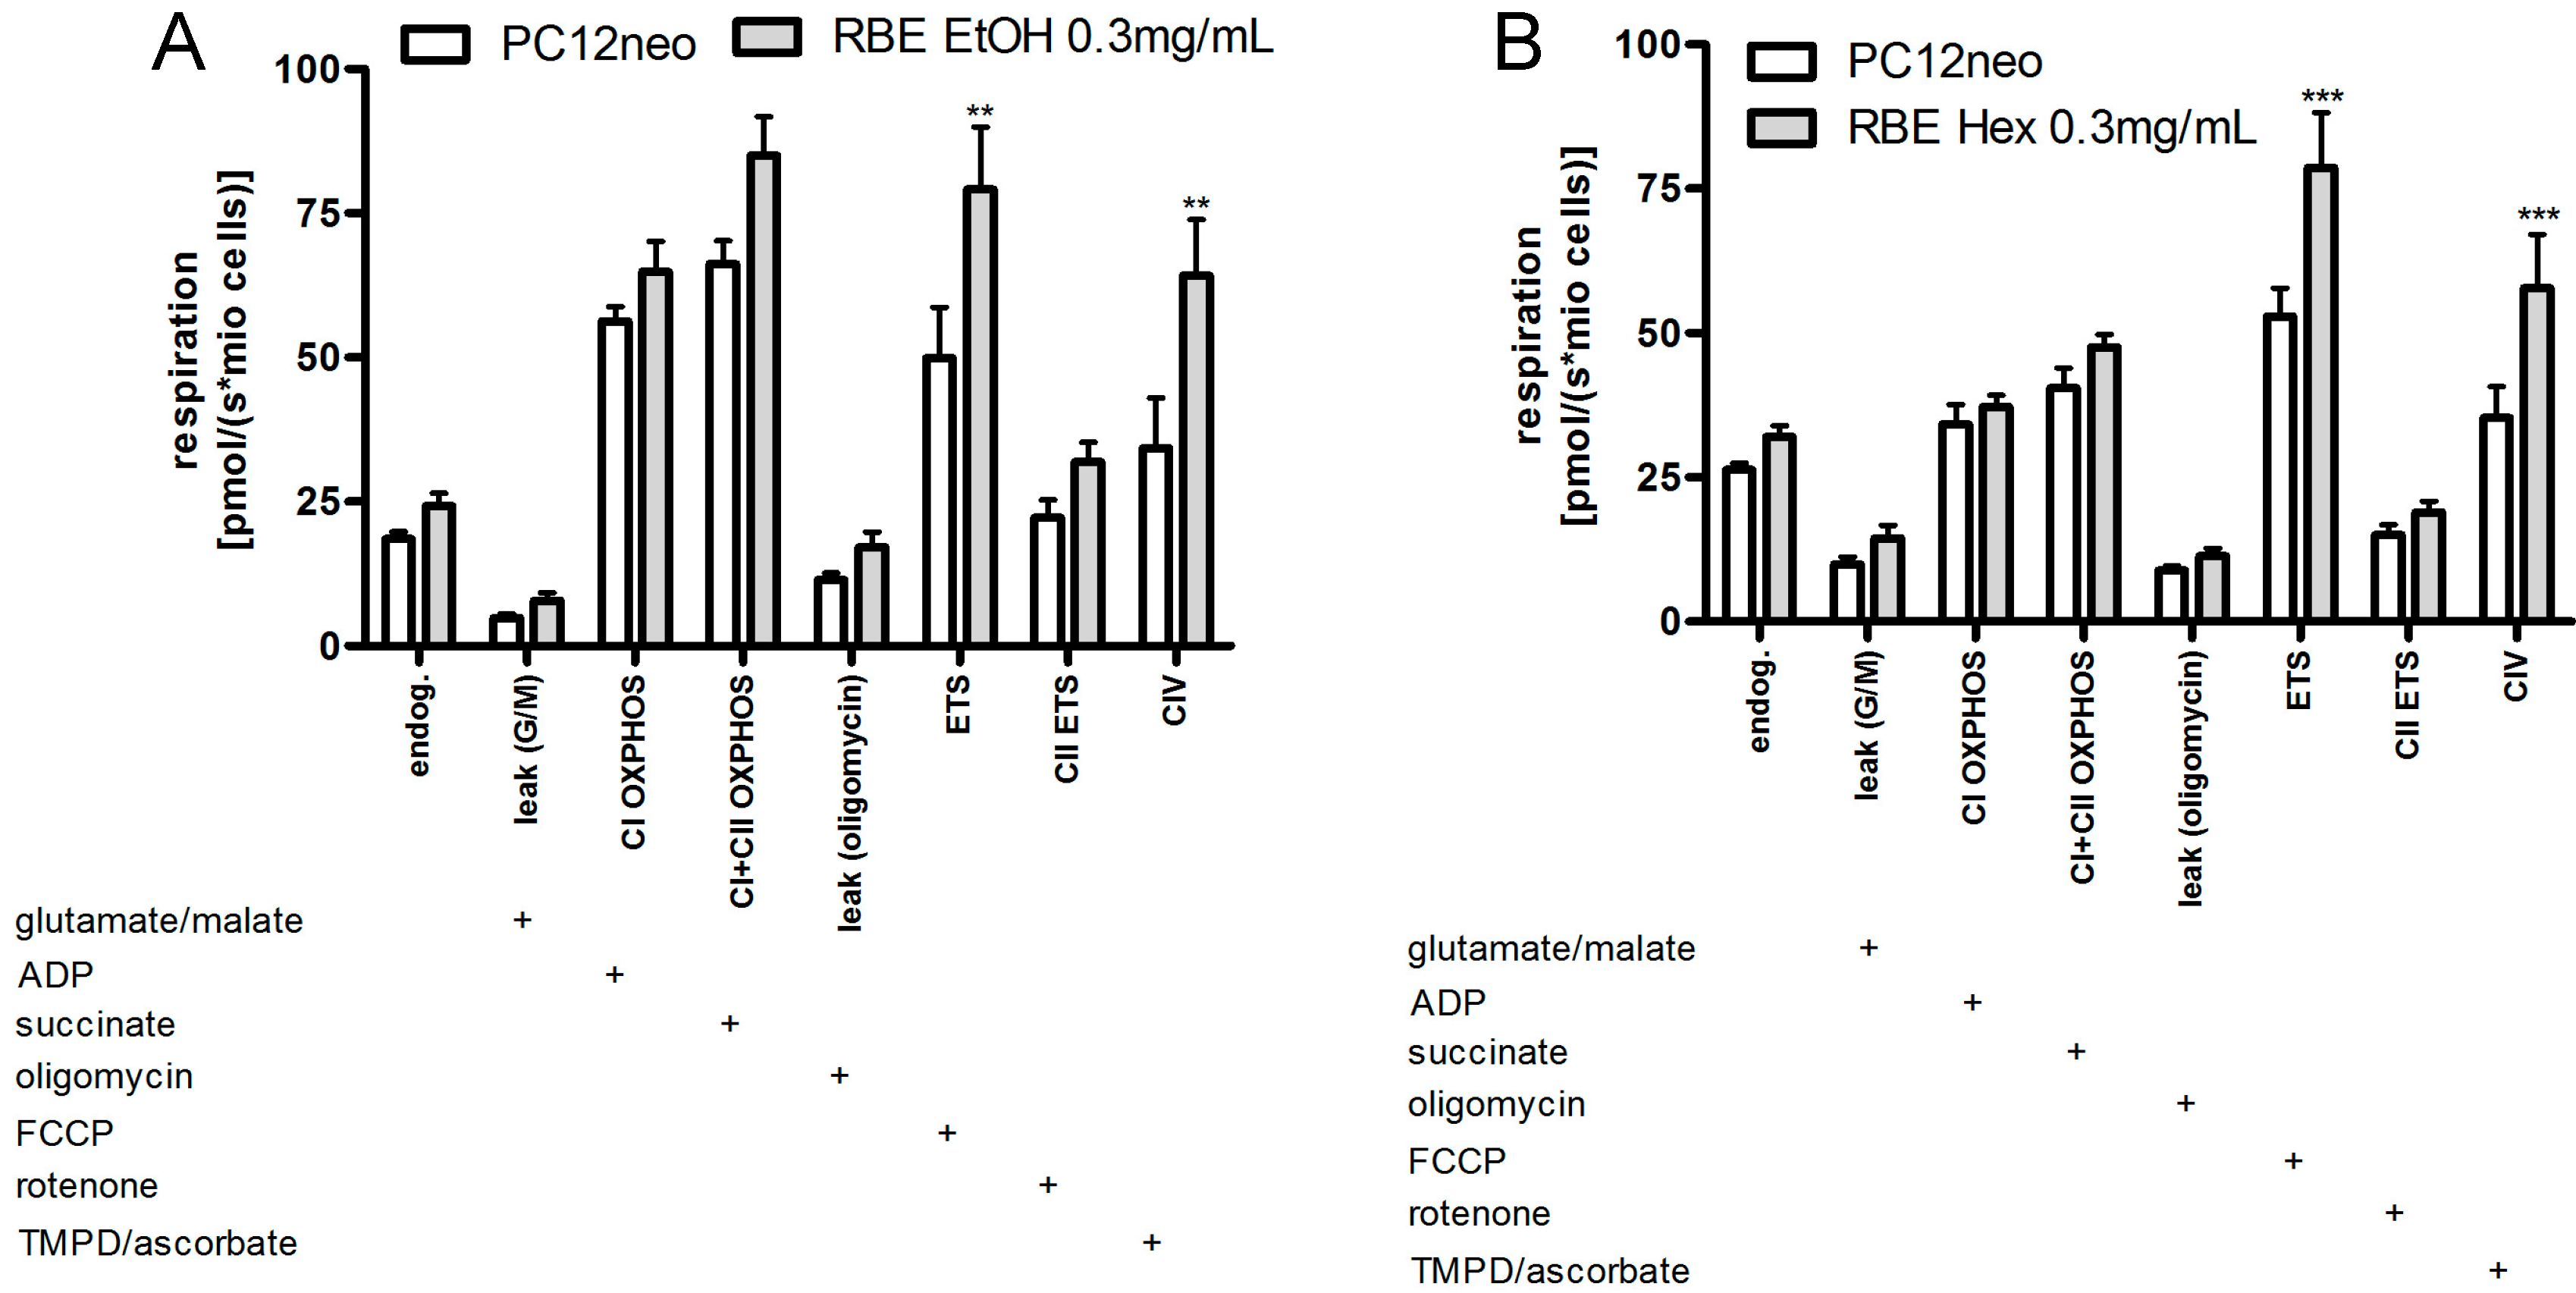
Incubation of PC12 cells with ethanolic and hexanic RBE (0.3 mg/mL) increased mitochondrial respiration to a similar extent (
Figure 4). In detail, incubation with ethanolic RBE significantly increased uncoupled and complex IV respiration (
p < 0.01). Endogenous respiration, complex I and II as well as OXPHOS respiration were numerically increased following RBE incubation (
Figure 4). Incubation with hexanic RBE significantly increased uncoupled and complex IV respiration (
p < 0.001). Endogenous as well as complex II and OXPHOS respiration were numerically increased (
Figure 4).
Figure 4.
Cell-count normalized respiration of PC12 cells after a 24-h incubation with 0.3 mg/mL ethanolic (RBE EtOH, (A)) or hexanic (RBE Hex; (B)) rice bran extract (RBE) and the respective solvent control ethanol (A) or DMSO (B); respiration was measured using an Oxygraph-2k (Oroboros, Austria); the addition of a substance into the Oxygraph chamber is indicated with a plus sign; for a detailed measurement protocol, see Materials and Methods Section; n = 9–12; mean ± SEM; ANOVA with Bonferroni post-test; ** p< 0.01; *** p < 0.001.
Respiratory control ratio (RCR) was calculated as ratio between OXPHOS respiration and leak respiration after addition of oligomycin [
15]. RCR is an indicator for the coupling of the electron transport system [
16]. RCR was numerically, though not significantly, increased in PC12 cells after 24-h incubation with ethanolic or hexanic RBE (
Figure 5).
Figure 5.
Respiratory control ratio (RCR) of PC12 cells after 24-h incubation with 0.3 mg/mL ethanolic (EtOH, (A)) or hexanic (Hex, (B)) rice bran extract (RBE) and the respective solvent control ethanol (A) or DMSO (B); respiration was measured using an Oxygraph-2k; RCR was calculated as ratio between uncoupled respiration and leak respiration after addition of oligomycin; n = 9–12; mean ± SEM; ANOVA with Tukey’s post-test.
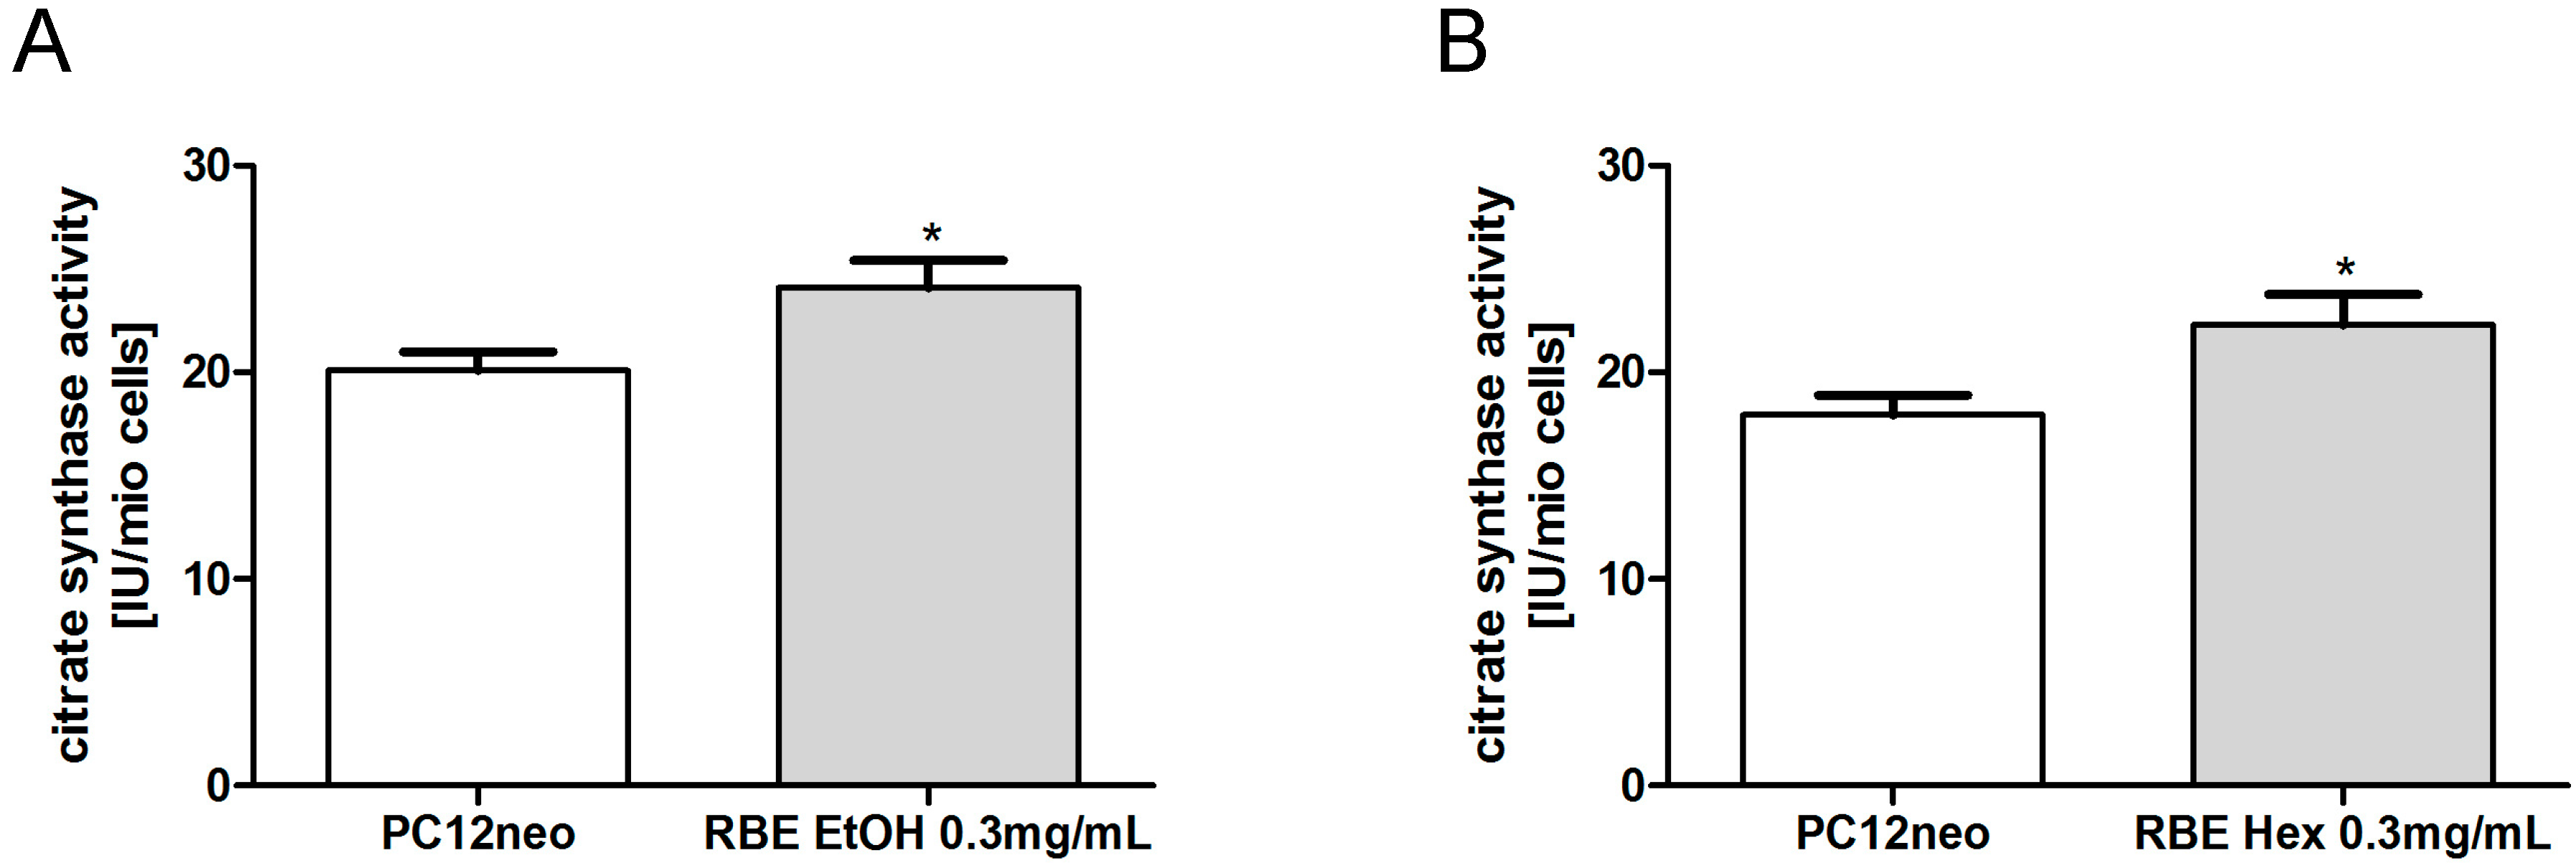
Citrate synthase (CS) activity is a common quantitative marker for the content of intact mitochondria [
17]. CS activity was significantly increased in PC12 cells after a 24-h incubation with either ethanolic or hexanic RBE (
p < 0.05;
Figure 6).
Figure 6.
Mitochondrial content marker citrate synthase (CS) activity was significantly increased after 24-h incubation of PC12 cells with ethanolic (RBE EtOH, (A)) or hexanic (RBE Hex, (B)) rice bran extract (RBE); n = 8–12; mean ± SEM; ANOVA with Tukey’s post-test; * p < 0.05.
Figure 6.
Mitochondrial content marker citrate synthase (CS) activity was significantly increased after 24-h incubation of PC12 cells with ethanolic (RBE EtOH, (A)) or hexanic (RBE Hex, (B)) rice bran extract (RBE); n = 8–12; mean ± SEM; ANOVA with Tukey’s post-test; * p < 0.05.
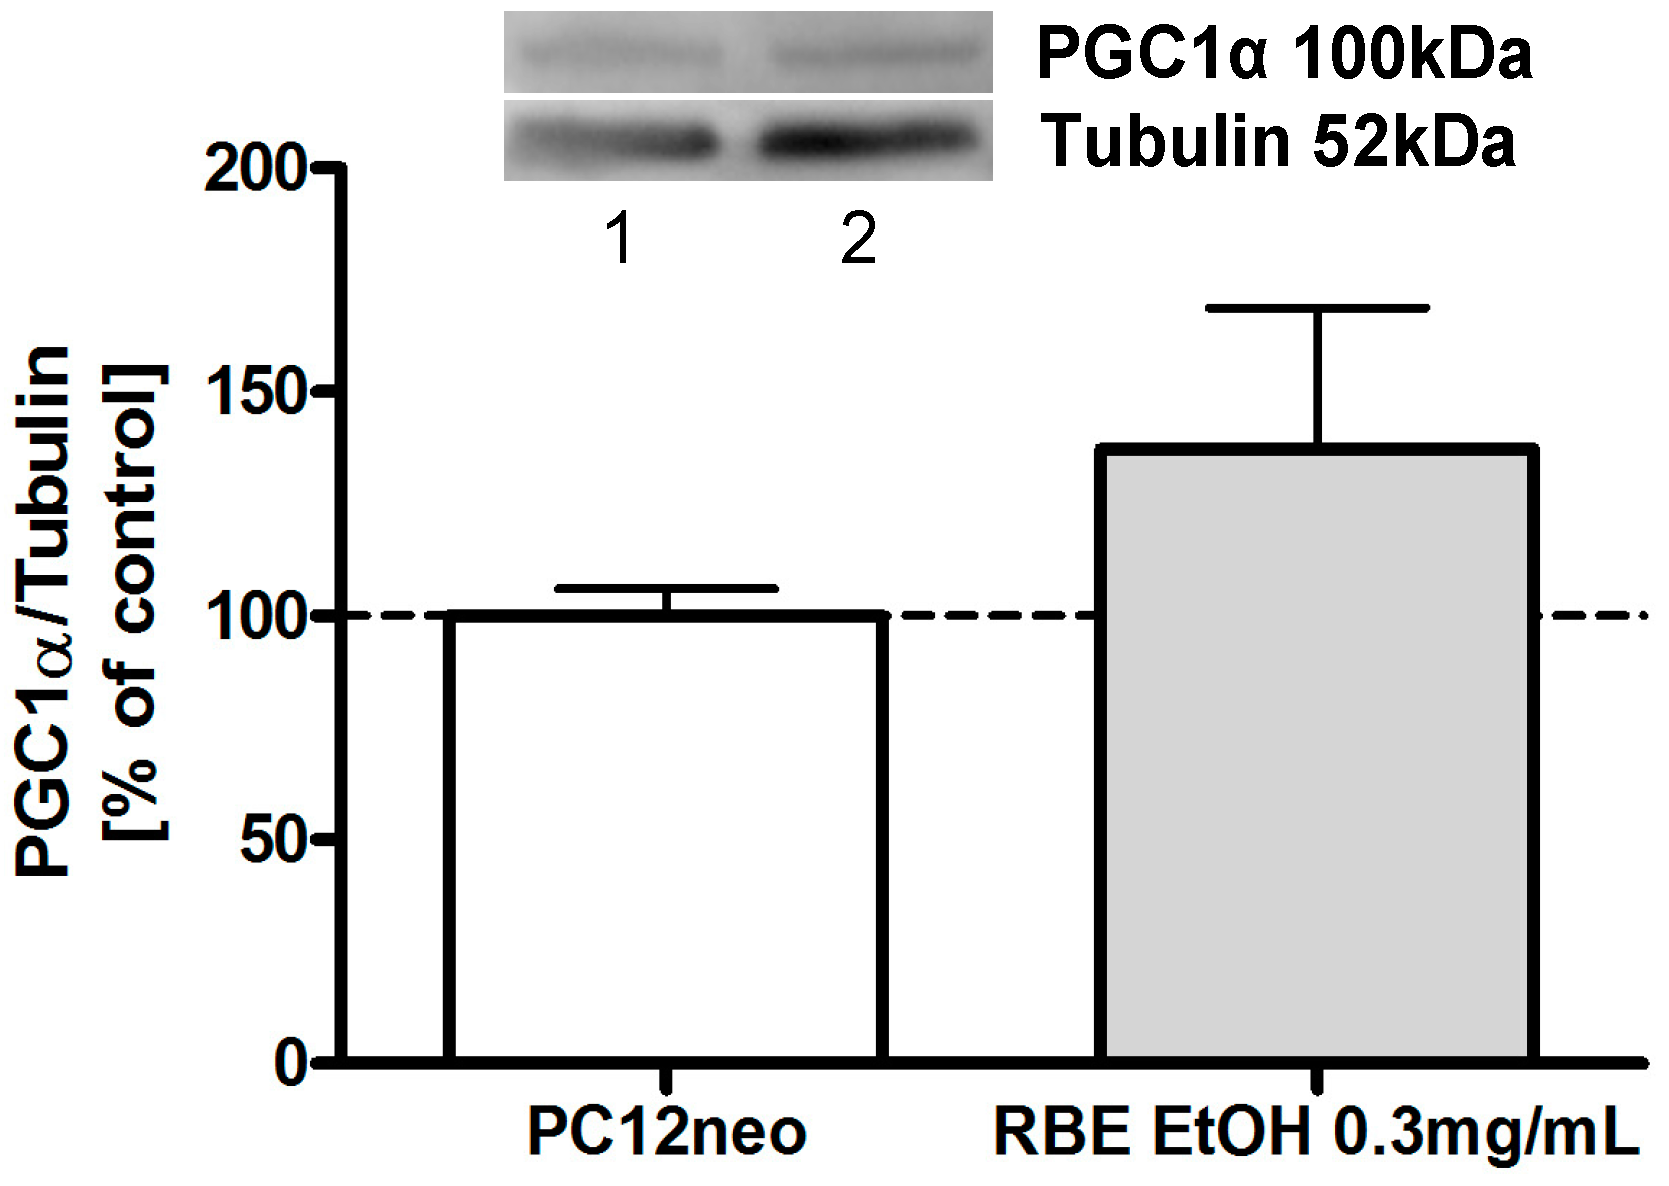
Peroxisome proliferator-activated receptor gamma coactivator-1α (PGC1α) is the master regulator of mitochondrial biogenesis and energy expenditure [
18]. We have recently shown that incubation of PC12 cells with hexanic RBE (0.3 mg/mL) for 24 h significantly increased PGC1α protein expression [
12]. Similarly, 24-h incubation of PC12 cells with ethanolic RBE increased protein expression of PGC1α to around 130%, although this increase did not attain significance (
Figure 7).
Figure 7.
Protein expression of PGC1α, a master regulator of mitochondrial biogenesis, was increased in PC12 cells after a 24-h incubation with ethanolic rice bran extract (RBE); cells incubated with ethanol served as control for normalization; pictures of representative Western blots are depicted in the upper part of the figure (1: EtOH, 2: RBE EtOH 0.3 mg/mL); n = 12; mean ± SEM; ANOVA with Tukey’s post-test.
2.3. Single Substances and Fractions of RBE
Both RBE similarly influenced mitochondrial function in PC12 cells by elevating mitochondrial membrane potential, ATP concentrations, mitochondrial respiration and mitochondrial content. We therefore attempted to learn more about the responsible bioactive compound(s) by assessing whether selected components of RBE are solely or mostly responsible for the positive effects of RBE on mitochondrial function. For that purpose, we examined the effects of key components of RBE as pure substances on MMP and ATP concentrations in PC12 cells. Based on tocopherol and tocotrienol concentrations in ethanolic RBE (
Table 1), the concentrations of pure substances for cell culture experiments were calculated to represent those present in the extracts. The smaller concentrations tested correspond to the amount of the substance found in 0.3 mg/mL RBE. A five times higher concentration of each substance was tested to reveal potential concentration-dependent effects.
Treatment of PC12 cells with α-tocotrienol, γ-tocotrienol, δ-tocotrienol, α-tocopherol, γ-tocopherol, α-CEHC (CEHC are the end-products of vitamin E metabolism; 100 and 500 nM), γ-CEHC (100 and 500 nM) or ferulic acid (a major phenolic acid of RBE; 4 and 20 µM) for 24 h did not have any effect on basal MMP or MMP after insult with SNP (0.5 mM) for 24 h (see
Table 2, part of the data is not shown). Similarly, no effect of the above mentioned substances on basal ATP concentrations after 6 h incubation or ATP concentrations after insult with SNP (0.5 mM) for 6 h could be detected (data not shown).
On the other hand, a 24-h incubation of cells with α-tocopherol (50 nM), δ-tocopherol (70 nM), α-tocotrienol (40 nM) and γ-tocotrienol (1 µM) significantly increased basal ATP concentrations (see
Table 2), indicating that these substances contribute to the positive effects of RBE on mitochondrial function.
To confirm our results obtained from the above-described experiments, we additionally examined MMP and ATP concentrations after incubation of PC12 cells with different fractions of rice bran extract. Fraction II is a methanol-soluble fraction comprising around 30% of hexanic RBE. It mostly contains oryzanols and tocotrienols, but no tocopherols; furthermore, it contains plant-derived omega-3 fatty acids, most likely α-linolenic acid. Fraction III is a methanol-insoluble fraction comprising around 60% of hexanic RBE and containing mostly oryzanols. Fraction IV is a polar fraction comprising around 2% of hexanic RBE. Fraction V was extracted from Fraction II and mainly consists of tocotrienols.
Table 2.
Basal ATP concentrations and mitochondrial membrane potential (MMP) of PC12 cells after 24-h incubation with the indicated pure substances contained in rice bran extract (RBE) and MMP and ATP after preincubation with pure substances for 1 h and subsequent insult with SNP (0.5 mM) for 6 h (ATP) or 24 h (MMP); the solvent control ethanol did not change ATP concentrations significantly; ↑ indicates increased ATP concentrations; -: no significant effect could be detected; n.t.: not tested; n = 7–8; ANOVA with Tukey’s post-test.
| Substance (Concentration) | ATP | ATP + SNP | MMP | MMP + SNP |
|---|
| α-Tocopherol (50 nm) | p < 0.05 (↑) | - | - | - |
| α-Tocopherol (250 nM) | - | - | - | - |
| γ-Tocopherol (200 nM) | - | - | - | - |
| γ-Tocopherol (1 µM) | - | n.t. | n.t. | n.t. |
| δ-Tocopherol (70 nM) | p < 0.05 (↑) | n.t. | n.t. | n.t. |
| δ-Tocopherol (350 nM) | - | n.t. | n.t. | n.t. |
| α-Tocotrienol (40 nM) | p < 0.001 (↑) | - | - | - |
| α-Tocotrienol (200 nM) | - | n.t. | n.t. | n.t. |
| γ-Tocotrienol (1 µM) | p < 0.05 (↑) | - | - | - |
| γ-Tocotrienol (5 µM) | - | - | - | - |
| δ-Tocotrienol (200 nM) | - | - | - | - |
| δ-Tocotrienol (1 µM) | - | n.t. | n.t. | n.t. |
Fraction II increased basal MMP and protected PC12 cells from SNP-induced stress (see
Table 3). All other fractions did not have any effects on basal MMP and ATP concentrations or on MMP and ATP concentrations after SNP-insult. Since the available amount of the fractions was limited, we were not able to measure ATP concentrations of PC12 cells after an incubation time of 24 h.
Table 3.
Basal mitochondrial membrane potential (MMP) and ATP concentrations of PC12 cells after 25-h incubation (MMP) or 7-h incubation (ATP) with fractions extracted from hexanic rice bran extract (RBE),0.3 mg/mL) as well as MMP and ATP concentrations of PC12 cells after preincubation with fractions for 1 h and subsequent insult with SNP (0.5 mM) for 6 h (ATP) or 24 h (MMP); n = 4–5; ANOVA with Tukey’s post-test; ↑ indicates increased MMP or ATP; -: no significant effect could be detected.
| Fraction | MMP | MMP + SNP (0.5 mM) | ATP | ATP + SNP (0.5 mM) |
|---|
| II | p < 0.001 (↑) | p < 0.001 (↑) | - | - |
| III | - | - | - | - |
| IV | - | - | - | - |
| V | - | - | - | - |
2.4. Discussion
In this study, vitamin E profiles of ethanolic and hexanic rice bran extracts (RBE) were compared and their effects on mitochondrial function in PC12 cells examined. Furthermore, we aimed to identify the active ingredients or a single component of the extracts that are responsible for the observed beneficial effects on mitochondrial function.
The concentrations of all eight vitamin E congeners were determined in ethanolic and hexanic RBE. Total vitamin E content was similar in both extracts (3 mg/g), with the composition of the congeners varying between the extracts (
Table 1). Rice bran contains total vitamin E concentrations of around 0.2 mg/g [
19], while RBE have been reported to contain total vitamin E concentrations between 0.36 and 1.1 mg/g [
20,
21]. Factors influencing total vitamin E content in rice bran and RBE are rice variety, growing area and the solvent and temperature used for extraction [
19,
20,
21]. Accordingly, we conclude that both RBE used in our study have comparatively high total vitamin E contents. According to Chen and coworkers [
21], the solvent used for extraction influences total vitamin E content. The use of methanol as extraction solvent led to the highest vitamin E content in the extract; ethyl acetate resulted in medium vitamin E content, and hexane yielded very low vitamin E contents. While the authors conclude that using a high-polarity solvent such as methanol will result in extraction of most phytochemicals, no considerable differences in vitamin E content were observed after using ethanol or hexane as extraction solvents for RBE in the present study.
We then examined the effects of both RBE on mitochondrial function in PC12 cells. Effects of the two extracts were very similar; both extracts increased mitochondrial membrane potential, ATP concentrations, mitochondrial respiration and resistance of cells against nitrosative stress. The underlying mode of action of RBE seems to be increased mitochondrial biogenesis via a PGC1α-dependent mechanism. We recently reported that RBE incubation was able to restore mitochondrial dysfunction in a cell culture model of Alzheimer’s disease (PC12
APPsw) by increasing mitochondrial content, PGC1α protein concentrations, mitochondrial respiration, ATP production and resistance of cells against nitrosative stress [
13]. Similarly, we could show that feeding RBE to young guinea pigs for 30 days improved brain mitochondrial function by increasing mitochondrial content and mitochondrial respiration and by protecting cells from oxidative and nitrosative stress [
12]. These results show that the effects of RBE are comparable in cell culture and animal models. The observed effects of ethanolic and hexanic RBE on mitochondrial function of PC12 cells were similar although not exactly identical; probably due to slightly different extract compositions.
Since we were previously able to clarify the mechanism of action of RBE in cell culture and animal models, we now aimed to identify the active ingredient(s) of RBE that is (are) responsible for the beneficial effects on mitochondrial function. For this purpose, we tested the effects of the three known key components of RBE (tocopherols, tocotrienols and γ-oryzanol) as well as of their metabolites α- and γ-carboxyethyl hydroxychroman (CEHC) and ferulic acid on mitochondrial function in PC12 cells. We tested pure substances in concentrations that are comparable to those present in 0.3 mg RBE/mL as well as a five times higher concentration. None of the pure substances showed any effects on basal MMP or on MMP and ATP concentrations after insult with SNP. On the other hand, a 24-h incubation of cells with α-tocopherol (50 nM), δ-tocopherol (70 nM), α-tocotrienol (40 nM and 200 nM) and γ-tocotrienol (1 µM) significantly increased basal ATP concentrations, with α-tocotrienol exhibiting the largest effect. These results indicate that α-tocopherol, δ-tocopherol, γ-tocotrienol and in particular α-tocotrienol contributes to the positive effects of RBE on mitochondrial function. Nevertheless, none of these substances appears to be solely responsible for the effects of RBE on mitochondrial function, since the pure substances did not alter basal MMP and did not protect cells from SNP-induced nitrosative stress.
Over the last few decades, research was mainly focused on α-tocopherol, since this was considered to be the most effective vitamin E compound. Recent research, on the other hand, revealed that tocotrienols might be more effective in protecting neurons and in preventing mitochondrial dysfunction than tocopherols [
22,
23,
24,
25,
26]. This is in accordance with our observation that α-tocotrienol elevated basal ATP concentrations more effectively than all other vitamin E congeners. Similarly, α-tocotrienol was the only vitamin E form found to accumulate concentration-dependently in guinea pig brains after RBE administration; we therefore hypothesized that it must at least be involved in the concentration-dependent beneficial effects on mitochondrial function that we observed [
12]. Accordingly, it stands to reason that α-tocotrienol is one of the bioactive components of RBE.
Like rice bran oil, rice bran extracts most likely contain unsaturated fatty acids such as linolenic acid and isoprenoids such as squalene [
27]. ω-3 unsaturated fatty acids have already been reported to protect brain mitochondrial function in guinea pigs [
28] and aged mice [
29]. Furthermore, ω-3 fatty acids are also known to have various other beneficial health effects [
30]. Squalene is especially known for its potential as antioxidant [
31]. Recent studies indicated that the ratio of different unsaturated fatty acids is able to influence mitochondrial function [
32,
33]. According to these results, unsaturated fatty acids in RBE could very well contribute to its beneficial effects on mitochondria. Further experiments will have to be conducted to clarify this matter. Another component of rice bran, which we have so far not examined in our studies, is hydrophilic rice bran saccharide. Rice bran saccharide has been found to have anti-carcinogenic properties [
34] but other potential health-beneficial effects of the saccharide have, to our knowledge, not yet been investigated. Nevertheless, it is debatable whether rice bran saccharide is present in our RBEs since hexane and ethanol will not extract hydrophilic compounds. Another possibility for the fact that we could not identify a single component responsible for RBEs beneficial effects on mitochondrial function might be that the mode of action of our extract involves a synergism between different extract components.
To test if a certain group of components is responsible for the beneficial effects of RBE on mitochondrial function, the effects of four different fractions of ethanolic RBE on mitochondrial function have been examined. We tested the effect of the four fractions on basal MMP and ATP concentrations as well as on MMP and ATP concentrations after insult with SNP. Fraction II is a methanol-soluble fraction mainly containing tocotrienols and oryzanols that increased basal MMP and protected MMP from SNP-induced stress. Fraction II did not increase basal ATP concentrations; most likely since the 7-h incubation time was too short and the experiment could not be repeated with a longer incubation time due to limited amounts of RBE fractions. RBE also did not have an effect on basal ATP concentrations after 7-h incubation time. Only after a 24-h incubation time, RBE increased basal ATP concentrations. Therefore, Fraction II has very similar effects on MMP as the whole RBE, but does not affect ATP concentrations. The other three fractions did not significantly affect MMP and ATP concentrations of PC12 cells.
It is likely that tocotrienols and/or γ-oryzanol present in the methanol-insoluble fraction (fraction II) are at least partly responsible for the mitochondria-protective effects of RBE in PC12 cells. Nevertheless, Fraction V (containing tocotrienols and no γ-oryzanol) as well as Fraction III (containing γ-oryzanol and no tocotrienols) did not show any effects on MMP and ATP, which suggests a synergistic effect between at least these two components that enables them to protect mitochondria. Another possibility is the presence of a hitherto unknown component of RBE in Fractions II, III and/or V. A more exact characterization of the extracts and the single fractions will be necessary for the exact identification of all components responsible for the beneficial effects of RBE on mitochondrial function.


