
Quantitative Structure Activity Relationship of Cinnamaldehyde Compounds against Wood-Decaying Fungi


Abstract
:
1. Introduction
2. Results and Discussion
2.1. Determining Optimal QSAR Models against Trametes versicolor and Gloeophyllun trabeum
2.1.1. Establishing Optimal QSAR Models
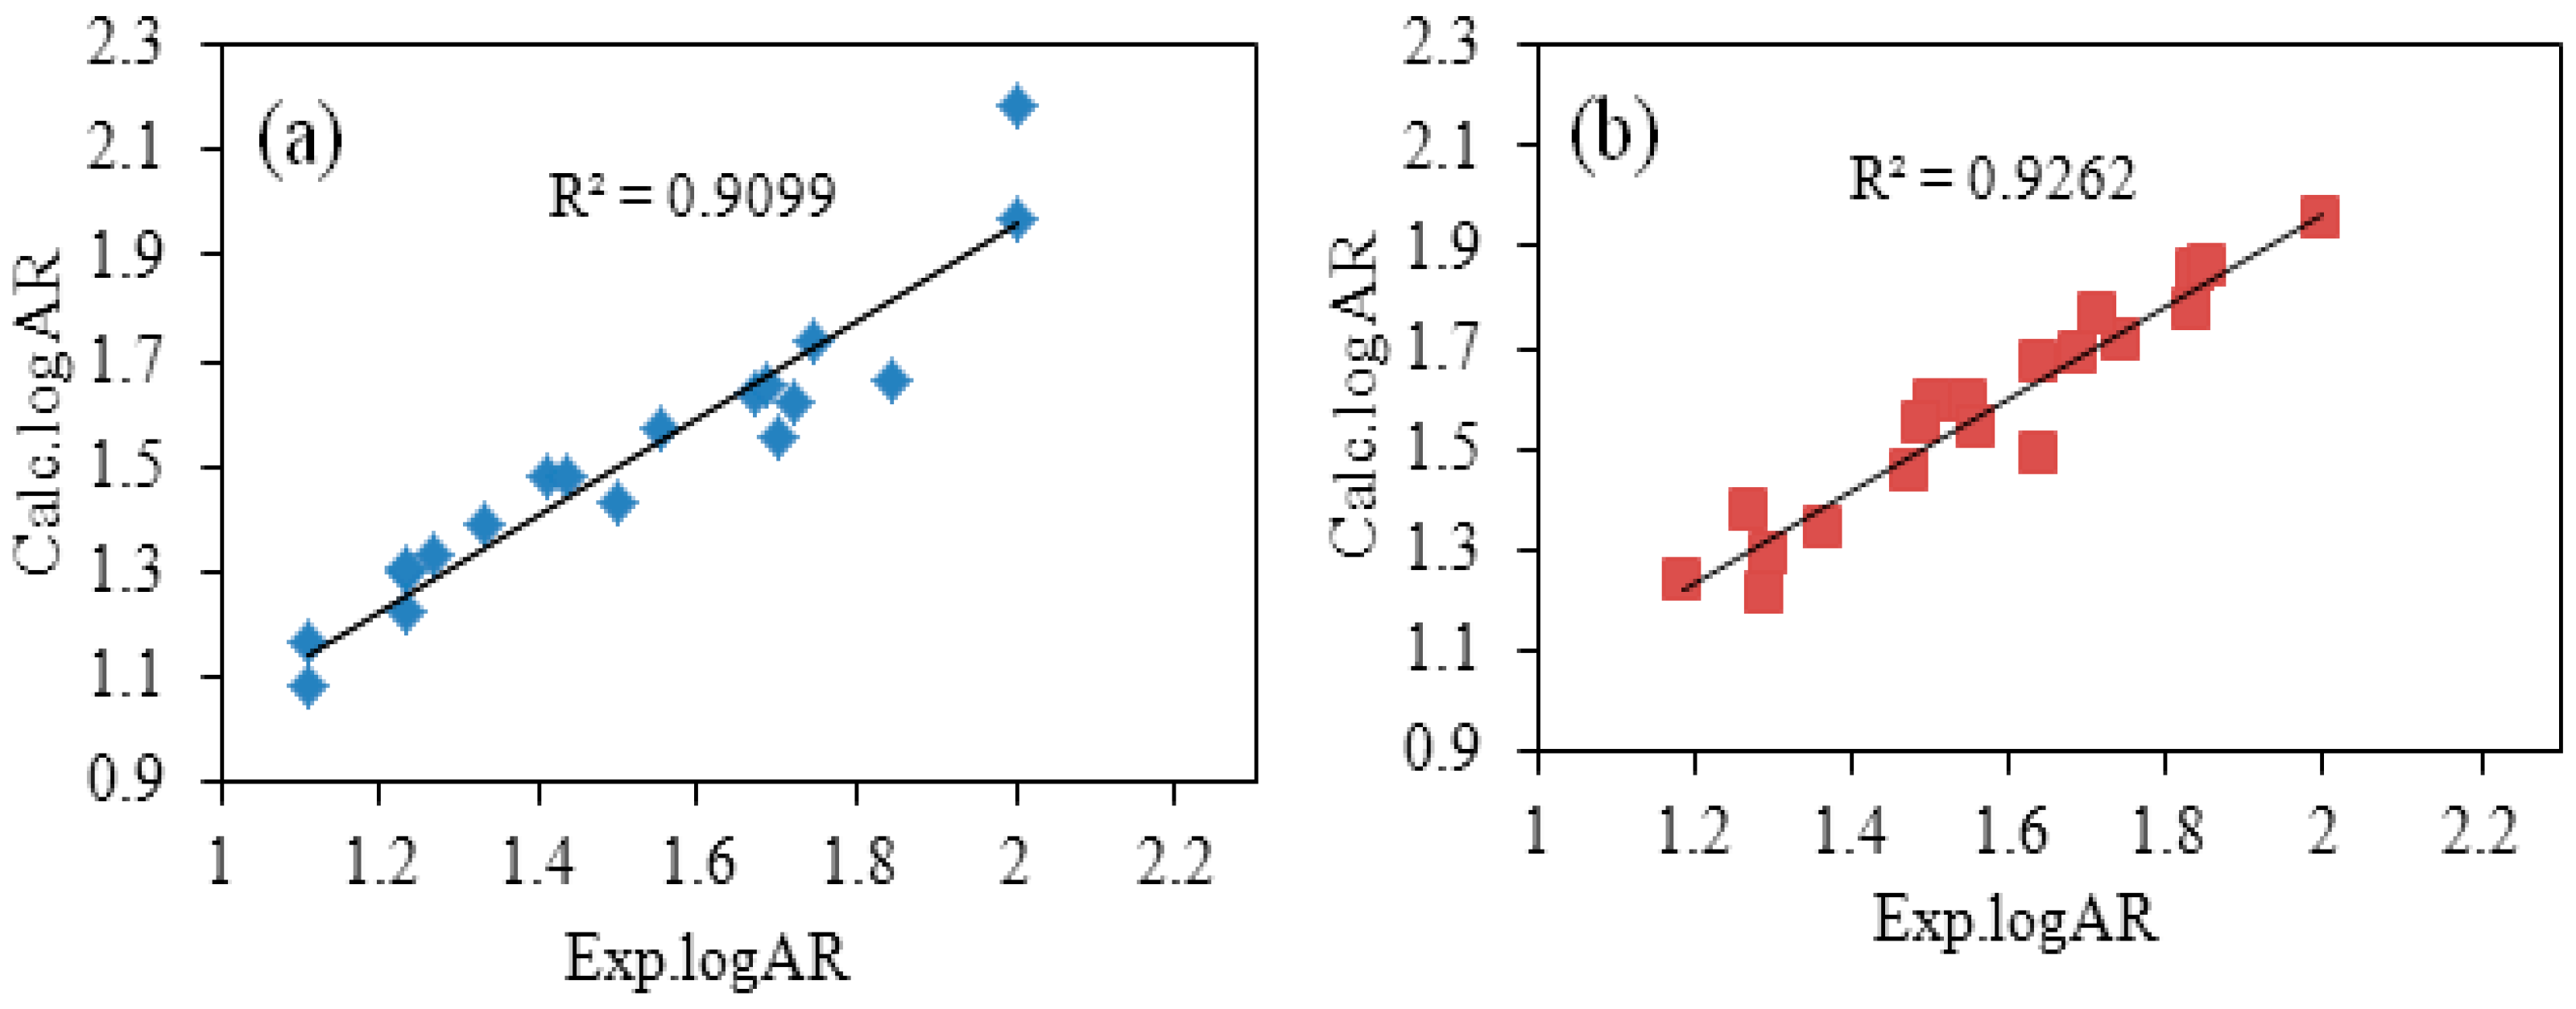
2.1.2. Validation of Optimal QSAR Models
2.1.3. Descriptor Analysis in the Optimal QSAR Models
2.1.4. Designing the New Compound with High Bioactivity, Calculating Its AR
3. Materials and Methods
3.1. Materials
3.2. Method
3.2.1. Paper Disc Method
3.2.2. Establishing QSAR Models
- (1)
- Molecule structure geometry optimization: By ChemDraw3D software, the structures of 19 cinnamaldehyde compounds were drawn, and their three-dimensional structures were initially optimized geometrically using the MM2+ function. The initial optimized structures were inputted in AMPAC Agui 9.2.1 software to conduct geometric optimizing.
- (2)
- Descriptor calculation: In Codessa 2.7.16 software, 4 kinds of descriptors could be calculated for a molecular, Molecule descriptor, Fragment descriptor, Pair and Atom descriptor. In this paper, optimal structures of cinnamaldehyde derivatives were inputted into Codessa 2.7.16 software to calculate Molecule descriptors. These descriptors were divided into six groups: structural, topological, geometrical, thermodynamic, electrostatic, and quantum-chemical descriptors. All were involved in this paper with the exception of thermodynamic descriptor. These descriptors were the basis for establishing the QSAR models [25].
- (3)
- The establishing for best QSAR model: The Best Multi-Linear Regression equation was built by Codessa 2.7.16 software [26]. After Best Multi-Linear Regression analysis, a series of QSAR models were developed. A general method “breaking point” was used to determine the number of descriptors by searching the breaking point of the two R2 trend lines. The relationship between R2 and number of descriptor were described as Figure 1 [27]. Two different solutions were used to validate the best models and to explore predictability and stability–internal validation and external validation, respectively.
3.2.3. Validating QSAR Models
3.2.4. Design of New Compounds
4. Conclusions
Acknowledgments
Author Contributions
Conflicts of Interest
References
- Singh, T.; Singh, A.P. A review on natural products as wood protectant. Wood Sci. Technol. 2012, 46, 851–870. [Google Scholar] [CrossRef]
- Coors, A.; Weisbrod, B.; Schoknecht, U.; Sacher, F.; Kehrer, A. Predicting acute and chronic effects of wood preservative products in Daphnia magna and Pseudokirchneriella subcapitata based on the concept of concentration addition. Environ. Toxicol. Chem. 2014, 33, 382–393. [Google Scholar] [CrossRef] [PubMed]
- Kalawate, A.; Shahoo, S.C.; Khatua, P.K.; Das, H.S. Evaluation of Mechanical Properties of Plywood Treated with a new Wood Preservative (CEB) Chemical. J. Inst. Eng. (India) Ser. D 2016, 1–5. [Google Scholar] [CrossRef]
- Yen, T.-B.; Chang, S.-T. Synergistic effects of cinnamaldehyde in combination with eugenol against wood decay fungi. Bioresour. Technol. 2008, 99, 232–236. [Google Scholar] [CrossRef] [PubMed]
- Bassolé, I.H.N.; Juliani, H.R. Essential oils in combination and their antimicrobial properties. Molecules 2012, 17, 3989–4006. [Google Scholar] [CrossRef] [PubMed]
- Cheng, S.-S.; Liu, J.-Y.; Chang, E.-H.; Chang, S.-T. Antifungal activity of cinnamaldehyde and eugenol congeners against wood-rot fungi. Bioresour. Technol. 2008, 99, 5145–5149. [Google Scholar] [CrossRef] [PubMed]
- Burt, S. Essential oils: Their antibacterial properties and potential applications in foods—A review. Int. J. Food Microbiol. 2004, 94, 223–253. [Google Scholar] [CrossRef] [PubMed]
- Li, H.; Shen, Q.; Zhou, W.; Mo, H.; Pan, D.; Hu, L. Nanocapsular dispersion of cinnamaldehyde for enhanced inhibitory activity against aflatoxin production by Aspergillus flavus. Molecules 2015, 20, 6022–6032. [Google Scholar] [CrossRef] [PubMed]
- Bakkali, F.; Averbeck, S.; Averbeck, D.; Idaomar, M. Biological effects of essential oils—A review. Food Chem. Toxicol. 2008, 46, 446–475. [Google Scholar] [CrossRef] [PubMed]
- Wei, Q.-Y.; Xiong, J.-J.; Jiang, H.; Zhang, C.; Ye, W. The antimicrobial activities of the cinnamaldehyde adducts with amino acids. Int. J. Food Microbiol. 2011, 150, 164–170. [Google Scholar] [CrossRef] [PubMed]
- Unlu, M.; Ergene, E.; Unlu, G.V.; Zeytinoglu, H.S.; Vural, N. Composition, antimicrobial activity and in vitro cytotoxicity of essential oil from Cinnamomum zeylanicum Blume (Lauraceae). Food Chem. Toxicol. 2010, 48, 3274–3280. [Google Scholar] [CrossRef] [PubMed]
- Zhang, Y.; Li, S.; Kong, X. Relationship between antimold activity and molecular structure of cinnamaldehyde analogues. Bioorg. Med. Chem. Lett. 2013, 23, 1358–1364. [Google Scholar] [CrossRef] [PubMed]
- Morrison, D.F. Applied Linear Statistical Methods; Prentice Hall: Upper Saddle River, NJ, USA, 1983. [Google Scholar]
- Shahlaie, M.; Fassihi, A.; Pourhossein, A.; Arkan, E. Statistically validated QSAR study of some antagonists of the human CCR5 receptor using least square support vector machine based on the genetic algorithm and factor analysis. Med. Chem. Res. 2013, 22, 1399–1414. [Google Scholar] [CrossRef]
- Dyekjær, J.D.; Jónsdóttir, S.Ó. QSPR models for various physical properties of carbohydrates based on molecular mechanics and quantum chemical calculations. Carbohydr. Res. 2004, 339, 269–280. [Google Scholar] [CrossRef] [PubMed]
- Yu, G.; Wen, L.; Zhao, D.; Asumana, C.; Chen, X. QSPR study on the viscosity of bis (trifluoromethylsulfonyl) imide-based ionic liquids. J. Mol. Liq. 2013, 184, 51–59. [Google Scholar] [CrossRef]
- Wang, H.; Yuan, H.; Li, S.; Li, Z.; Jiang, M.; Tang, J. Activity Prediction of Schiff Base Compounds using Improved QSAR Models of Cinnamaldehyde Analogues and Derivatives. BioResources 2015, 10, 7921–7935. [Google Scholar]
- Beteringhe, A.; Radutiu, A.C.; Culita, D.C.; Mischie, A.; Spafiu, F. Quantitative structure-retention relationship (QSRR) study for predicting gas chromatographic retention times for some stationary phases. QSAR Comb. Sci. 2008, 27, 996–1005. [Google Scholar] [CrossRef]
- Noorbatcha, I.A.; Hamzah, F.; Salleh, H.; Idid, S.Z. Prediction of anticancer activity of aliphatic nitrosoureas using quantum chemical quantitative structure activity relation (QSAR) methods. Afr. J. Biotechnol. 2011, 10, 18863–18868. [Google Scholar] [CrossRef]
- Han, C.; Yu, G.; Wen, L.; Zhao, D.; Asumana, C.; Chen, X. Data and QSPR study for viscosity of imidazolium-based ionic liquids. Fluid Phase Equilib. 2011, 300, 95–104. [Google Scholar] [CrossRef]
- Ni, Z.; Lin, X. Insight into substituent effects in Cal-B catalyzed transesterification by combining experimental and theoretical approaches. J. Mol. Model. 2013, 19, 349–358. [Google Scholar] [CrossRef] [PubMed]
- Yuan, H.; Wang, H.; Li, Z.; Li, S.; Zhang, Y.; Chen, Y. Synthesis and antifungal property of N,N′-bis (trans-cinnamaldehyde)-1,2-diiminoethane and its derivatives. Toxicol. Environ. Chem. 2015, 97, 429–438. [Google Scholar] [CrossRef]
- Marrufo, T.; Nazzaro, F.; Mancini, E.; Fratianni, F.; Coppola, R.; De Martino, L.; Agostinho, A.B.; De Feo, V. Chemical composition and biological activity of the essential oil from leaves of Moringa oleifera Lam. cultivated in Mozambique. Molecules 2013, 18, 10989–11000. [Google Scholar] [CrossRef] [PubMed]
- Wang, H.; Nguyen, T.T.H.; Li, S.; Liang, T.; Zhang, Y.; Li, J. Quantitative structure–activity relationship of antifungal activity of rosin derivatives. Bioorg. Med. Chem. Lett. 2015, 25, 347–354. [Google Scholar] [CrossRef] [PubMed]
- Katritzky, A.R.; Lobanov, V.S.; Karelson, M. QSPR: The correlation and quantitative prediction of chemical and physical properties from structure. Chem. Soc. Rev. 1995, 24, 279–287. [Google Scholar] [CrossRef]
- Katritzky, A.R.; Stoyanova-Slavova, I.B.; Dobchev, D.A.; Karelson, M. QSPR modeling of flash points: An update. J. Mol. Graph. Model. 2007, 26, 529–536. [Google Scholar] [CrossRef] [PubMed]
- Song, J.; Wang, Z.; Findlater, A.; Han, Z.; Jiang, Z.; Chen, J.; Zheng, W.; Hyde, S. Terpenoid mosquito repellents: A combined DFT and QSAR study. Bioorg. Med. Chem. Lett. 2013, 23, 1245–1248. [Google Scholar] [CrossRef] [PubMed]
- Gramatica, P. Principles of QSAR models validation: Internal and external. QSAR Comb. Sci. 2007, 26, 694–701. [Google Scholar] [CrossRef]
- Consonni, V.; Ballabio, D.; Todeschini, R. Evaluation of model predictive ability by external validation techniques. J. Chem. 2010, 24, 194–201. [Google Scholar] [CrossRef]
- Wang, H.; Yuan, H.; Li, S.; Li, Z.; Jiang, M. Synthesis, antimicrobial activity of Schiff base compounds of cinnamaldehyde and amino acids. Bioorg. Med. Chem. Lett. 2016, 26, 809–813. [Google Scholar] [CrossRef] [PubMed]
- Sample Availability: Samples of the compounds are available from the authors.


| ID | AR | logAR | ESP-Min Net Atomic Charge for a H Atom, d1 | FNSA-3 Fractional PNSA (PNSA-3/TMSA), d2 | ESP-RPCS Relative Charged SA (SAMPOS*RPCG), d3 | YZ Shadow/YZ Rectangle, d4 |
|---|---|---|---|---|---|---|
| 1 | 100 | 2 | 0.0585 | −0.0241 | 1.3522 | 0.7903 |
| 2 | 25.71 | 1.4102 | 0.0966 | −0.0201 | 0.8218 | 0.7114 |
| 3 | 31.43 | 1.4973 | 0.1701 | −0.0271 | 0.7785 | 0.7839 |
| 4 | 17.14 | 1.2341 | 0.1632 | −0.0213 | 1.835 | 0.7882 |
| 5 | 17.14 | 1.2341 | 0.1363 | −0.0228 | 3.408 | 0.7929 |
| 6 | 27.14 | 1.4337 | 0.1084 | −0.0186 | 0.4471 | 0.7426 |
| 7 | 52.86 | 1.7231 | 0.085 | −0.0252 | 1.7969 | 0.7185 |
| 8 | 100.71 | 2.0031 | 0.0925 | −0.0387 | 1.2213 | 0.785 |
| 9 | 47.14 | 1.6734 | 0.1133 | −0.0336 | 4.4357 | 0.7926 |
| 10 | 35.71 | 1.5528 | 0.1022 | −0.0346 | 5.6513 | 0.7723 |
| 11 | 48.57 | 1.6864 | 0.0192 | −0.0089 | 0.1361 | 0.7008 |
| 12 | 18.57 | 1.2688 | 0.0576 | −0.0097 | 0.2772 | 0.6591 |
| 13 | 12.86 | 1.1091 | 0.1368 | −0.0135 | 0.6804 | 0.7483 |
| 14 | 12.86 | 1.1091 | 0.162 | −0.019 | 1.0966 | 0.7271 |
| 15 | 21.43 | 1.331 | 0.0888 | −0.0226 | 3.0572 | 0.7124 |
| 16 | 70 | 1.8451 | 0.1415 | −0.0367 | 2.1767 | 0.752 |
| 17 | 17.14 | 1.2341 | 0.1391 | −0.0266 | 2.3122 | 0.7225 |
| 18 | 50 | 1.699 | 0.0587 | −0.0143 | 1.1376 | 0.7302 |
| 19 | 55.71 | 1.746 | 0.0575 | −0.0274 | 0.4357 | 0.6287 |
| ID | AR | logAR | ESP-Min Net Atomic Charge for a H Atom, d1 | ESP-RPCS Relative Positive Charged SA (SAMPOS*RPCG), d5 | FNSA-3 (PNSA-3/TMSA), d6 | FNSA-3 Fractional PNSA (PNSA-3/TMSA), d7 |
|---|---|---|---|---|---|---|
| 1 | 100 | 2 | 0.0585 | 1.3522 | −0.0837 | −0.0241 |
| 2 | 33.65 | 1.5073 | 0.0966 | 0.8218 | −0.0635 | −0.0201 |
| 3 | 43.78 | 1.6413 | 0.1701 | 0.7785 | −0.0932 | −0.0271 |
| 4 | 18.65 | 1.2706 | 0.1632 | 1.835 | −0.0987 | −0.0213 |
| 5 | 19.46 | 1.2891 | 0.1363 | 3.408 | −0.0795 | −0.0228 |
| 6 | 30.81 | 1.4887 | 0.1084 | 0.4471 | −0.0629 | −0.0186 |
| 7 | 55.41 | 1.7436 | 0.085 | 1.7969 | −0.0773 | −0.0252 |
| 8 | 68.65 | 1.8366 | 0.0925 | 1.2213 | −0.0731 | −0.0387 |
| 9 | 48.65 | 1.6874 | 0.1133 | 4.4357 | −0.1226 | −0.0336 |
| 10 | 35.68 | 1.5524 | 0.1022 | 5.6513 | −0.1194 | −0.0346 |
| 11 | 68.11 | 1.8332 | 0.0192 | 0.1361 | −0.0354 | −0.0089 |
| 12 | 43.38 | 1.6373 | 0.0576 | 0.2772 | −0.0512 | −0.0097 |
| 13 | 19.73 | 1.2951 | 0.1368 | 0.6804 | −0.0625 | −0.0135 |
| 14 | 15.41 | 1.1877 | 0.162 | 1.0966 | −0.0726 | −0.0190 |
| 15 | 29.73 | 1.4732 | 0.0888 | 3.0572 | −0.0709 | −0.0226 |
| 16 | 71.76 | 1.8559 | 0.1415 | 2.1767 | −0.1262 | −0.0367 |
| 17 | 23.24 | 1.3663 | 0.1391 | 2.3122 | −0.0760 | −0.0266 |
| 18 | 36.49 | 1.5621 | 0.0587 | 1.1376 | −0.0424 | −0.0143 |
| 19 | 51.89 | 1.7151 | 0.0575 | 0.4357 | −0.0408 | −0.0274 |
| Descriptor No. | X | ΔX | t Test Value | Name of Descriptor |
|---|---|---|---|---|
| 0 | −0.26082 | 0.4278 | −0.6098 | Intercept |
| 1 | −5.8562 | 0.6297 | −9.3004 | ESP-Min net atomic charge for a H atom, d1 |
| 2 | −28.2750 | 3.3560 | −8.4250 | FNSA-3 Fractional PNSA (PNSA-3/TMSA), d2 |
| 3 | −0.0912 | 0.0196 | −4.6472 | ESP-RPCS Relative charged SA (SAMPOS*RPCG) [Quantum-Chemical PC], d3 |
| 4 | 2.5481 | 0.6368 | 4.0017 | YZ Shadow/YZ Rectangle, d4 |
| Descriptor No. | X | ΔX | t Test Value | Name of Descriptor |
|---|---|---|---|---|
| 0 | 1.5166 | 0.0591 | 25.6824 | Intercept |
| 1 | −5.8328 | 0.5080 | −11.4819 | ESP-Min net atomic charge for a H atom, d1 |
| 2 | −0.1190 | 0.0170 | −7.0087 | ESP-RPCS Relative positive charged SA (SAMPOS*RPCG) [Quantum-Chemical PC], d5 |
| 3 | −8.0388 | 1.3311 | −6.0391 | FNSA-3 (PNSA-3/TMSA) [Quantum-Chemical PC], d6 |
| 4 | −11.201 | 2.8386 | −3.9457 | FNSA-3Fractional PNSA (PNSA-3/TMSA), d7 |
| Trametes versicolor | Gloeophyllun trabeum | ||||||
|---|---|---|---|---|---|---|---|
| ID | Exp.logAR | Calc.logAR | Difference | ID | Exp.logAR | Calc.logAR | Difference |
| 1 | 2 | 1.9683 | −0.0317 | 1 | 2 | 1.9568 | −0.0432 |
| 2 | 1.4102 | 1.4807 | 0.0705 | 2 | 1.5073 | 1.5916 | 0.0843 |
| 3 | 1.4973 | 1.4345 | −0.0628 | 3 | 1.6413 | 1.4842 | −0.1571 |
| 4 | 1.2341 | 1.2272 | −0.0069 | 4 | 1.2706 | 1.3783 | 0.1077 |
| 5 | 1.2341 | 1.2962 | 0.0621 | 5 | 1.2891 | 1.2106 | −0.0785 |
| 6 | 1.4337 | 1.4827 | 0.049 | 6 | 1.4887 | 1.5455 | 0.0568 |
| 7 | 1.7231 | 1.6211 | −0.1020 | 7 | 1.7436 | 1.7105 | −0.0331 |
| 8 | 2.0031 | 2.1813 | 0.1782 | 8 | 1.8366 | 1.8532 | 0.0166 |
| 9 | 1.6734 | 1.641 | −0.0324 | 9 | 1.6874 | 1.6901 | 0.0027 |
| 10 | 1.5528 | 1.5704 | 0.0176 | 10 | 1.5524 | 1.5953 | 0.0429 |
| 11 | 1.6864 | 1.6516 | −0.0348 | 11 | 1.8332 | 1.7728 | −0.0604 |
| 12 | 1.2688 | 1.3291 | 0.0603 | 12 | 1.6373 | 1.6672 | 0.0299 |
| 13 | 1.1091 | 1.1629 | 0.0538 | 13 | 1.2951 | 1.2905 | −0.0046 |
| 14 | 1.1091 | 1.0807 | −0.0284 | 14 | 1.1877 | 1.238 | 0.0503 |
| 15 | 1.331 | 1.394 | 0.063 | 15 | 1.4732 | 1.4575 | −0.0157 |
| 16 | 1.8451 | 1.6645 | −0.1806 | 16 | 1.8559 | 1.8572 | 0.0013 |
| 17 | 1.2341 | 1.3076 | 0.0735 | 17 | 1.3663 | 1.3394 | −0.0269 |
| 18 | 1.699 | 1.557 | −0.1420 | 18 | 1.5621 | 1.54 | −0.0221 |
| 19 | 1.746 | 1.7395 | −0.0065 | 19 | 1.7151 | 1.7642 | 0.0491 |
| Training Set | N | R2 (fit) | F (fit) | s2 (fit) | Test Set | N | R2 (pred) | F (pred) | s2 (pred) |
|---|---|---|---|---|---|---|---|---|---|
| Validation for the model in Table 3 Trametes versicolor | |||||||||
| A + B | 13 | 0.909 | 20.07 | 0.0124 | C | 6 | 0.882 | 37.49 | 0.0350 |
| A + C | 12 | 0.946 | 30.72 | 0.0064 | B | 7 | 0.850 | 34.02 | 0.1102 |
| B + C | 13 | 0.930 | 26.55 | 0.0078 | A | 6 | 0.643 | 10.01 | 0.1474 |
| Average | 0.929 | 25.78 | 0.0089 | 0.792 | 27.17 | 0.0975 | |||
| Validation for the model in Table 4 Gloeophyllun trabeum | |||||||||
| A + B | 13 | 0.936 | 29.19 | 0.0057 | C | 6 | 0.766 | 17.32 | 0.0249 |
| A + C | 12 | 0.961 | 43.01 | 0.0035 | B | 7 | 0.812 | 26.93 | 0.0460 |
| B + C | 13 | 0.900 | 18.03 | 0.0056 | A | 6 | 0.920 | 58.79 | 0.0214 |
| Average | 0.932 | 30.08 | 0.0049 | 0.833 | 34.35 | 0.0308 | |||
| No | AR | Calc.logAR | Exp.logAR | Absolute Error | |
|---|---|---|---|---|---|
| Trametes versicolor | A | 100.92 | 2.0040 | 2.4767 | 0.4727 |
| B | 101.86 | 2.0080 | 2.6561 | 0.6481 | |
| Gloeophyllun trabeum | A | 153.70 | 2.1866 | 2.2022 | 0.0155 |
| B | 161.74 | 2.2088 | 2.5390 | 0.3302 | |
© 2016 by the authors. Licensee MDPI, Basel, Switzerland. This article is an open access article distributed under the terms and conditions of the Creative Commons Attribution (CC-BY) license ( http://creativecommons.org/licenses/by/4.0/).
Share and Cite
Yang, D.; Wang, H.; Yuan, H.; Li, S. Quantitative Structure Activity Relationship of Cinnamaldehyde Compounds against Wood-Decaying Fungi. Molecules 2016, 21, 1563. https://doi.org/10.3390/molecules21111563
Yang D, Wang H, Yuan H, Li S. Quantitative Structure Activity Relationship of Cinnamaldehyde Compounds against Wood-Decaying Fungi. Molecules. 2016; 21(11):1563. https://doi.org/10.3390/molecules21111563
Chicago/Turabian StyleYang, Dongmei, Hui Wang, Haijian Yuan, and Shujun Li. 2016. "Quantitative Structure Activity Relationship of Cinnamaldehyde Compounds against Wood-Decaying Fungi" Molecules 21, no. 11: 1563. https://doi.org/10.3390/molecules21111563
APA StyleYang, D., Wang, H., Yuan, H., & Li, S. (2016). Quantitative Structure Activity Relationship of Cinnamaldehyde Compounds against Wood-Decaying Fungi. Molecules, 21(11), 1563. https://doi.org/10.3390/molecules21111563