2.1. X-ray Crystallography and Photolysis Properties of I–III
Crystallographic data for
I–
III are summarized in
Table 1. For compounds
I–
III the data were collected at 110(2) K after the crystals had been flash-cooled from room temperature. The crystal structure of
I (
Figure 1) shows that the molecule of the
meta position of the pyridyl ring (structure
I) belongs to a monoclinic crystal with
Z′ > 2 independent molecules of
I per asymmetric unit, which could be attributed to a co-crystal with the solvent, (eight per unit cell,
Z = 8) and to the
P2/c space group. Crystal
II belongs to an orthorhombic system (
Pbcn,
Z = 8). Crystal
III also belongs to a monoclinic system with space group
C2/c with a
Z = 8, indicating an ordered structure. Both
II and
III display
Z′ = 1. Notably, for
I,
II, and
III, the unit cell contained eight molecules.
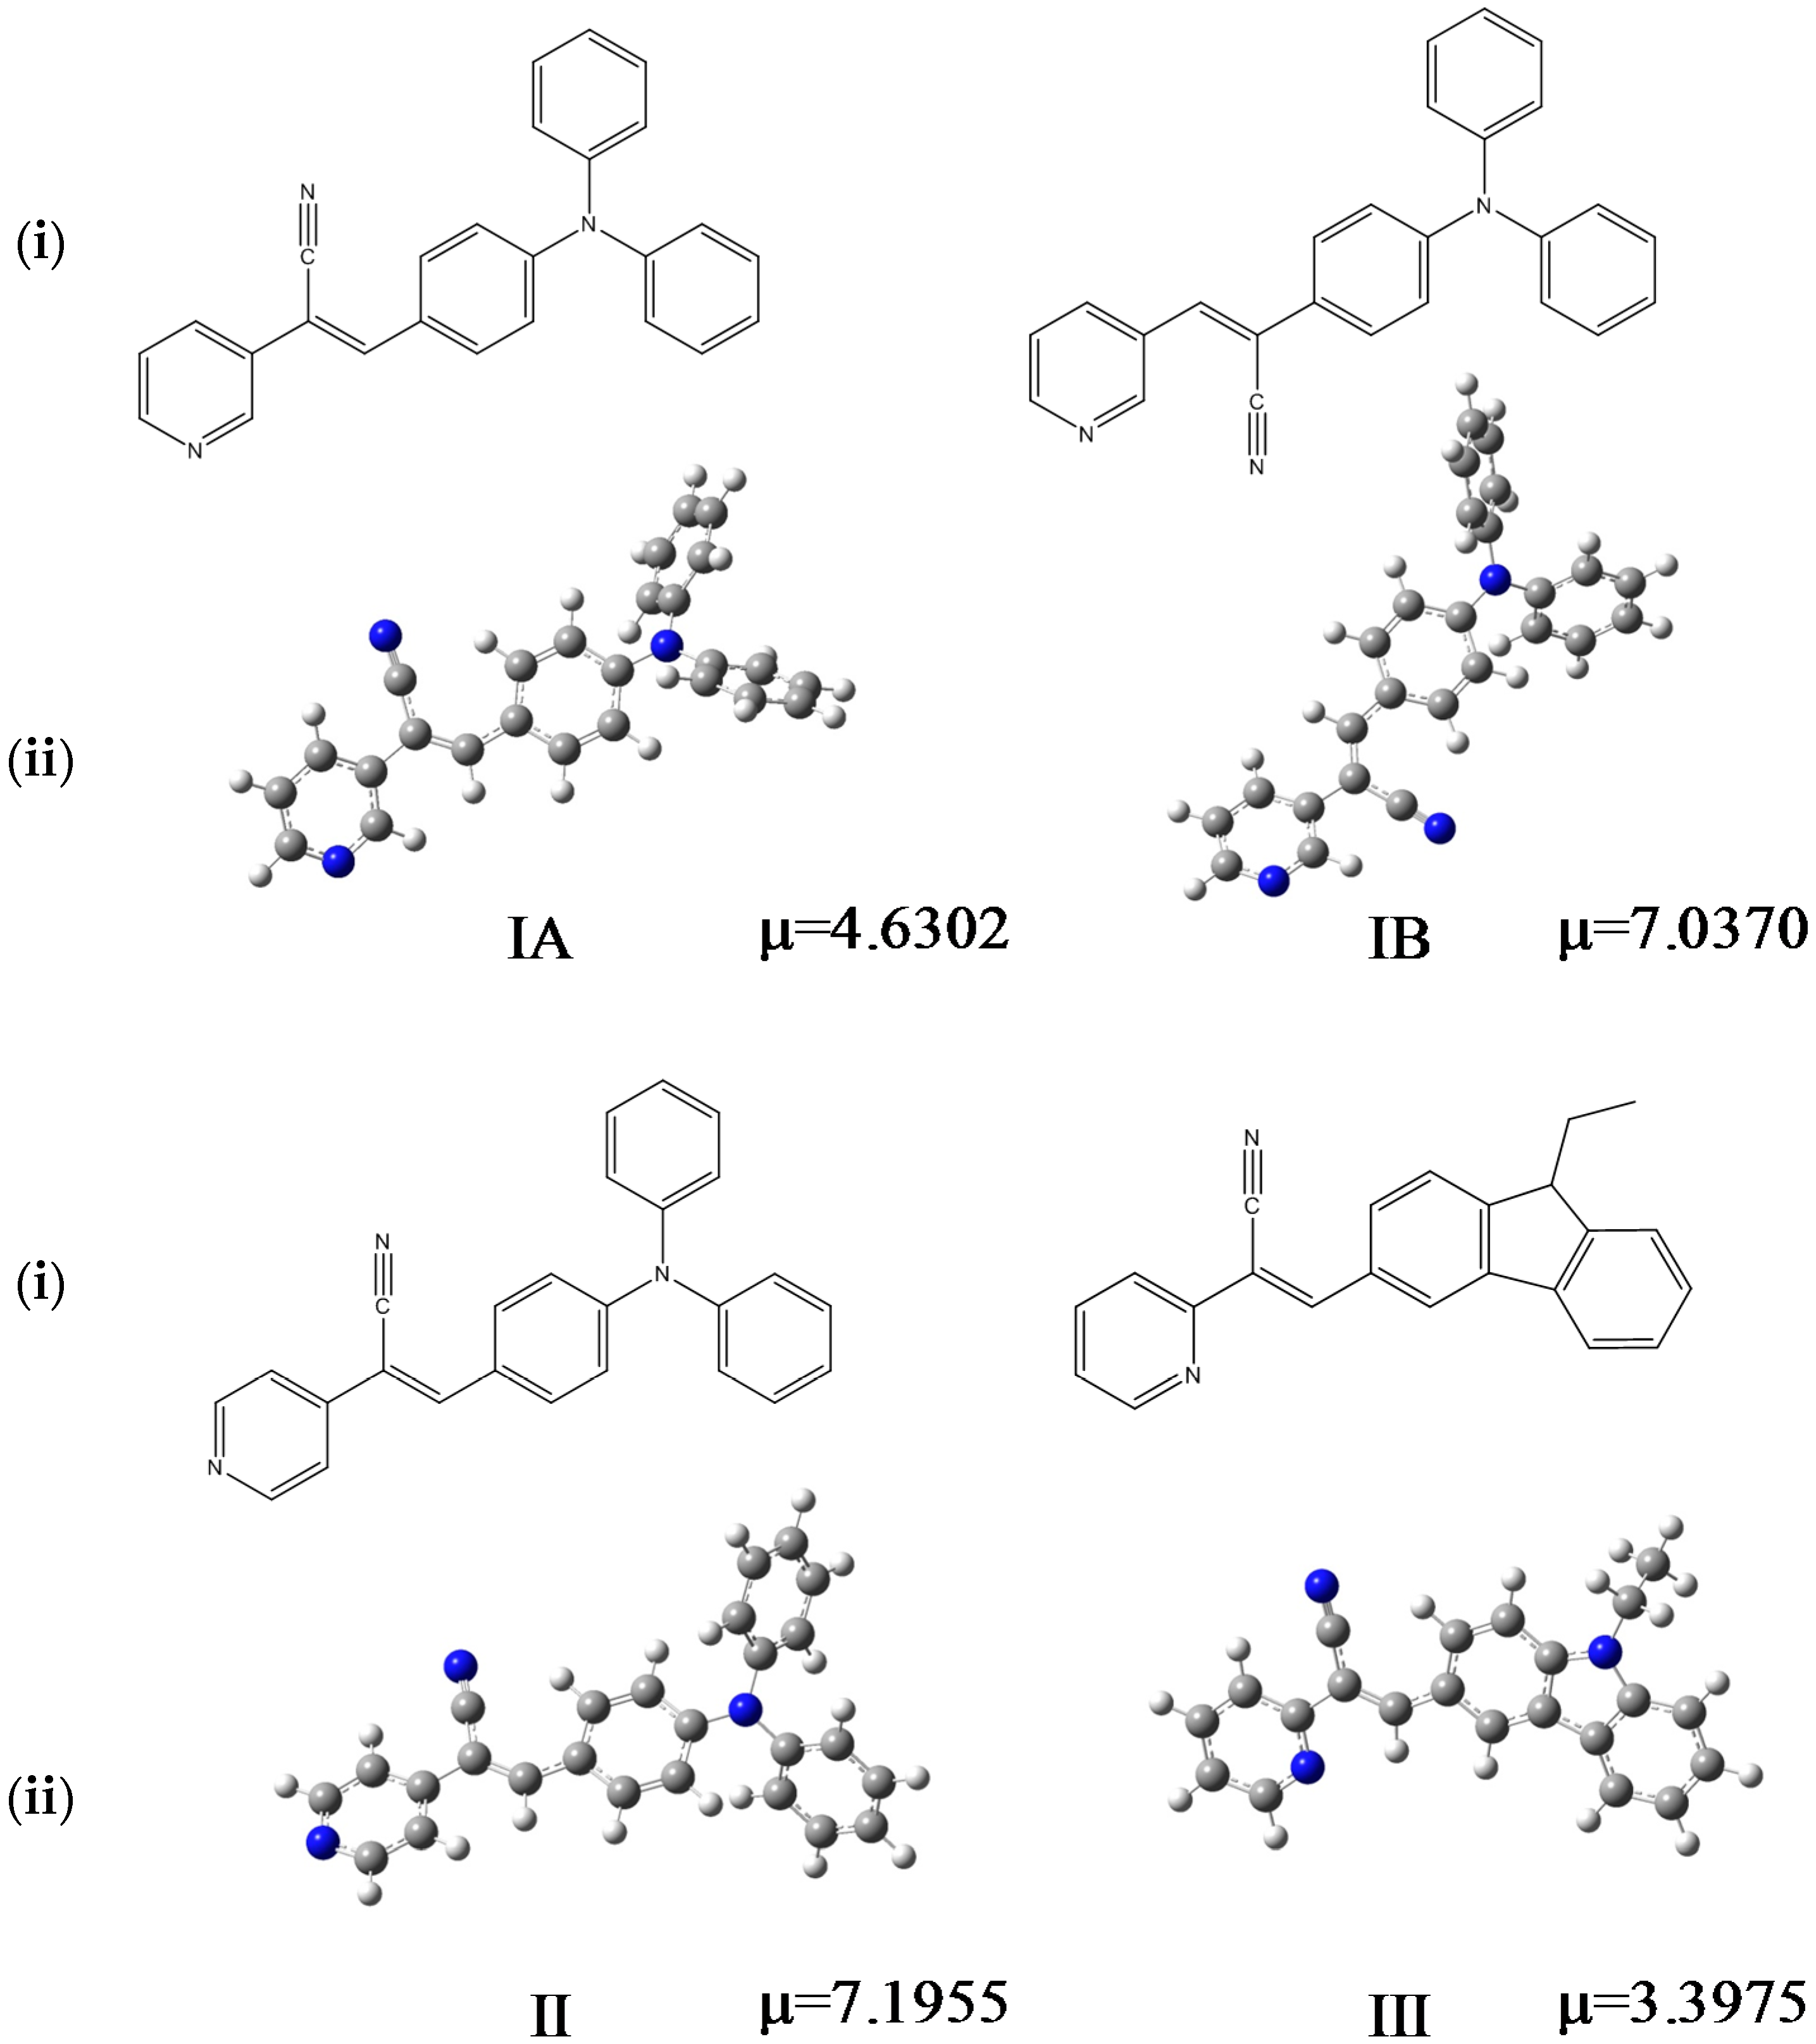
The structure of (
I) is modeled as ordered even though the lattice ethanol molecules are likely to be disordered as they are located at sites of two-fold axis symmetry. The elongated ellipsoids found for the lattice solvent molecule (
Figure 2) are consistent with this observation. The occupancy factor for the lattice solvent molecule was refined freely, and its value is 0.791(7). It is possible that the void contains a mixture of disordered solvent molecules. The twin relationship corresponded to a two-fold axis found along the
c axis. The batch scale factor refined to 0.3680(16). The final refinement was performed using the HKL5 instruction (
i.e., the hkl file includes the set of reflections from domain 1 and the set of overlapped reflections from component 2). The two crystallographically independent molecules of the target compound were found to be ordered (
Figure 2).
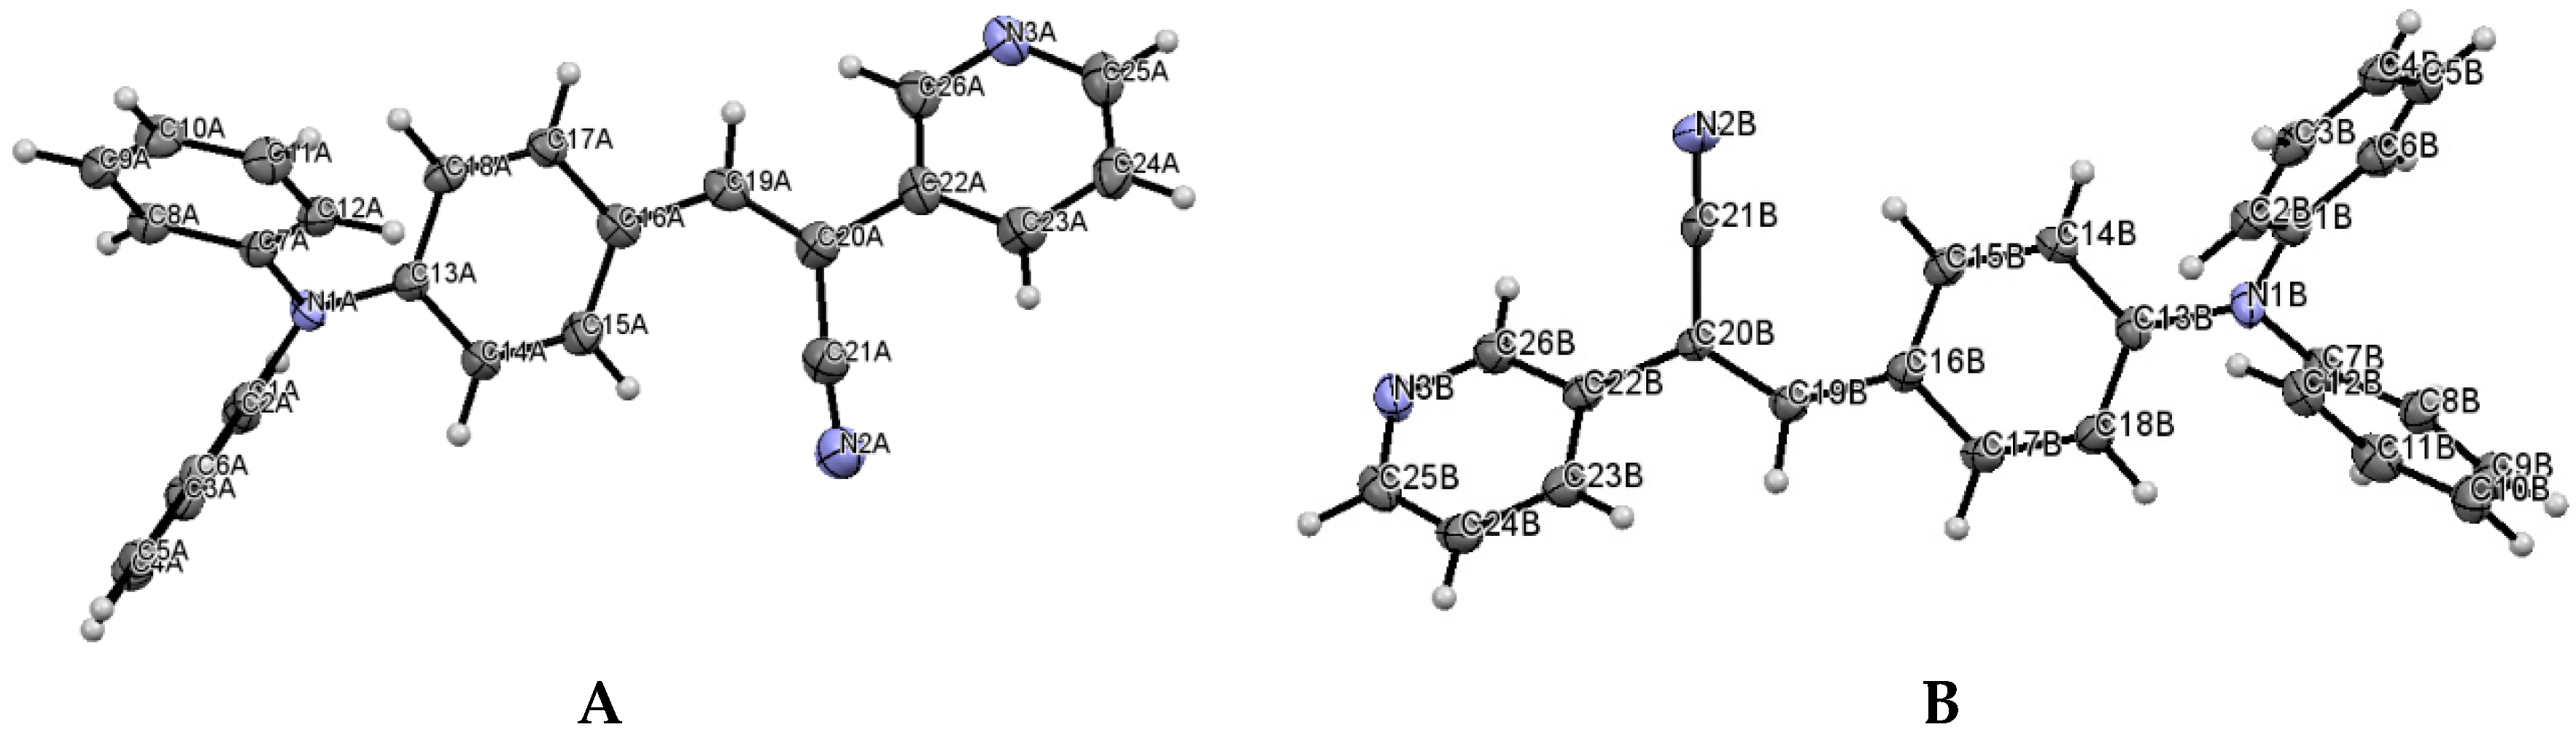
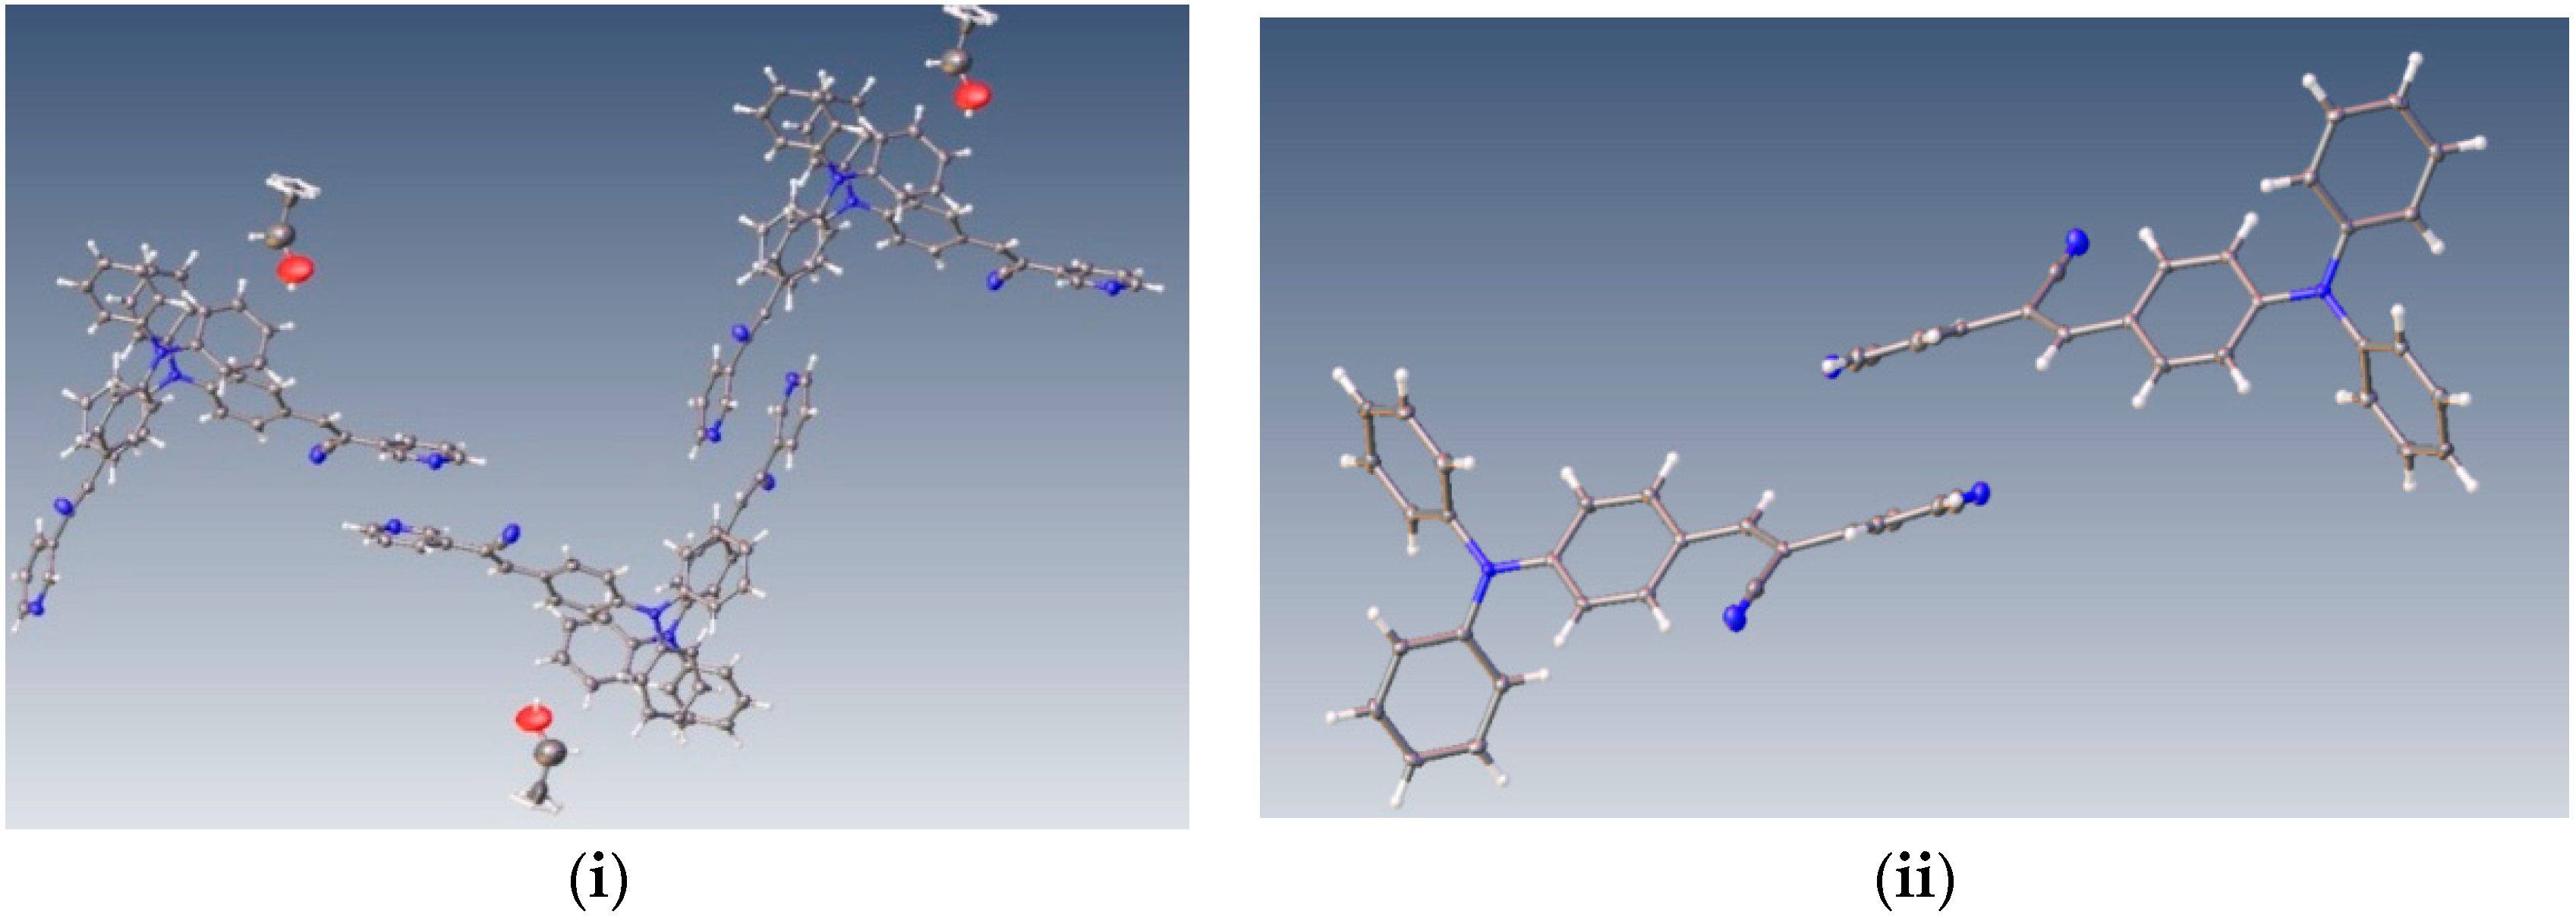
The most interesting feature in the structure of
I is concerned with the two independent conformers
A and
B (
Figure 3). For
A, there is one O-H(solvent)···N hydrogen bond interaction (
Figure 4), and the -C≡N group [C(21A)-N(2A)] is found
anti to the pyridine group. For
B, there is no such O-H (solvent)···N interaction, and the -C≡N group [C(21B)-N(2B)] is found
syn to the pyridine group. The molecules
A and
B are different conformers along the bond connecting the phenyl, double bond and pyridyl moeties.
Table 2 provides a list of torsion angles for molecules
A and
B, which notable differ in sign. The
anti conformation is typically found in different isomeric compounds that have already been reported in the literature [
28,
29,
30], and also in the structures of
II and
III reported herein.
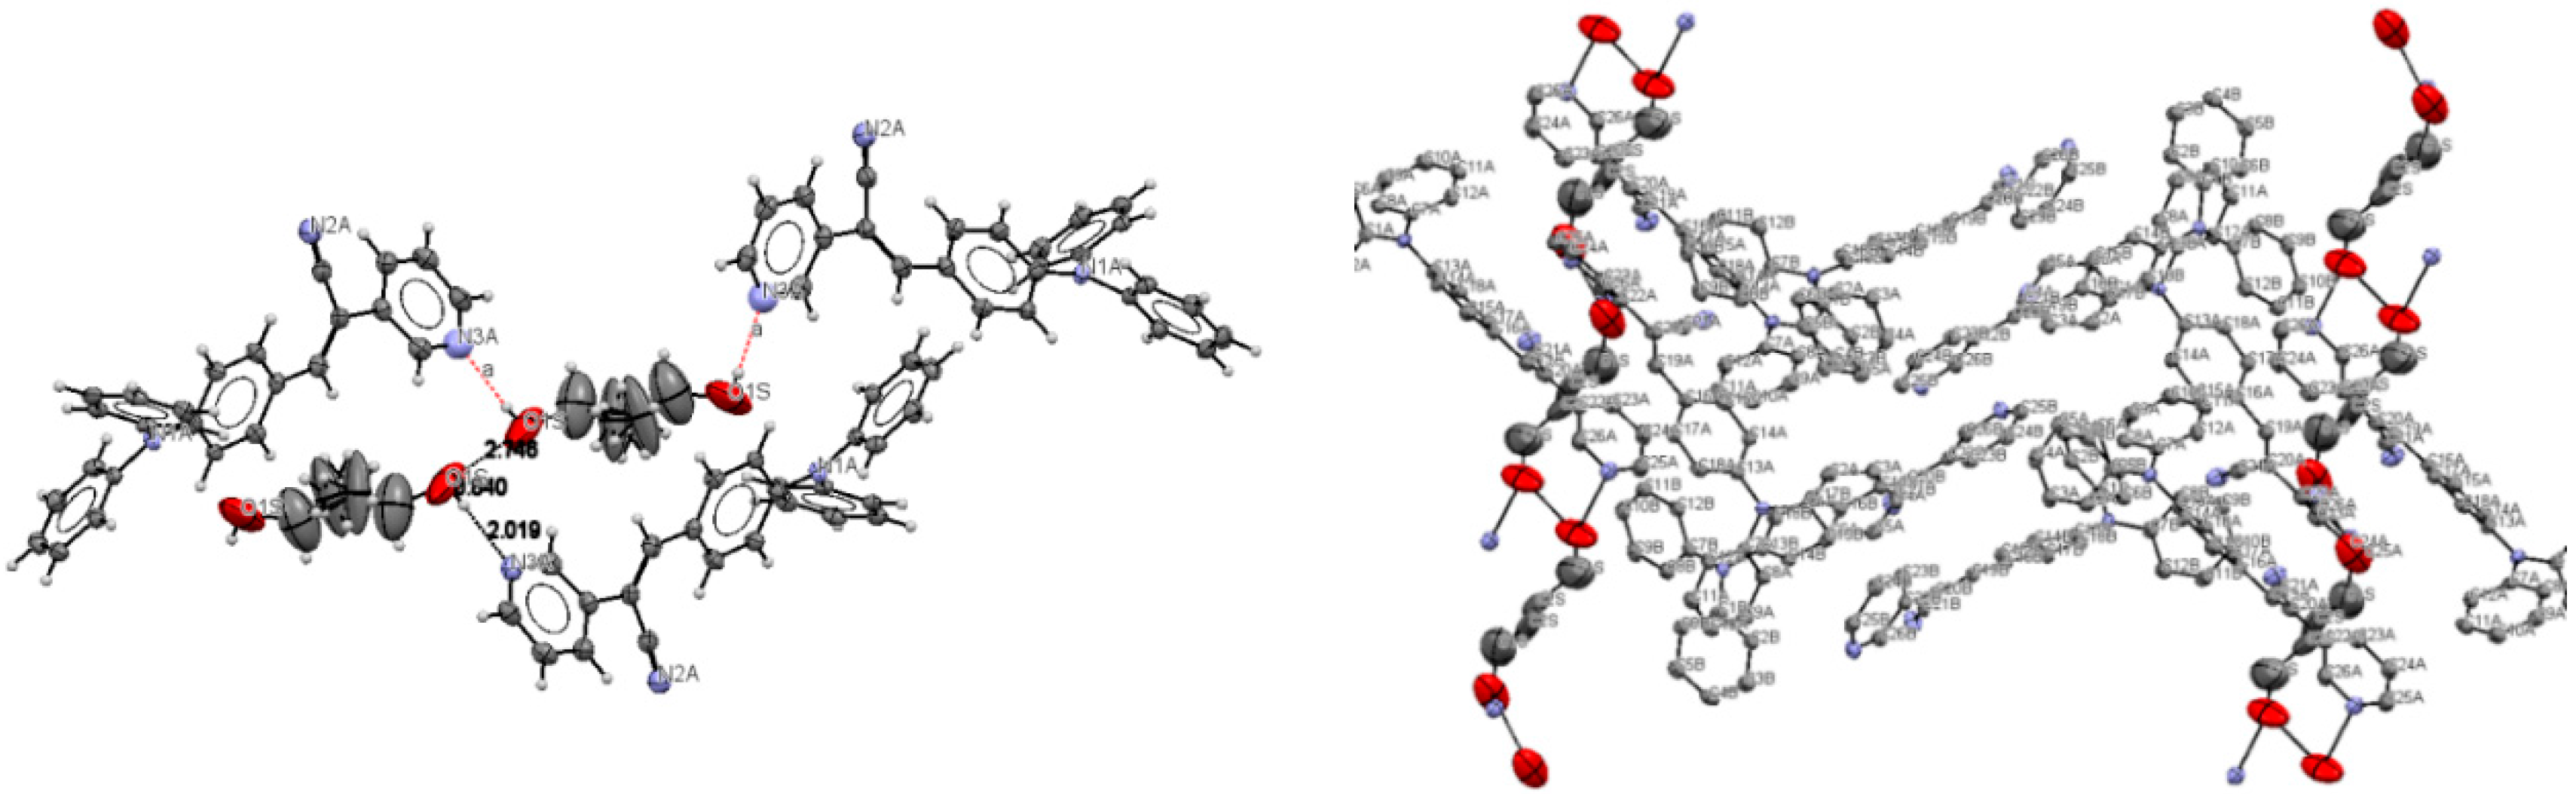
Lattice solvent ethanol molecules act as H-bond donor bridges between molecules of conformers
A along the c axis.
Table 2 provides a list of H-bond interactions in the structure of
I.
The N3A···O1S and O1S···O1S intermolecular distances are
ca. 2.77 and 2.75 Å, respectively, which suggests that the H atom from the -OH group of the ethanol molecules is disordered (this is not surprising as the ethanol molecules are most likely disordered) [
45]. The presence of lattice solvent molecules in the crystal packing of
I might indicate that crystal growth is optimized with O-H(solvent)···N(compound).
Table 3 includes a list of selected bond lengths and torsion angles for conformers
A and
B. The values for the pyridine ring and the
p-(diphenylamino)phenyl group indicate that the
N,
N-diphenyl substituents are twisted through the single bonds of the N-atom, and those conformers are oppositely twisted. This behavior does not occur for structure
II and for similar structures recently reported [
28,
29,
30,
31].
Table 3 also provides a list the selected bond lengths for
III, as well as, the dihedral angles between the acrylonitrile linkage and the phenyl ring and with the diphenylaminophenyl or carbazole moieties.
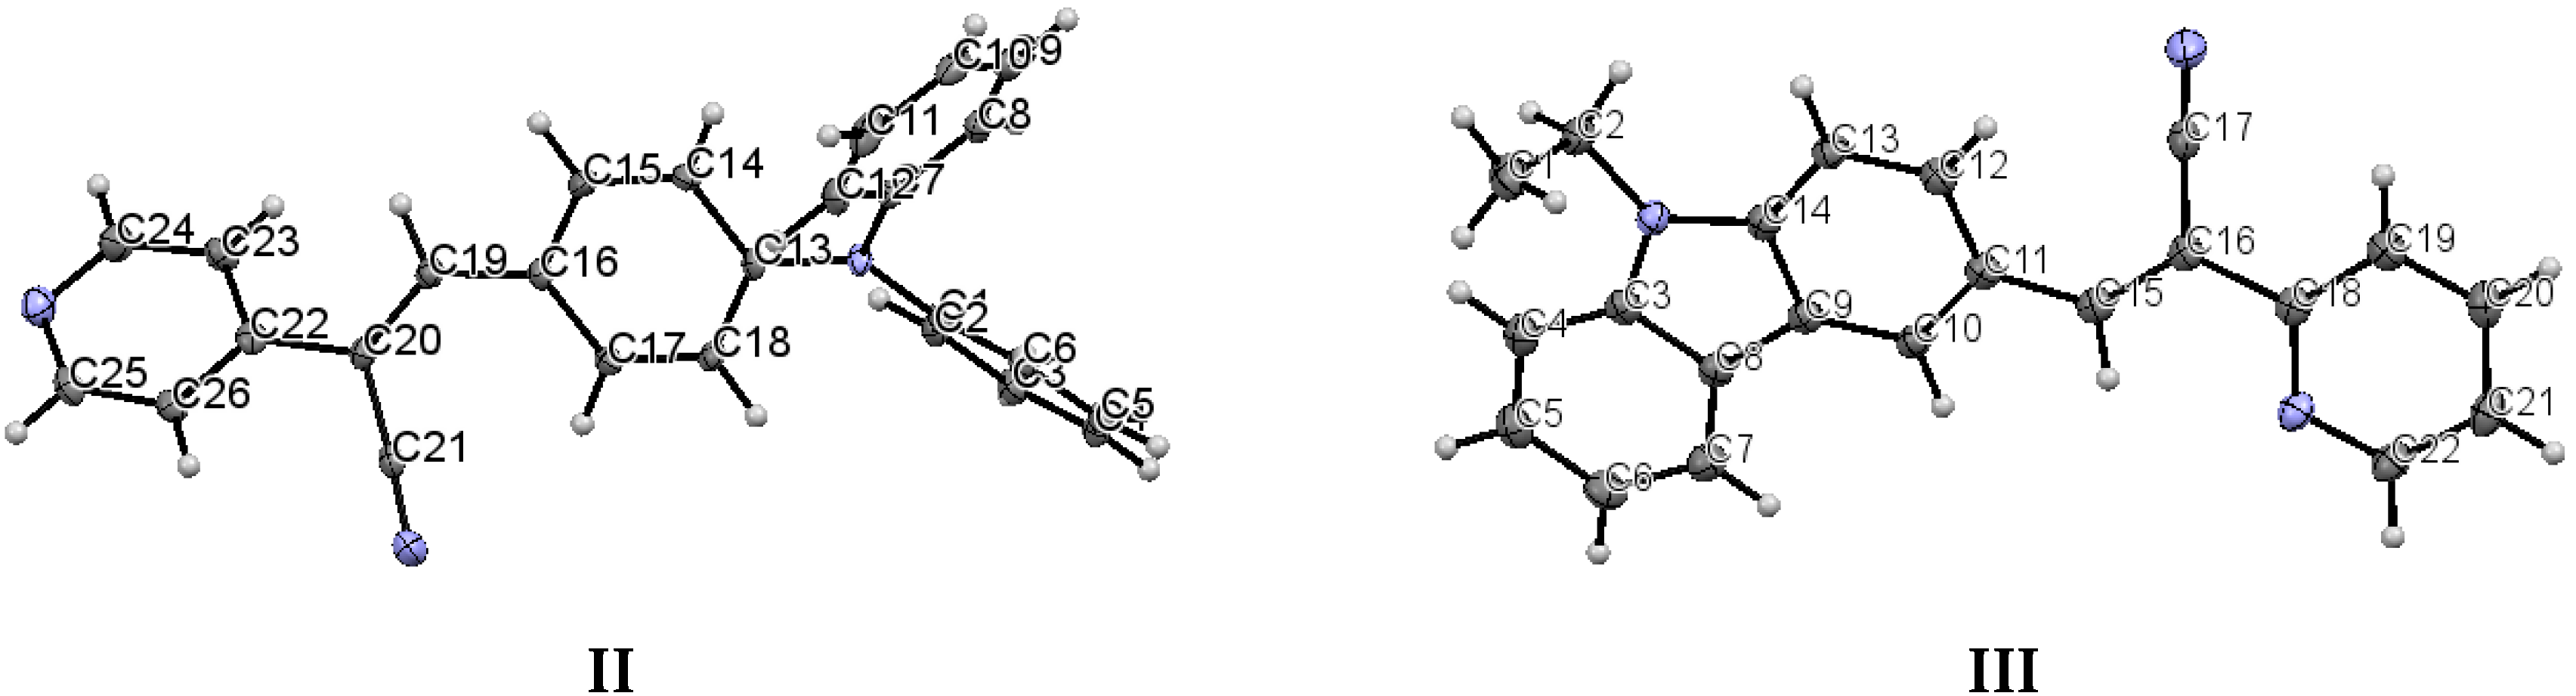
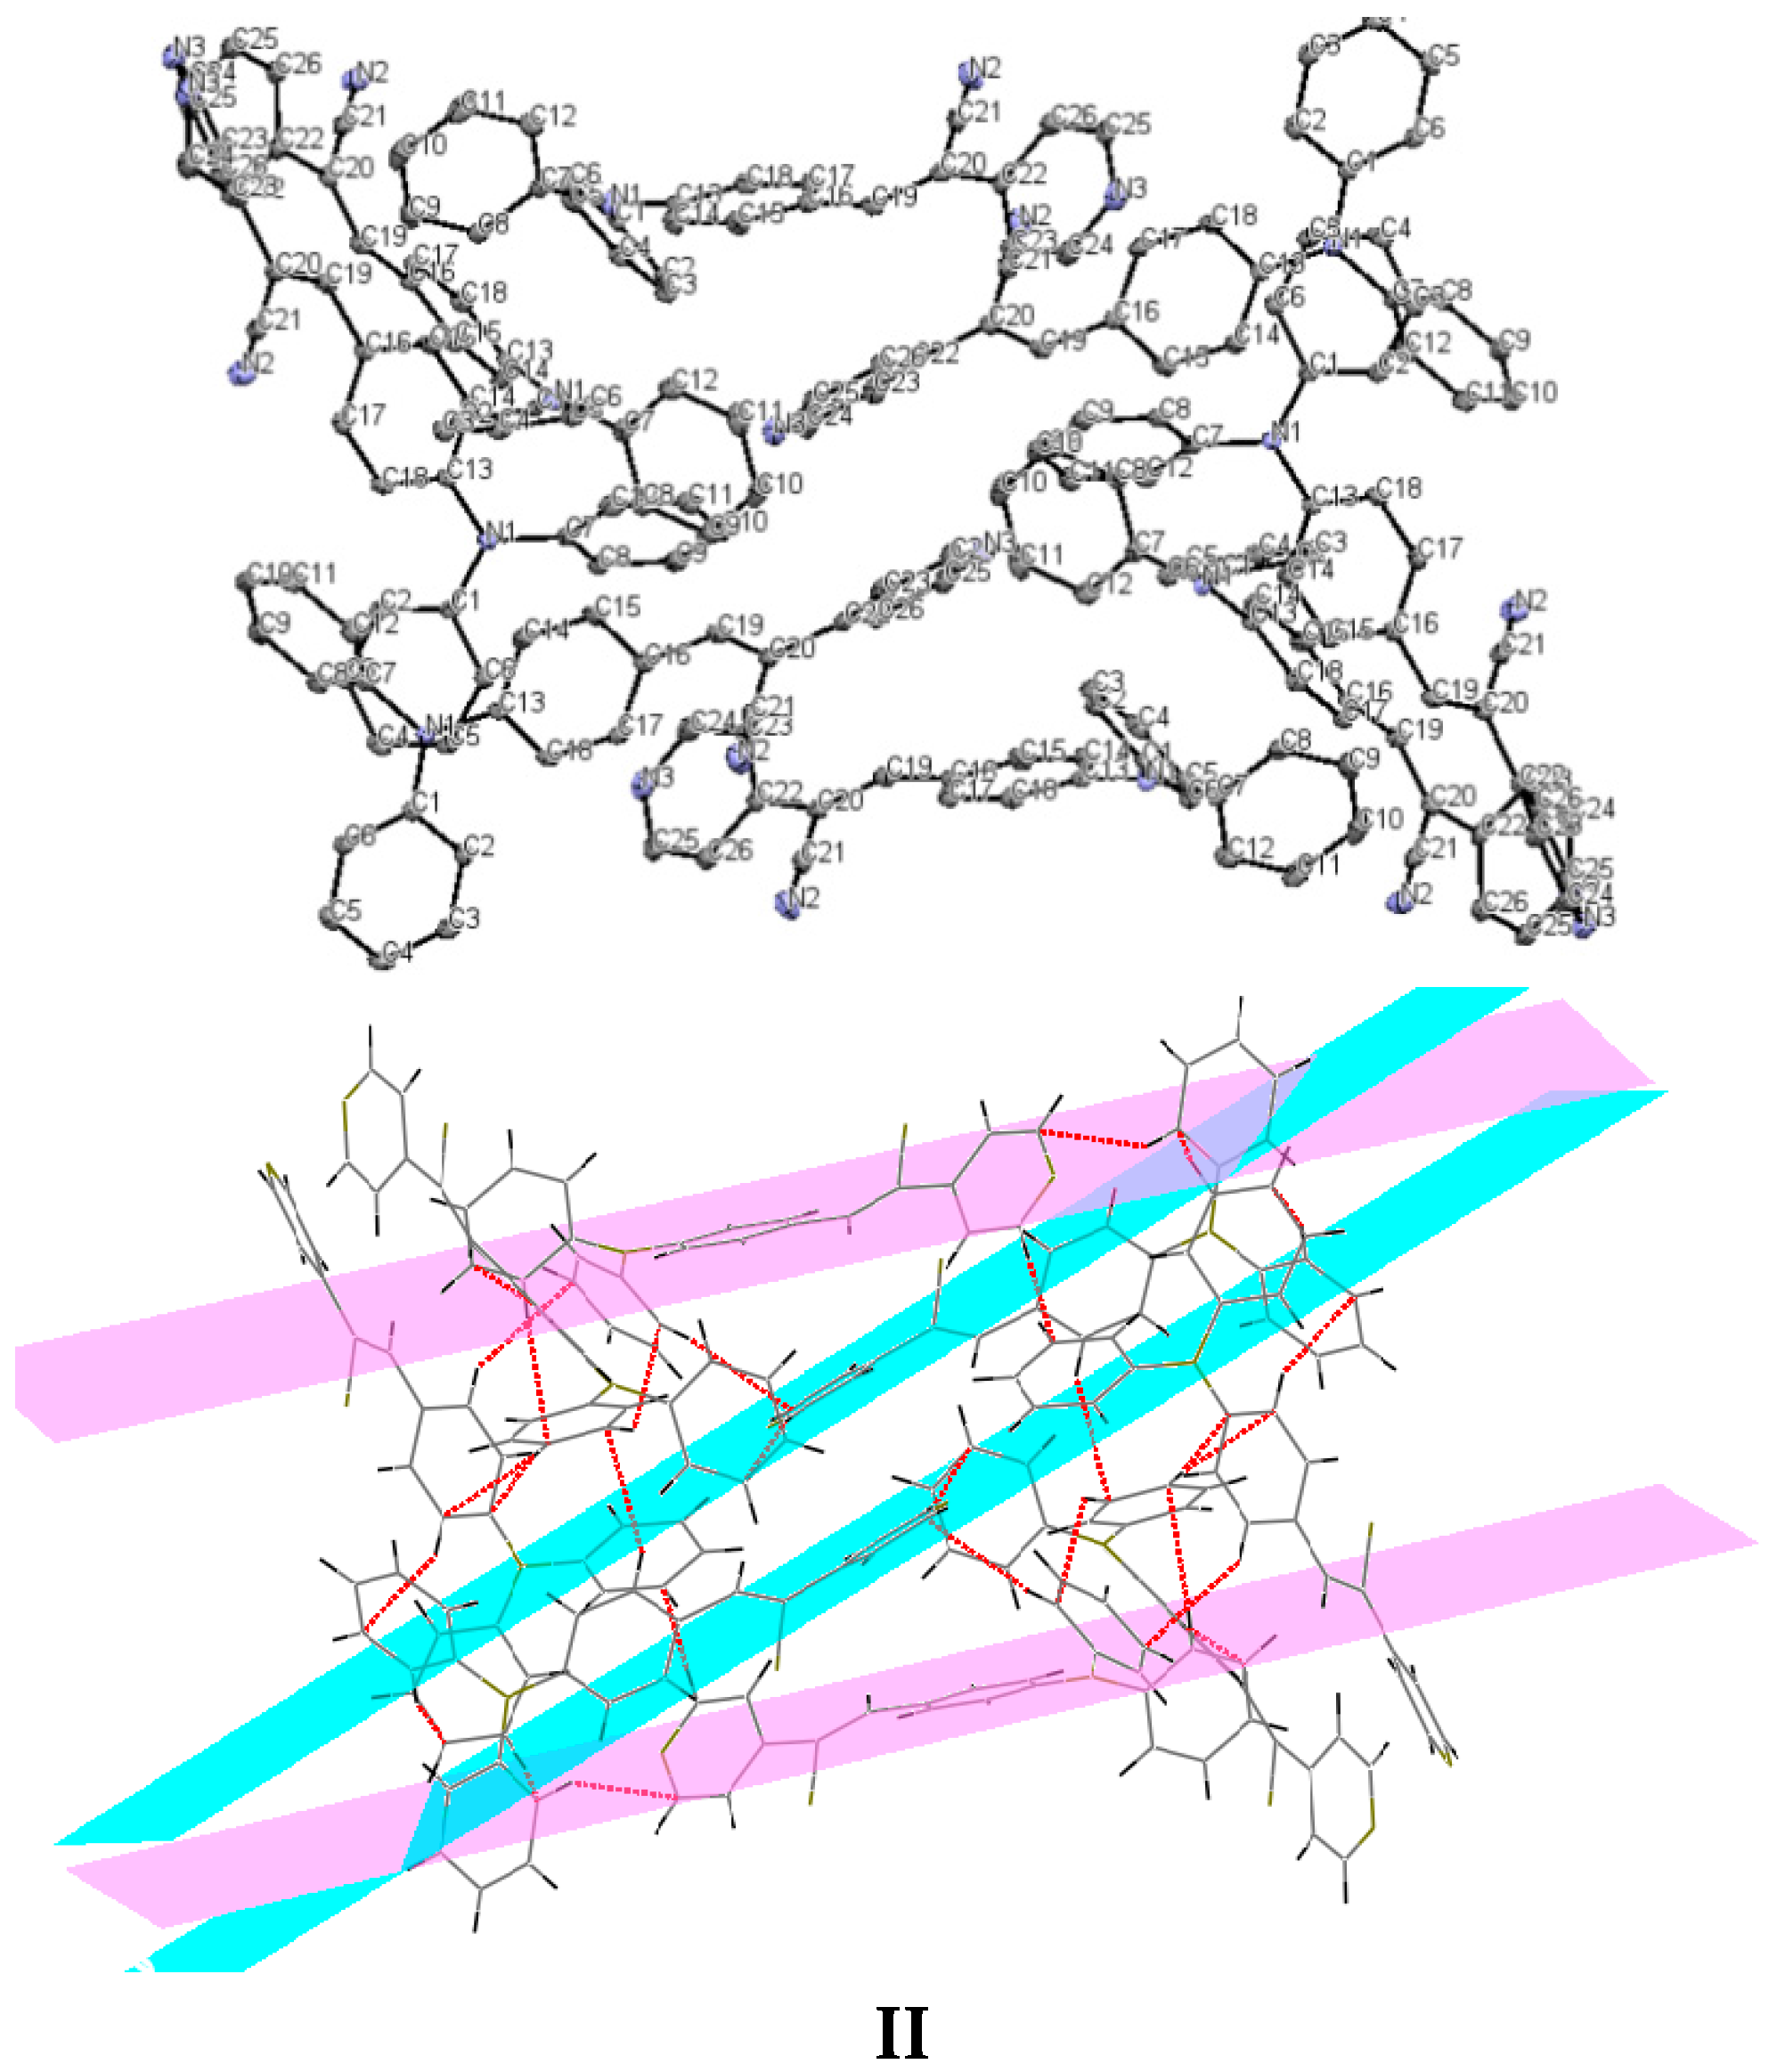
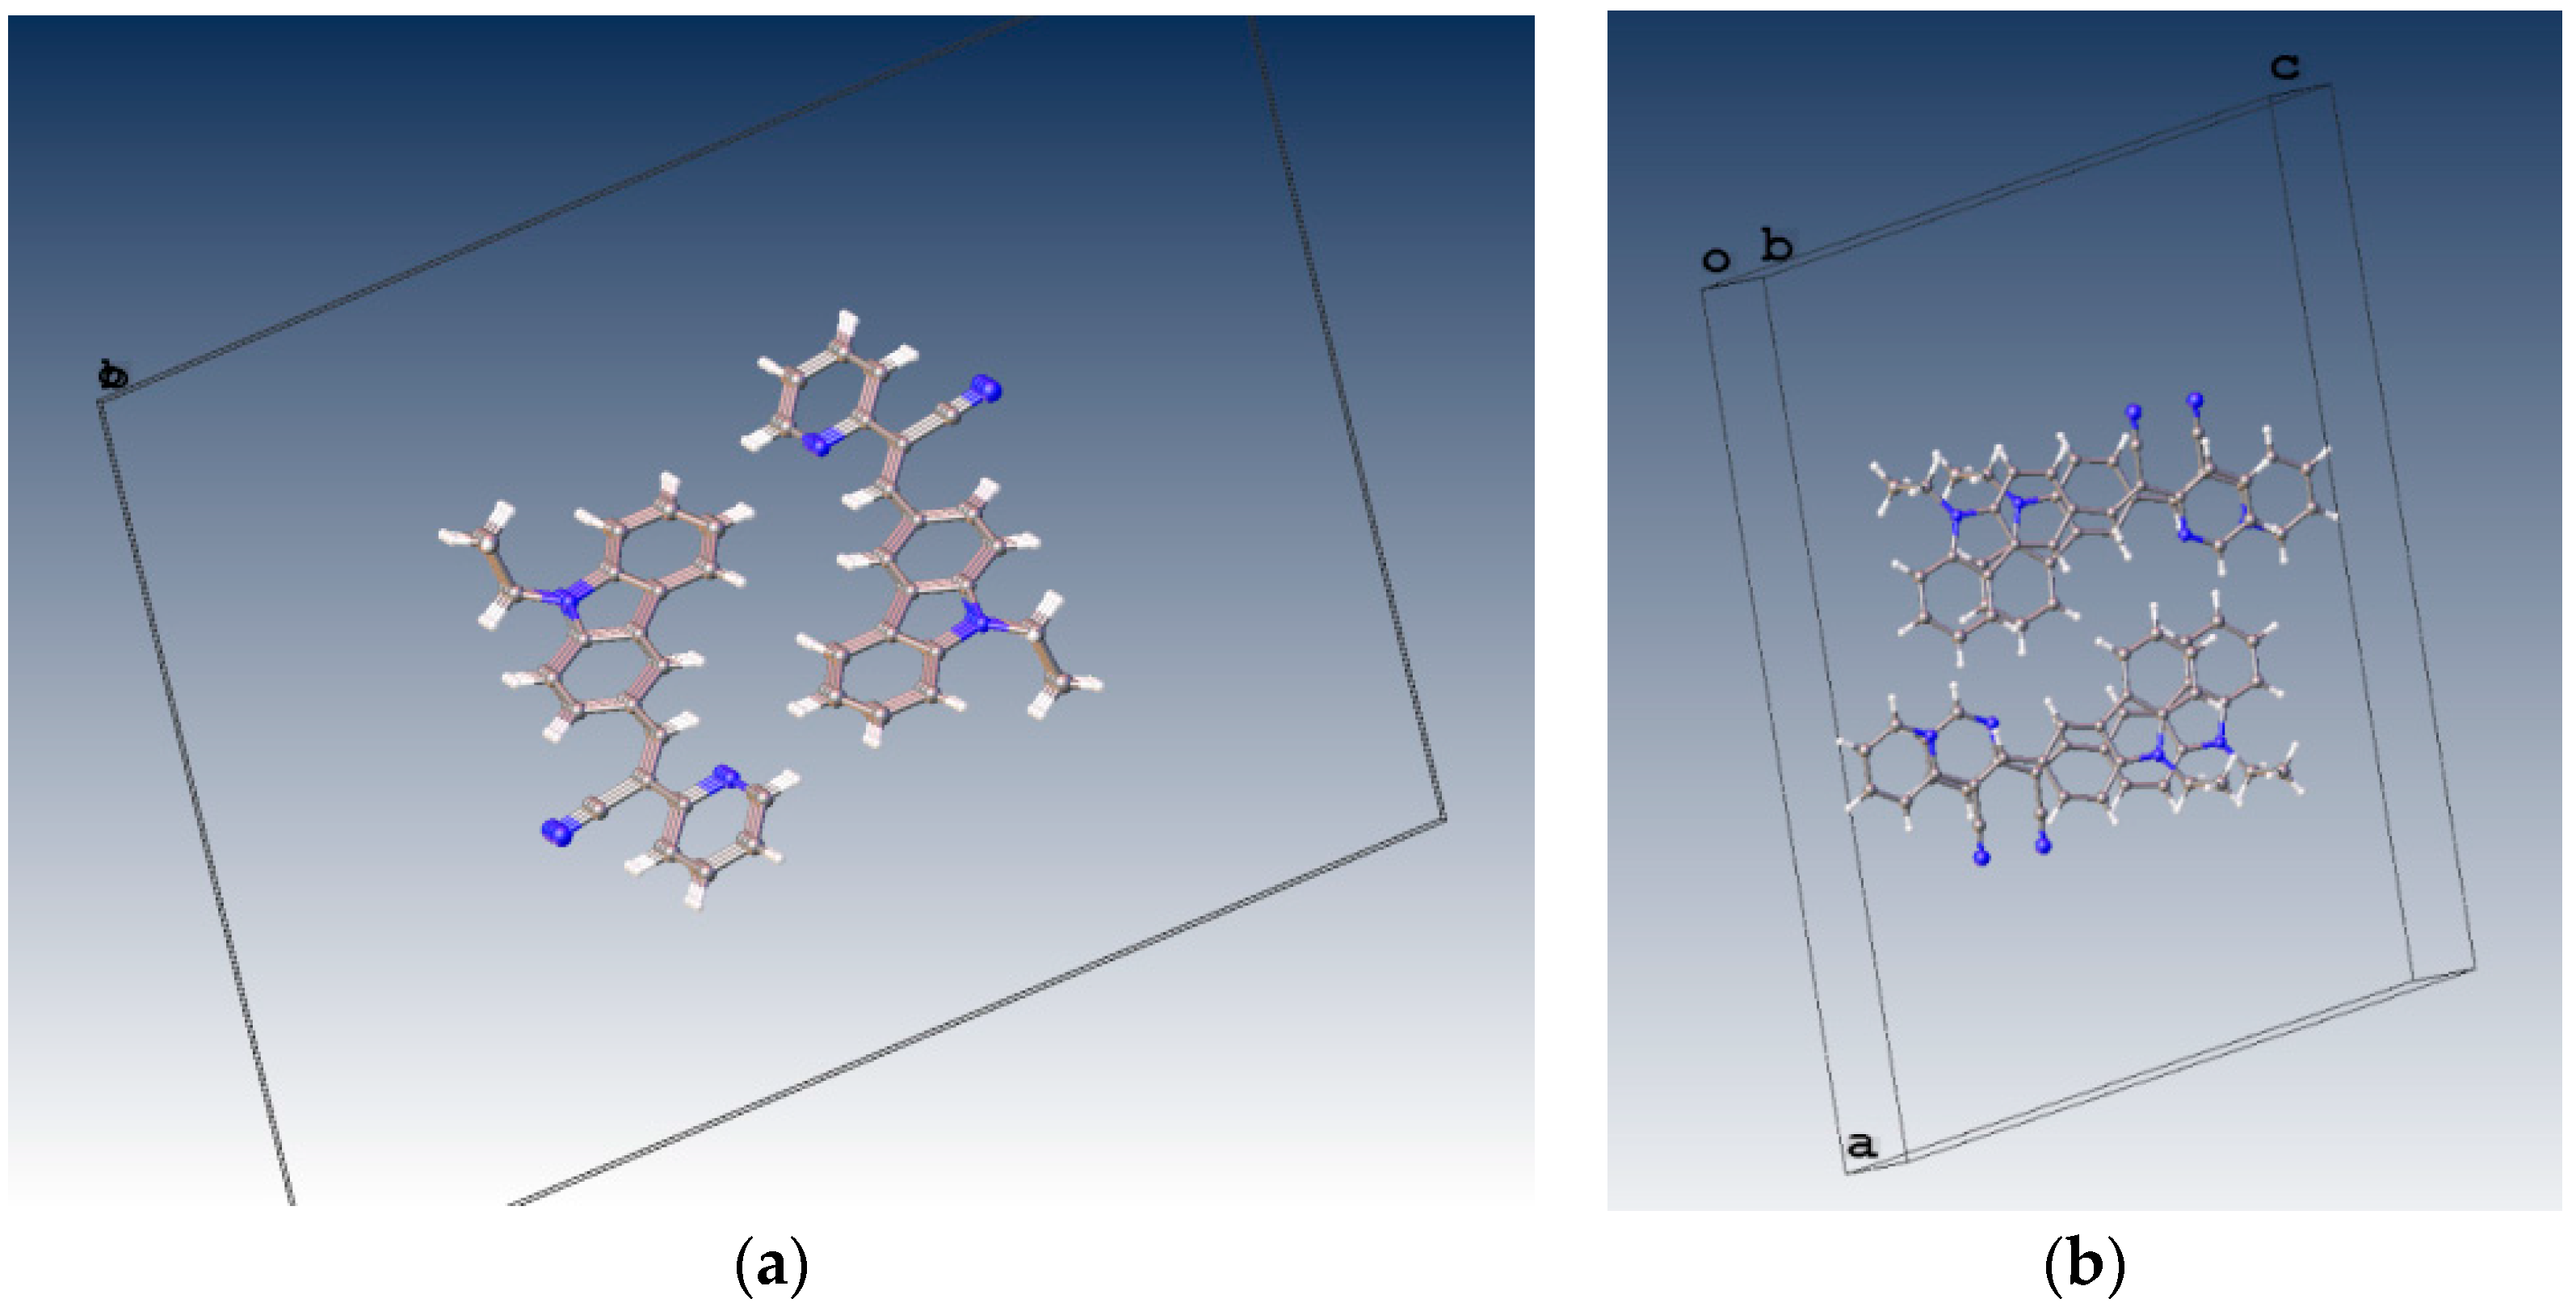
When the nitrogen atom is found at the
meta position, the crystal packing significantly differs from those of the analogous structures without nitrogen and those of the structures of
II (
para position) and
III (
ortho position). The compounds
II and
III (
Figure 5) have the
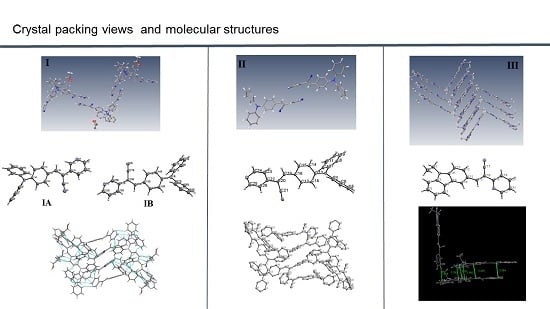
Z-geometry about the ethylene bridge that links the aromatic rings and heterocyclic groups.
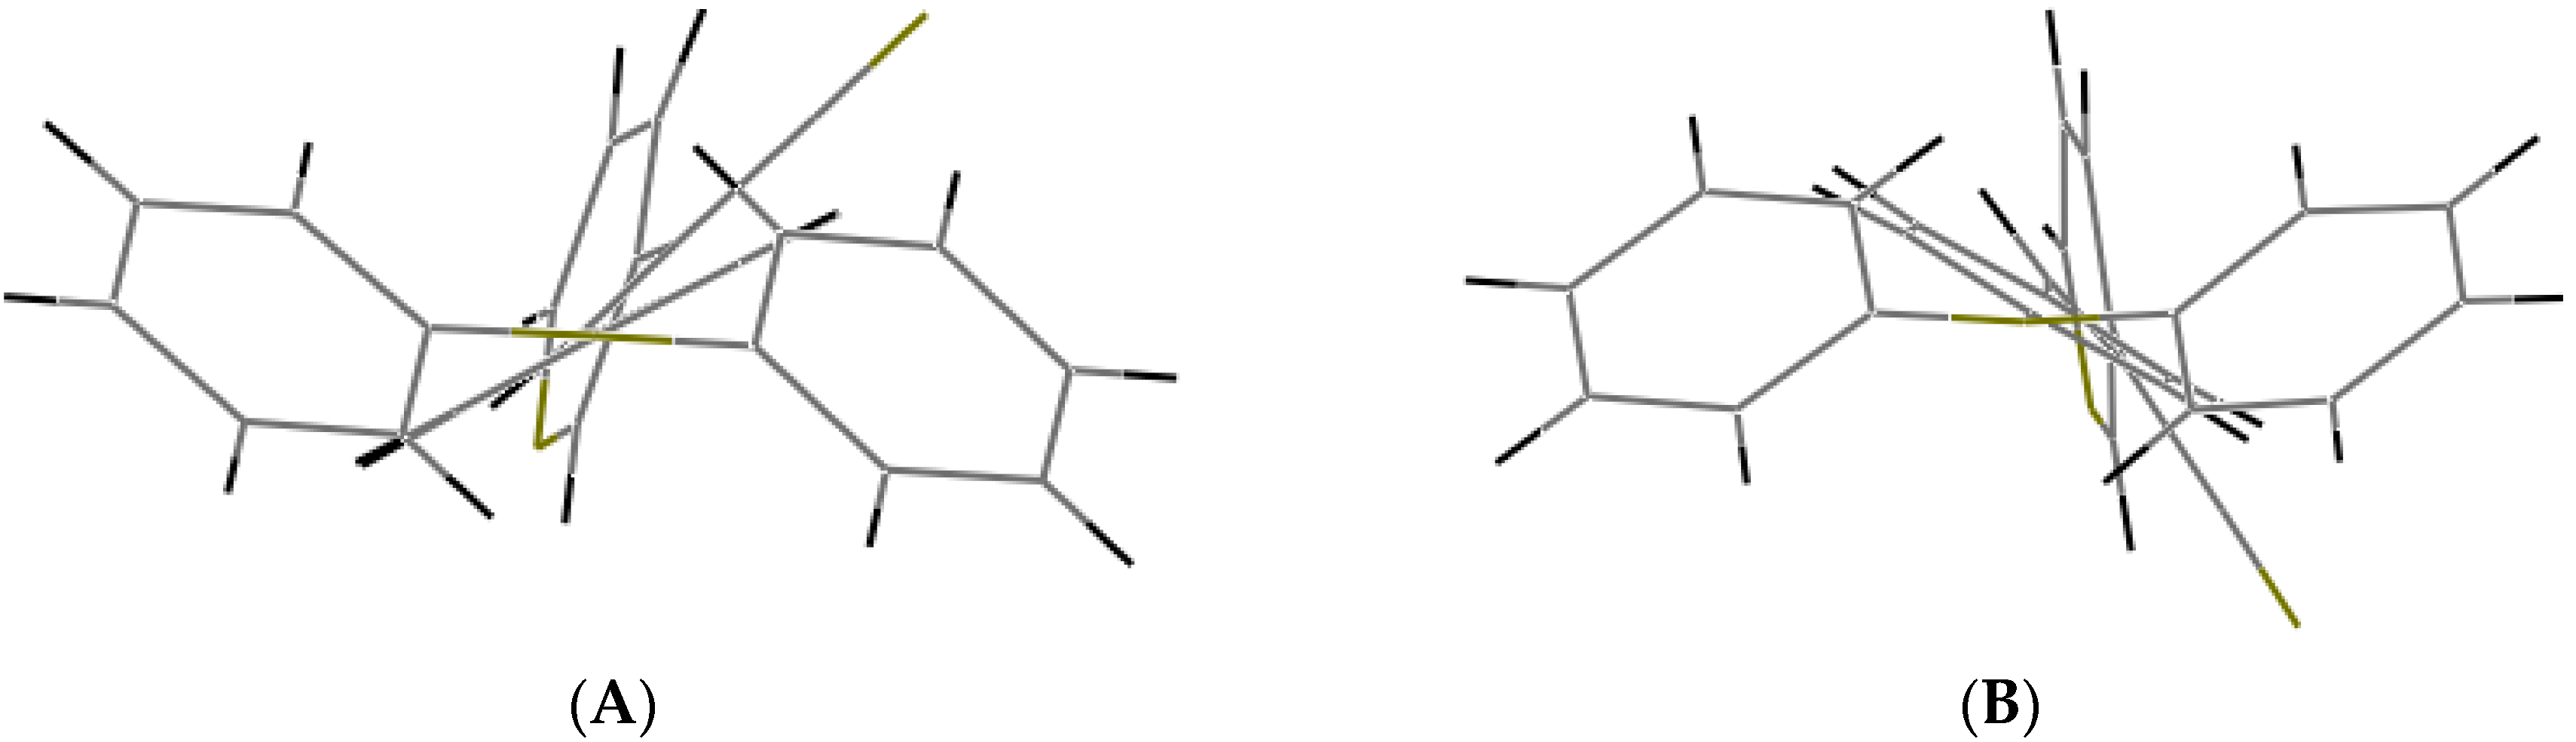
Understanding the different crystal packing modes (e.g., from herringbone to a co-facial π-stacking motif) is of importance to confer good electronic transfer properties. The molecules in
I and
II showed a tilted face-to-face arrangement (
Figure 6) for the aromatic ring constituted of the pyridine ring with a centroid-centroid distance of 3.71 Å, a shift distance of 1.46 Å for
I, and 3.84 Å of centroid-centroid distance and a shift distance of 1.843 Å for
II. These values for the π-π interactions in the structures were automatically found by the program OLEX 2 [
46].
These distances are typical for π
-π aromatic face-to-face interactions with centroid distances > 3.65 Å and offsets in the range of 1.6–1.8 Å [
47] and they reflect the distribution of electronic density that minimizes the π-electrons. However, for the structure of
III, as well as several crystal structure reported with the -CH=CCN- moiety, no obvious π-π interactions are found, even though isomers were present. These packing motifs may be attributed to CH···π, edge-to-face interactions and they tune the packing structure from a herringbone mode toward more of a face-to-face π-stacking motif. Holmes
et al. reported that in order to favor face-to-face π-stacking, the CH···π interactions should be minimized [
18,
22,
48,
49]. The packing of structures
I and
II showed that the pyridine unit, the position of the nitrogen atom within the pyridyl core, and the
p-(diphenylamino)phenyl- group play important roles as well as the solvent used for crystallization.
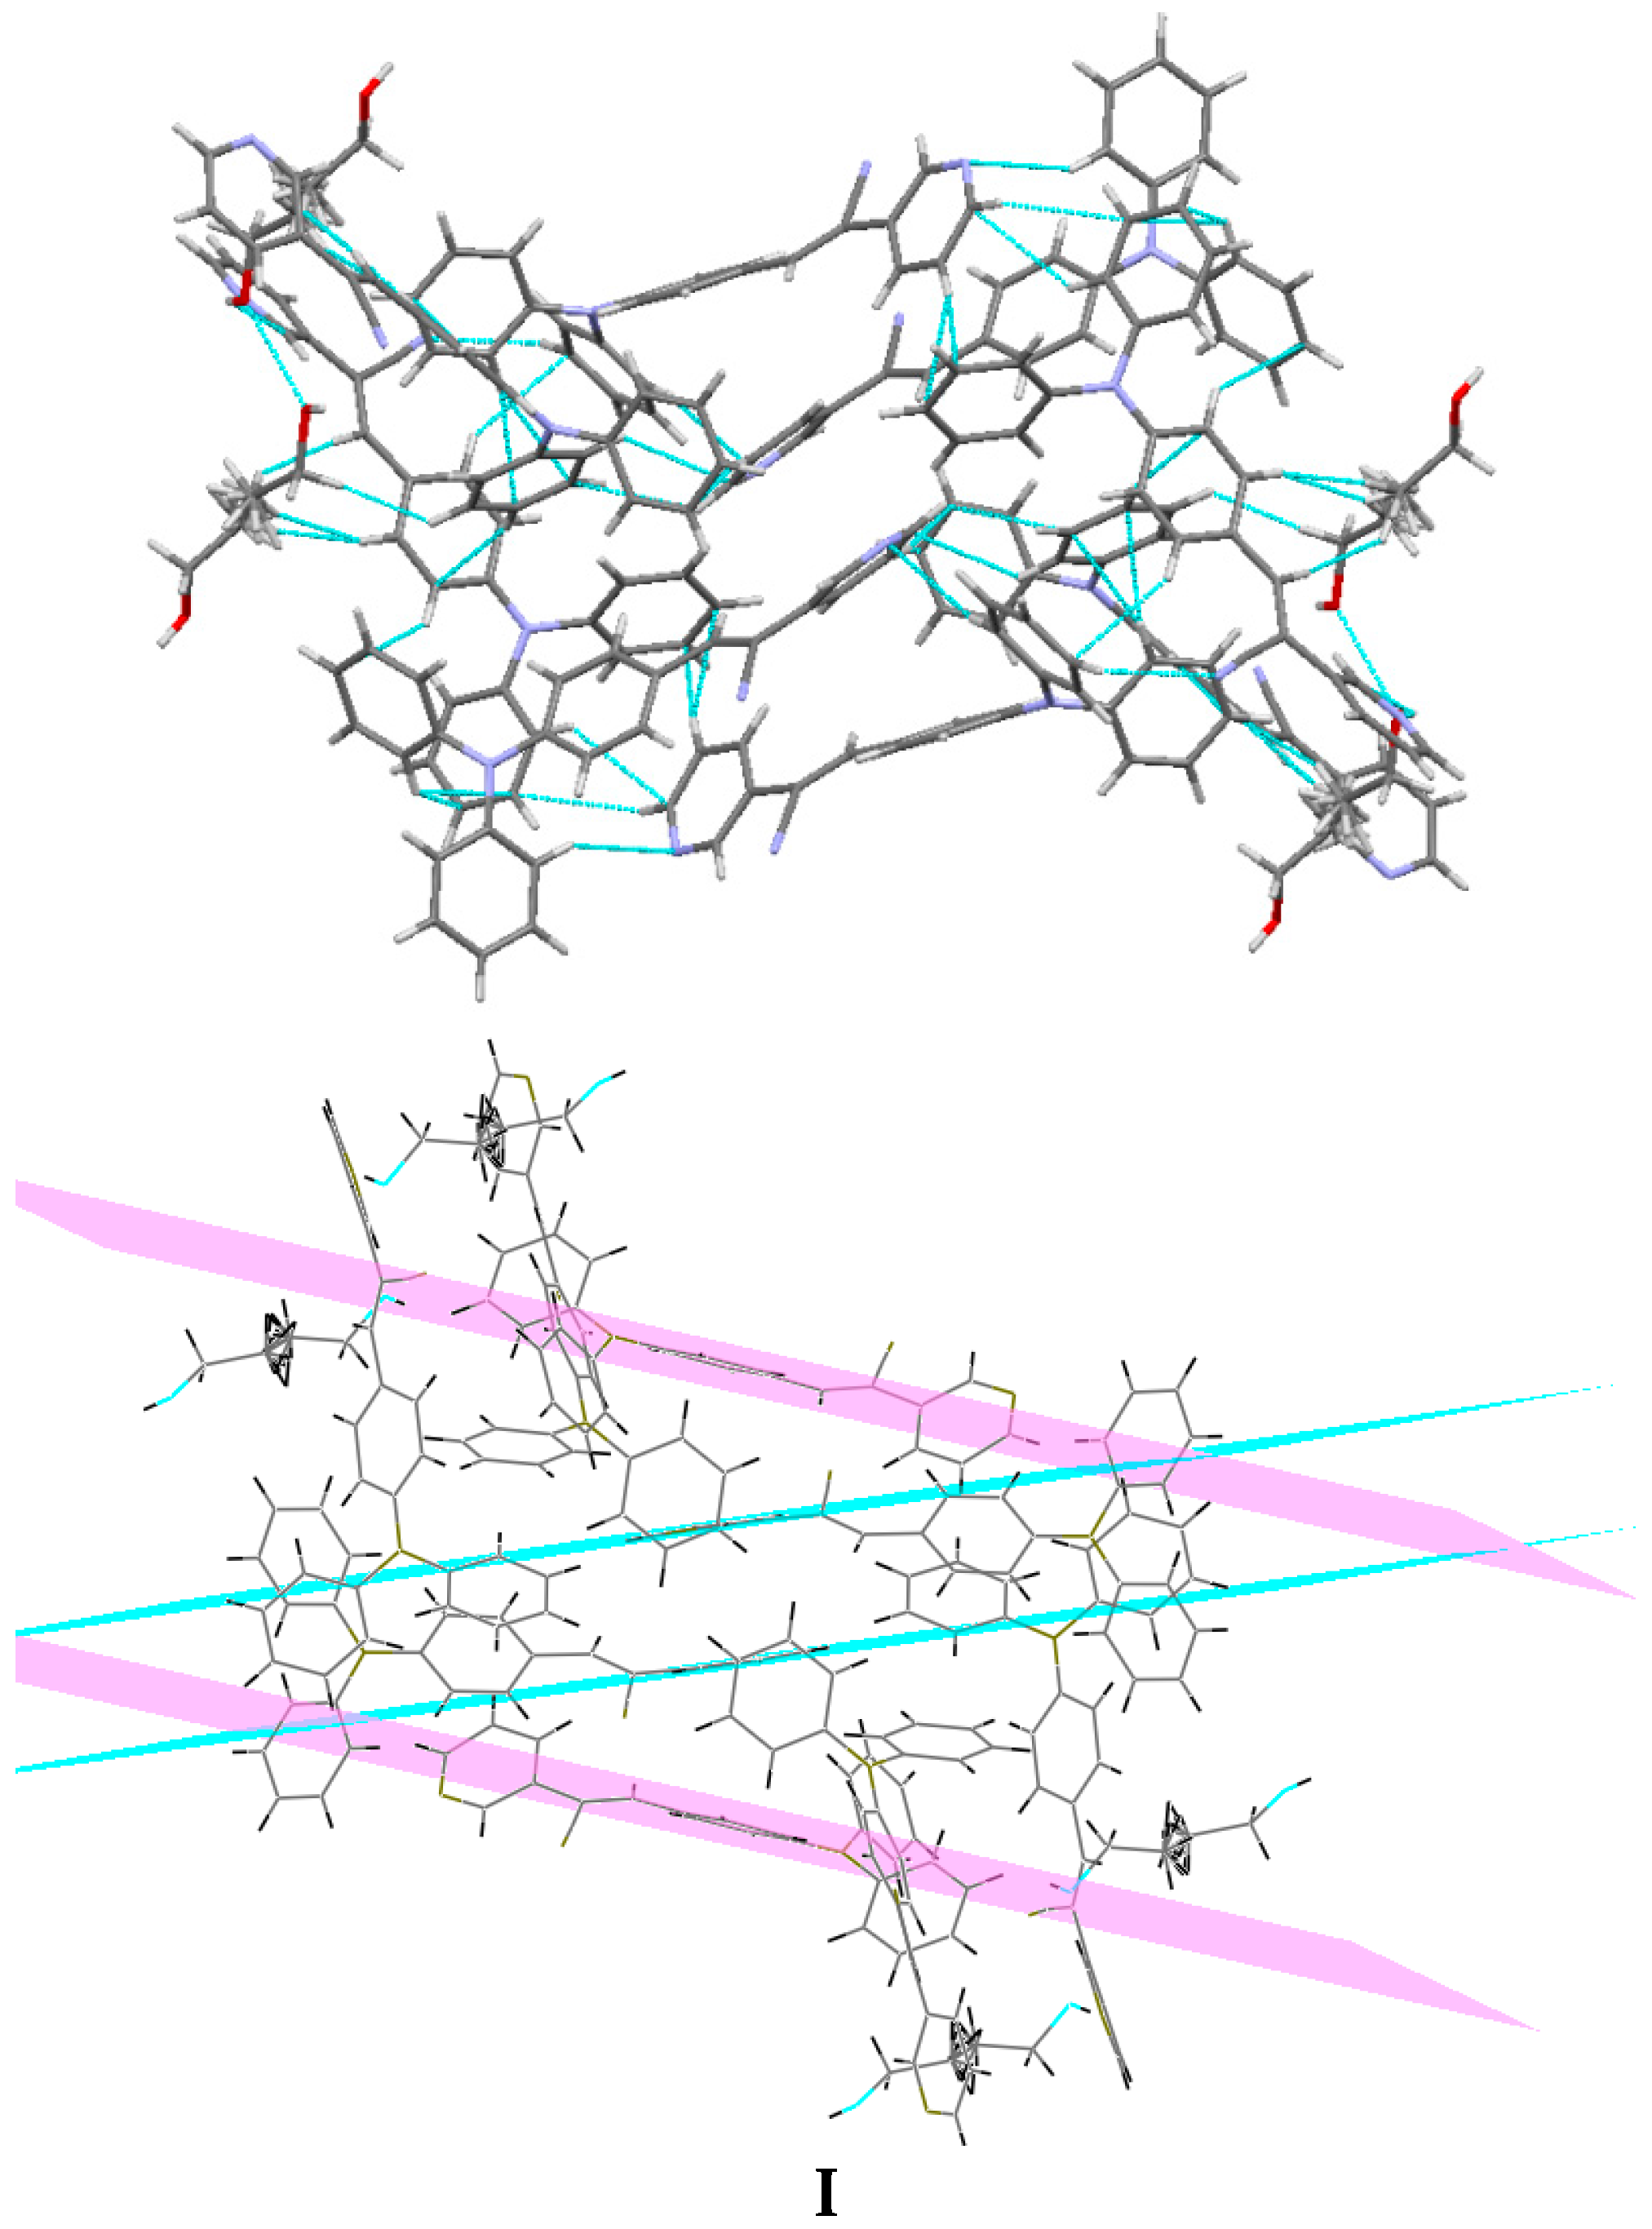
Bao and coworkers reported that tetracene substituted with halogen atoms at the 5 and 11 positions adopted a face-to-face π-stacking motif with enhanced charge transport [
22]. In these three packing modes, the charge transport could be three-dimensionally anisotropic and the highest mobility would be observed along the major π-stacking direction (
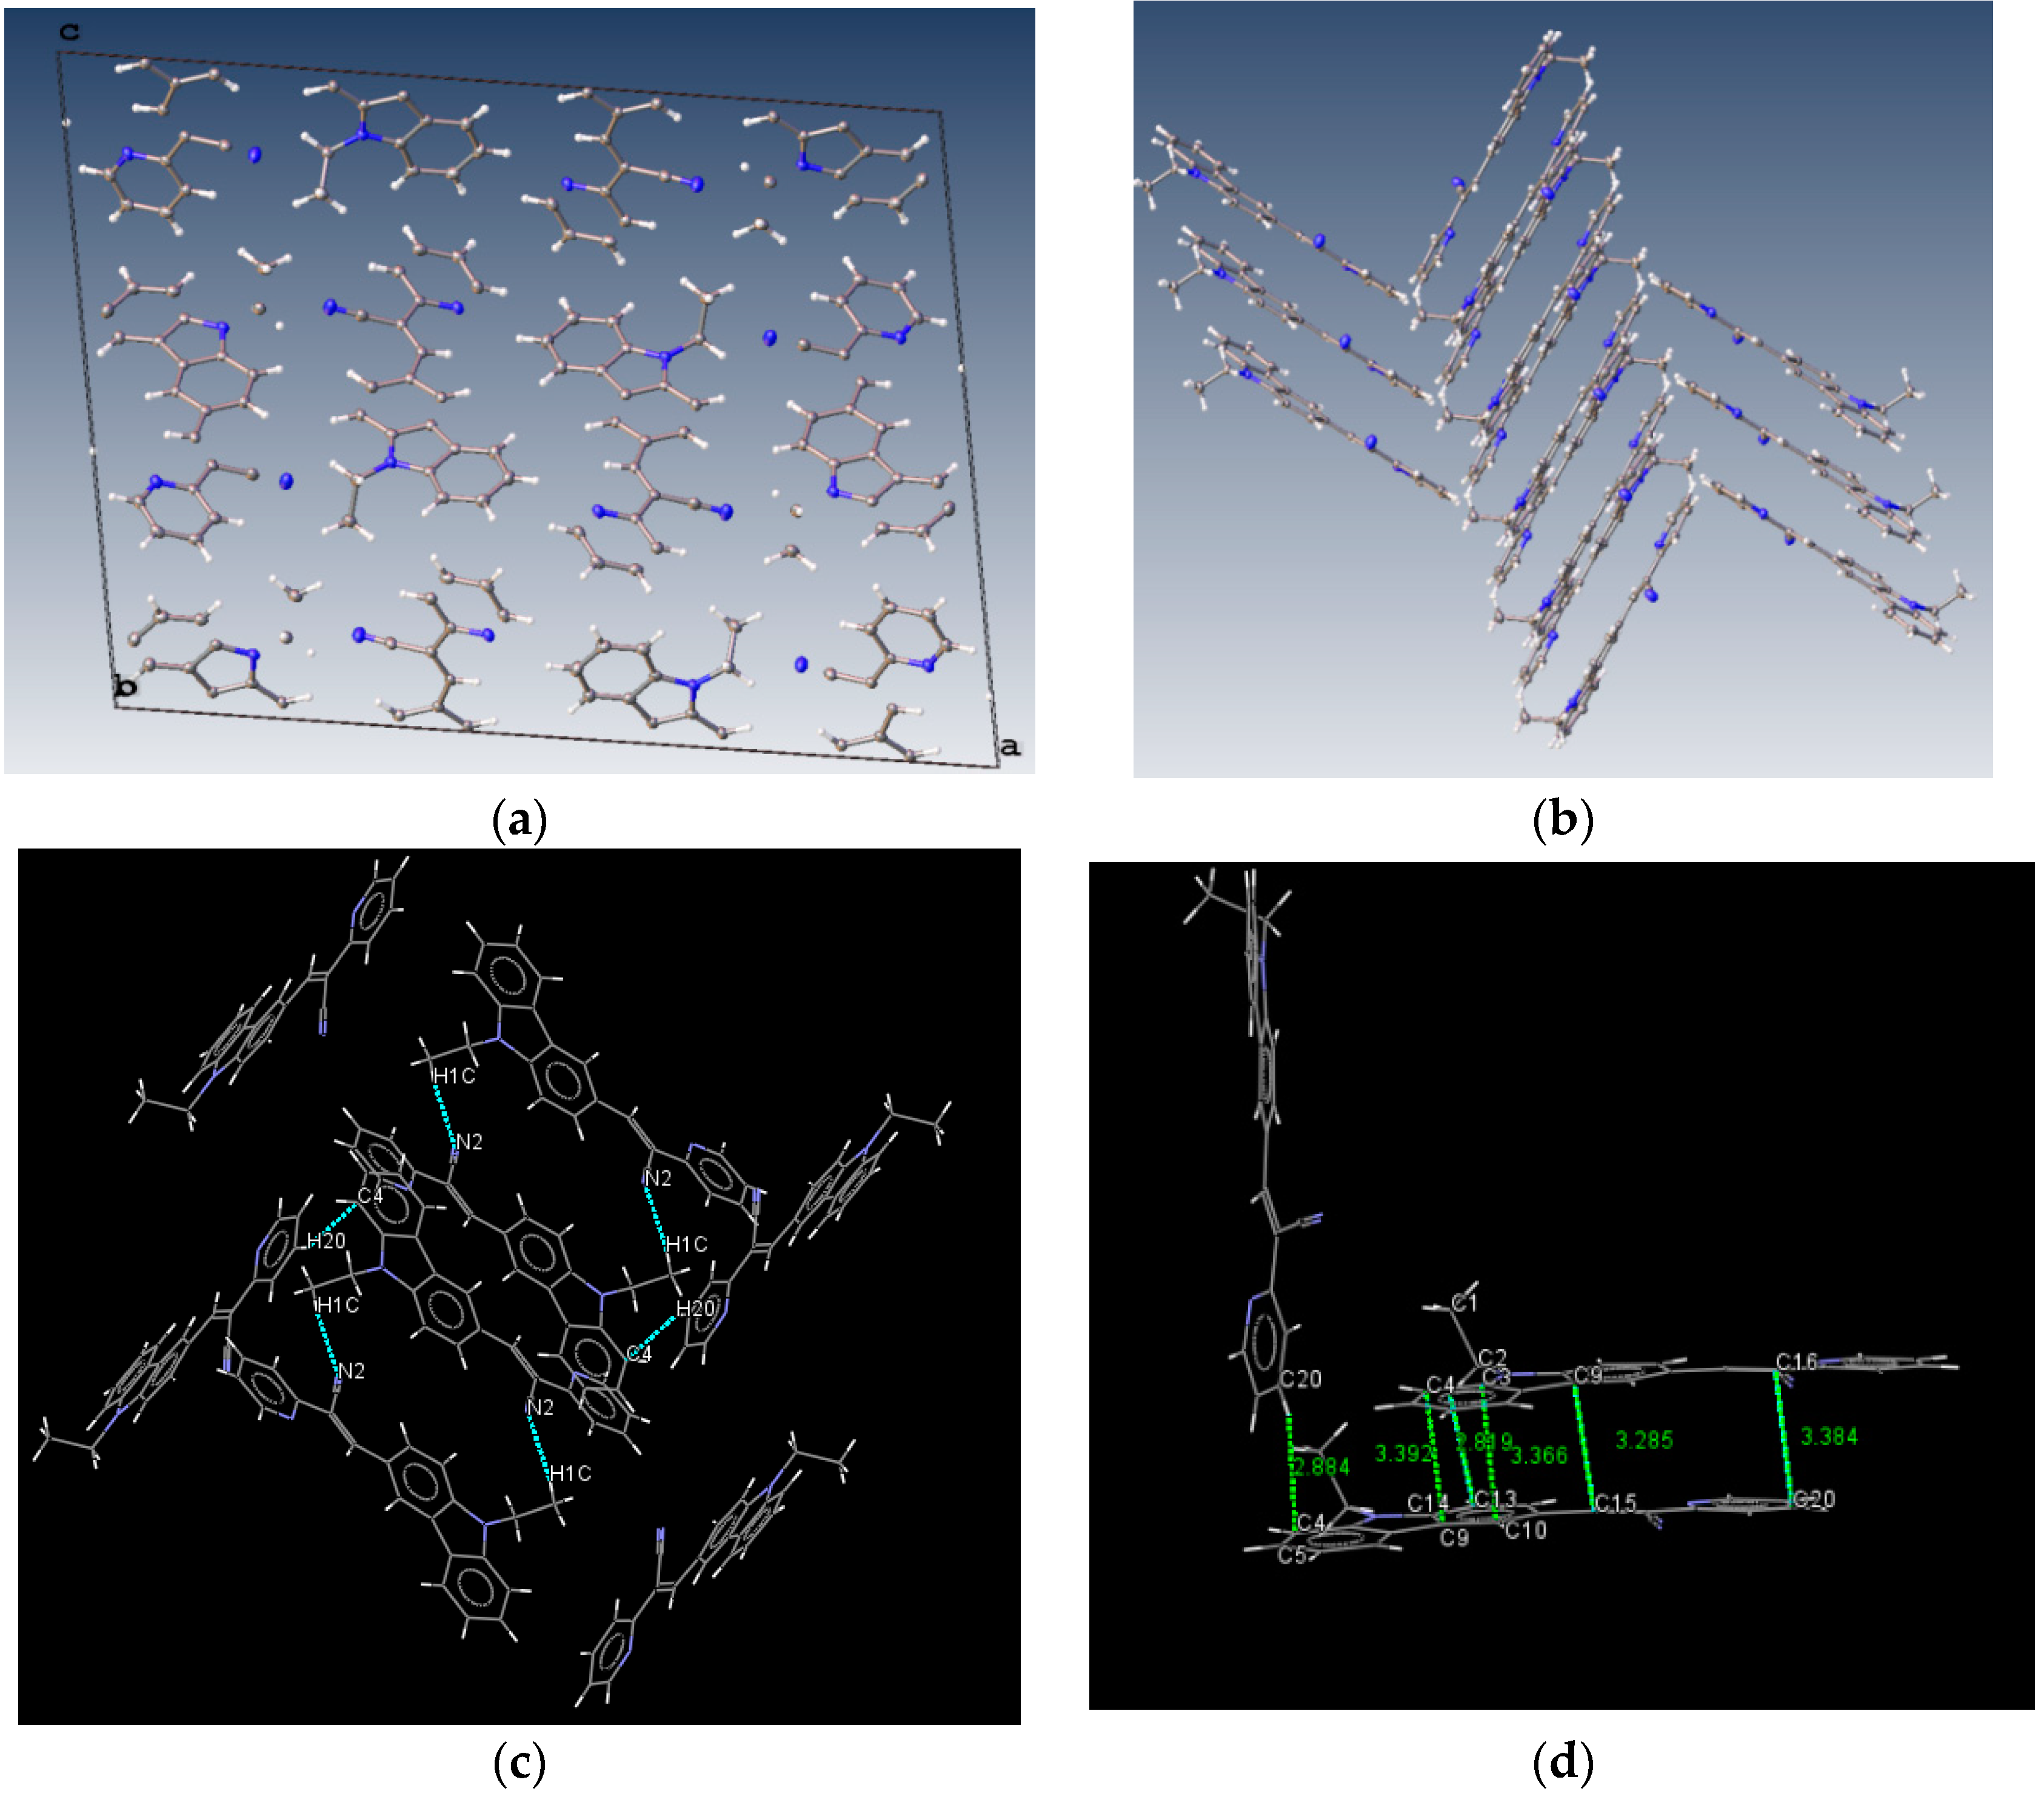
Figure 7). In contrast, the lowest mobility would be found along the directions in which the molecules were insulated from one another. It is worth mentioning that the packing structure of
III presents short contacts between the carbazole and the pyridine group. The interactions maintaining the structure of
III are CH/EtCz···-C≡N of 2.74Å, and CH/(py)·····CH/π(Cz) of 2.88 Å (
Figure 8); however, there are no strong π-π stacking interactions present from centroid-to-centroid, such as in
I and
II, as it can be seen the short contacts values for
III (
Figure 8d) calculated by Mercury software [
50].
From the
Figure 8d it could be supposed that typical π-π interactions are present. However, in
Figure 9 the distance between a pyridine plane and neighboring molecule indicated that there is not a cofacial π-π interaction arising a π-π overlap as it is exhibited in
I and
II. Consequently, the packing motif seems a classical herringbone packing with a strong slipped π-stacking indicating a weak π-π overlap between neighbor molecules [
51].
The UV/Vis absorption spectra recorded in chloroform for
I,
II showed similar maxima of absorption bands, one in the range 416–427 nm in solution with CHCl
3 and a smaller absorption band at 297–301 nm. For the solid form, only the change for compound
II is reported, which underwent a bathochromic effect of 24 nm (λ
max = 451nm) [
52]. Only in compound
II did the absorption spectrum display an obvious bathochromic shift in the solid state, which some authors suggest is due to the molecules adopting a π-aggregated form in the solid state [
18]. The extended delocalization of the nitrogen electron pair onto the two phenyl rings from -N(Ph)
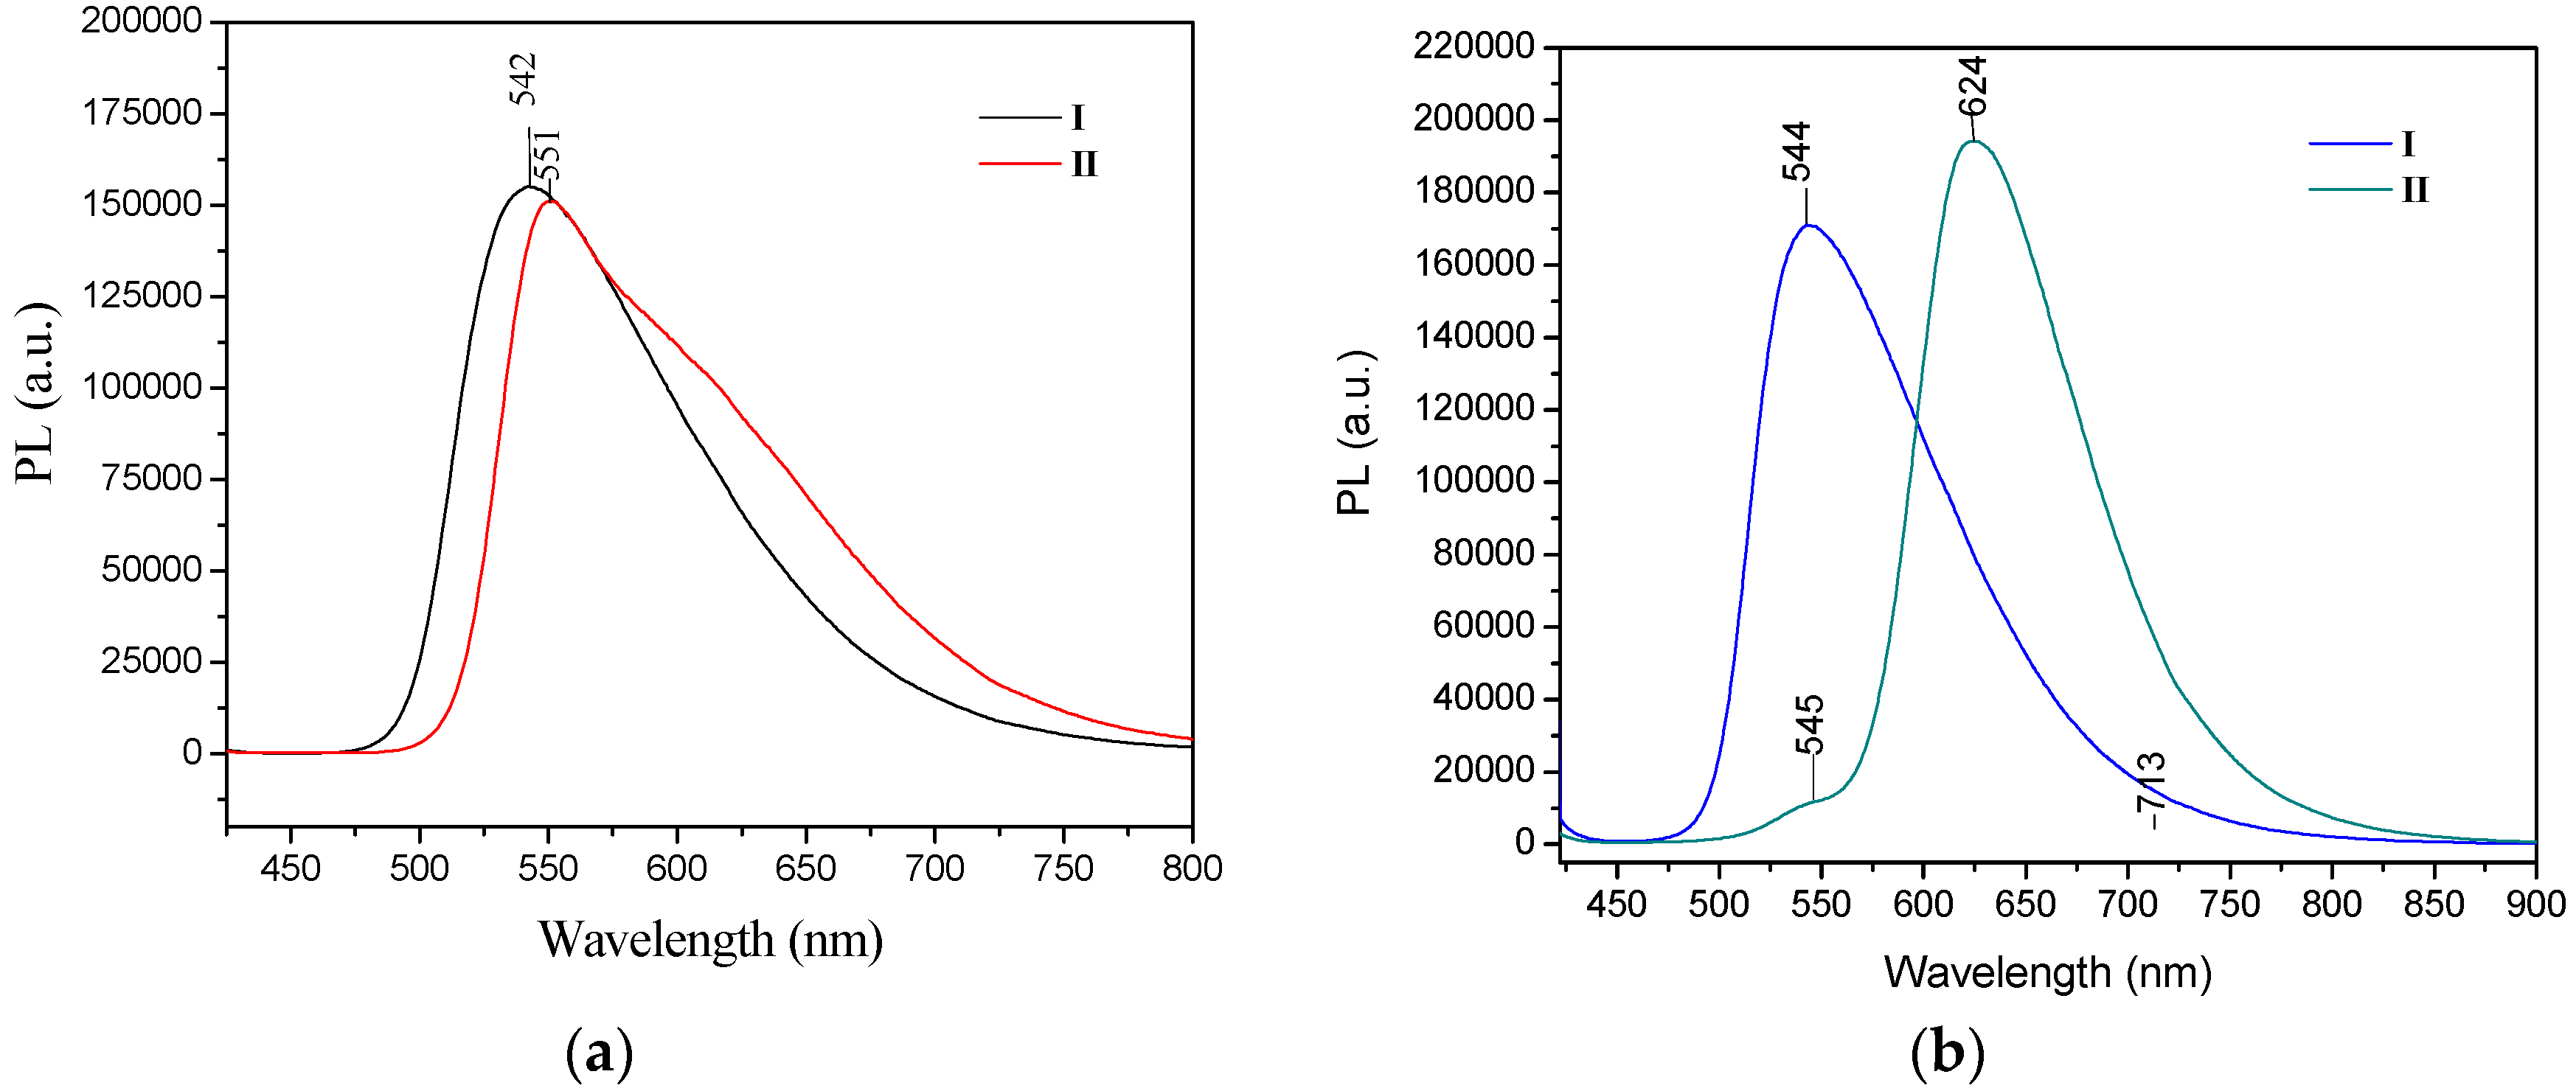
2 accounts for the red shift of the absorption band. The emission spectra of
I and
II in chloroform solution in both the crystal and powder forms showed high fluorescence intensity, both in solution and in the solid state. The photoluminescence spectra of
I and
II were compared to reported values [
52]. Crystals of
II showed a strong bathochromic effect of almost 80 nm as crystals, with λ
em at 624 nm. However, the fluorescence emission maxima for compound
I were almost the same for the powder form (535 nm) and the crystals (544 nm) (
Figure 10).
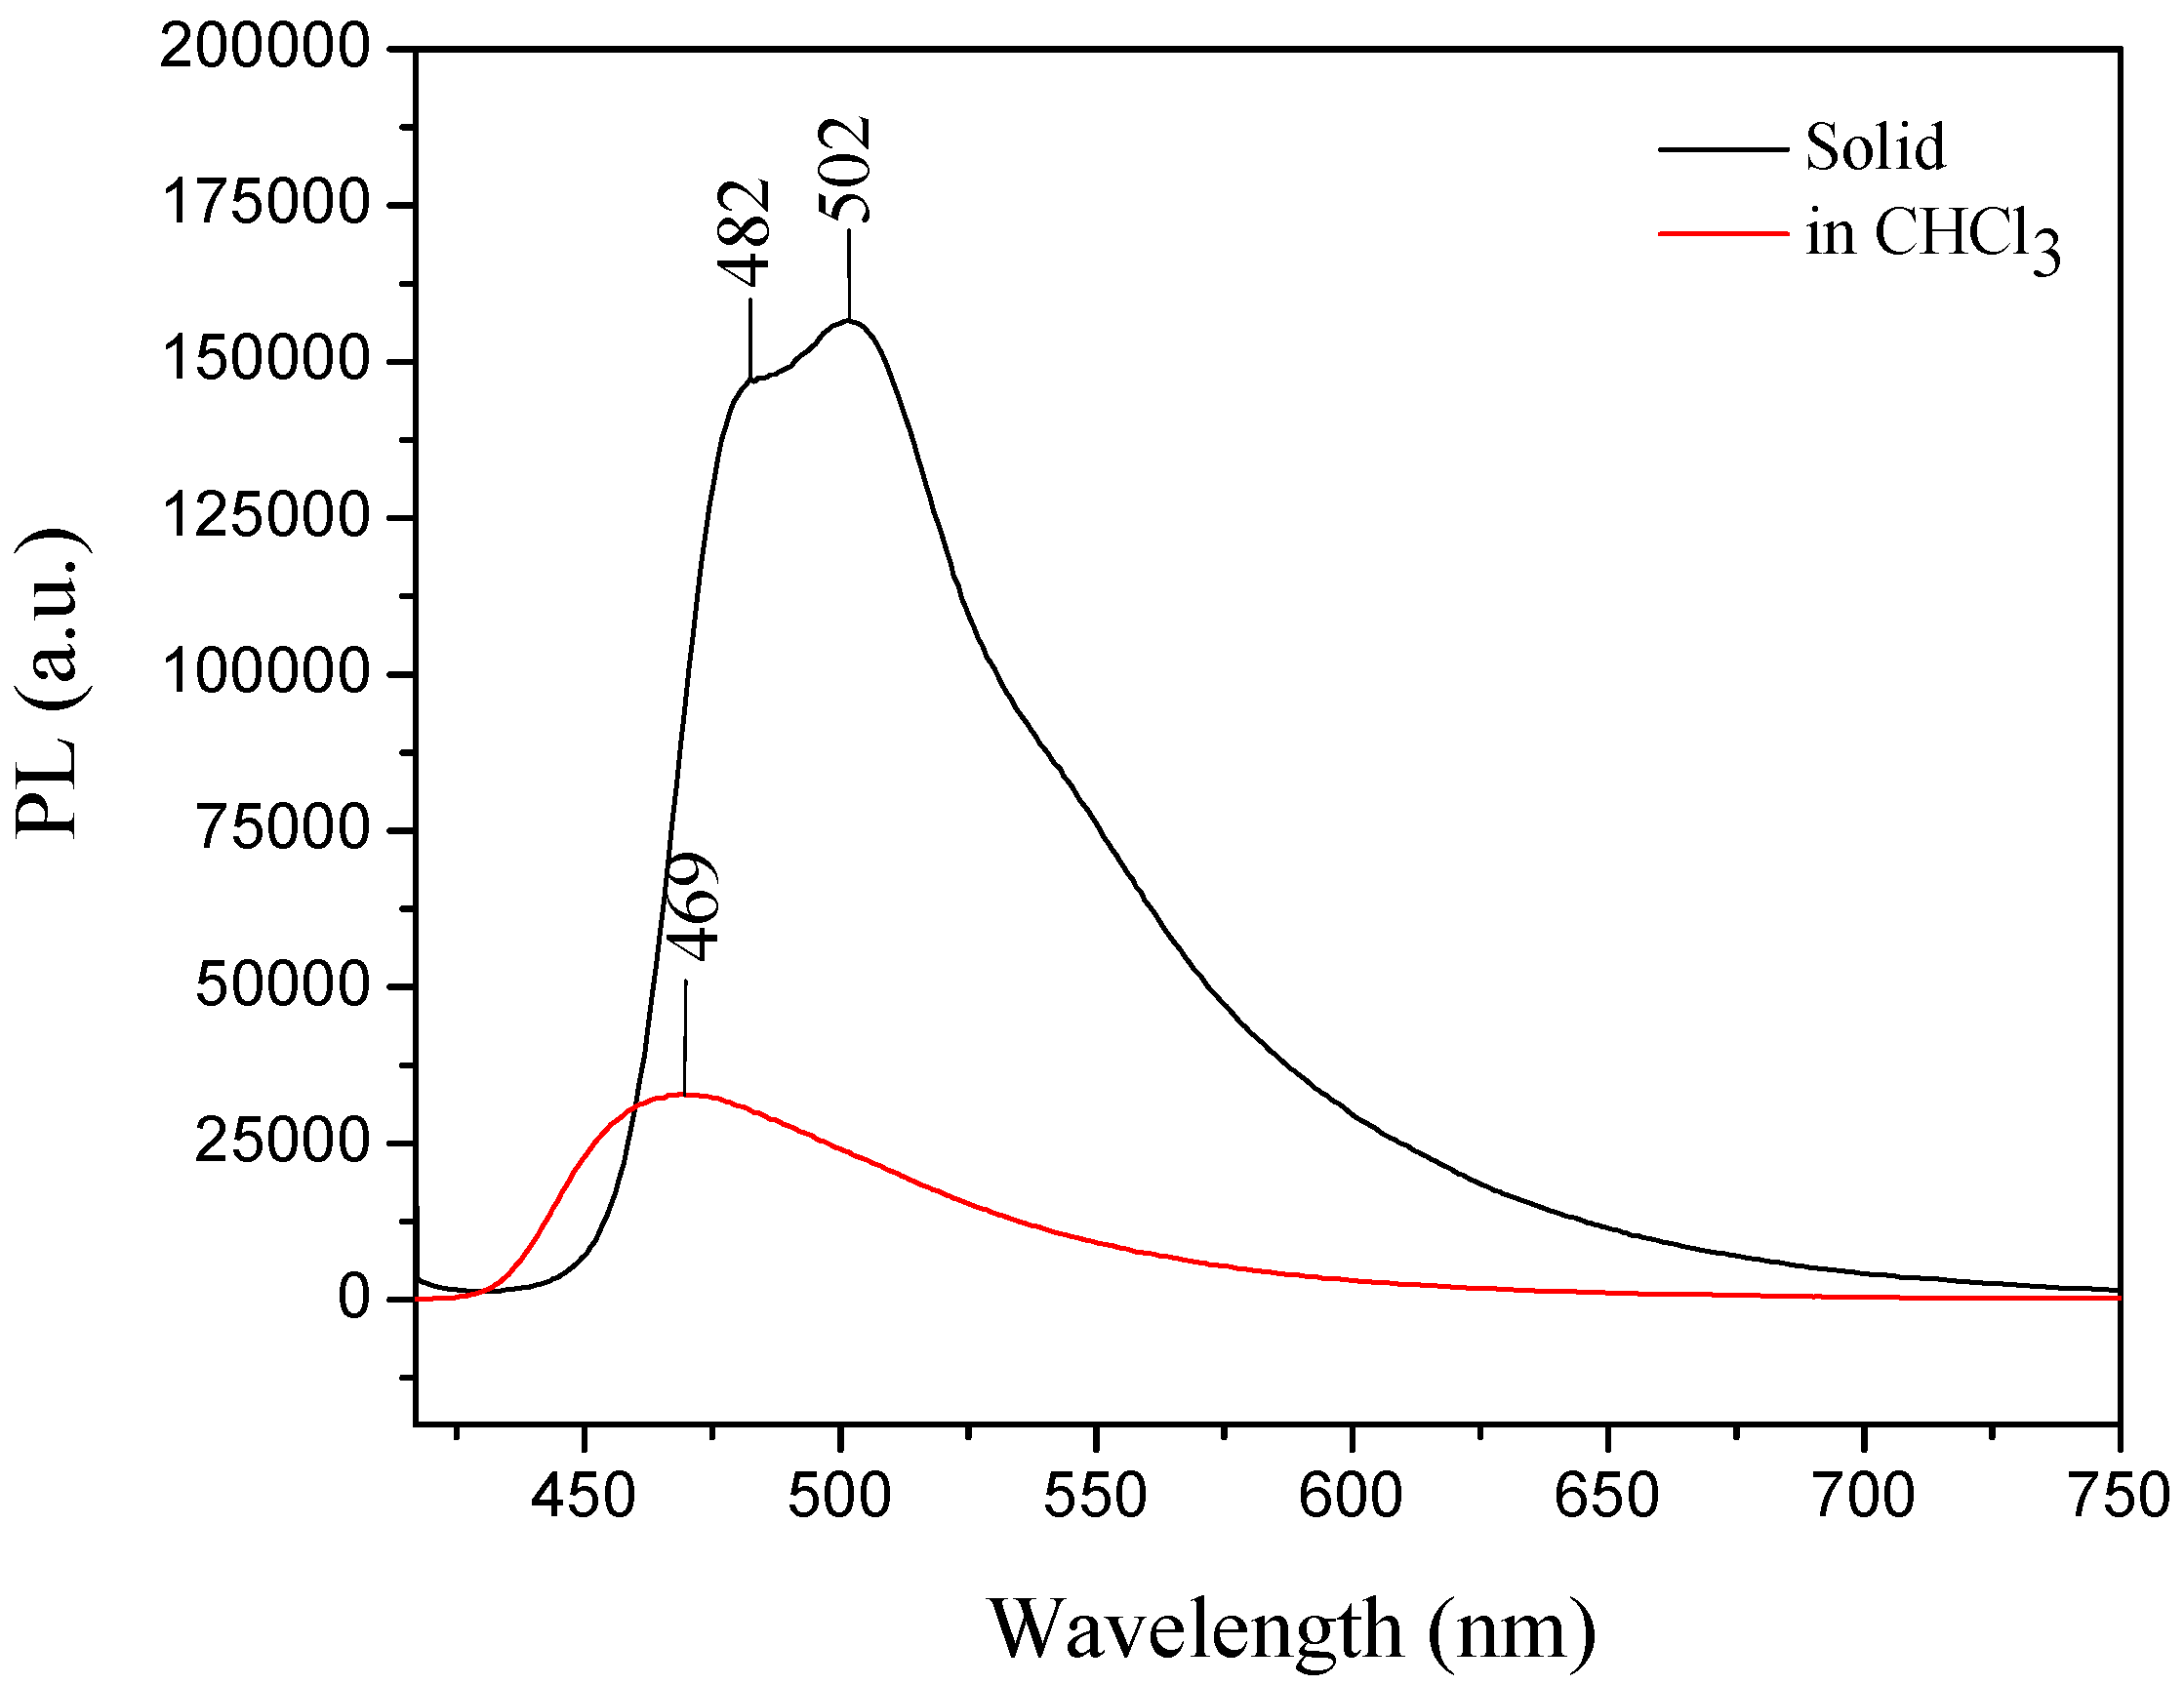
For
III, the UV-vis absorption wavelength maximum in solution was at 380 nm, whereas in the solid state its absorption maximum (λ
max) was 398 nm (
III) [
30]. The compound showed a typical AIE effect, because the emission maximum in the solid form was observed at 502 nm and the emission in solution was weak, which could be attributed to the carbazole group effect [
30,
53] (
Figure 11).
2.3. DFT Calculations
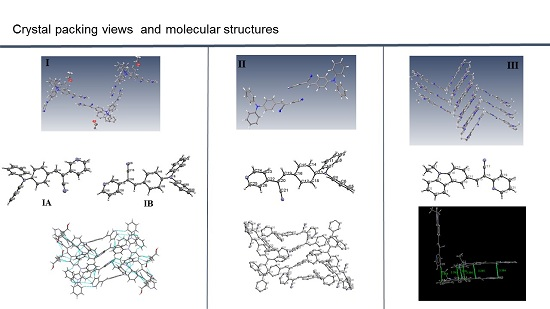
We carried out the Gaussian09 program optimization calculations with the M06L method using the cc-pVDZ basis set in the gas and solvent phases.
Geometries with small root-mean-square deviations were obtained with respect to the crystallographic data (the largest 8 degrees in dihedral angles). The frontier HOMO and LUMO energies and gap energies were evaluated in the different solvents (
Table 5). The effect of solvent was evaluated by the PCM method. The most energetically stable structures were obtained in solutions of methanol and dimethyl sulfoxide. Also, the highest values of dipole moment (µ) and the lowest were correlate to the solvent polarity used to obtain suitable crystals for X-ray characterization (see
Table 6) [
55,
56,
57,
58].
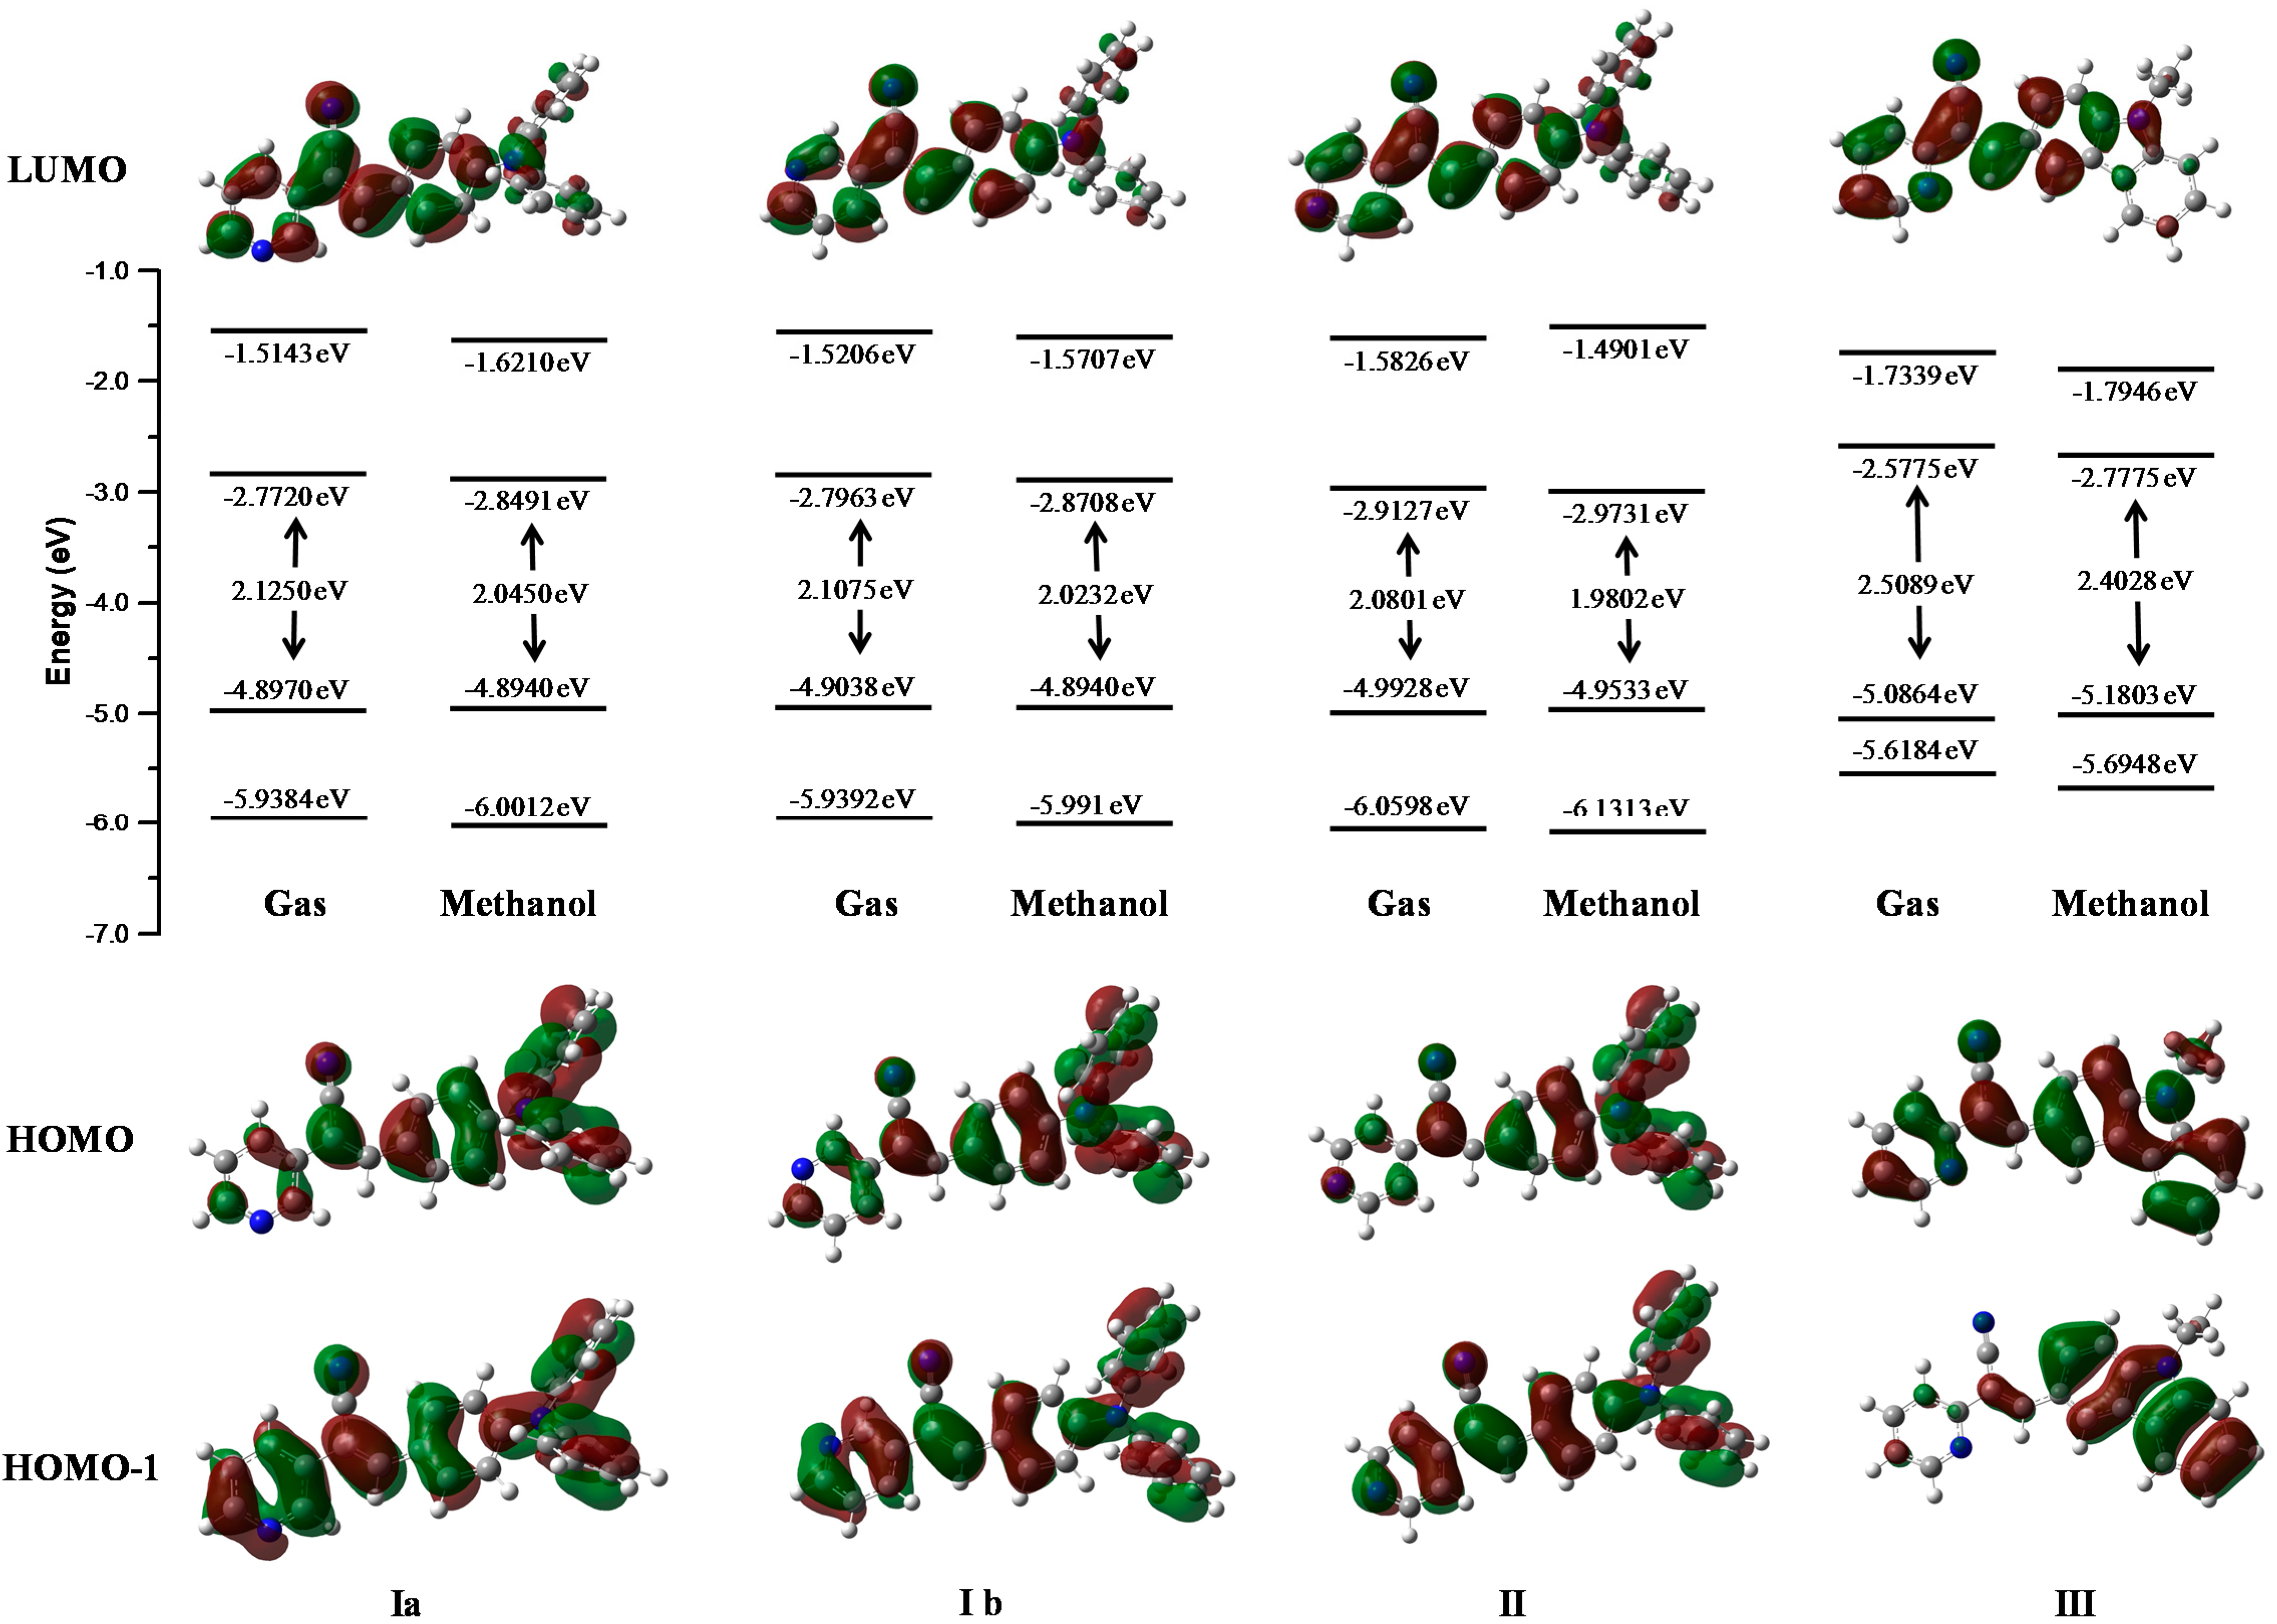
Figure 13 represents the energies of the molecular orbitals LUMO+1, LUMO, HOMO, HOMO-1 in the gas phase and in one of the most stable solvent phase (methanol). Isosurfaces in the diagram represent the maps of HOMO and HOMO-1(bottom) and LUMO (top). The character and energy levels of HOMOs and LUMOs (and the corresponding energy gaps) were determined on fully optimized geometries and compared with electrochemical measurements. The theoretical HOMO energy levels of the three compounds
I,
II and
III in the gas phase were close together, −4.89, −4.99 and −5.08 eV, respectively.
I and
II p-diphenylamino substituents caused a greater delocalization on the phenyl core than the pyridyl ring. The theoretical calculation showed a delocalization on the pyridine-carbazole backbone for
III. Thus, the character of the HOMO of
I and
II were very different from that of
III, for which the HOMO presented a clear pyridyl-phenyl-carbazole delocalization leading to the highest HOMO level (−5.08 eV).
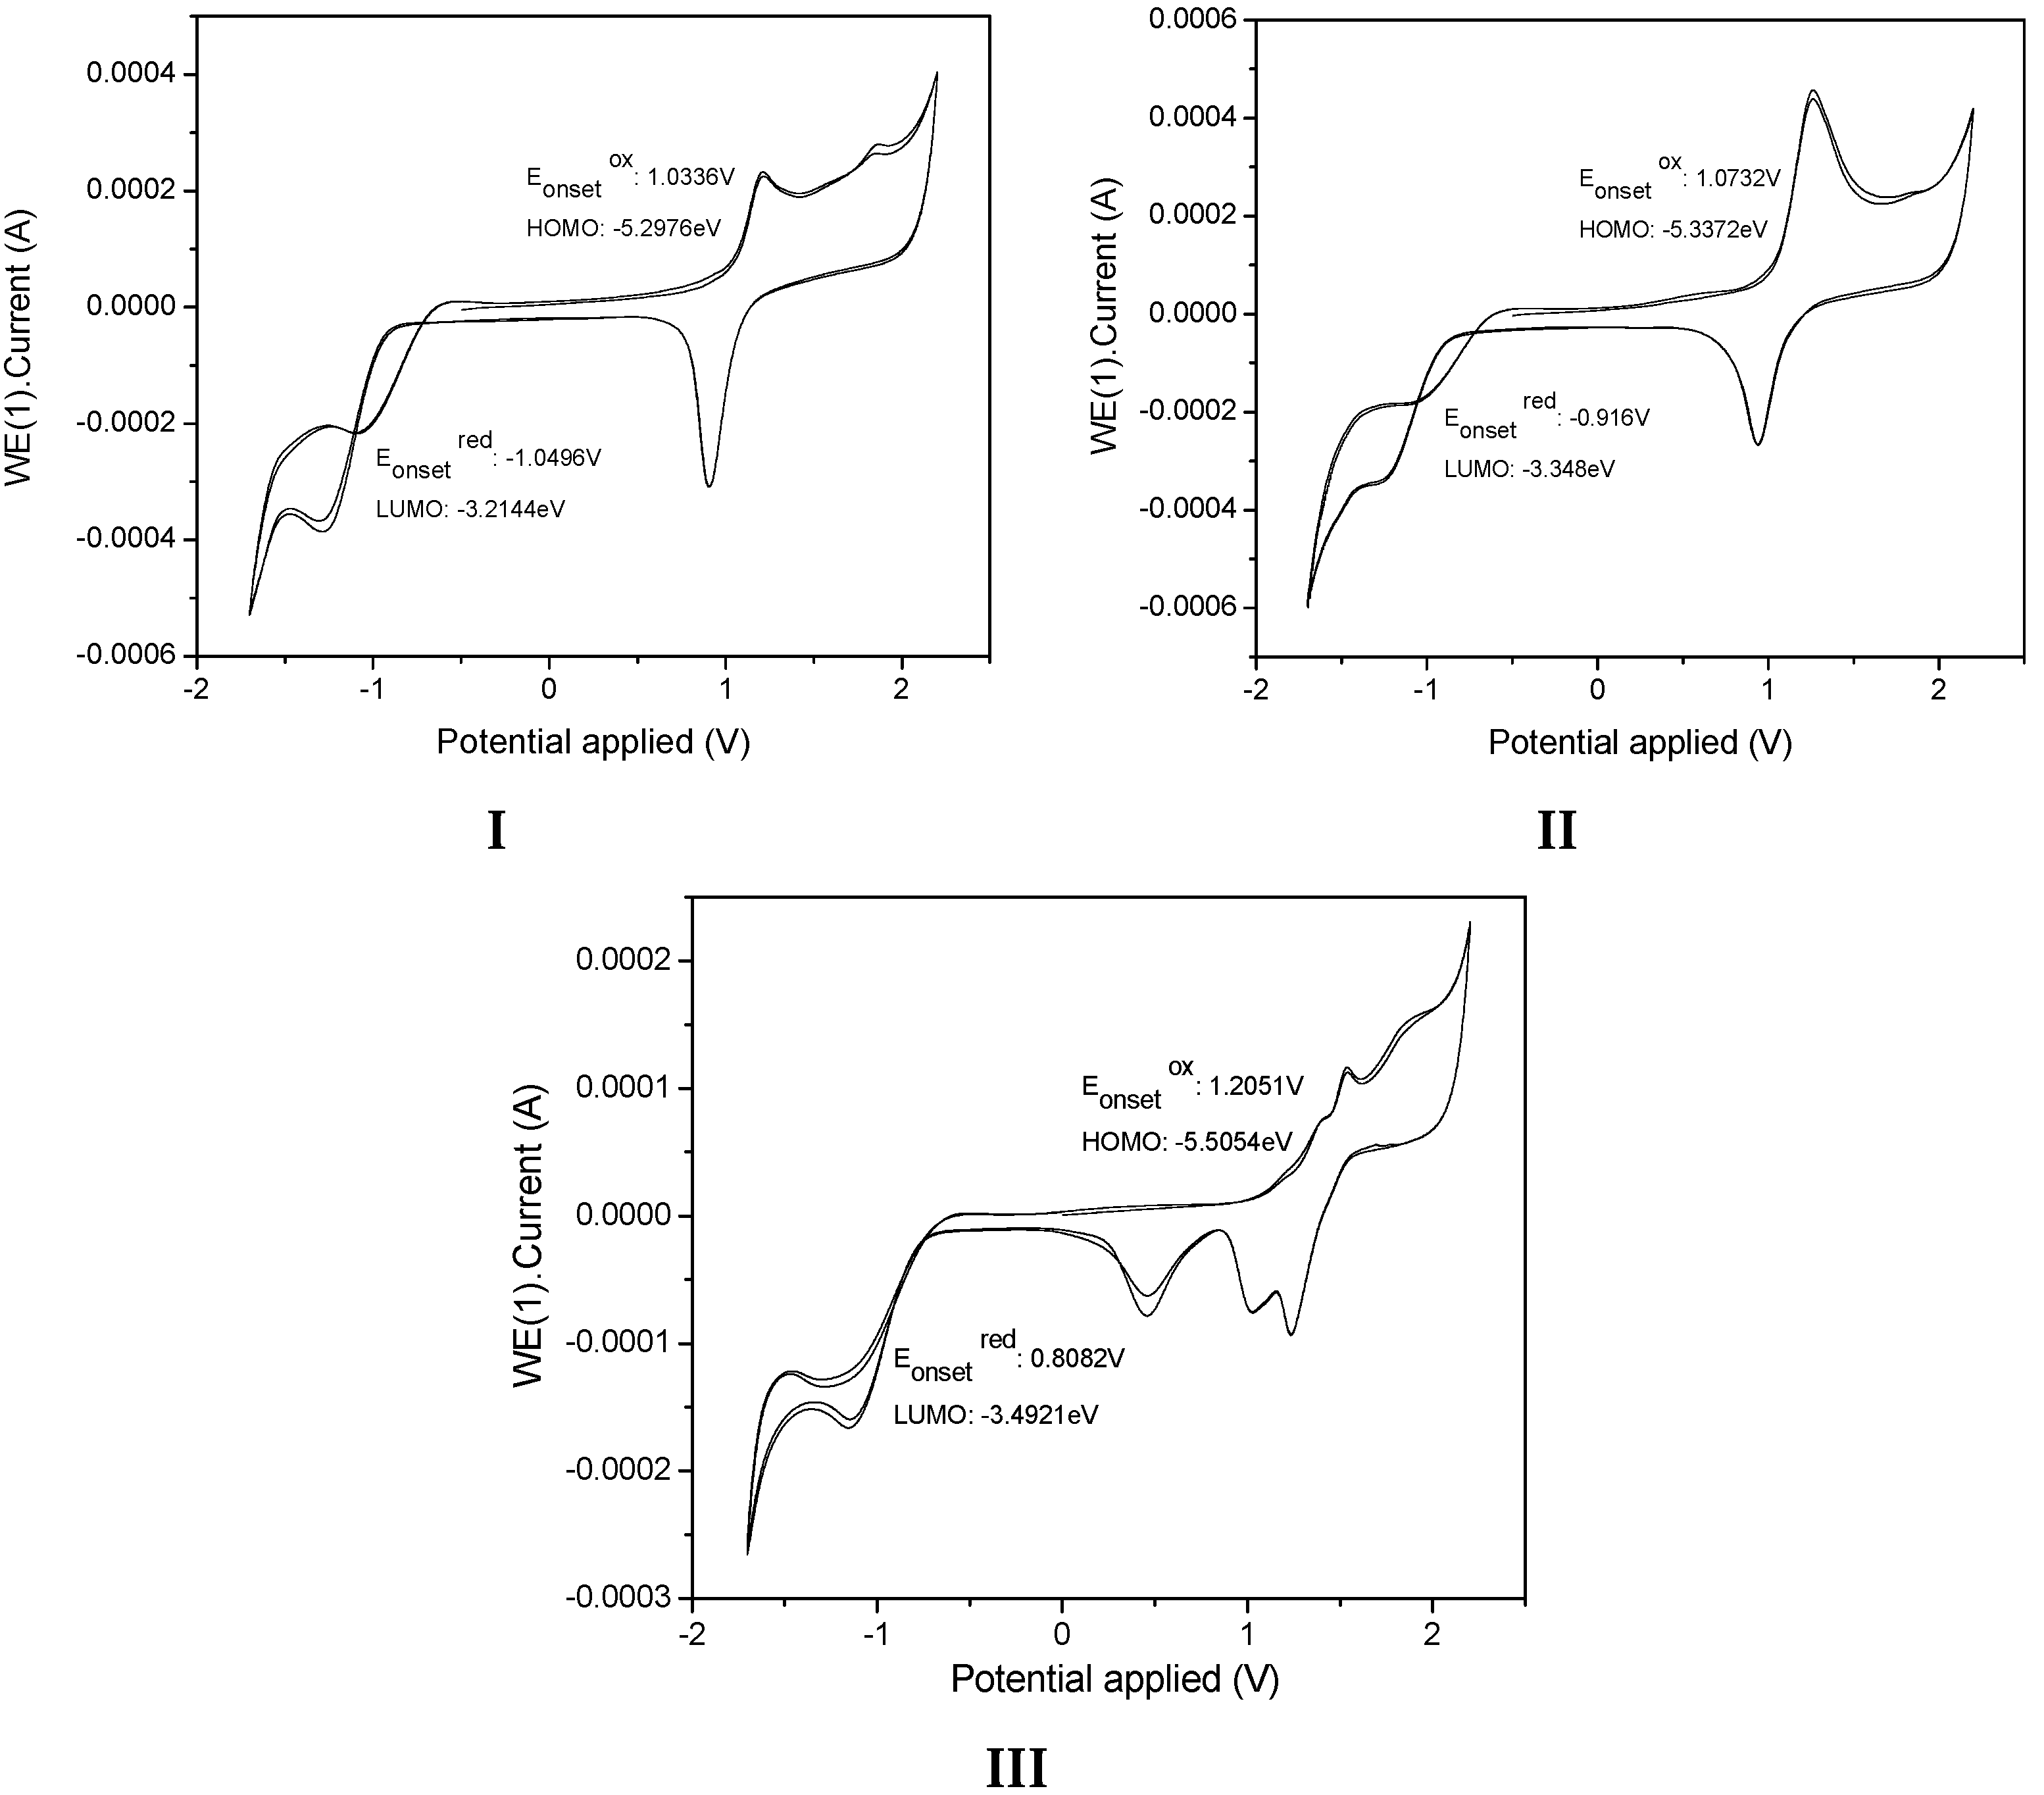
The present calculations were almost in accordance with electrochemical data (
Table 4), which led us to conclude a better delocalization in
I,
II and
III, therefore diminishing the HOMO level from
I,
II to
III −5.29, −5.33 to −5.50 eV. With respect to the LUMO levels of the pyridine-substituted
I,
II and
III, they were calculated to be between −2.77, 2.91 and −2.57 eV, respectively, presenting a pyridyl character without contribution of the
p-diphenylamino and carbazole moieties. The LUMO energy levels of
II are 0.34 eV higher than that of
III (−2.57eV) showing the less intense withdrawing effect of the pyridyl unit compared to the carbazole unit. The LUMO level of
III was calculated at −2.57 eV, lower than that of
I and
II and the decrease of the LUMO in
II emphasized the withdrawing effect of the pyridyl unit and its efficient conjugation with the carbazole unit, rendering this molecule the most easily reducible. The main tendency of the LUMO levels obtained through theoretical calculations did not agree with our electrochemical conclusions, with the lowest LUMO recorded for
I. The LUMO calculated for
I,
II and
III are close together (0.44eV), and their LUMO values determined through electrochemical measurements were also very similar (−3.21, −3.34, and −3.39 eV, respectively).
The theoretical energy gaps of I, II and III were close to 2.12, 2.08, and 2.50 eV, respectively, values closer to the energy gap values obtained from the electrochemical measurements (2.08 eV for I, 1.98 for II, and 2.01 for III) showing a good correlation between theoretical calculations. Furthermore, the values showed better fit with the theoretical calculations when the polarity of the solvent was increased.


