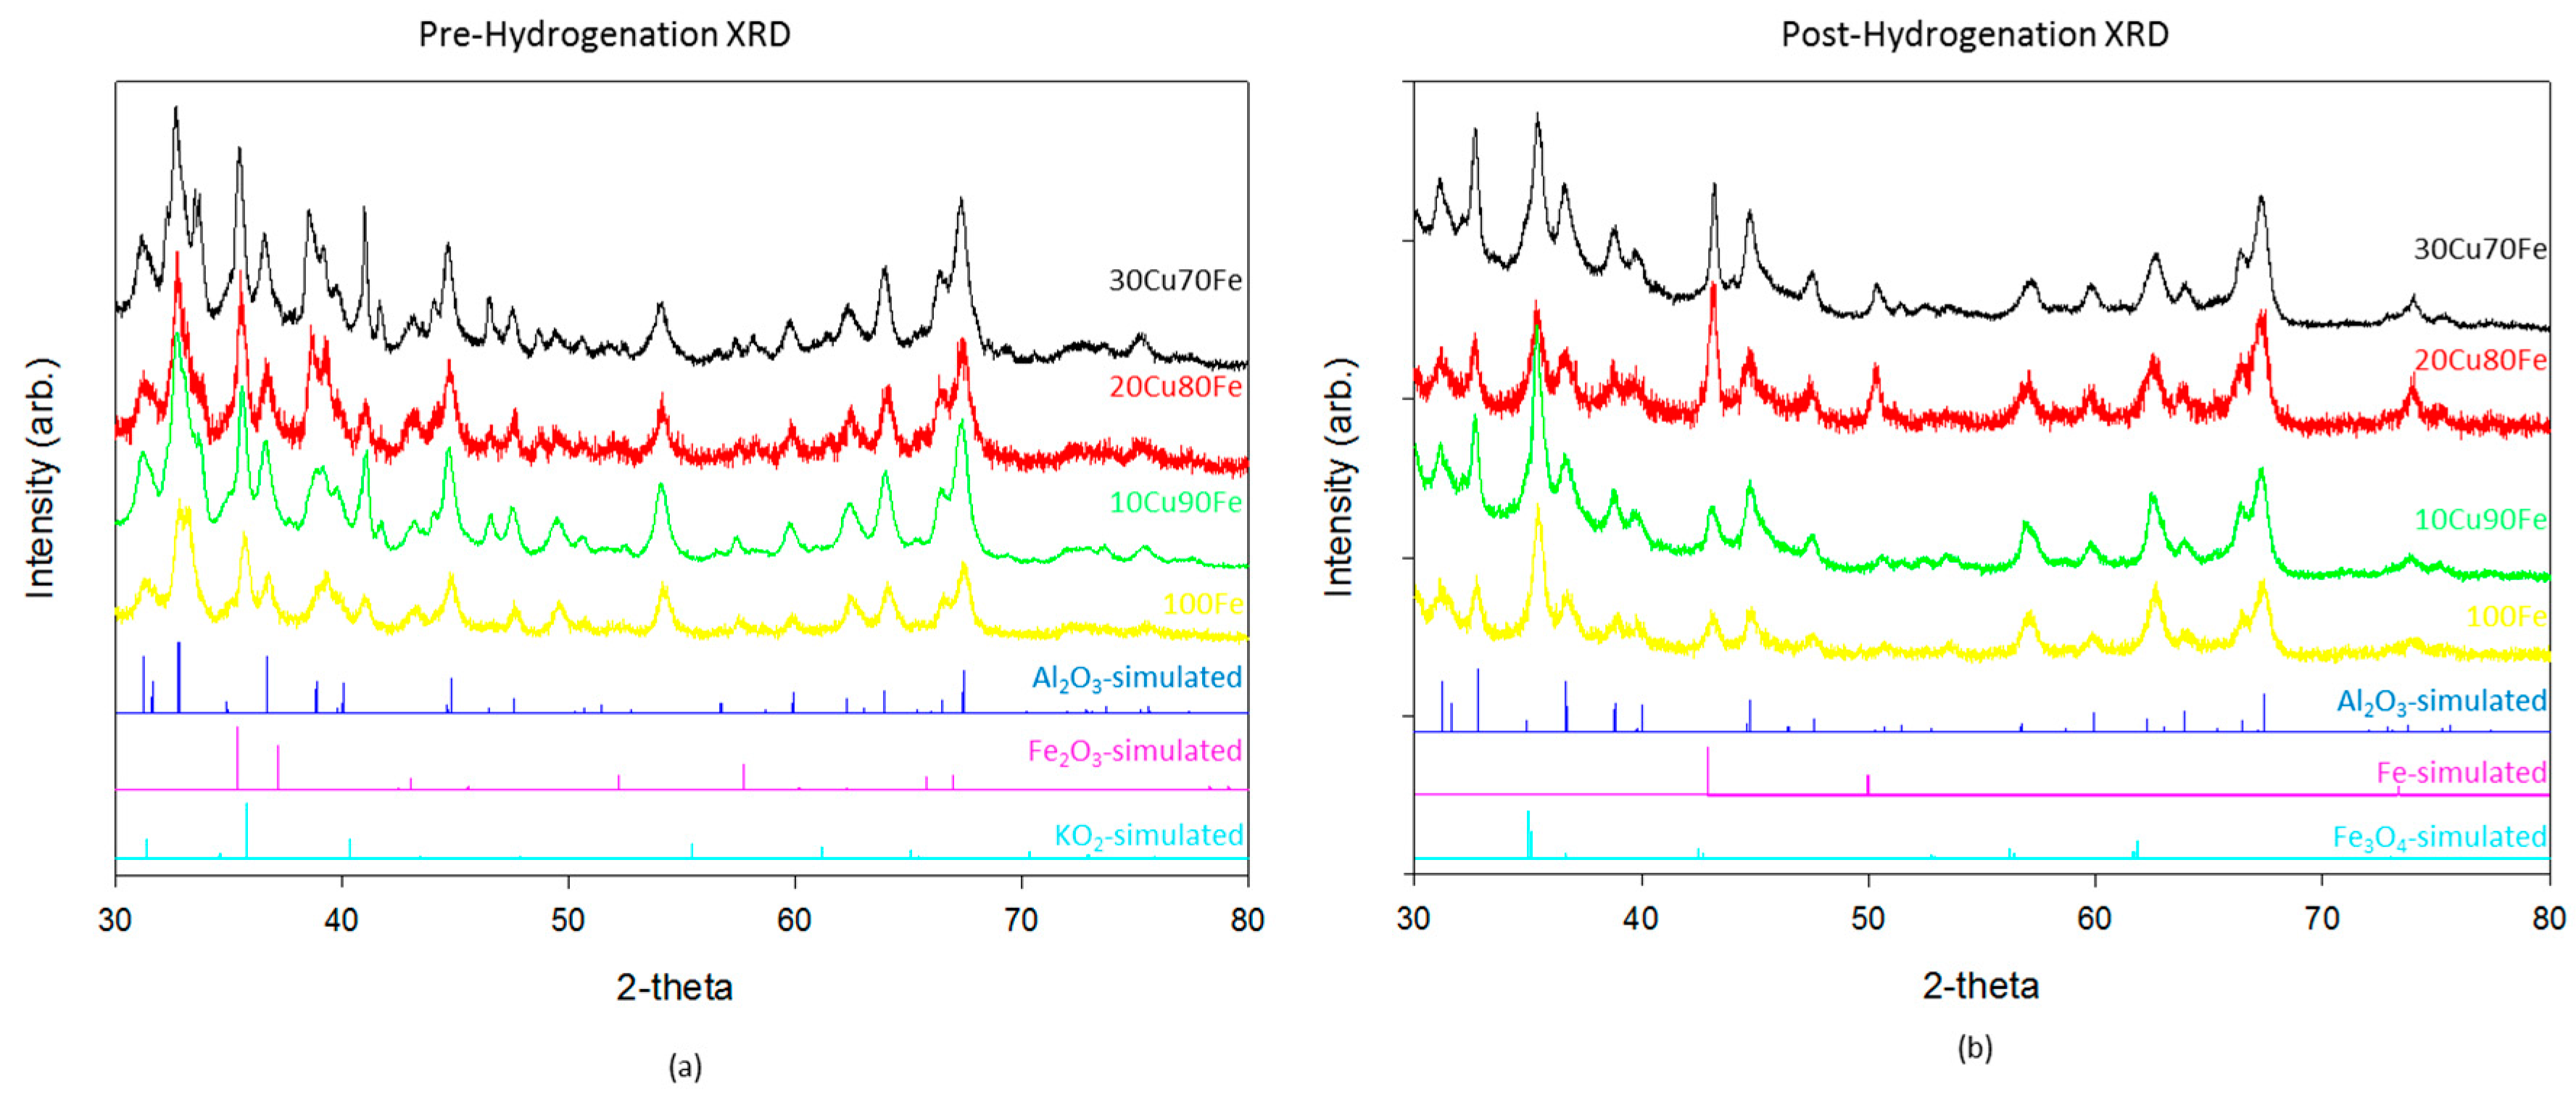
3.1. Catalyst Characterization
Catalysts were characterized by XRD (
Figure 1) and XPS (
Figure 2) both before and after hydrogenation. There is relatively little difference in the XRD patterns between the different catalysts. The majority of the reflections in these samples both before and after hydrogenation are accounted for by gamma-Al
2O
3, the support material. The pre-hydrogenation catalysts also show a fully oxidized Fe
2O
3 phase and KO
2 phase (
Figure 1a). Although K
2O is the standard phase of potassium oxide, we consistently observe the KO
2 phase, which is indicative of how the potassium arranges itself in the catalyst matrix.
After reduction and subsequent CO
2 hydrogenation (
Figure 1b), the Fe
2O
3 phase shifts to the reduced Fe
3O
4 inverse spinel phase, and in samples with a higher copper ratio some metallic face center cubic (FCC) phase begins to form as well. It is important to note that, although the crystal phases used for simulation are Fe-based, the reality is that they are likely Fe–Cu intermetallic or alloy phases. The small difference in atomic radius between the two atoms and the complex nature of the catalyst make differentiation of those phases difficult in this system. As the Cu ratio is increased, the metallic FCC phase also increases. One possible explanation is that the higher reduction potential of Cu leads to an increase in the metallic phase in the reductive environment. Although some reduction should be expected due to the presence of H
2, there does not appear to be a correlation between the increase in the FCC phase and an increase in catalytic activity for CO
2 hydrogenation. This result differs from the modeling [
24,
25,
26,
27,
28,
29] precedent, which uses the metallic FCC phase as a catalytically active site in Fe
xCu
y catalyst. In the highest performing catalyst, 90Fe10Cu/K, there is no evidence of the metallic phase. It is only when the copper, which has a much larger reduction potential than iron, ratio increases that the oxide transitions reduces fully to the metal.
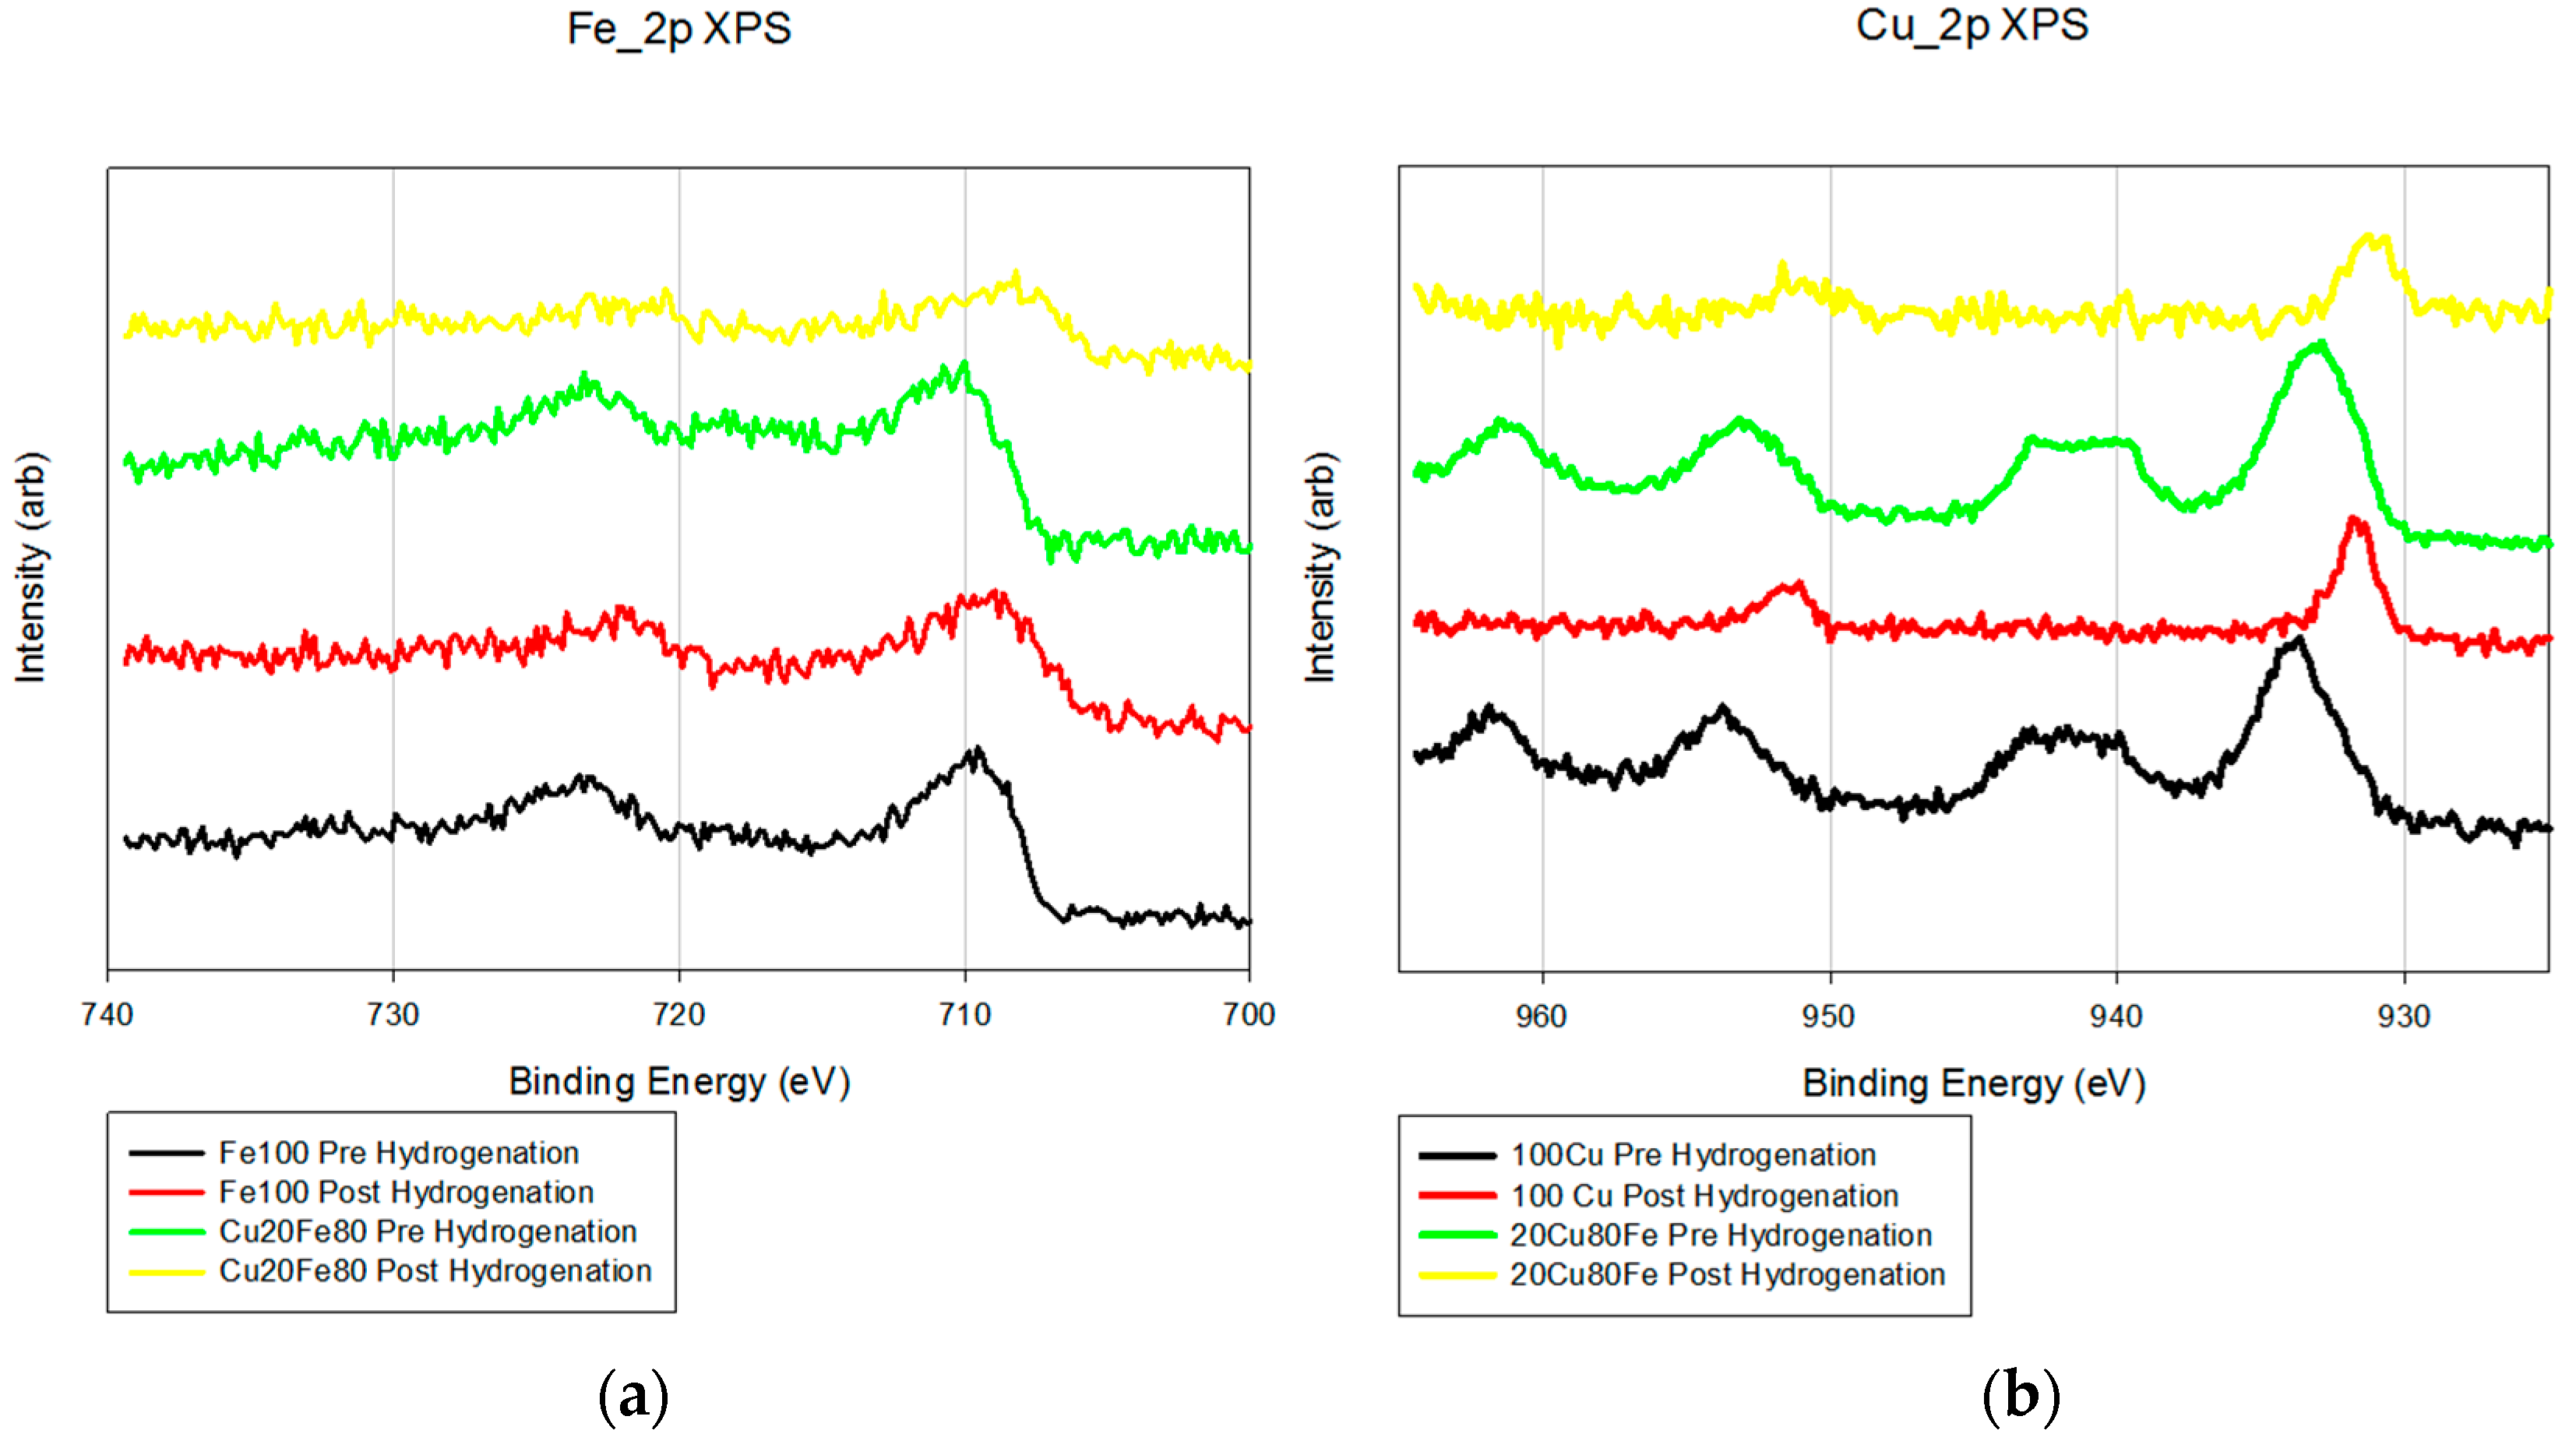
XPS also shows little difference between the Fe/K and FeCu/K samples (
Figure 2). The Fe_2p analysis shows a minor shift (2–3 eV) toward a more reductive environment with the addition of copper. The Cu_2p pre-reduction samples show peaks at 943 eV that are due to the presence of Cu
2+. After reduction, these peaks disappear and the peaks at 934 eV shift 3–4 eV, which is a more reduced form of copper.
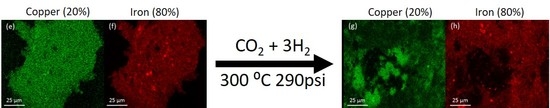
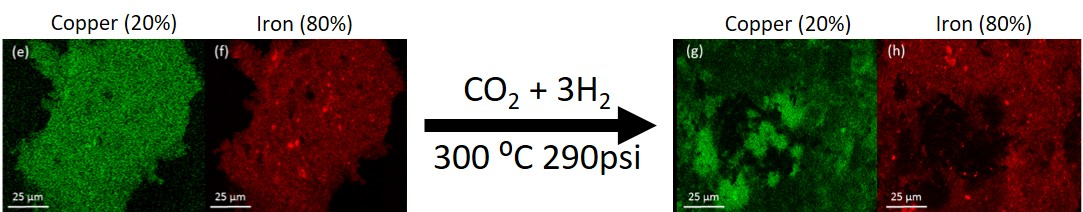
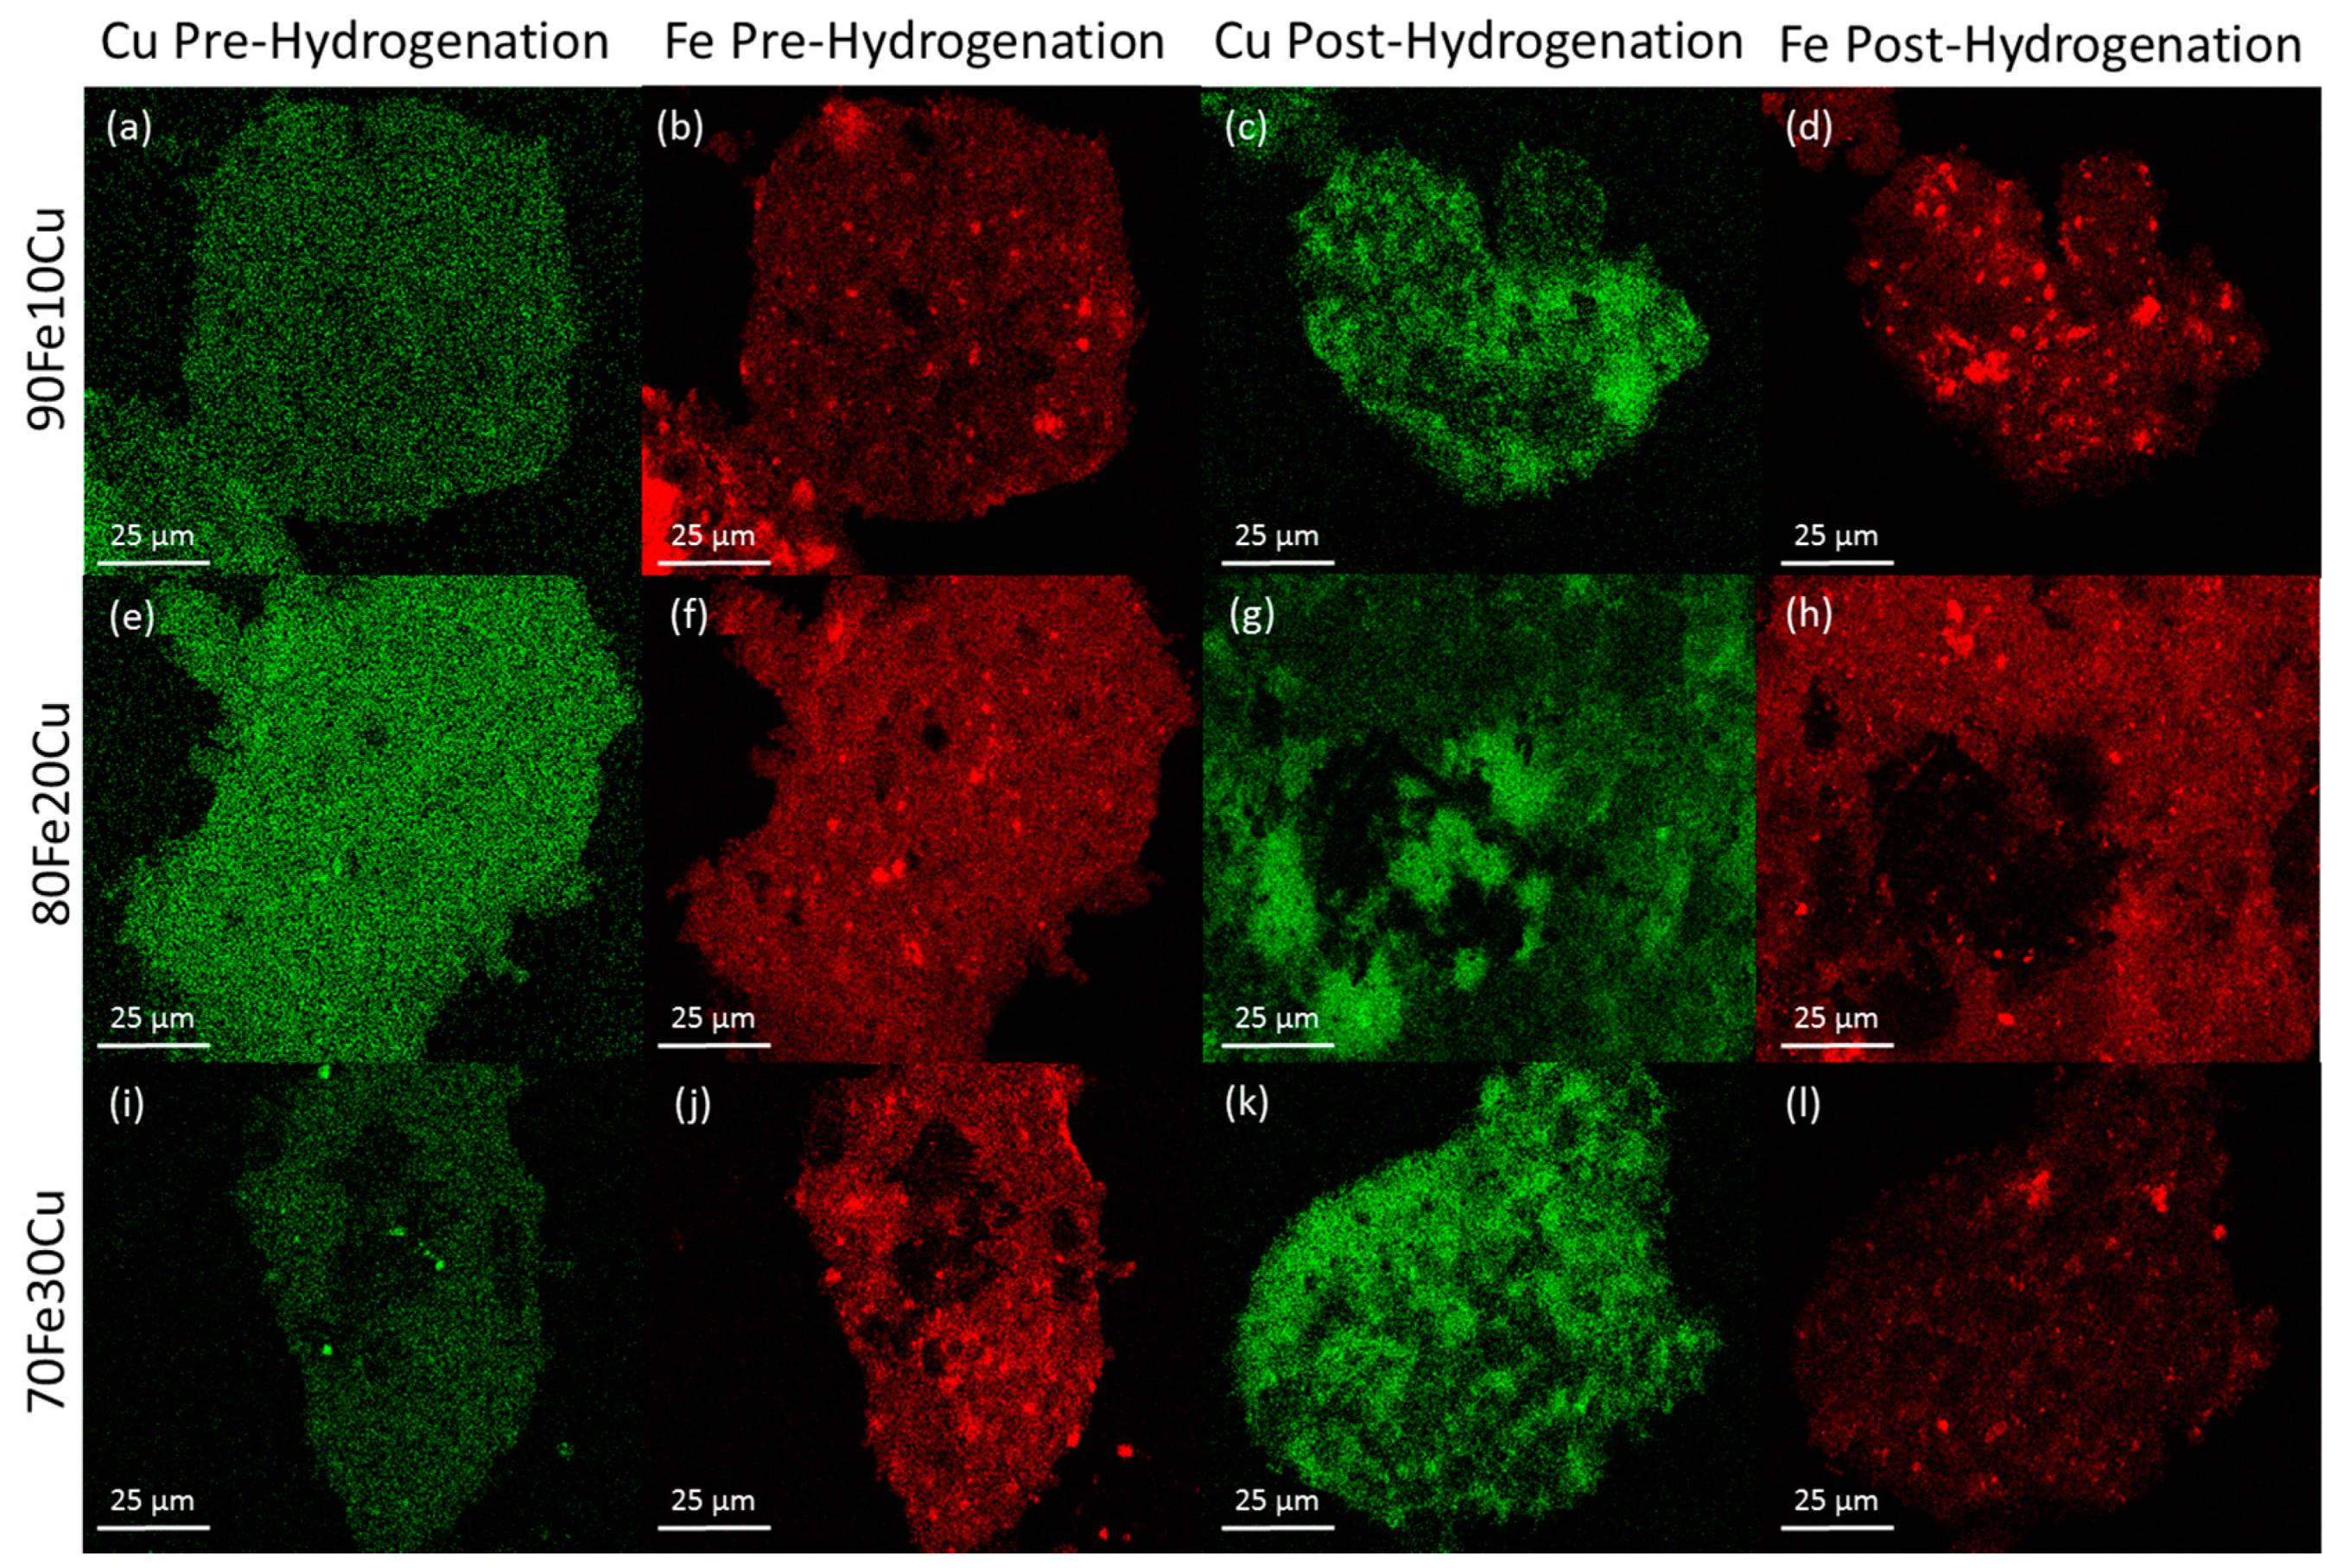
The morphology of the system was examined by SEM-EDS. The analysis was performed on the catalyst samples both before and after hydrogenation (
Figure 3). All samples observed before hydrogenation showed even distributions of copper and iron across the sample. However, in the post-hydrogenation samples, as the concentration of copper increases, the phase separation becomes evident. The 90Fe10Cu/K post-hydrogenation sample still shows an evenly distributed amount of Fe and Cu across the particle, with some copper-rich and iron-rich areas. The 80Fe20Cu/K post-hydrogenation sample shows the appearance of large copper-rich areas where almost no iron can be found. As the samples reach peak copper concentration in the 70Fe30Cu/K catalyst, we again see an even distribution of copper, but the copper signal is much stronger than that of the iron sample, implying that there is much more copper at the surface of the particle than there is iron. The most likely explanation of this would be a copper-rich layer coating the iron oxide bulk. This observation along with the XRD results is likely due to the immiscibility between metallic iron and metallic copper. It is hypothesized that copper is only miscible in the Fe
3O
4 inverse spinel phase to around 10%, and then begins to migrate out of the lattice under the conditions of CO
2 hydrogenation [
34,
36]. Once on the surface, it would be much easier to reduce the individual copper atoms and metallic copper would form. Once enough metallic copper forms (around the 30% mark), it would begin to coat the surface entirely, suppressing the EDS signal for iron.
3.2. Computational Modeling
A three-dimensional, non-isothermal, fixed-bed reactor model was developed by solving energy and convective-diffusion equations, which are coupled with Navier–Stokes equations for gas flow in a porous media, using a multiphysics modeling software, (COMSOL Inc., Burlington, VT, USA). The catalyst bed consists of particles, which are represented by a sub-grid model (Reactive Pellet Model) available in COMSOL. The sub-grid model describes the diffusion and reactions occurring inside a particle. The Millington–Quirk model is used to calculate the diffusivities of species inside a particle as functions of particle porosity. The surface area (22 m
2/g) and pore volume (0.1638 mL/g) were determined via BET analysis. The species concentrations outside the particles (within the catalyst bed) are influenced by the chemical reactions occurring inside the particles. The sub-grid model was coupled to the fixed-bed model through a boundary condition that exchanges mass between gas outside the particle at a given location in the bed and inside the particle volume.
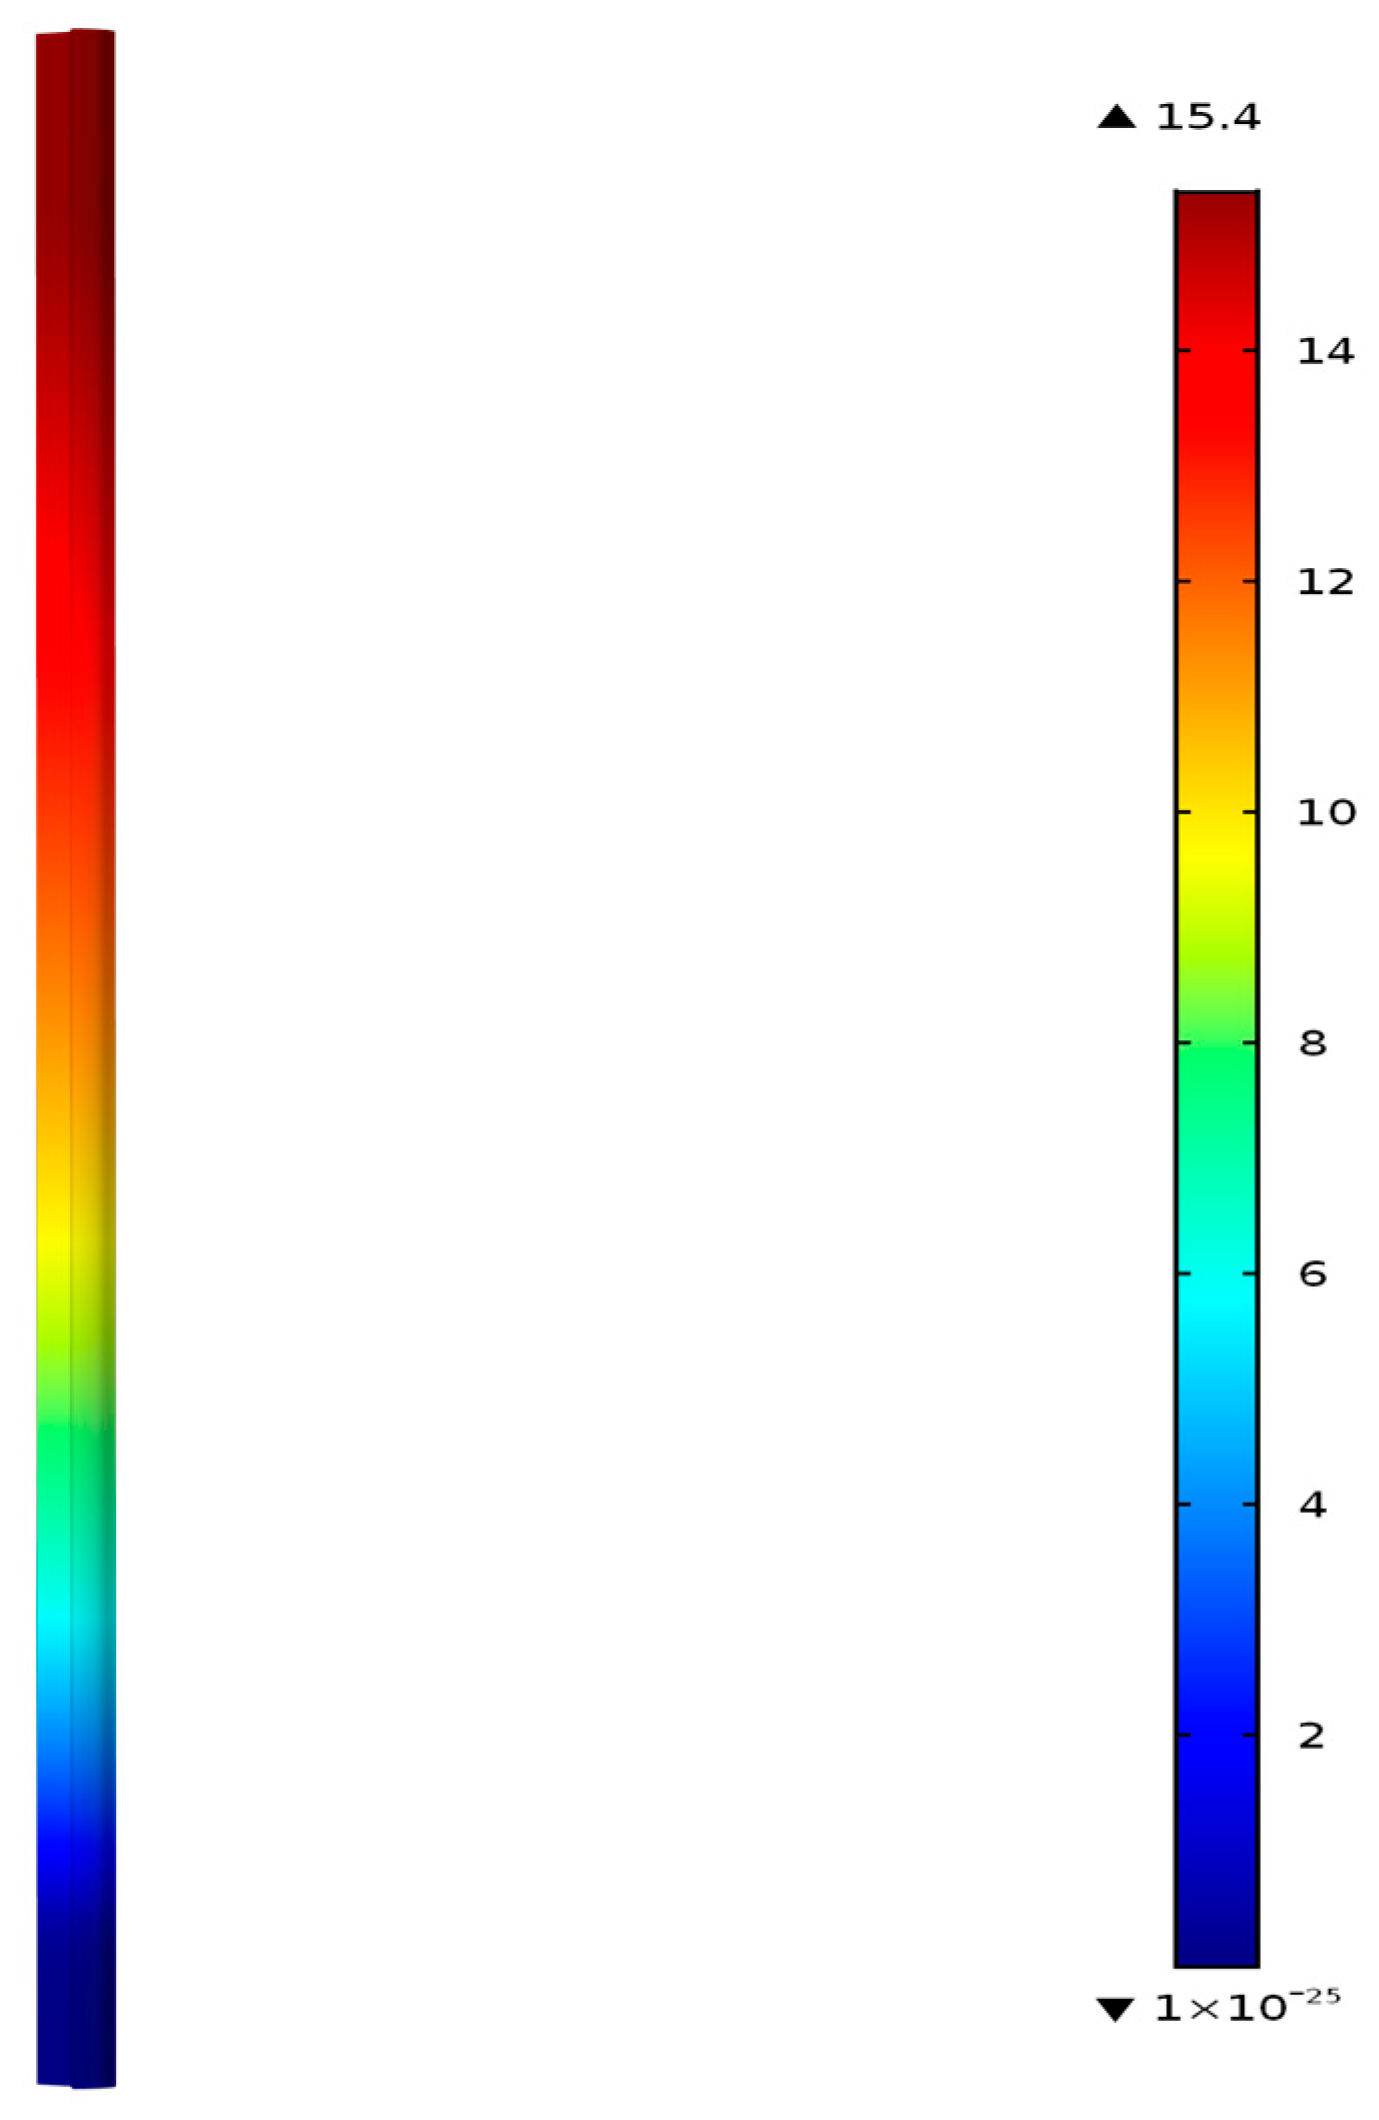
Figure 4 shows the fixed-bed reactor geometry and the contours of C
3H
6 concentration in mol/m
3 at 300 °C predicted by the model. The model considers only the rate controlling steps, and includes the formation of propene and methane, where the propene represents all the saturated and unsaturated hydrocarbon species (C2–C5+) measured in the experiments following Riedel et al. [
30]. The thermodynamic and transport properties of each species are calculated using the CHEMKIN database as functions of temperature and composition. The mixture properties are calculated from the species properties based on local composition. The reactor is identical to the one employed in the experiments, which is a 0.0094 m inner diameter tube of 0.305 m length. It has inlet and outlet sections (0.0254 m each) and a middle section, which is filled with 20 g catalyst containing (FeCu)/K/Aumina 16M:12K:100Al
2O
3 by weight. In calculating the gas hourly space velocity (GHSV), only the total metal weight, mcat, 2.19 g was used.
Figure 4 shows zero C
3H
6 concentration near the entrance of the catalyst bed, and the concentration increases from the inlet to the outlet of the reactor as the FT reactions forming the hydrocarbons continue to occur along the entire bed.
The steady-state, three-dimensional, convective-diffusion equations are given by
where
Dj is the diffusion coefficient of species j in hydrogen, which is the dominant species in the gas mixture. Hydrogen is chosen to represent the mixture for calculating pseudo-binary diffusion coefficients.
Cj is the concentration of species
j. Equation (1) describes the mass transport occurring within the interstitial space of the fixed-bed reactor. Equation (1) does not include diffusion and chemical reactions occurring inside a particle, which will be considered in a sub-grid model. The velocity vector, u, is obtained by solving the Navier–Stokes equations, which are given by
and
where
ρ,
μ, and
p are the density, dynamic viscosity, and pressure of the gas mixture, respectively.
I is the identity vector, and the superscript “
T” represents transpose. Equations (1)–(3) are applied for the entire reactor, including the inlet and outlet sections, where a free flow of gases occurs. For the fixed-bed in the middle section of the reactor, the momentum equation (Darcy–Brinkman) for the porous media is given by
Here, εp and K are the porosity and isotropic permeability of the fixed-bed, respectively. The gases flow within the interstitial volume of the bed. The porosity of the bed, εp, was set at 0.51, and the permeability, K, was set at 5 × 10⁻¹² m2. The porosity was calculated from Equation (5), where ρsupport (2260.0 kg/m3) and ρbed (1105 kg/m3) are the bulk density of the alumina support and the density of the catalyst bed, respectively. The density, ρbed, of the catalyst bed is given by the mass of the bed (0.02 kg) divided by the volume of the bed, Vreactor (1.81 × 10⁻⁵ m3).
The fixed-bed is assumed to be made of mono-dispersed spherical particles containing metal catalyst and having radius,
rpr (250 μm). An individual particle has a porosity of
εpr, wherein the gases can diffuse but the convective flow within the micro-sized pores of the particle is neglected. The species concentration,
Cj, at a given position within the bed is influenced by the diffusion and chemical reactions occurring inside the particles. A sub-grid model equation describing the species concentration,
Cpr,j, distributions inside the pores of a spherical particle is given by
where
r is the radial distance within a spherical particle and the diffusion coefficients,
Dpr,j, are given by
where the particle porosity is given by
Here, ρsolid (3650 kg/m3) is the solid material density of alumina and is higher than the bulk density, ρsupport, of the particles. The particle porosity, εpr, is calculated to be 0.38, which when divided by ρsupport gives a pore volume of 0.1681 mL/g. The calculated pore volume of 0.1681 mL/g is close to the measured BET value of 0.1638 mL/g.
The gases enter the reactor at ambient temperature and get heated because the reactor walls are maintained at a constant temperature
Tw. The energy equation describes the temperature,
T, distribution inside the fixed-bed reactor, and is given by
where
the heat flux,
q, is
the effective thermal conductivity is
the total porosity of the bed is
where the thermal conductivity,
ksolid, and specific heat,
Cp,solid, of the solid support material are 18 W/mK and 880 J/kg·K, respectively. The enthalpies of species,
hj, are obtained from the CHEMKIN database. The ideal gas law was also used. The flow rates and composition of reactants at the inlet and the pressure at the outlet were specified as boundary conditions.
The reaction rates,
Rpr,j, are given by
where the kinetic constants are given by
The gas hourly space velocity, GHSV, is given by
In this study, GHSV is defined by Equation (24), where
Ftotal is the sum of the hydrogen and CO
2 volumetric flow rates entering the reactor at standard conditions. Here,
mcat is the weight (2.19 g) of the total elemental metal content in the catalyst without the support material.
Vreactor is the volume of the middle section of the reactor containing the fixed catalyst bed, and
T is its temperature.
Rg is the gas constant. The species concentrations are represented by H
2, CO
2, CO, H
2O, C
3H
6, and CH
4. Propene is used as the representative species for all the hydrocarbons (C2–C5+) produced in the experiments with the exception of CH
4, following the work of Riedel et al. [
31]. The values for the kinetic parameters used in the model are provided in
Table 5.
The CO, CH4, and C2–C5+ yields and selectivities are defined based on atomic carbon rather than on a molar basis. For example, the molar concentration of propene is multiplied by three in calculating its yield and selectivity because it contains three atomic carbons. As usual, CO2 conversion is the reacted CO2 as a percent of CO2 in the feed stream, and product selectivity is calculated as a percent of reacted CO2. Multiplying the conversion with the selectivity of the product gives the yield.
The transient model Equations (1)–(24) are solved for 1000 s until steady-state solutions are achieved.
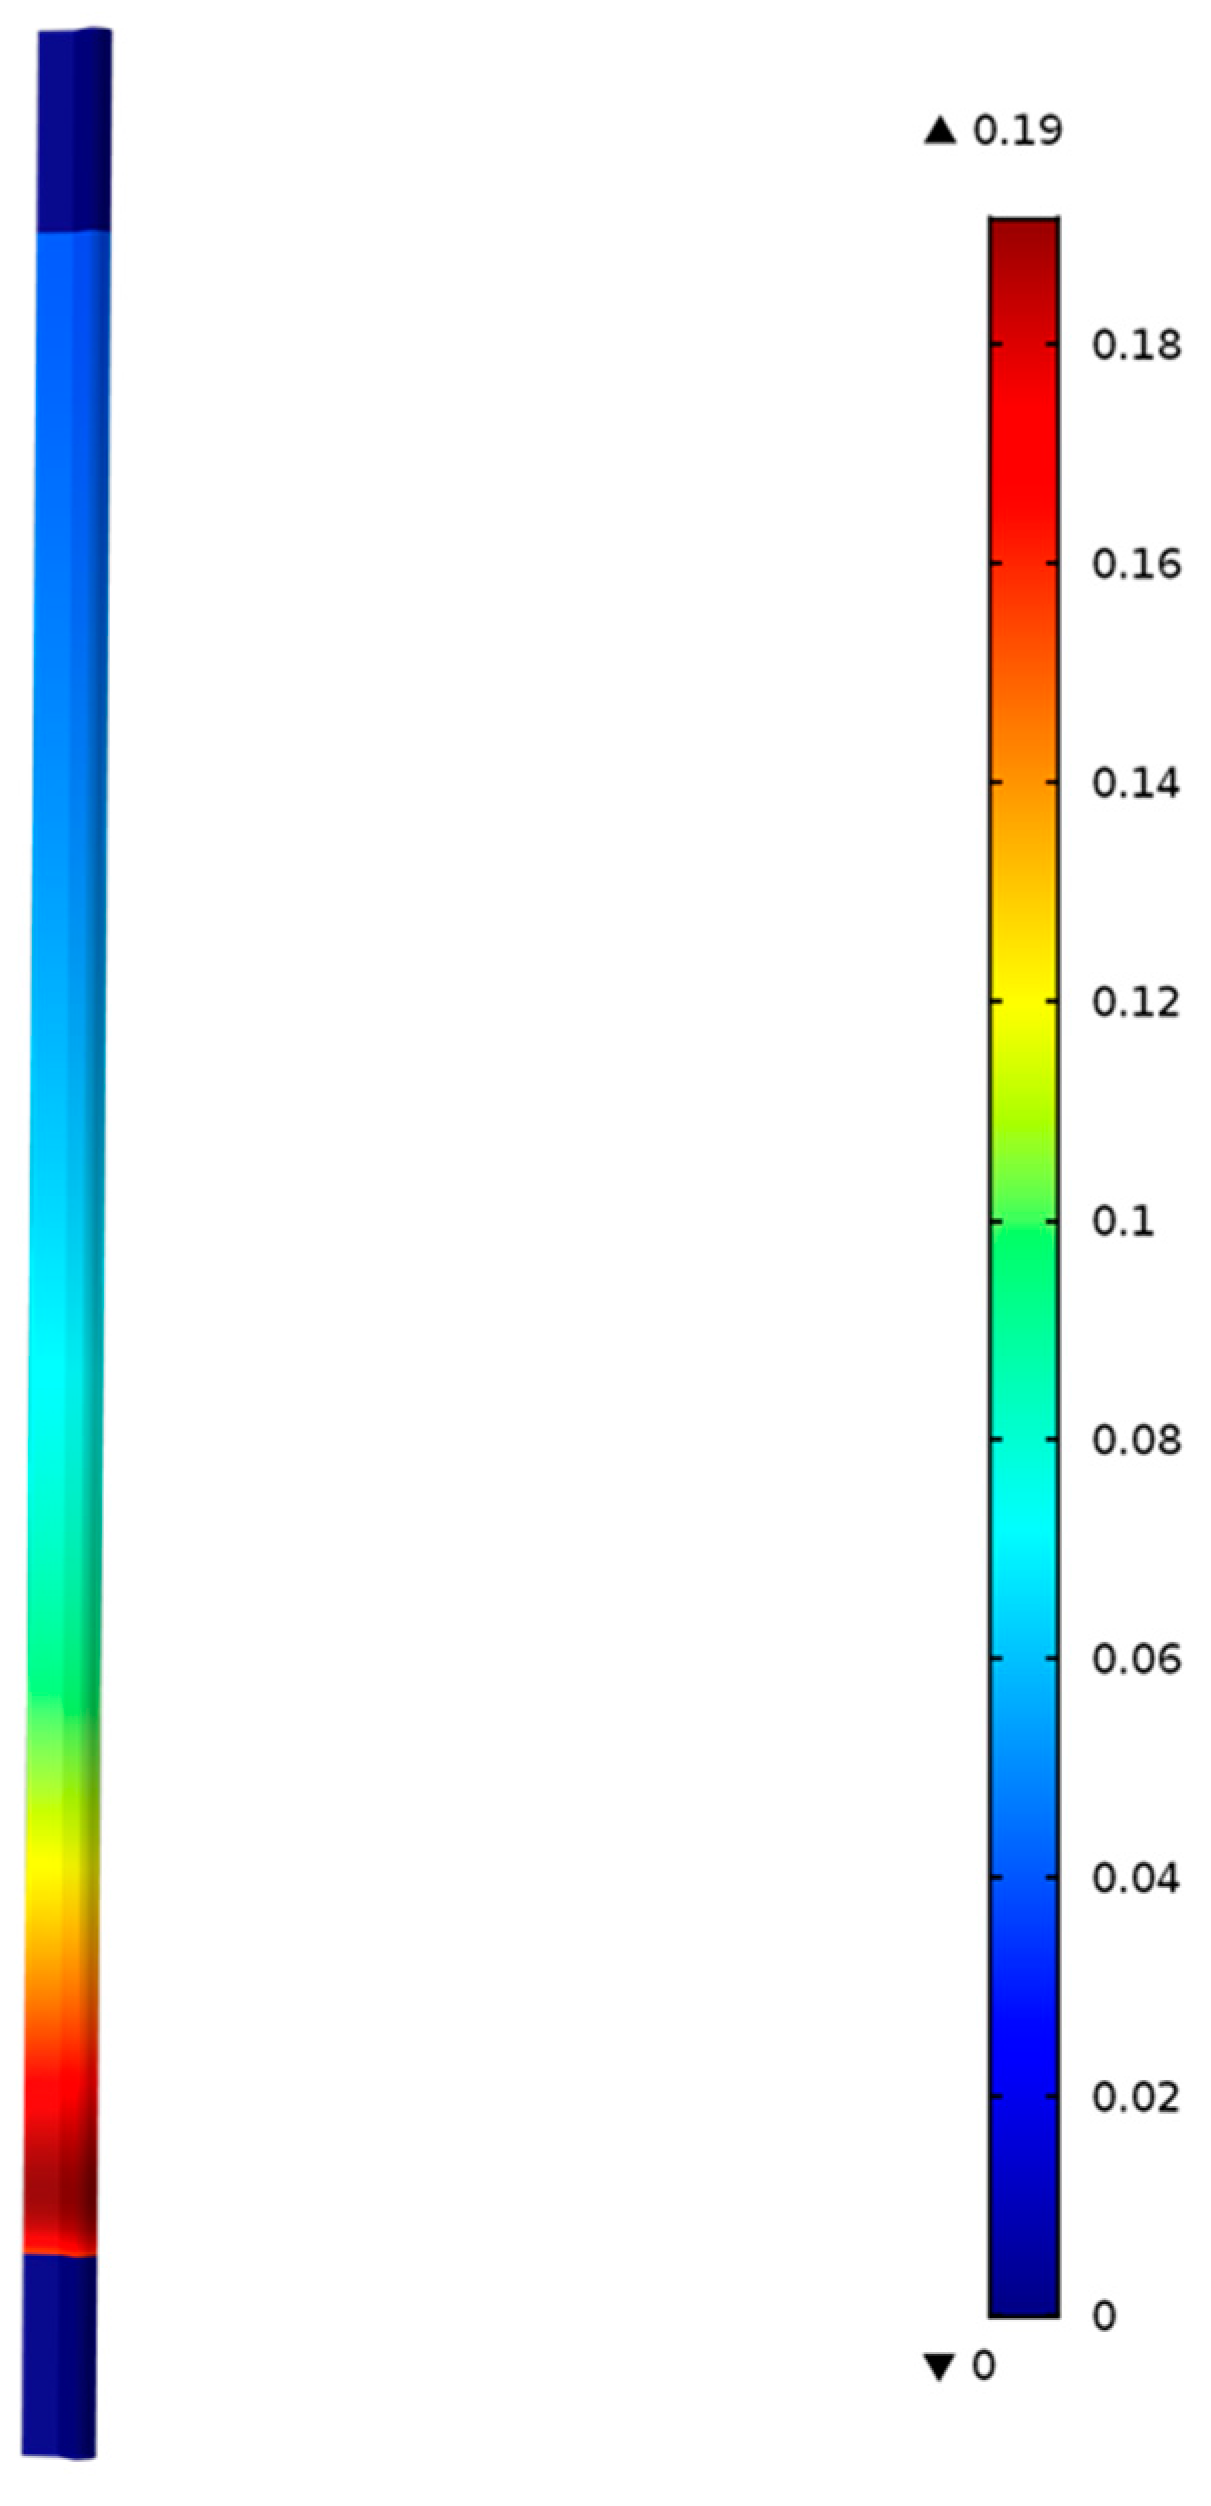
Figure 5 shows the model predictions for the contours of propene concentration in the fixed-bed reactor for the reactor conditions, reactant flows (GHSV), and catalyst compositions used in the experiments as discussed in the previous section.
Figure 5 shows the predicted contours of C
3H
6 formation rate (<0.19 mol/(m
3 s)) due to the hydrogentaion reactions, and it shows a decreasing rate with distance along the reactor length, unlike the C
3H
6 concentration contours shown in
Figure 4, which exhibit the opposite trend as one might expect.
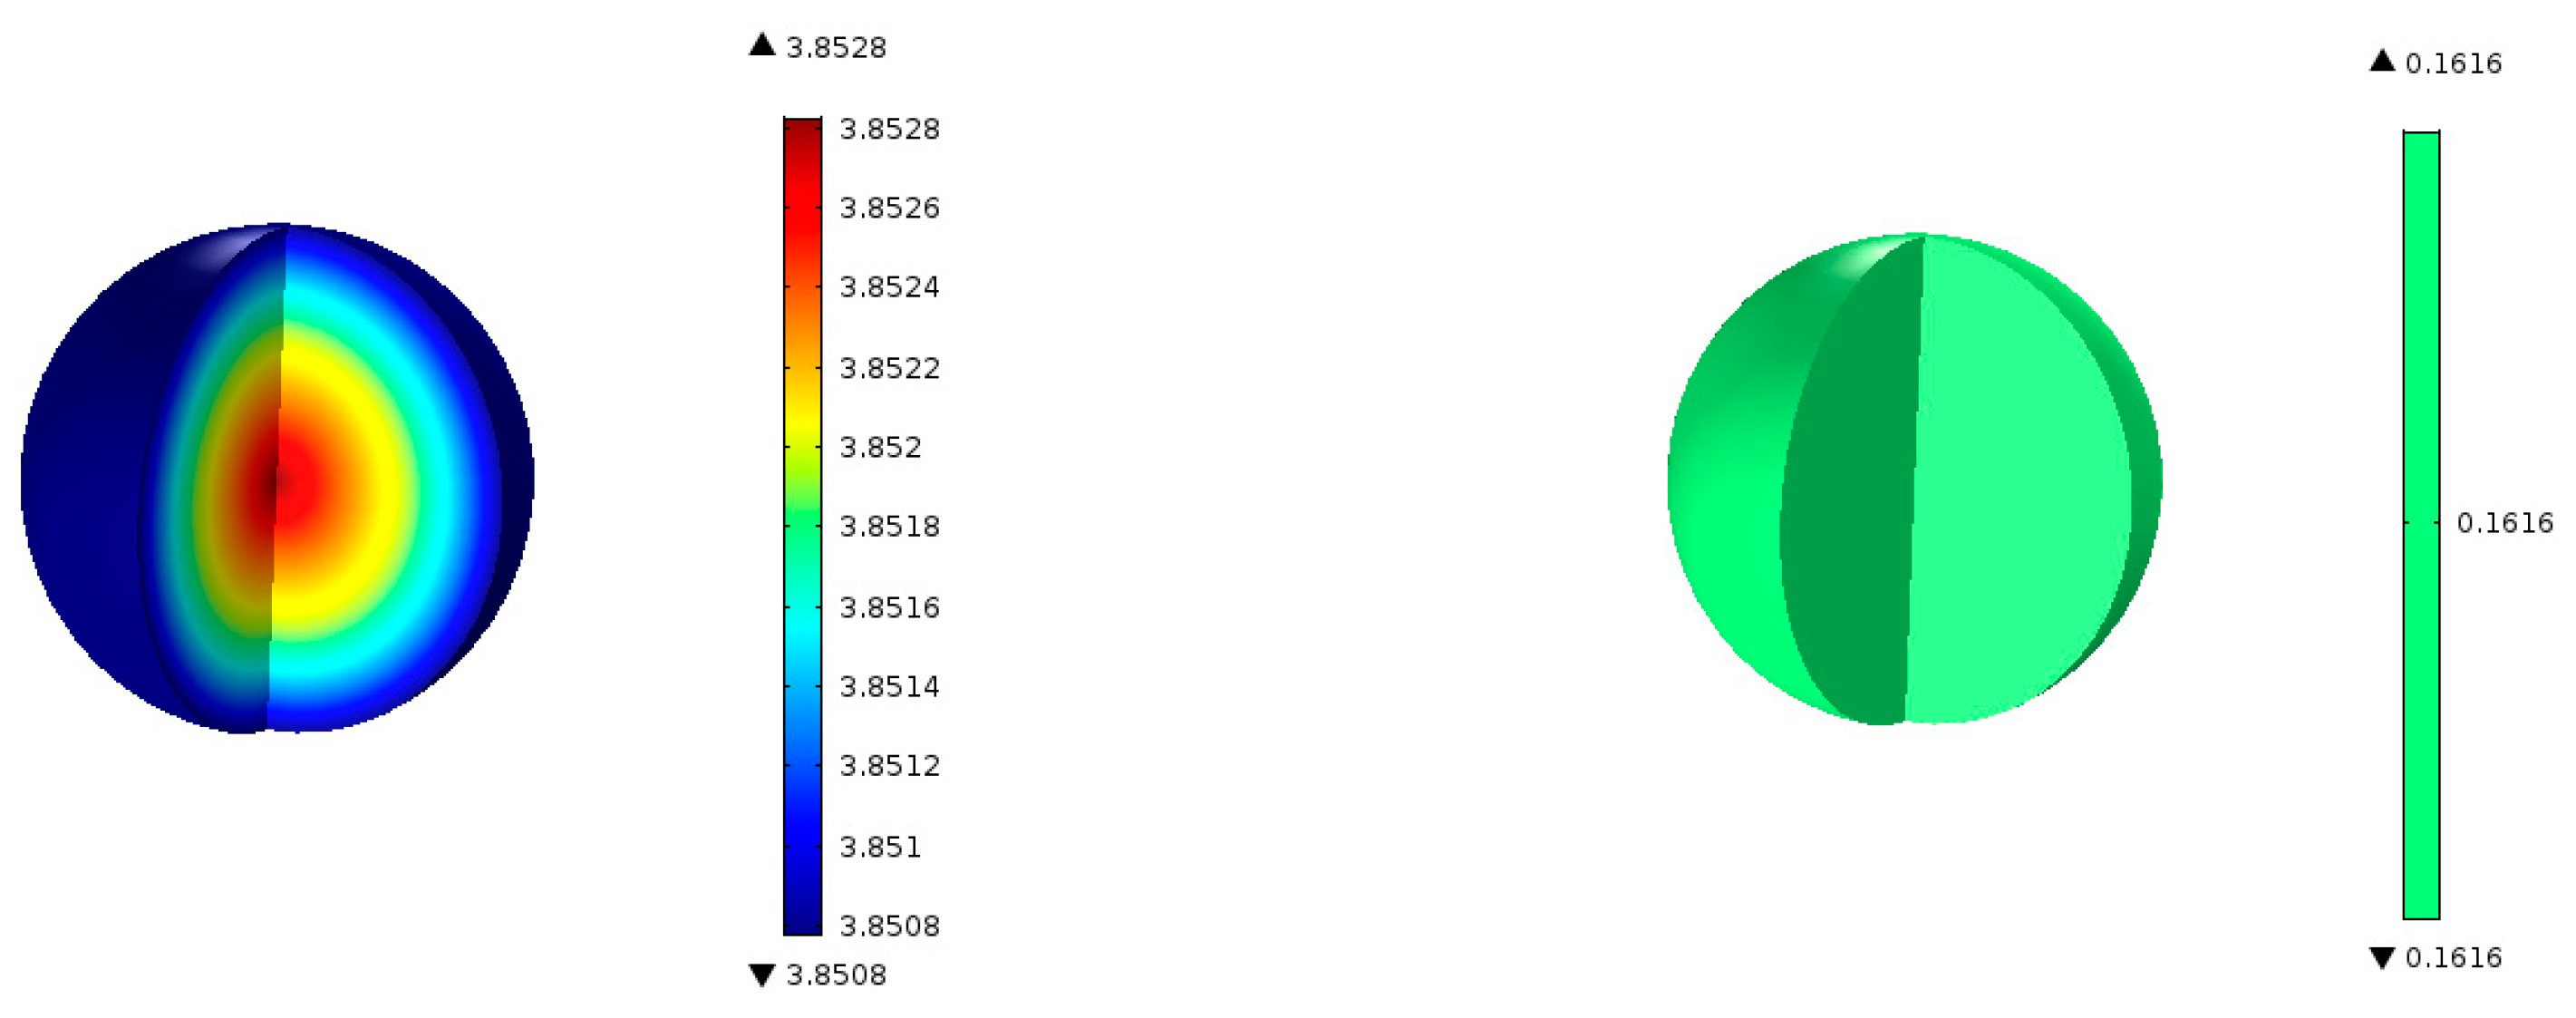
Figure 6 shows the predicted contours of C
3H
6 concentration and the rate of formation within a single catalyst pellet at 5 cm from the entrance of the reactor. The C
3H
6 concentration changes only very slightly across the radius of the spherical pellet because of a relatively fast diffusion of the gaseous species in and out of the pellet. The C
3H
6 formation rate predicted by the model is uniform across the pellet. We performed simulations for different particle sizes, and found that the uniform profiles for C
3H
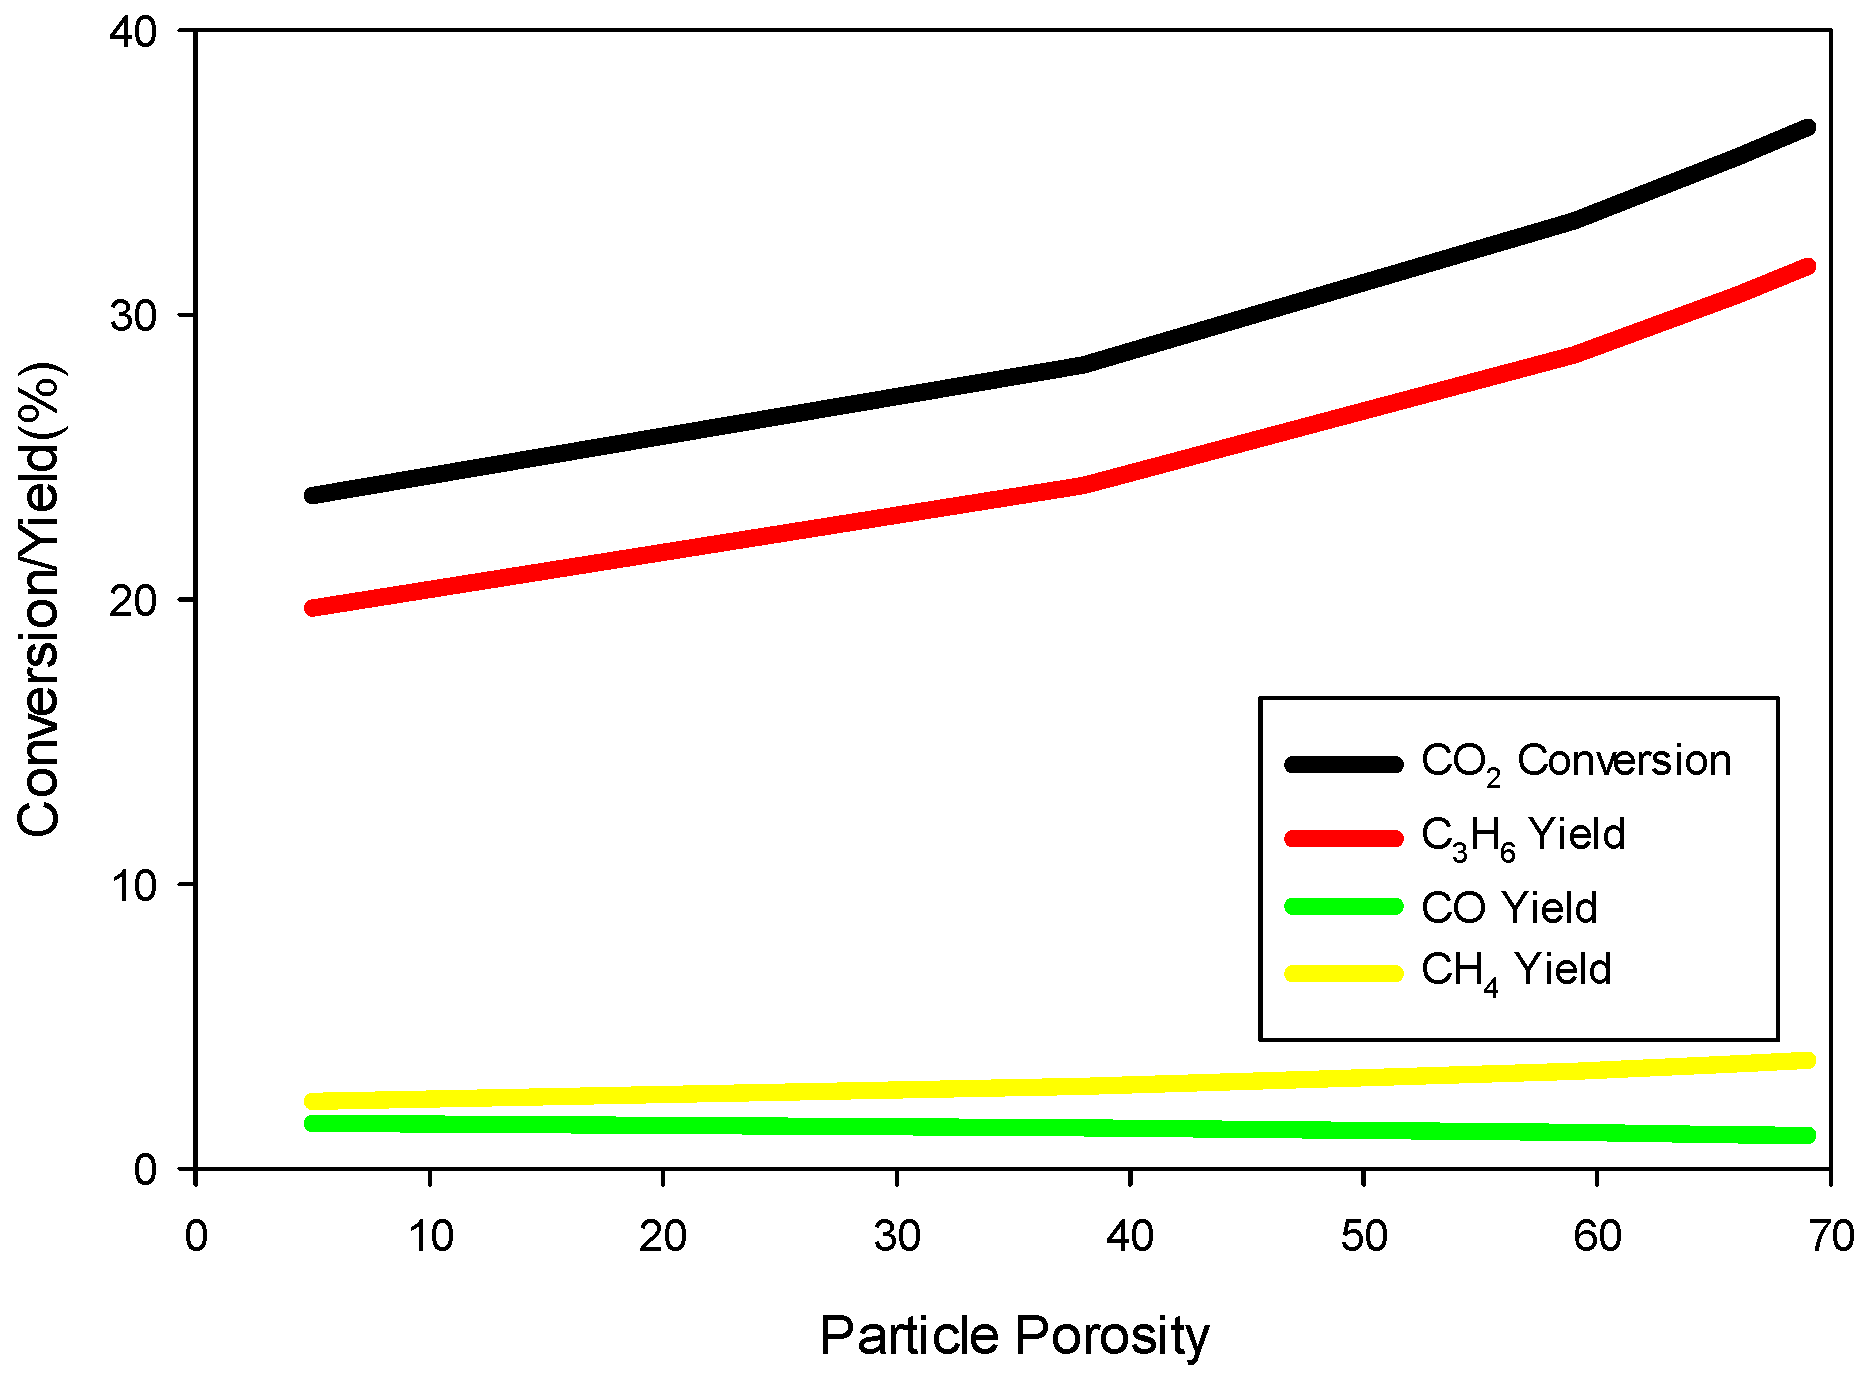
6 hold for particle sizes up to 1 cm in diameter. So, it is clear that the model predictions are not very sensitive to the particle size. However, conversion and yields are sensitive to particle porosity despite fast diffusion within a particle. We increased the particle porosity with a total porosity (
) fixed at 69.7% and a fixed catalyst loading such that the bed porosity decreases correspondingly. As the particle porosity is increased, more surface area becomes available for chemical reactions, affecting the conversion and yields as shown in
Figure 7.
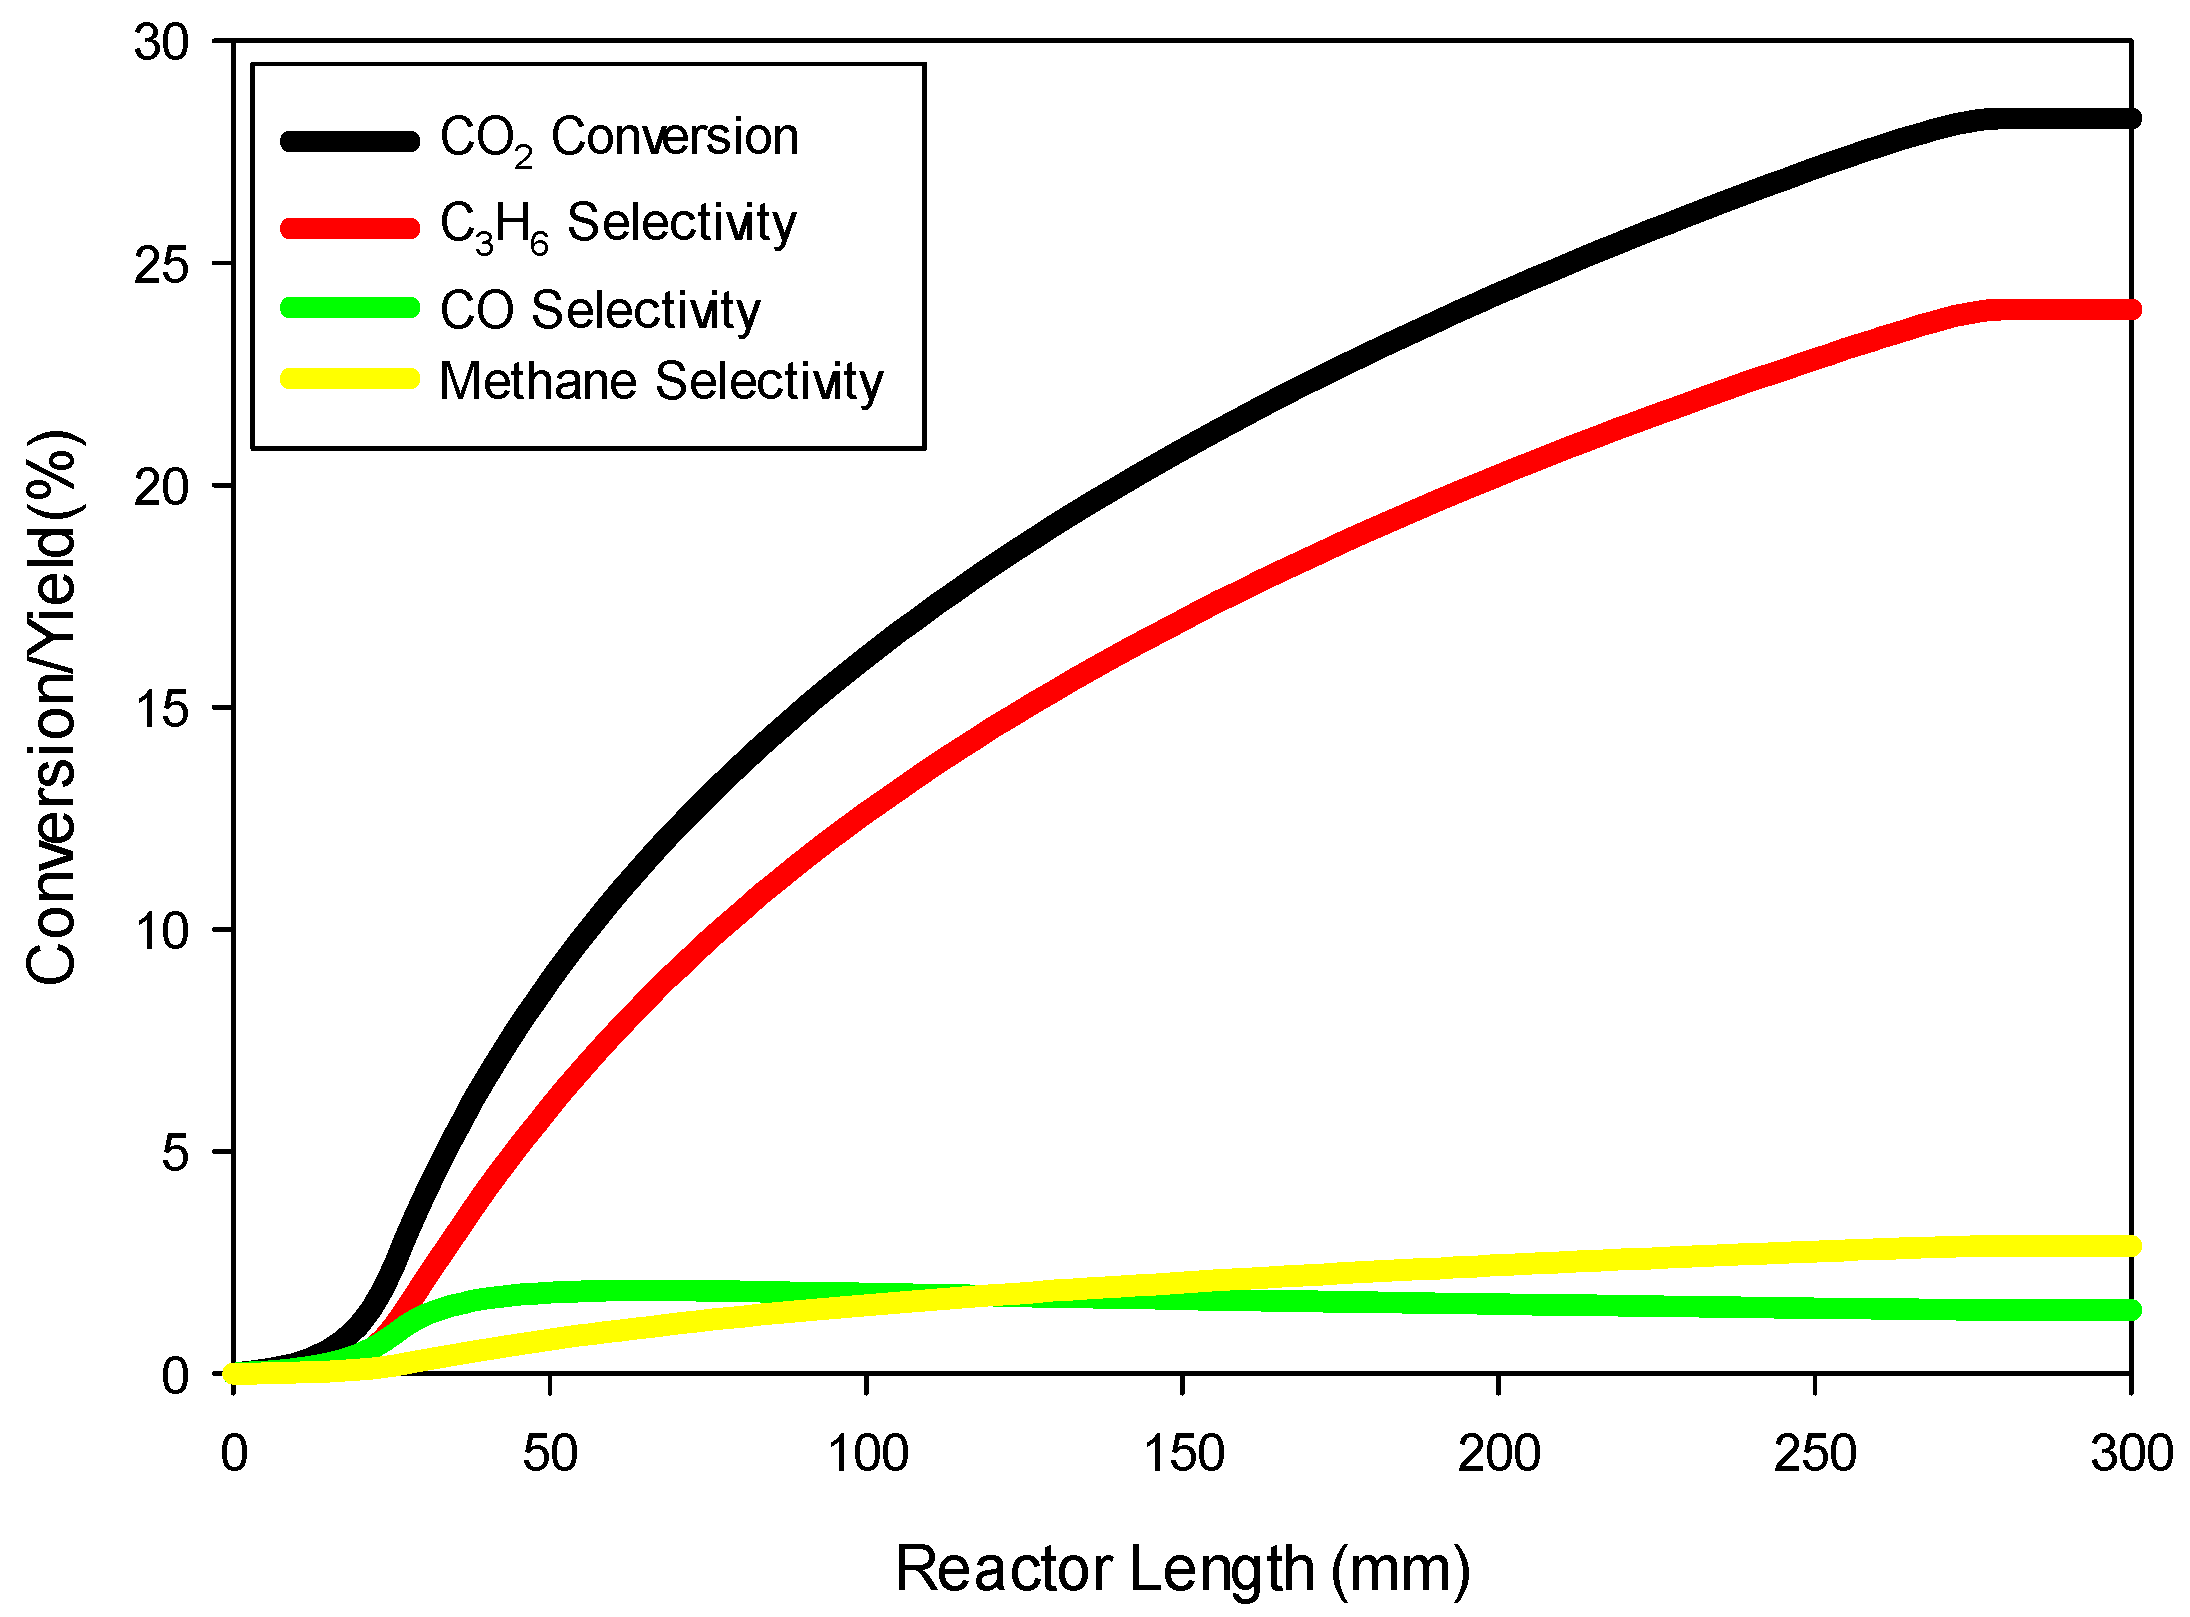
Figure 8 shows the profiles of conversion and product yields along the length of the reactor for the 20Cu/80Fe/K catalyst bed. Our simulations show that the species concentrations inside catalyst pellets also follow almost identical profiles, as shown in
Figure 8, because of negligible gradients across the catalyst pellet.
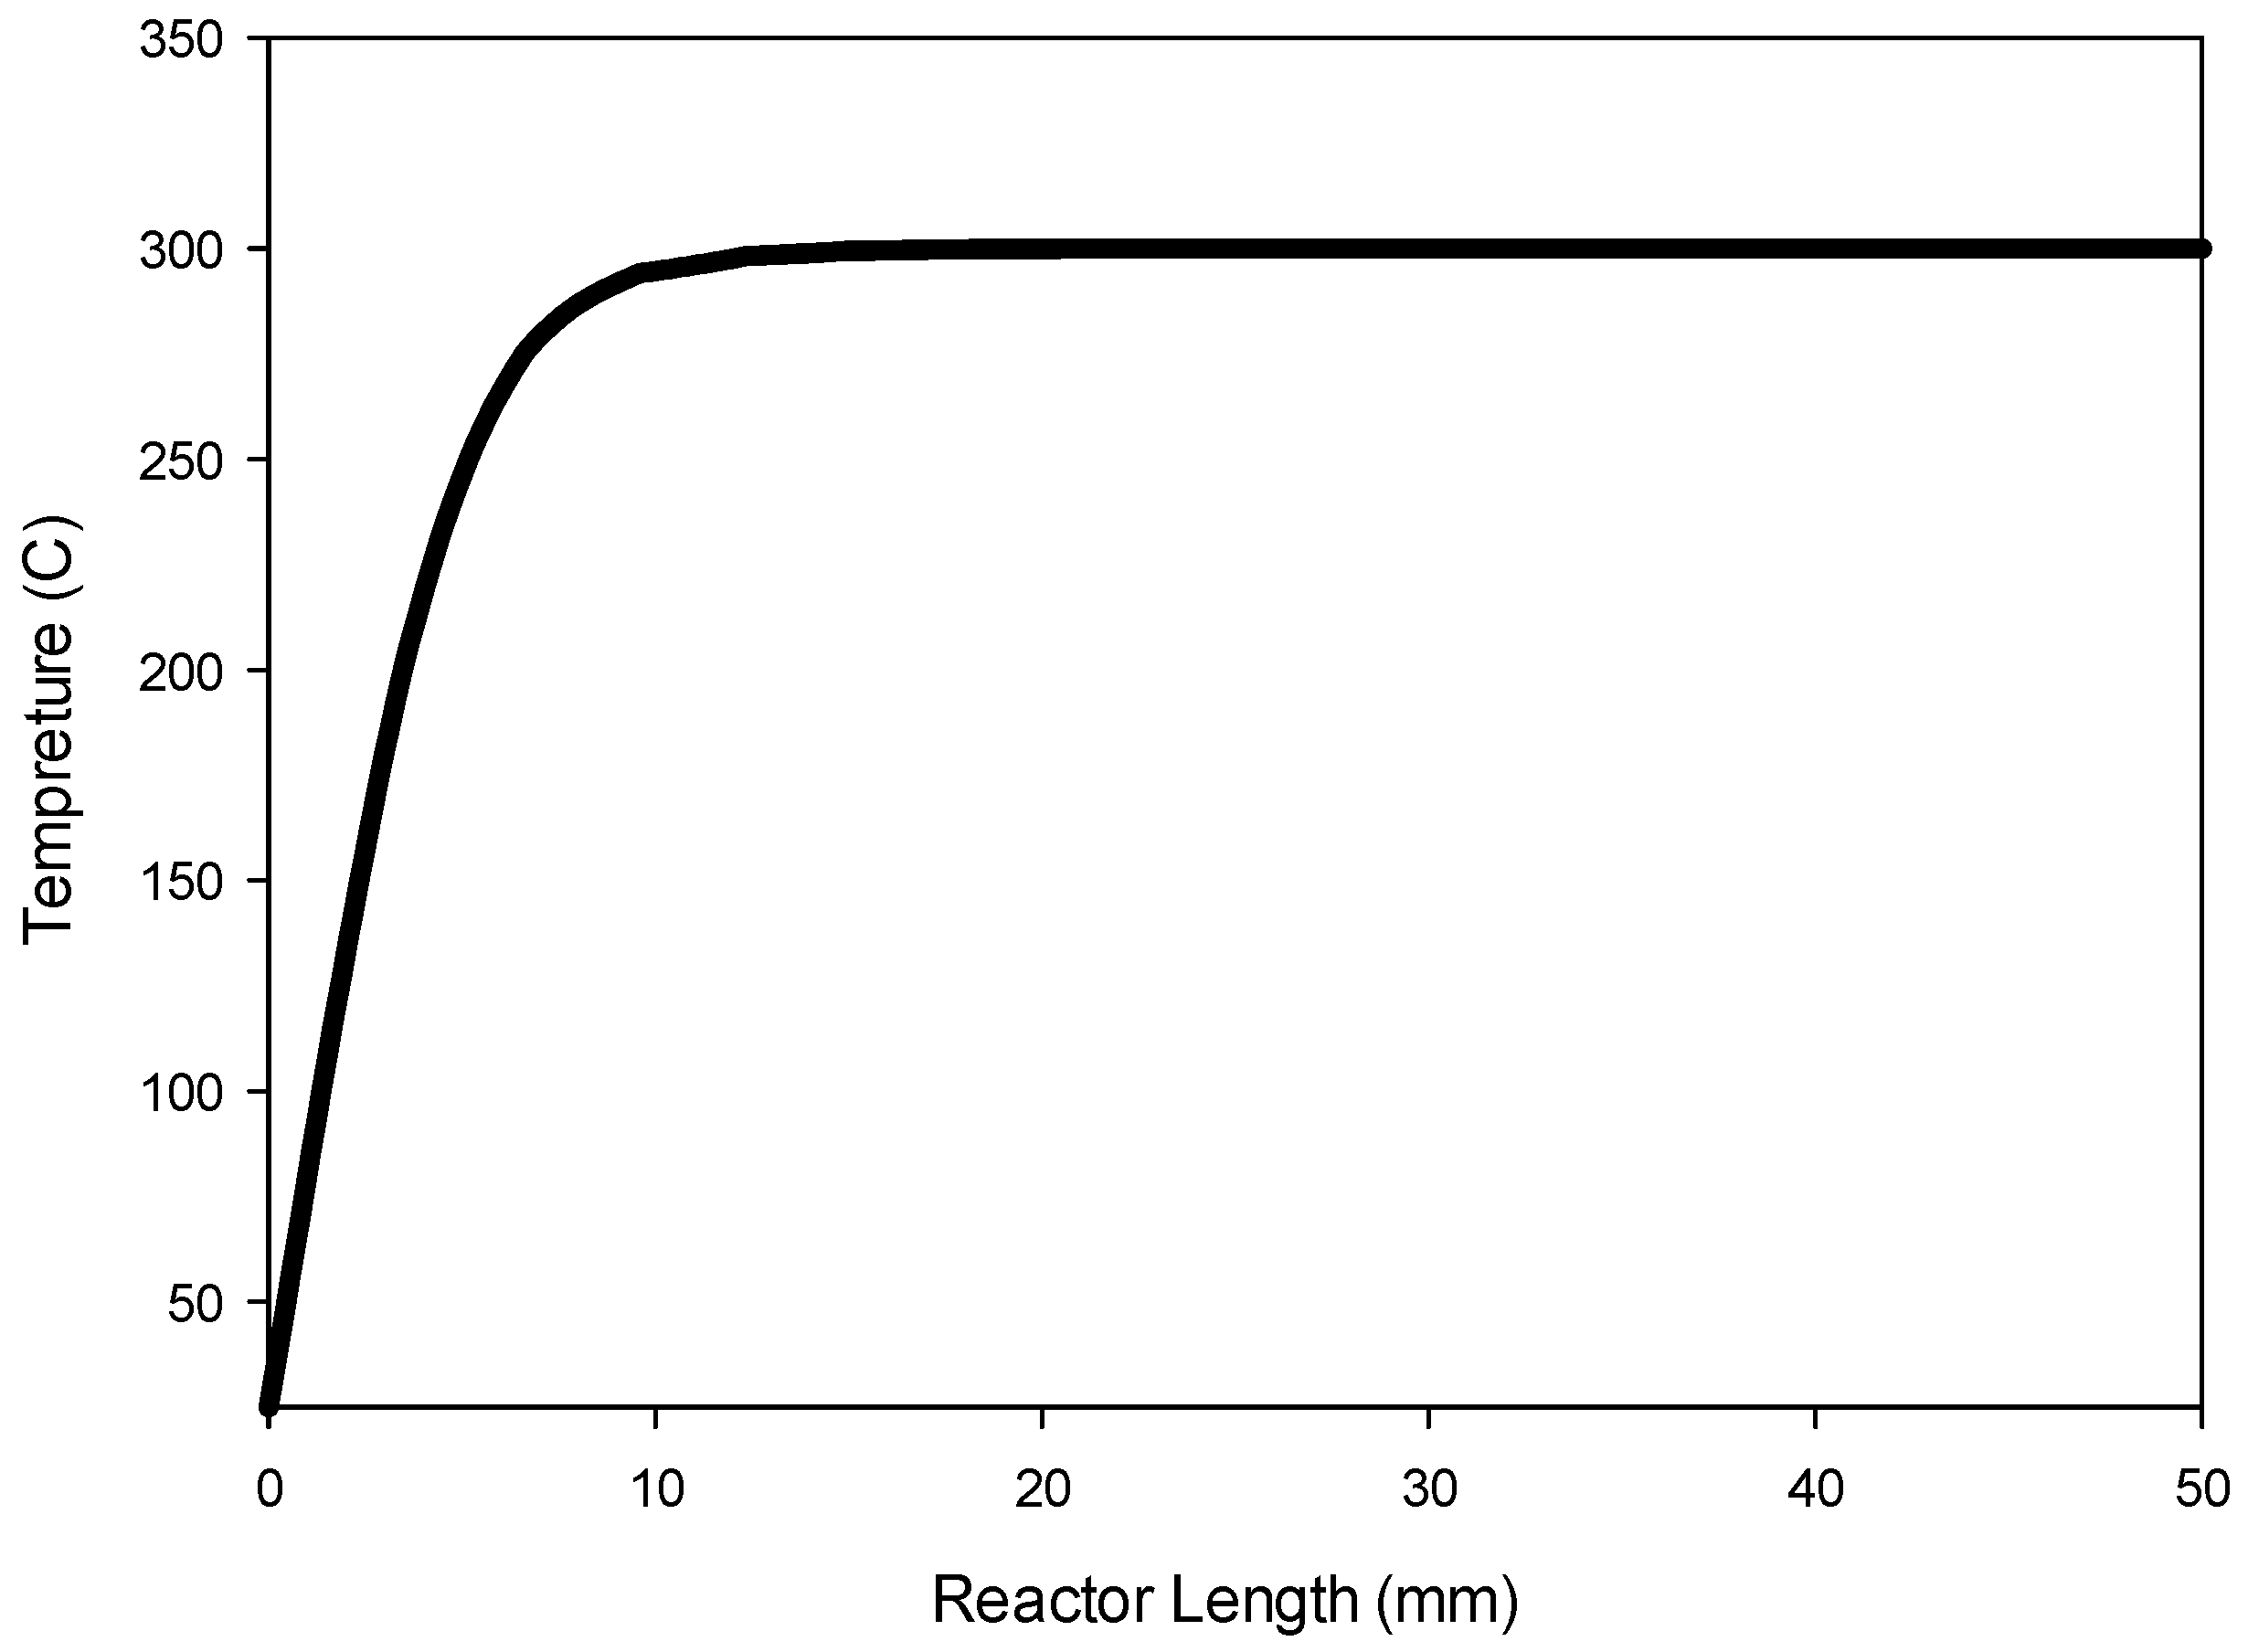
Figure 9 shows the temperature profile along the center line of the reactor.
Figure 9 indicates that the radial heat transfer is fast enough that the gases are heated very quickly from ambient temperature to the reactor wall temperature prior to entering the catalyst bed.
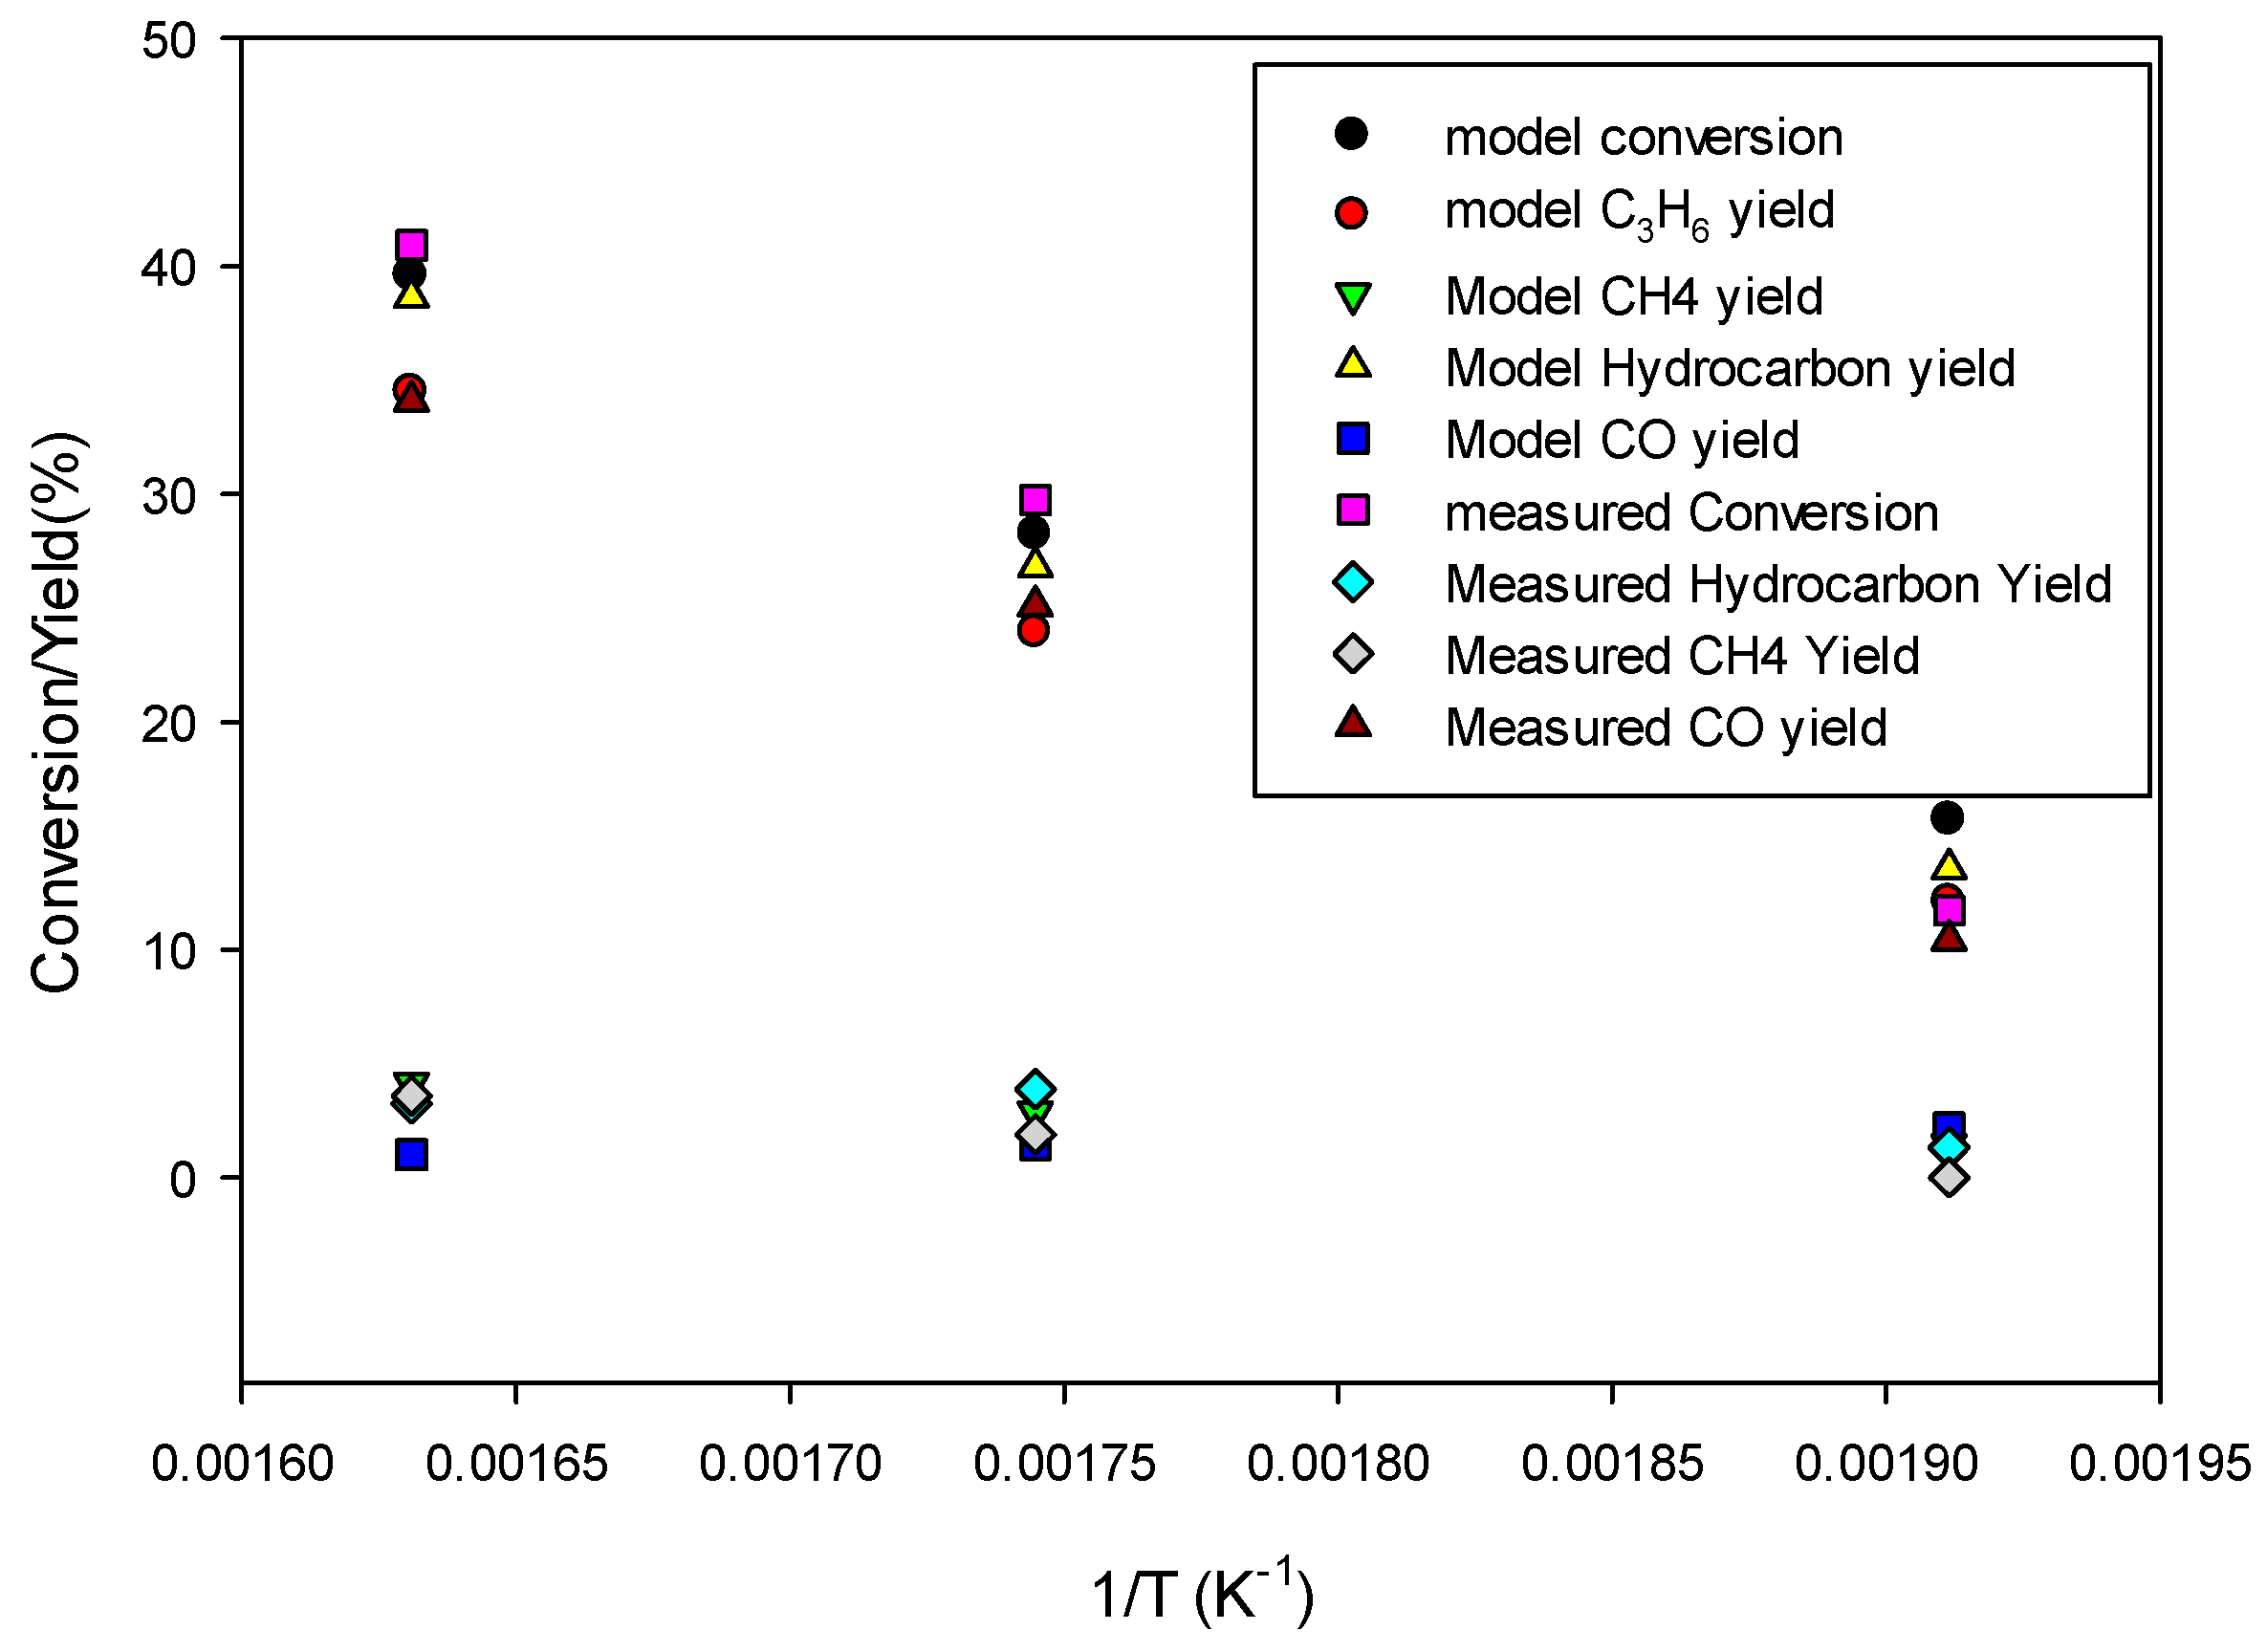
Figure 10 shows the model predictions for conversion and product yields as functions of inverse temperature along with the experimental data. The data at very low temperature, 523.15 K, was found to be too low due to loss of activity of the catalyst. Therefore, the model predictions are fitted with straight lines only for the data at higher temperatures (573.15 K and 613.15 K) for determining the kinetic parameters for the 80Fe20Cu/K catalyst.
Figure 8 shows significantly higher conversion and yields than in the case without copper present in the catalyst, indicating a larger pre-exponential factor kFT
0 and kFTs
0. The kinetic parameters derived by fitting the model predictions (especially C
3H
6 and CH
4 species) to the experimental data shown in
Figure 10 are given in
Table 4. The FT reaction activation energy was found to be 72 kJ/mol, the same as for the catalyst without copper present (
Table 6). The rate constants kFT
0 and kFTs
0 for forming C
3H
6 and CH
4 are 5 and 1.5 times higher, respectively, than for the catalyst without copper (
Table 6). So, the presence of copper has a significant effect on FT.


