1. Introduction
The World Health Organization (WHO) has indicated that the world’s population living with obesity has doubled to 13% since the 1980s, affecting more than 600 million adults and 42 million children under the age of 5 years in 2014 [
1]. This indicates that obesity has become a global epidemic that is growing at an alarming rate. As a risk factor to metabolic syndrome, obesity results in high mortalities both in children and adults, and continues to reduce life expectancies of individuals across the globe [
2]. Metabolic syndrome occurs when there is a disruption of metabolic functions in which essential substances such as hormones, enzymes, proteins, or genes are expressed or produced in low or high concentrations in the body causing the metabolic network to fail [
3,
4]. This means that metabolic syndrome occurs when there are abnormalities in the metabolic system. Initially, interventions in lifestyle including adopting a healthy diet, increasing physical activity and weight loss were recommended as the most effective mitigation of obesity and metabolic syndrome [
5]. However, in some cases, even when individuals manage to lose weight, they still continue to suffer from metabolic syndrome. Obesity is the sixth most lethal risk factor contributing to a number of metabolic diseases [
1,
6]. Obesity is a complicated condition which is not easy to mitigate, as it is not only caused by excess food intake and comparatively less energy expenditure, but complex metabolic disruptions that are centered on lipid metabolism and cellular signaling systems linked to it [
7].
Pharmacotherapy has been recommended as an effective way to counter metabolic syndrome associated with obesity [
5]. However, it has been reported that most pharmacological anti-obesity drugs which also tend to be expensive, have side effects such as altering blood pressure, headaches, dizziness and other unbearable collateral effects that adversely affect the quality of life [
2]. There is a growing need for less costly, effective anti-obesity agents that have minimal collateral effects. Phytochemicals are increasingly being explored for their therapeutic potential. An example of such is oleanolic acid (3β-hydroxy-olean-12-en-28-oic acid), which is a natural, bioactive phytochemical component found in several plant foods and medicinal herbs [
8,
9]. It is a pentacyclic triterpenoid that is found in abundance in plants of the Oleaceae family such as the olive plant and also occurs in nature as a free acid or as an aglycone of triterpenoid saponins [
10]. It is biosynthesized by the acetate/mevalonate pathway and (3S)-2,3-oxidosqualene cyclization [
8].
Metformin is a widely used pharmaceutical drug for treating components of metabolic syndrome, and was discovered five decades ago [
11]. It is an orally administered anti-diabetic drug from the biguanide class, which has been proven to reduce plasma insulin, glucose, FFAs and overall body weight in diabetic and obese patients [
12]. Oleanolic acid and metformin exhibit several pharmacological properties such as antioxidant, microbicide, antidiabetic, anti-inflammatory, hypolipidaemic antiatherosclerotic and anti-cancer actions [
8,
9,
11,
13]. The neonatal period is a phase of life with developmental plasticity wherein interventions have long term impacts on the health and disease outcomes of individuals. Hence, the aim of this study was to examine the sub-acute and long term potential protective effects of neonatal oral administration of oleanolic acid and metformin against fructose-induced alterations in the level of lipids (free fatty acids, FFAs) and impaired expression of genes associated with lipid metabolism and glucose transport using a rat model.
3. Discussion
The energy expenditure of the body in the skeletal muscles requires glucose and lipid uptake, performs thermogenic functions and other biochemical processes in the body [
14]. In the long term study of the experiment, the high fructose diet increased lipid storage in the triceps skeletal muscle tissue which had an increased fat deposition due to neonatal metabolic programming. Our findings showed that the rats that were treated with fructose in the neonatal period and later on in adulthood. The HF group gained more weight than rats from the other treatment groups at the end of the study. The excessive weight gain associated with high carbohydrate or fat diets impairs the ability of the body to increase fat oxidation [
15]. Previous studies have shown that fructose causes the deposition of lipids into the skeletal muscles of both rats and humans [
16,
17].
Fructose consumption is known to induce metabolic effects associated with increased fat deposition [
17] as we have confirmed with our experimental rats that were fed with HF, which eventually results in the development of obesity and metabolic syndrome. The rats in the HF group stored more fat as compared to most of the rats from the other groups. The metabolic effects of immoderate adiposity are exerted through the release of free fatty acids into peripheral and other tissues of the body [
15].
In the sub-acute study, our findings showed metformin to be effective in reducing lipid storage in the MET + HF group. Similarly, in the long term (Study 2) experiments, metformin was shown to reduce lipid storage as seen in the group that received neonatal treatment with MET. Metformin treatment has also been found to reduce symptoms associated with obesity and metabolic syndrome in male mice [
9].
Stearic acid was higher in the HF group, which is the group where obesity/metabolic dysfunctions were induced. These suggest that HF promotes accumulation of saturated free fatty acids in the body. As shown in the study, the elevated level of stearic acid could be responsible for the fructose-induced suppression of the
glut-4,
nrf-1,
cpt-1 and
ppary genes. Saturated FFAs directly down-regulate the activity of
glut-4 and
ppary genes [
18]. Moreover, it was previously reported that a high- fructose diet causes suppression of the
glut-4 and
glut-2 gene expressions and this is dependent on both the diet and age at which the diet is administered [
19,
20]. However, in this study there were no differences in the suppression of
glut-4 between neonatal fructose treatments and adulthood fructose administration. We also showed that neonatal fructose consumption resulted in higher terminal body mass (Study 2 only) and saturated lipid accumulation within the skeletal muscle tissues (both studies 1 and 2 of the experiment). The development of long-term health risks such as obesity and diabetes are often a result of diets introduced to offspring during the critical window of developmental plasticity [
21,
22,
23]. As such, administration of fructose in the neonatal period resulted in the development of health outcomes associated with metabolic syndrome in rats that further received dietary fructose as adults.
Stearic acid was the lowest in both OA + HF and MET + HF, suggesting that the OA and MET prevented the fructose induced accumulation of the saturated fatty acid in the body in both studies of the experiment. It has been reported that stearic acid and other long chain saturated FFAs in the high fat diet were responsible for suppression of
glut-4 gene [
19]. Dodecanoic, myristic and palmitic saturated FFAs have also been shown to increase the risk factors of metabolic syndrome [
24]. Polyunsaturated FFAs are important to the body and are acquired through dietary supplements as the body cannot synthesize them. Octadecadienoic acid, which is commonly known as lenoleic acid was a polyunsaturated free fatty acid detected in the samples by the GC-MS. Octadecadienoic acid is a long chain 18-carbon compound polyunsaturated FFA. The levels of oleic acid and octadecadienoic acid (unsaturated FFAs) were high in groups that received either OA and MET alone or a combination of both. In this study, supplementation with OA in the neonatal period promoted the accumulation of monounsaturated fatty acid in the body. Free fatty acids increase fat oxidation and glucose utilization [
8]. Free fatty acids and glycerol are packaged in and transported by albumin from stored fats to be oxidized through major pathways such as the β-oxidation pathway, which also occurs in the mitochondria of skeletal muscles [
25,
26]. Monounsaturated FFAs; palmitoleic acid and oleic acid have also been found to have positive effects on health outcomes associated with metabolic syndrome [
24,
27].
Skeletal muscle tissue is a vital site for major glucose consumption, especially following a meal [
23]. As such, glucose is transported into the tissue through an insulin stimulated facilitated diffusion by glut-4 [
28,
29,
30,
31]. In this study, the administration of both OA and MET in fructose fed rats increased the activity of
glut-4,
cpt-1 and
nrf-1 genes. In order to achieve higher levels of
glut-4 expression within the skeletal muscles; transcription factors such as those belonging to the MEF2 domain, and
ppary and
nrf-1 are required as
glut-4 gene expression is controlled at the transcriptional level [
19].
Ppary controls the expression of
glut-4 transporter in skeletal muscle cells as it binds to MEF2C and activates it [
32]. Higher expressions of the
nrf-1 gene increased the expression of
glut-4 gene, thereby increasing glucose transport capacity into the skeletal muscles [
32]. As such, the high levels of both
nrf-1 and
glut-4 in our study confirms that glucose was being metabolized in the skeletal muscles from groups that had OA, MET, OA + HF and MET + HF in both studies of the experiment.
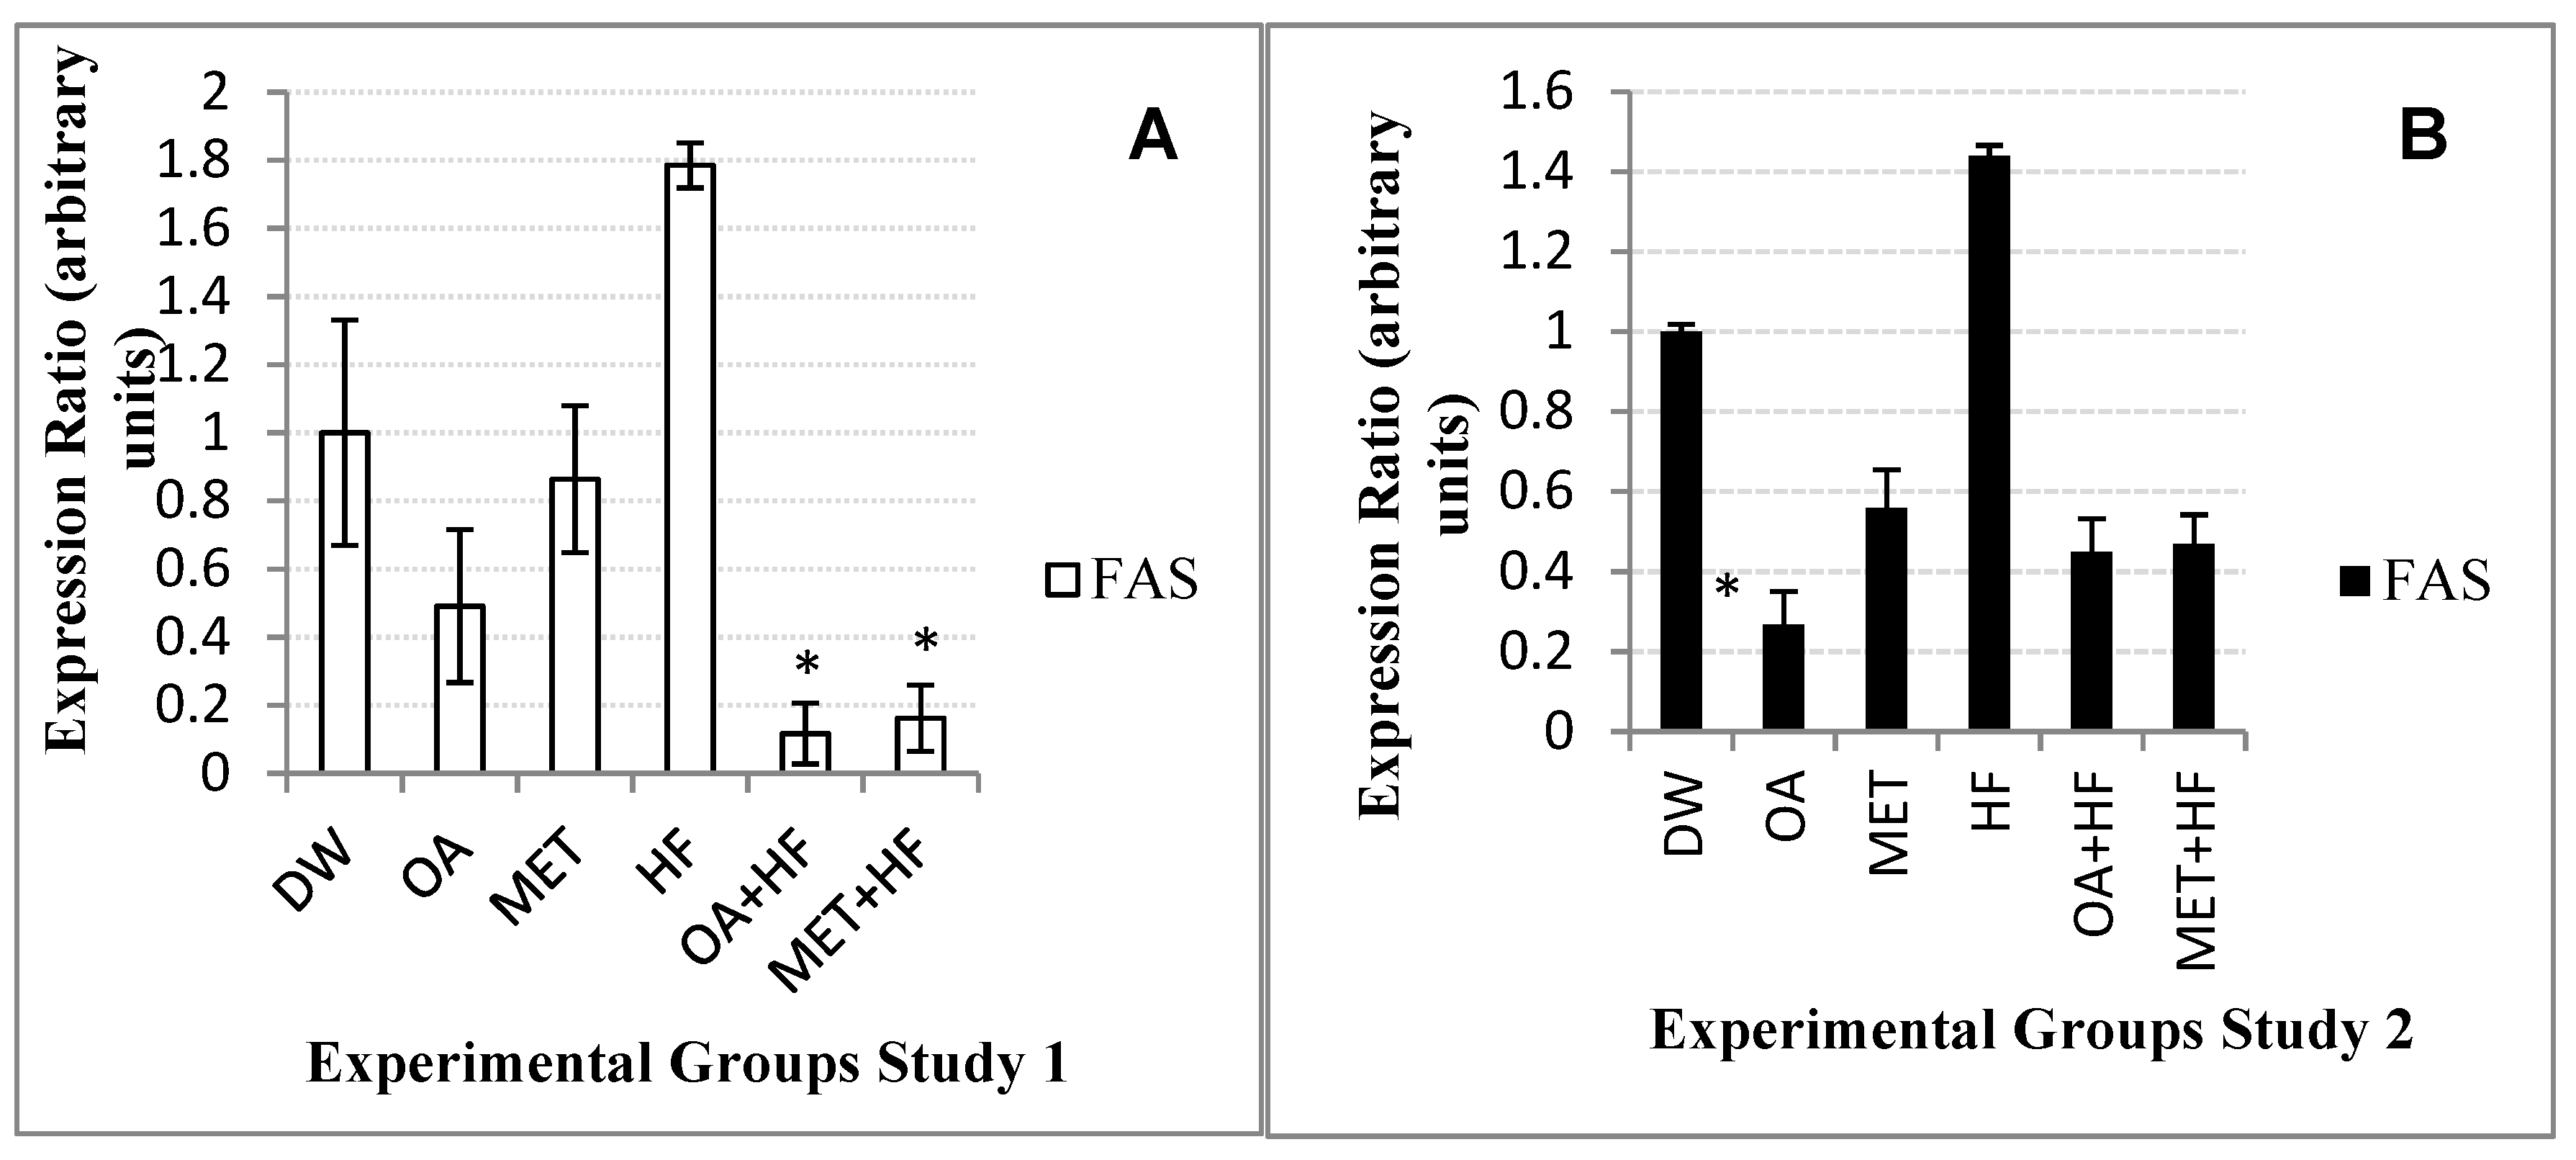
The gene expression of both
fas and
acc-1 were suppressed in the OA, MET, OA + HF and MET + HF in both the phase 1 and 2 experiments. However, in the HF group, the expressions of
fas and
acc-1 were increased. When animals are well fed on carbohydrates, fatty acid oxidation is lowered by regulatory hormones such as insulin, but fatty acid synthesis is increased [
25]. This suggests that the HF dietary groups promoted FFA synthesis in the skeletal muscle cells. Phosphorylation of
acc-1 by AMPK decreases
acc activity and malonyl-CoA content in rats [
33,
34,
35]. Studies have shown that fatty acid synthesis is also regulated through long-term hormonal regulation and or short-term substrate availability where the presence of polyunsaturated FFAs in the diet decreases the concentration of
acc-1 and
fas [
18]. Moreover, in this study, the presence of polyunsaturated FFAs in the OA, MET, OA + HF and MET + HF groups correlated with the decreased expression levels of
acc-1 and
fas.
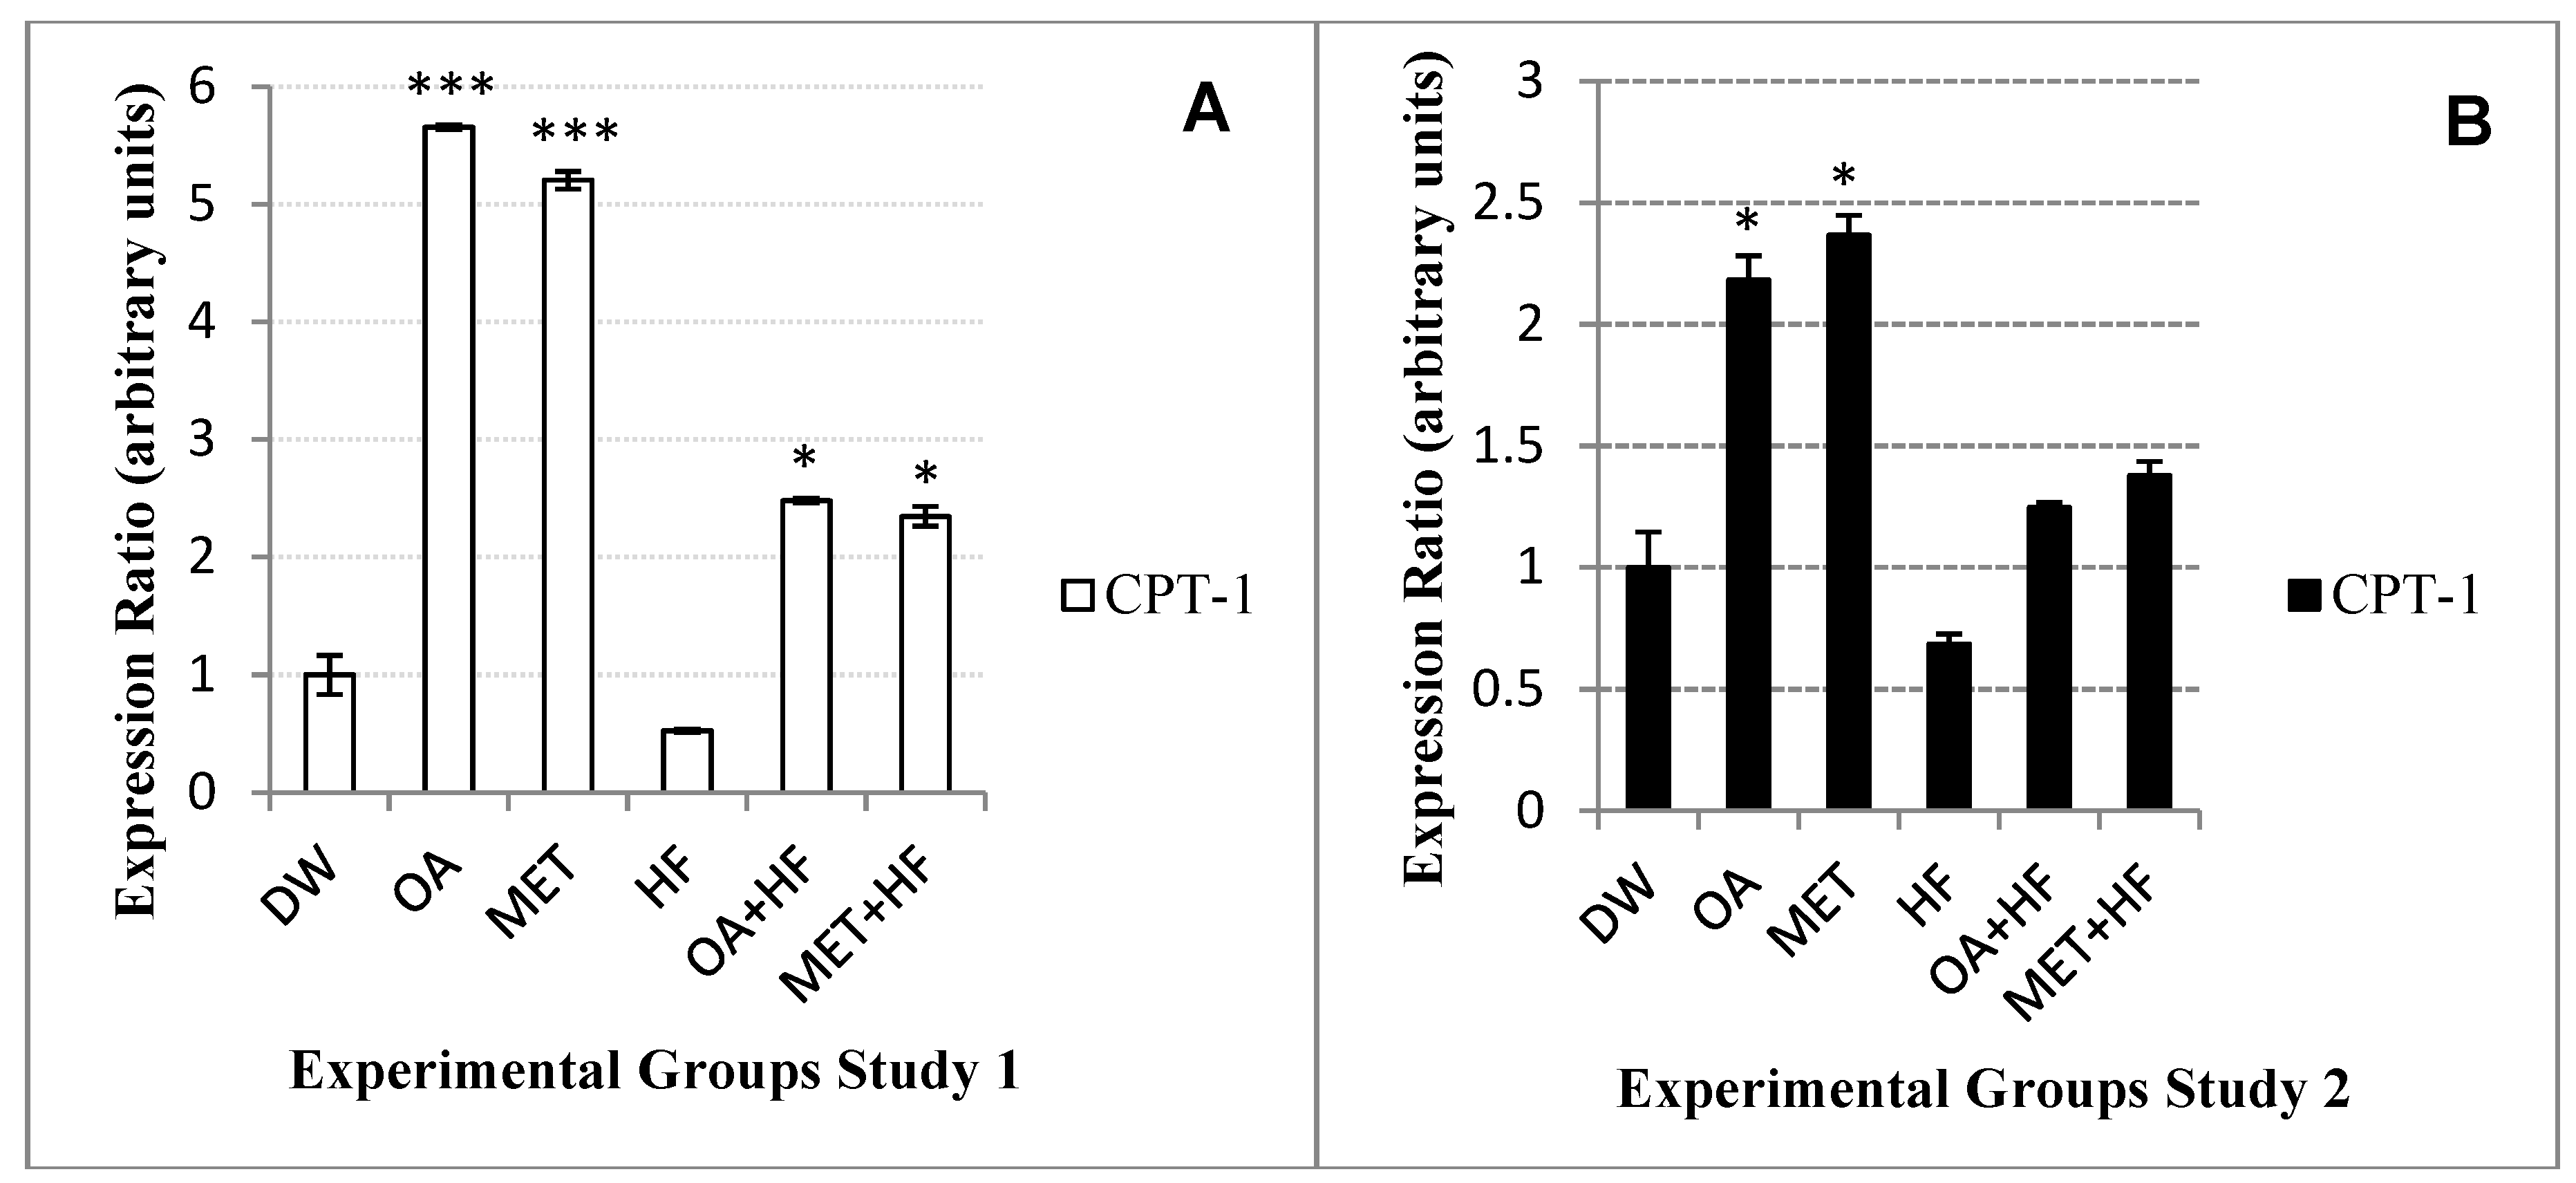
Findings from the current study showed that
cpt-1 gene was highly expressed in both OA and MET groups and was suppressed in the HF group.
Cpt-1 catalyzes the rate limiting step in skeletal muscle fatty acid oxidation, in which decreased cytosolic long chain fatty acid Co-A results in the increase of the activity of
acc-1, where malonyl Co-A is phosphorylated and decreases the activity of
cpt-1 in which long acid chain fatty acid carnitine is ceased to be produced and will not be transferred to the mitochondria for oxidation [
7].
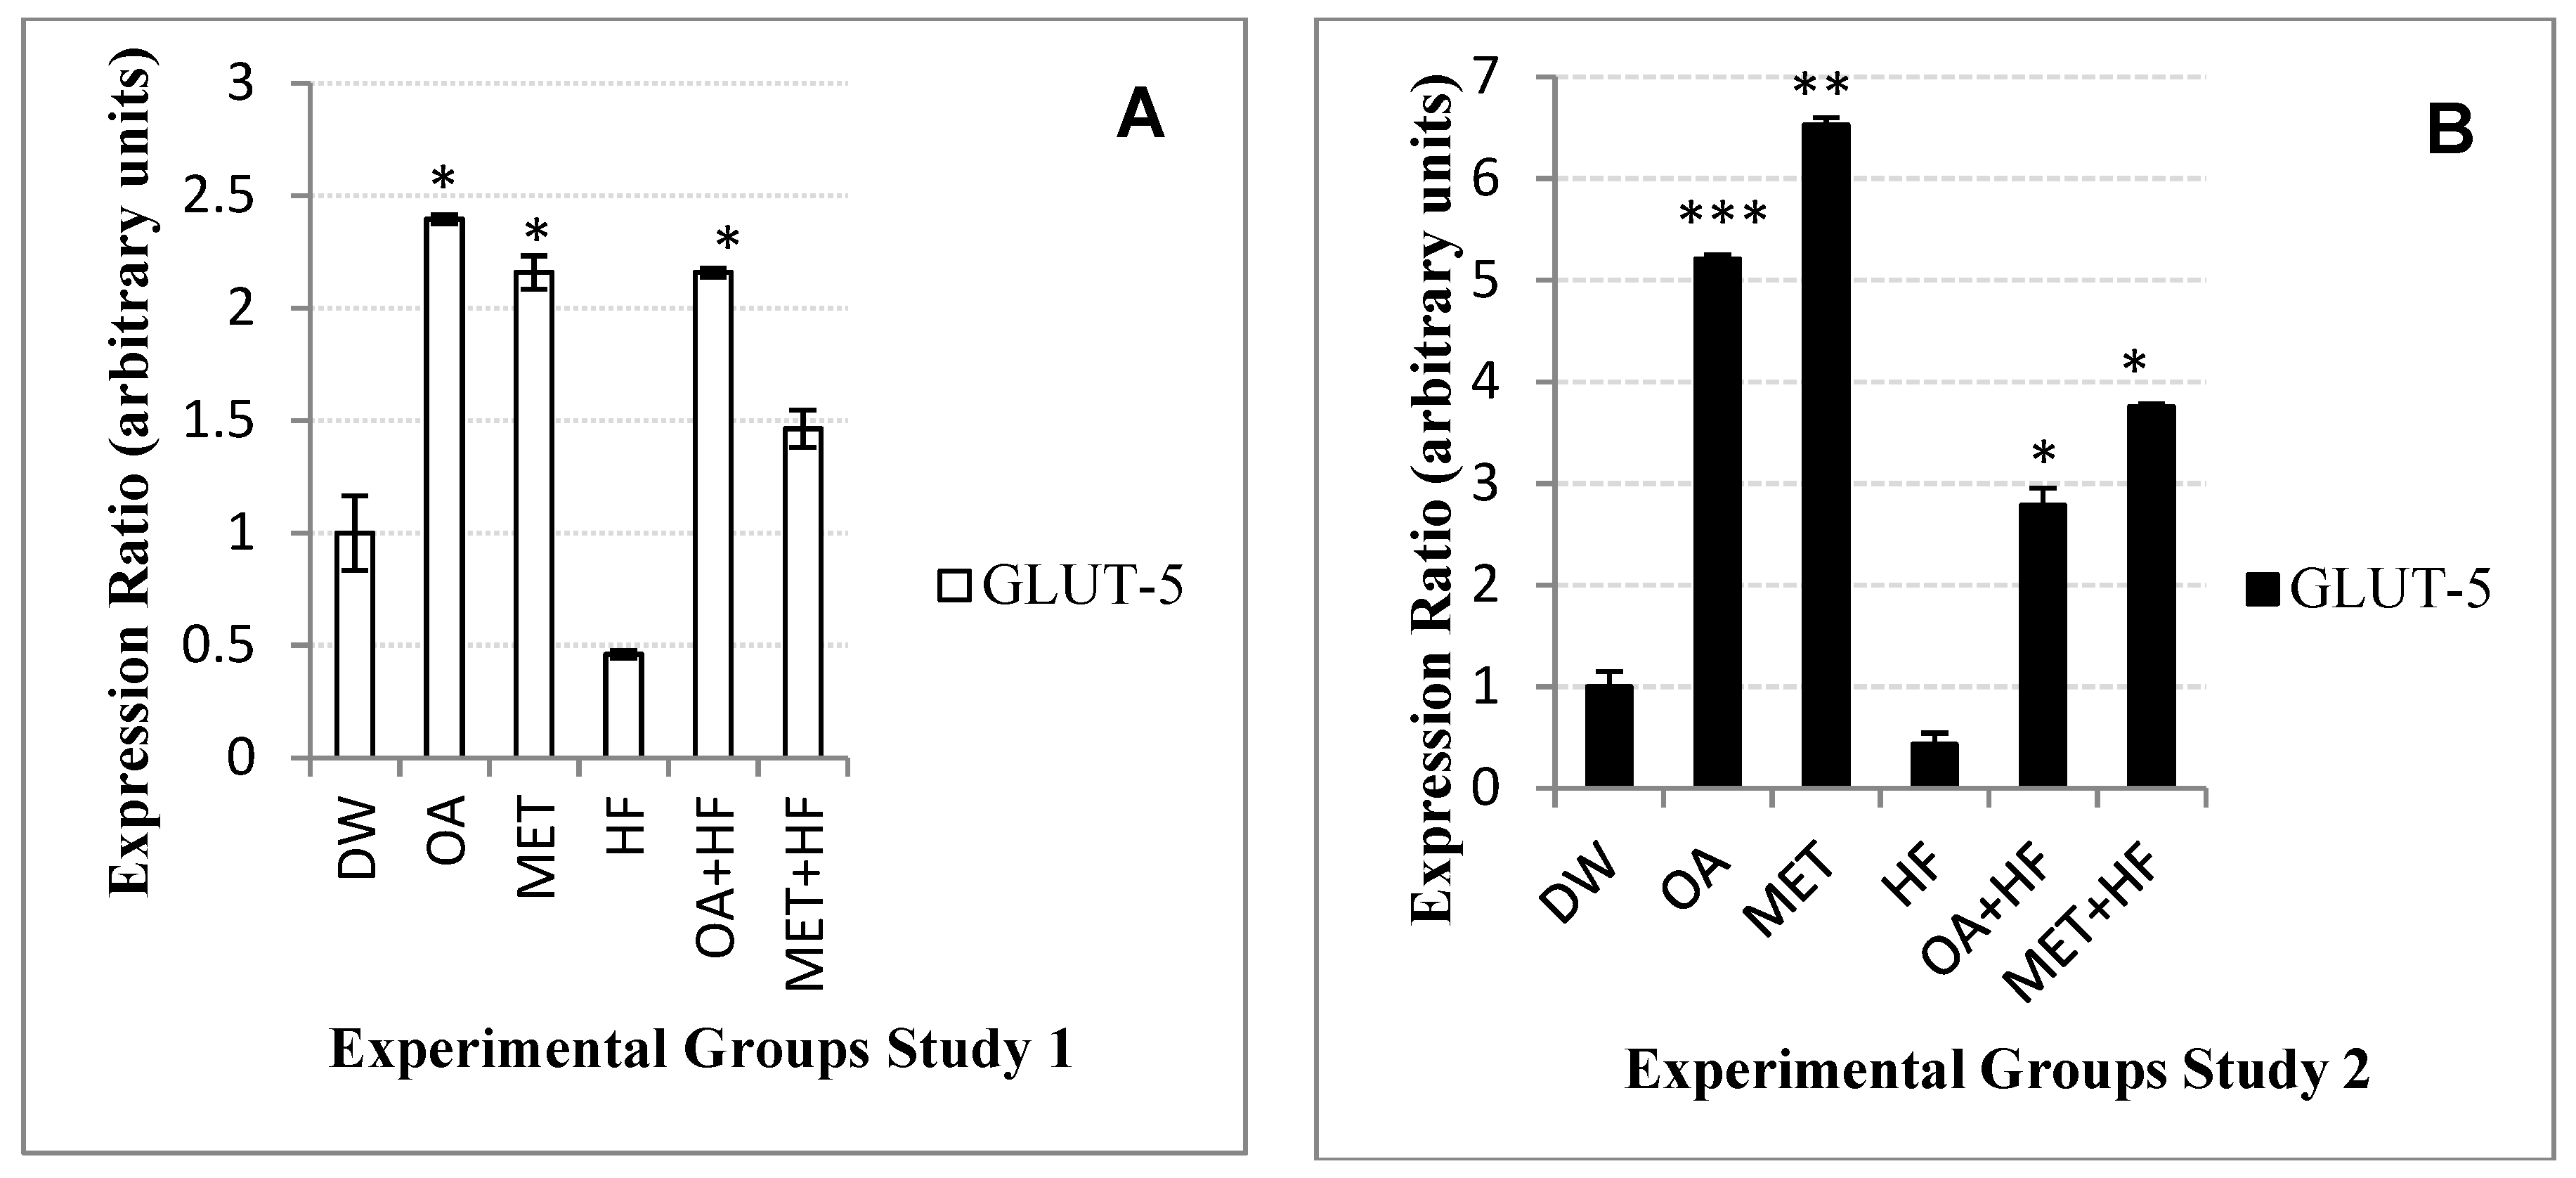
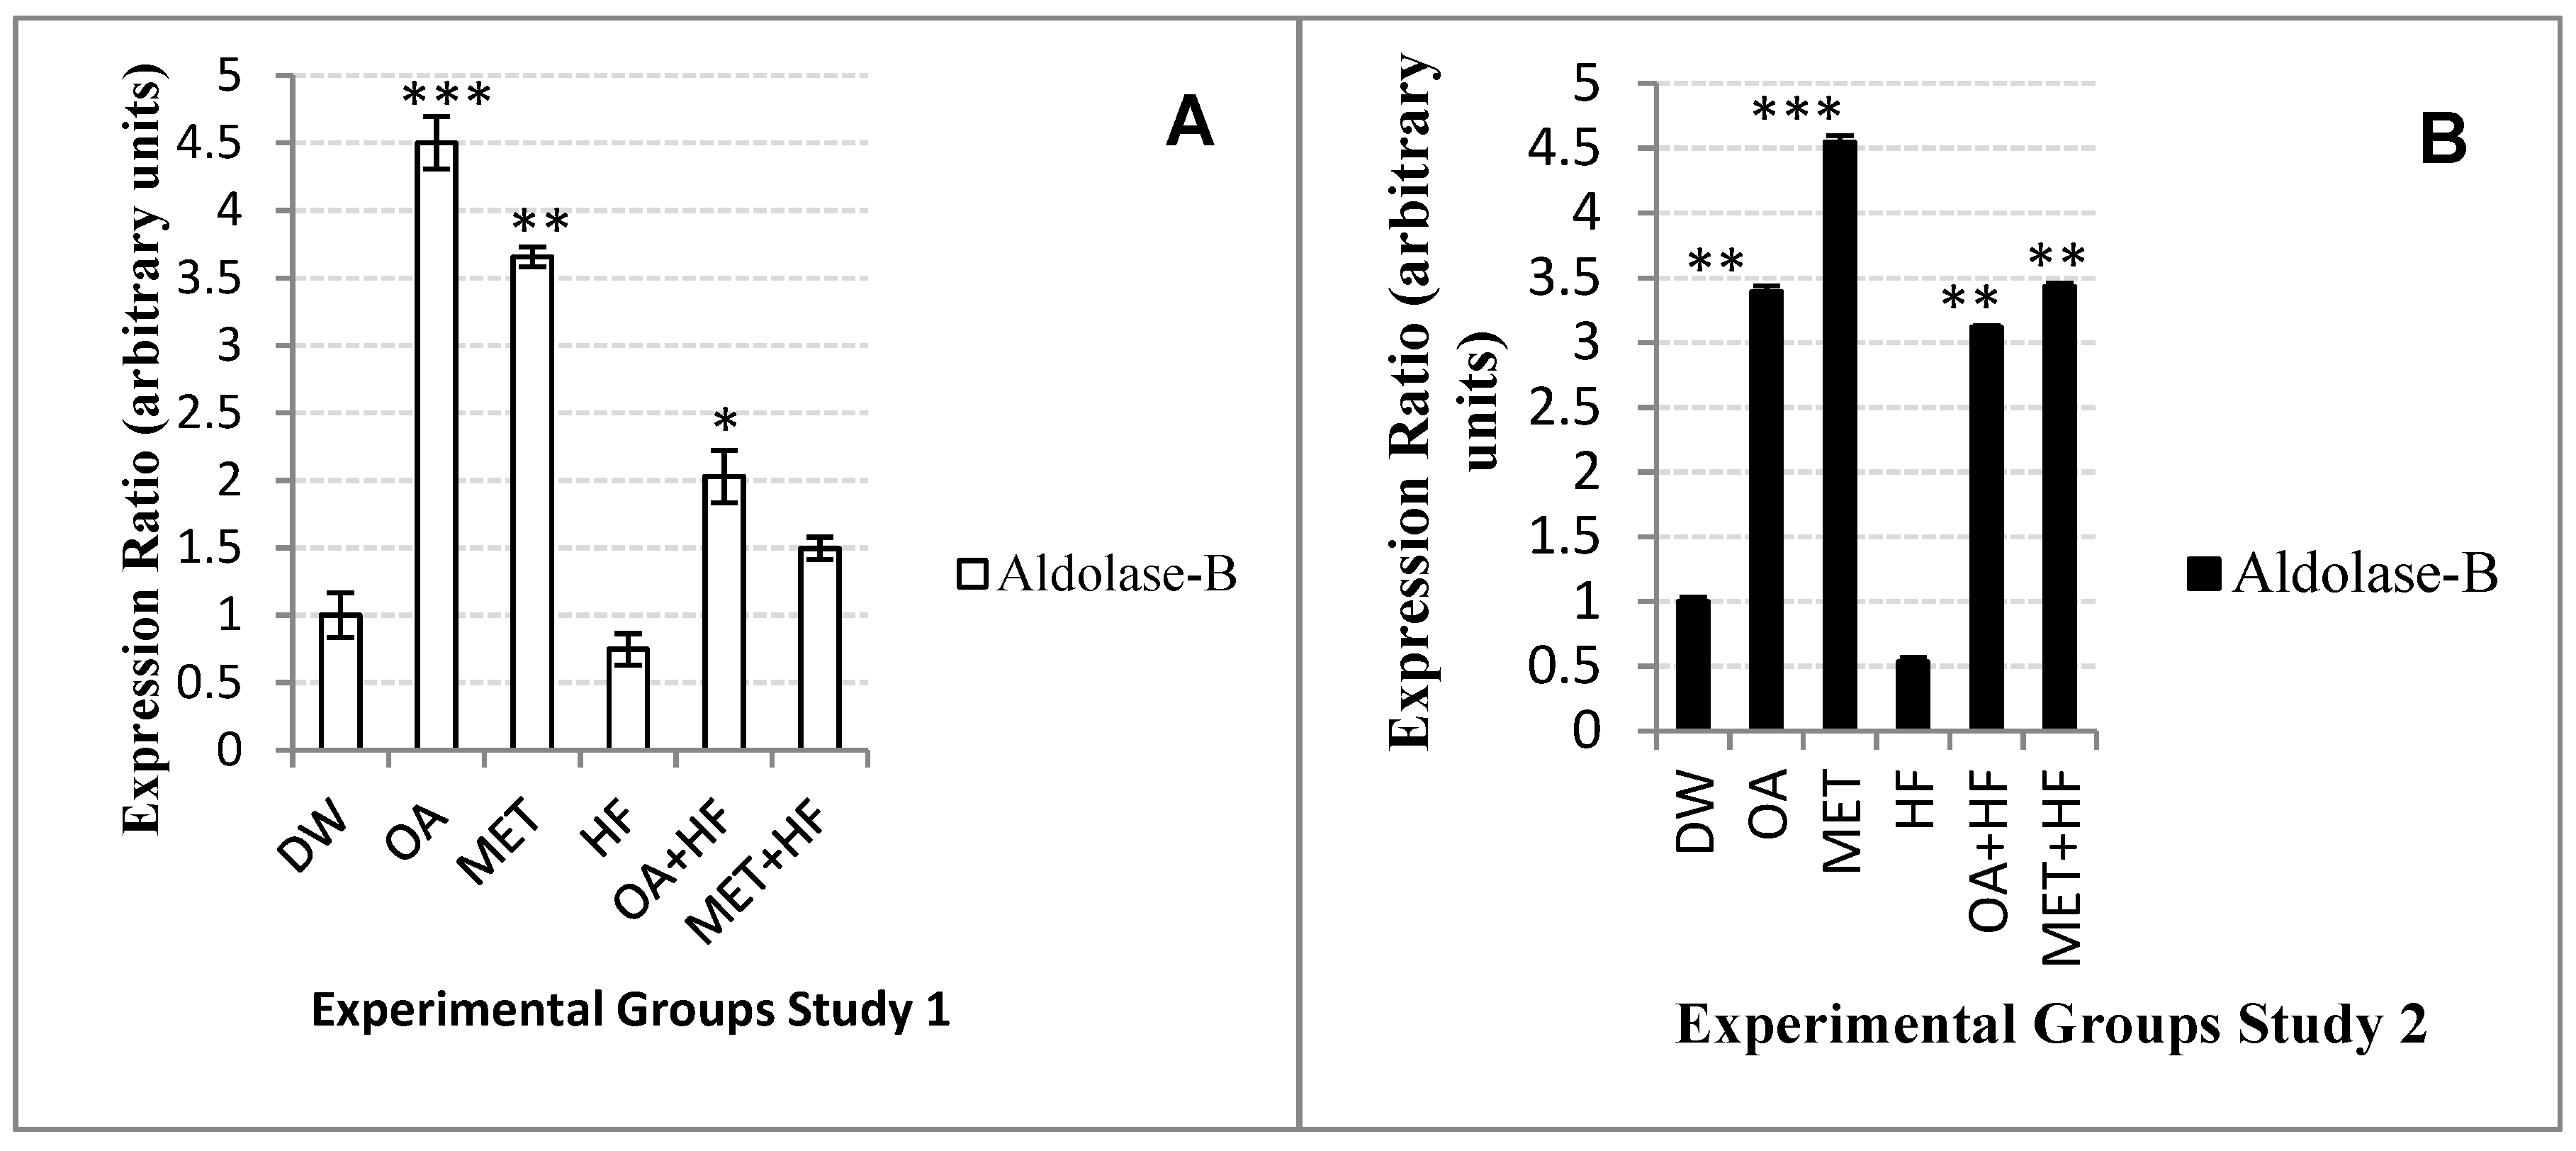
Glut-5 isoform gene is another hexose transporter found in the body. Although
glut-5 is not highly abundant in the skeletal muscle tissues, it has high affinity for fructose and low affinity for glucose, therefore it is important for both fructose and glucose homeostasis. After consumption of high fructose diet, fructose is efficiently metabolized by ketohexokinase into fructose-1 phosphate and then cleaved by
aldolase-b into dihydroxyacetone phosphate and glyceraldehyde [
16,
17,
36]. Dihydroxyacetone phosphate can directly enter gluconeogenesis; whereas glyceraldehyde is phosphorylated into glyceraldehyde-3 phosphate [
17,
36]. Glyceraldehyde-3 phosphate can either be used for glycolysis, gluconeogenesis, or enter the pentose phosphate pathway and be metabolized into acetyl-CoA so that it can be used for liponeogenesis [
17,
36].
There was a decreased expression of
glut-5 in the HF group and this was associated with high levels of saturated FFAs. The
glut-5 gene expression was also high in the OA, MET, OA + HF and MET + HF treated groups. Over expression
glut-5 in non-insulin dependent diabetes is associated with increased fructose absorption [
23,
36]. In this study, over expression of
glut-5 could have also been influenced by the rate at which fructose was metabolized. This correlated to the increased expression of
aldolase-b in OA, MET, OA + HF and MET + HF groups when compared with normal control and HF groups. However, the suppression of both glut-5 and
aldolase-b in the HF suggests that HF could lead to fructose malabsorption.
4. Materials and Methods
4.1. Ethical Clearance
The experiments were conducted on 96 female Sprague Dawley pups that were housed in the Central Animal Services at the University of the Witwatersrand. Ethical clearance for animal use was granted by the Animal Ethics Committee of the University of the Witwatersrand (Ethics Screening Number 2014/47/D).
4.2. Experimental Design
The study was conducted in two main experimental studies, a sub-acute study and a long term study. Study 1 of the experiment was between postnatal days 7–14. The seven-day old pups were randomly assigned to the following treatment groups: control—distilled water (DW) and 0.5% (
v/
v) dimethyl sulphoxide, oleanolic acid (60 mg/kg) (purity > 99%) [
37] dissolved in 0.5% (
v/
v) dimethyl sulphoxide, metformin (500 mg/kg) (purity > 98%) [
38] 0.5% (
v/
v) dimethyl sulphoxide, high fructose solution (HF; 20% (
w/
v)—dissolved in 0.5% (
v/
v) dimethyl sulphoxide, oleanolic acid (OA) + high fructose diet (OA + HF), and metformin + high fructose diet (MET + HF). Treatments were administered once daily via oral gavage (10 mL/kg body weight) between 09:00–10:00 a.m. The pups were allowed to continue nursing with their dams freely during the experimental period. The dosages of oleanolic acid, metformin and high fructose died were based on the less toxic levels obtained from previous studies using these doses. On PD 14, the rat pups were euthanized and samples collected. The dams were returned to stock. In the second study of the experiment, the rats were weaned onto normal rat chow and plain drinking water on PD21. The pups were then housed individually from PD 22 in cages where they had
ad libitum access to rat chow and plain drinking tap water until PD112.
4.3. Terminal Procedure and Sample Collection
On PD 112, the rats were then euthanized by an intra-peritoneal injection of sodium pentobarbital (200 mg/kg body mass; Eutha-naze® (Bayer Corporation, Johannesburg, South Africa). The triceps skeletal muscles were dissected out, placed in cryovials, then snap frozen in liquid nitrogen and stored at −80 °C freezer until analyses.
4.4. Lipid Extraction, Purification and Identification by Gas Chromatography-Mass Spectrometry
Lipid extraction and purification from the skeletal muscle samples from study 1 and 2 was performed according to a modified method described by [
39]. Briefly, the snap frozen tissue samples were taken from the −80 °C and placed on ice. Thereafter, the muscle tissue was cut from each sample with a clean scalpel blade and 50 mg was weighed. Microcentrifuge tubes were used to place the 50 mg muscle tissues. An internal standard (IS) mixture (
Table 5) was prepared and added to the weighed muscle tissue. The IS consists of methanol, water and chloroform. Steel beads were then added to the sample mixture and the samples were placed on a Retch M400 vibration mill for homogenization. This was followed by the removal of steel beads from the sample, where the sample mixture was transferred into a new clean tube. The after homogenization, the internal standard mixture (IS) was added into the sample (
Table 5), then vortexed for 60 s using the Vortex-2 Genie machine (Vortex-Genie
® 2, Scientific Industries, Inc. Bohemia, New York, NY, USA). After that the sample mixture was then centrifuged for 10 min at 2000×
g at 4 °C. This resulted in a phase separation, with the clear polar layer at the bottom and the milky apolar layer at the top of the muscle pellet. Both polar and apolar samples were used for analysis, where in each sample 725 µL of polar sample was used and 400 µL of apolar sample was used and transferred into Agilent vials (
Table 5). Each sample had five replicates. The samples were then dried under nitrogen. An oximation solution was then prepared by dissolving 200 mg of methoxyamine into 10 mL of pyridine. In each dried sample, 50 µL of the oximation solution was added followed by a 60 s vortexing. The samples were then placed at room temperature for an hour. This was followed by the addition of 50 µL of bistri fluoacetamide (BSTFA), which contained 1% of trimethylsilyl chloride (TMCS) and then incubated for one hour at 40 °C. An external standard was then prepared using 50 µL of 30 µg/mL eicosane in hexane, which was added into the agilent vials inserts of each sample before running the GC-MS analysis.
The response factor of each lipid analysed was calculated using:
where
ma is the mass of the lipid analyte of the free fatty acid
a and
Aa is the corresponding peak area of the free fatty acid a and
Ra is the Response Factor or the Peak Area Ratio of the free fatty acid
a.
4.5. RNA Extraction
Samples were randomly selected from rats in Study 1 and Study 2 experimental groups, and a total of 12 samples were used per extraction. From each sample, muscle tissue was crushed in a mortar with a pestle using liquid nitrogen and 200 mg was weighed on a scale. The weighed tissue was then transferred into a 1.5 mL tube and dissolved in a 1 mL Trizol (TRIzolTM Reagent, Thermo Fisher Scientific Inc., Waltham, MA, USA). This was followed by homogenization and incubation on ice for 5 min, and then centrifugation at 12,000× g at 4 °C for 15 min. Trizol was then discarded from the sample homogenate. Chloroform (200 µL) was added into the sample homogenate using a pipette, then incubated on ice for 15 min. Thereafter, the sample homogenate was centrifuged at 12,000× g for 15 min in order to achieve phase separation. The aqueous phase was then transferred into a 2 mL tube. Isopropanol (0.5 mL) was used to precipitate the RNA, followed by incubation on ice for 10 min. The sample was then centrifuged for 10 min at 12,000× g at 4 °C. After centrifugation, the supernatant was removed from the sample and the RNA sample pellet was air dried. RNase free water (20 µL) was then used to dissolve the extracted RNA pellet. This was followed by determination of RNA concentration and ratio using a nanodrop machine (NanoDropTM Lite Spectrophotometer, Thermo Fisher Scientific Inc.).
4.6. Gel Electrophoresis
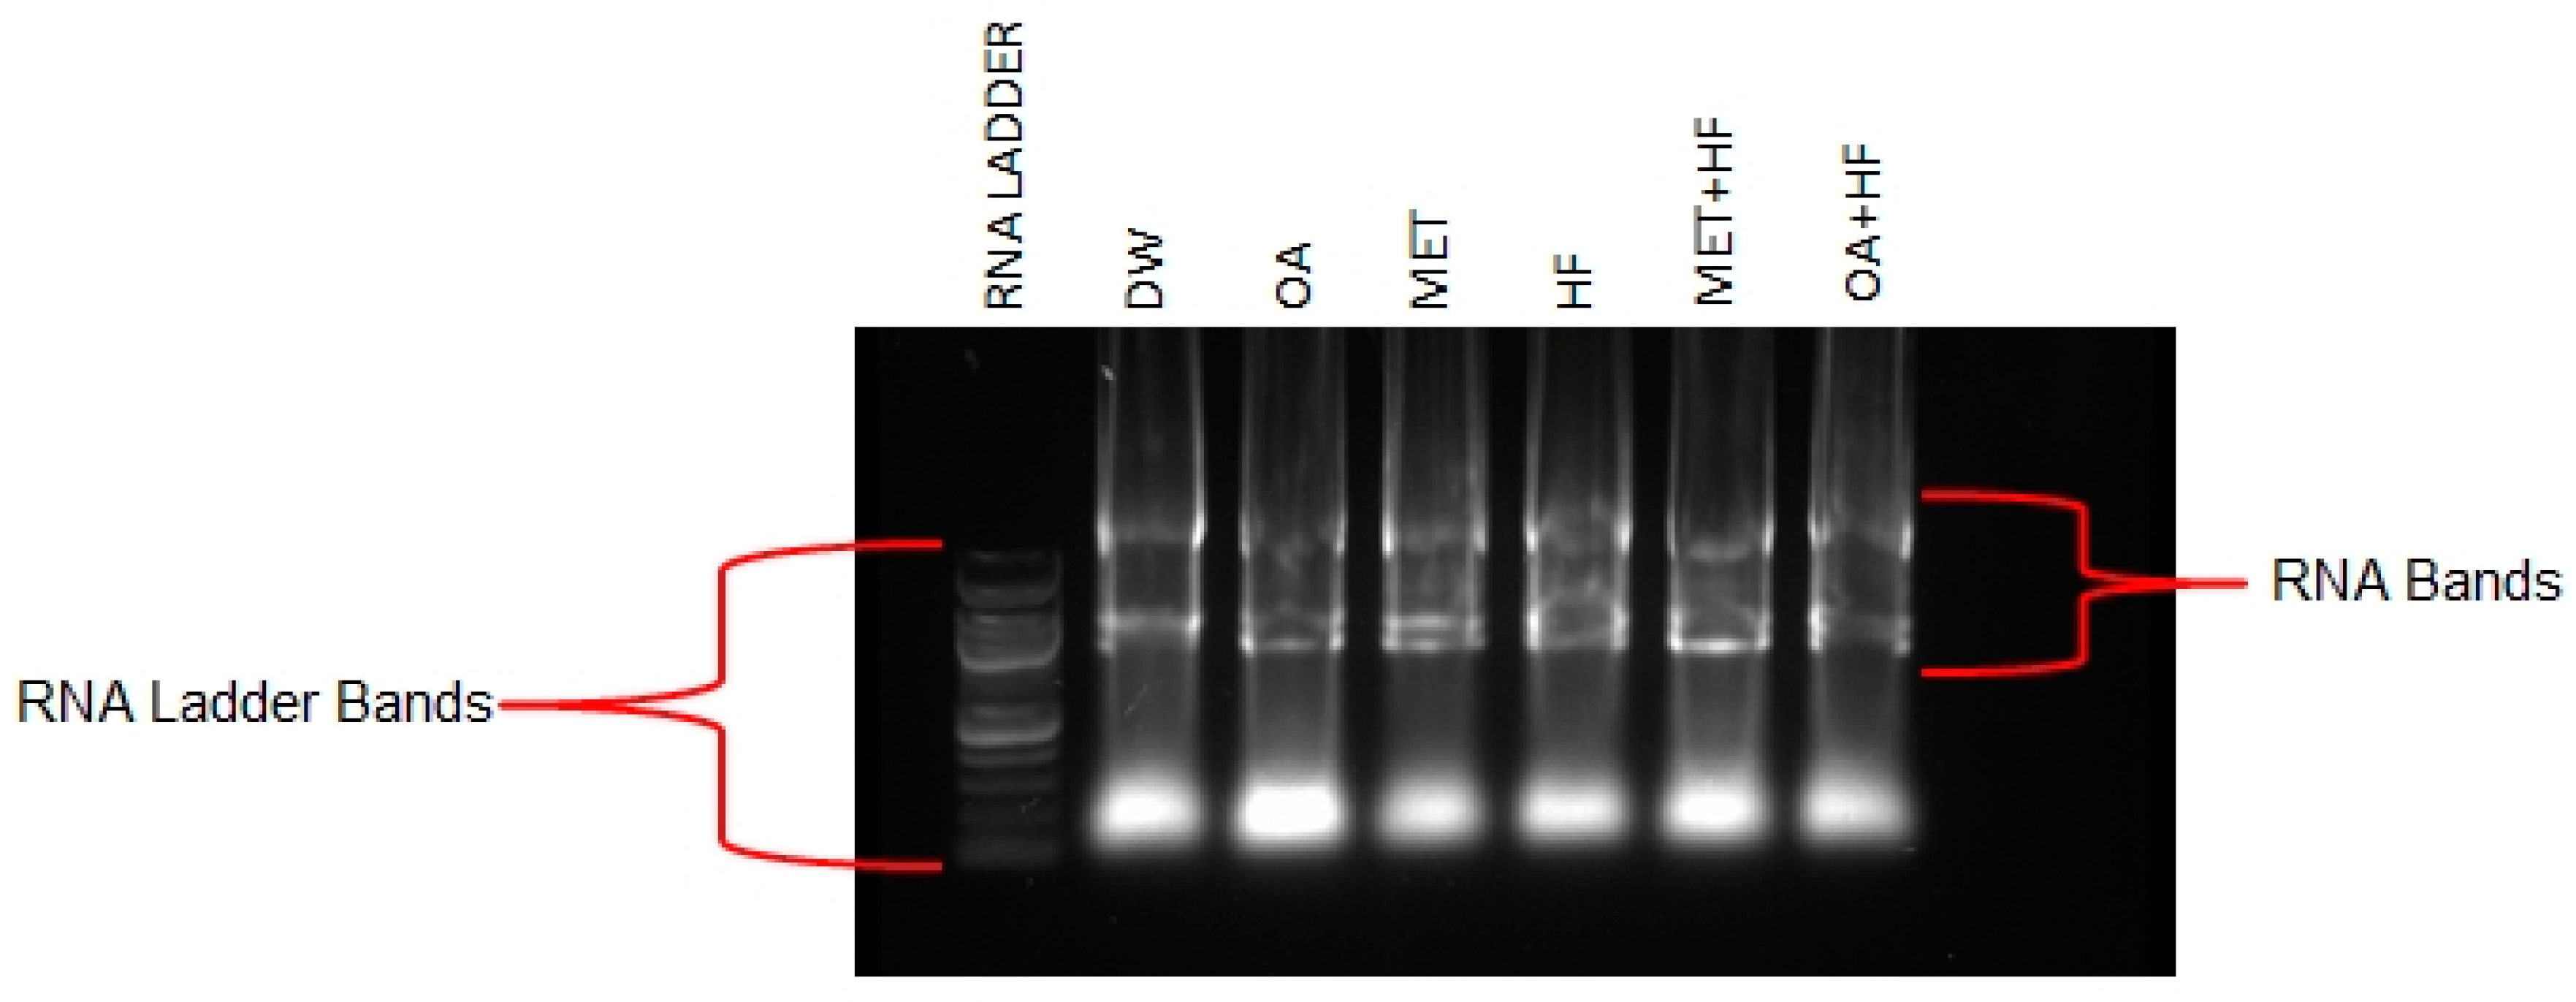
Gel preparation involved weighing 1.5 g of agarose gel on a scale and dissolving it in 150 mL of tris acetate buffer (1× TAE buffer), which was prepared at 500 mL TAE buffer. The solution was then microwaved for 60 s to dissolve the gel. The gel solution was cooled at room temperature to 50 °C temperature. Ethidium bromide (2 µL) was then added to the gel solution. The gel was poured into the electrophoresis chamber, in which sample wells were created using the comp. One extracted RNA sample from each experimental group (DW, OA, MET, HF, OA + HF and MET + HF) was randomly selected to be used for the gel electrophoresis, in which a total of six samples were used. Two were from Study 1 and three from Study 2 (DW and MET = study 1 and OA, HF, OA + HF and MET + HF = study 2). A staining procedure then followed, were in each sample a pipette was used to obtain 1 µL of RNA, which was mixed with a 1 µL of purple dye. RNA ladder standard marker was also used at a 1:1 ratio with the purple dye. The RNA marker was added into the first sample well, followed by DW, OA, MET, HF, OA + HF and MET + HF in that order. The rest of the TAE buffer solution was added into the electrophoresis chamber as running buffer. The gel was then run on an electrophoresis chamber for 80 min at 60 volts. RNA bands were then visualized at the SYBR Green Filter at 500–600 m (
Figure 10).
4.7. cDNA Synthesis
DNA was synthesized from RNA samples using the Superscript VILO cDNA synthesis kit (iScriptTM select cDNA synthesis kit, Bio-Rad Laboratories, Inc., Foster city, CA, USA). This involved determining the RNA concentration needed for synthesizing cDNA, which varied per sample as it depended on the RNA concentration observed from the Nanodrop machine. A master-mix for each single reaction was prepared using 4 µL of 5× VILO reaction mix, 2 µL 10× Superscript enzyme mix, sample RNA of up to 2.5 µg and DEPC-treated water of up to 20 µL. The mixture was then incubated at 25 °C for 10 min. Incubation was repeated at 42 °C for an hour. The reaction was terminated at 85 °C incubation for 5 min.
4.8. Quantitative Real Time PCR (RT-qPCR)
Quantitative Real Time PCR (qPCR) was performed for seven genes, namely;
acc-1,
cpt-1,
fas,
nrf-1,
glut-4,
glut-5 and
aldolase-b. For each gene, three replicates per sample from each experimental group were analyzed. Firstly, 1 µL of sample cDNA was pipetted from the sample and diluted with 19 µL of RNase free water to get a 20 µL volume. From the diluted cDNA sample, 1:20 ratio of cDNA to RNase free water was pipetted into new three qPCR tubes. The gene of interest forward and reverse primers and those of reference gene master-mix were prepared separately, with SYBR green master-mix. Primers used are provided in
Table 6.
The primer stocks were diluted according to the manufacturer’s guide. From the master-mix of each gene, 7 µL was pipetted into the qPCR sample tubes. Thereafter, cDNA (3 µL) was added into the qPCR sample tube in order to achieve a 10 µL final volume. The samples were loaded into the RT-qPCR machine for analysis in a specific order of choice. The RT-qPCR was set to run using instructions provided by the manufacturer as the instrument user guide, in which a standard cycling mode was used.
4.9. Statistical Analysis
Data was expressed as mean ± standard deviation (SD). A one way ANOVA was used to determine differences in means from different experimental groups. All statistical analyses were performed in R version 3.4.0 statistical software (R Development Core Team, Auckland, New Zealand) Level of significance was set at p ≤ 0.05.

 ,
, 


