1. Introduction
Tree peony (
Paeonia suffruticosa Andrews) is a deciduous shrub with large and colorful flowers that belongs to Sect.
Moutan DC., genus
Paeonia, family Paeoniaceae [
1,
2]. There are nine wild species in Sect.
Moutan DC., all of which are unique to China [
3]. Tree peonies therefore originated in China, and they have a long history of cultivation and use as ornamental plants. Over time, they have been introduced from China, either directly or indirectly, to many other countries throughout the world. Tree peonies possess abundant germplasm resources, and more than 1200 varieties may be recognized, following long-term natural and artificial selection [
4,
5]. Generally speaking, the individual flowers of any particular strain last for 10 days, but the flowering period from the first to the last flower is only 20 days, a very limited time period. Mid-season peonies predominate in the various different cultivation regions, with smaller numbers of early- and late-flowering varieties. Flowering characteristics and particular flowering period are key properties of the ornamental peony, and to an extent they have limited the commercial development of the plant [
6]. Consequently, further studies of the molecular mechanisms that regulate flowering in peony are potentially of great significance for the manipulation and prolongation of the flowering period.
In recent years, with the rapid development and application of genetics and molecular biology, the functions of a large number of genes related to flowering have been extensively studied, especially in model plants with sequenced genomes. Results have shown that there are four pathways that regulate the mechanism of plant flowering at the molecular level. These comprise regulation by photoperiod, by vernalization, by gibberellins, and by an autonomous pathway; together, these control the timing of flowering in response to endogenous and environmental signals [
7,
8,
9,
10,
11,
12].
Arabidopsis possesses five phytochrome (PHY) genes (
PHYA–PHYE) and two cryptochrome (CRY) genes (
CRY1 and
CRY2) that are presumably involved in phase-setting under white-light-and-dark cycles [
13]. These photoreceptors determine the activity of the flowering gene
CO, which encodes a zinc-finger protein. CO acts as a floral activator and as a mediator of the circadian clock [
14] to regulate the expression of
FT (
FLOWERING LOCUS T) and hence control flowering.
PHYA,
CRY1, and
CRY2 all promote flowering, whereas
PHYD and
PHYE inhibit flowering [
15,
16,
17]. Vernalization causes suppression of expression of the central flowering repressor gene
FLC (FLOWERING LOCUS C); the suppression is stable for the remainder of the life of the plant, but expression returns to a high level in the following generation. Since the level of gene expression does not change during the entire process, the suppression of
FLC by vernalization is not genetic [
18]. In the unisexual flowers of cucumber, the plant hormone gibberellic acid (GA) largely determines flower development, especially the regulation of sepal/petal development in female flowers [
19]. The autonomous flowering pathway accelerates flowering independently of day length by inhibiting the expression of
FLC [
20], and several genes are known to be involved, such as
LUMINIDEPENDENS (
LD),
FLOWERING LOCUS CA (
FCA),
FLOWERING LOCUS D (
FLD),
FLOWERING LOCUS Y (
FY),
FLOWERING LOCUS VE (
FVE),
FLOWERING LOCUS KH DOMAIN (
FLK), and
FLOWERING LOCUS PA (
FPA) [
21,
22,
23,
24,
25]. The photoperiod and vernalization pathways are mainly regulated by environmental factors such as light and a low-temperature signal, respectively. On the other hand, the gibberellin and autonomous pathways are mainly regulated by developmental factors [
26]. The transcriptional regulation of two genes determining flowering time,
SUPPRESSOR OF OVEREXPRESSION OF CONSTANS 1 (
SOC1) and
FT [
27], and two floral meristem identity genes,
APETALA1 (
AP1) and
LEAFY (
LFY) [
28,
29] has been shown to integrate these four pathways responsible for the regulation of flowering. These genes may, under particular circumstances, act either in isolation or in concert to activate downstream flower meristem genes that then initiate plant flowering.
However, regulation of flowering in woody perennials and in herbaceous species is very different. In perennial plants, flowering occurs following a transition between vegetative and reproductive growth that occurs at sexual maturity, after a juvenile period. Thus, Hsu et al. [
30] reported that in woody perennial poplar (
Populus spp.),
FLOWERING LOCUS T1 (
FT1) and
FLOWERING LOCUS T2 (
FT2) coordinate the repeated cycles of vegetative and reproductive growth, revealing that in response to winter temperatures,
FT1 determines reproductive onset, whereas
FT2 responds to warm temperatures and long days in the growing season and promotes vegetative growth and inhibition of bud set. Li et al. [
31] explored the differences of leaf and peel color change between red and green walnut by transcriptome analysis and identified 3083 differentially expressed genes (DEGs) between red and green walnut peel at the ripening stage. Ma et al. [
32] investigated the effects of low-temperature treatment on stamen petaloidy in rose (
Rosa hybrida) and revealed that low temperatures increase petal number, at least to some extent. In tree peony,
PsTm6, belonging to the MADS-box gene family, was found to influence stamen petaloidy and flower shape formation [
33]. Zhang et al. [
34] isolated
PsSOC1 from tree peony and determined its expression pattern during dormancy; furthermore, they investigated the regulatory mechanisms controlling flowering time in transgenic
Arabidopsis. The results suggested that
PsSOC1 may be an important target for the genetic manipulation of dormancy release and flowering time in tree peony. Using transcriptome sequencing technology and by comparison with the non-repeat-flowering tree peony cultivar (×
P. suffruticosa ‘Luo Yang Hong’ (LYH)), Zhou et al. [
35,
36] revealed eight DEGs that were potential candidates for determining repeat flowering in the repeat-flowering cultivar [
Paeonia ×
lemoinei ‘High Noon’ (HN)]. Four genes,
PsFT,
PsVIN3,
PsCO, and
PsGA20OX, were identified that likely play important roles in the regulation of the repeat-flowering process in tree peony. Furthermore, these researchers isolated
PsFT, a close homolog of
FT found in the cultivars HN and LYH, and identified its potential role in the regulation of flowering time in tree peony.
Bulked sample analysis (BSA) is a powerful tool for the rapid identification of genetic determinants underlying phenotypic variation. It is applicable to both selected and pooled individuals, and it has been used extensively in gene mapping through bulked segregant analysis with biparental populations, in the mapping of molecular markers, such as single nucleotide polymorphisms (SNPs), and in pooled genome-wide association studies (GWAS), using extreme variants in two groups with contrasting phenotypes [
37,
38]. In maize, pools were constructed of mutants and wild-type individuals for comparison by RNA sequencing (RNA-Seq) and, using this approach, the
glossy 13 (
gl13) gene [
39], the
roothairless5 (
rth5) gene [
40], and the
Brown midrib2 (
bm2) gene [
41] were all successfully mapped and cloned. The three genes were related, respectively, to epicuticular waxes on the surfaces of seedling leaves, root hair initiation and elongation, and a reddish-brown coloration associated with reductions in lignin concentration and alterations in lignin composition. Ramirez-Gonzalez et al. [
42] were able to identify putative SNPs across a major disease resistance gene for wheat yellow rust, the
Yr15 locus, using BSA combined with RNA-Seq in an F
2 population to generate high-density genetic maps across target loci in polyploid wheat; they finally mapped
Yr15 to a 0.77-cM interval. In sunflower, in the absence of a reference genome, the putative locus
PlARG conferring resistance to downy mildew was successfully verified by combining BSA with next-generation sequencing (NGS) and
de novo assembly of the sunflower transcriptome, leading to SNP discovery through a sequence resource that combined reads that originated from two sunflower species [
43].
For tree peony, resolution of the molecular mechanisms underlying the regulation of flowering, including time of flowering, is an important and complex problem and only limited progress has been made to date. In this study, we used bulked segregant RNA-seq (BSR-seq) technology for the first time to detect DEGs in 3 lines of early- and late-blooming flowers, selected from an F1 population derived from P. ostti ‘Feng Dan’ (an early-flowering cultivar) × P. suffruticosa ‘Xin Riyuejin’ (a late-flowering cultivar). We aimed to identify flowering-time-related candidate genes by comparing the transcriptomes of four different bulked pools of flowers, each selected at full-bloom stage: T01 (male bulk, ‘Xin Riyuejin’, late-flowering), T02 (female bulk, ‘Feng Dan’, early-flowering), T03 (20 early-blooming flowers), and T04 (20 late-blooming flowers). A set of candidate functional genes related to flowering time was successfully obtained, providing a rich genetic resource for further study of the molecular regulation of flowering initiation and timing in peony. In addition, the SSR and SNP molecular markers identified will be useful in the analysis of genetic evolution, genetic diversity, and population structure, and in genome-wide association studies (GWAS) of tree peony.
3. Discussion
Plant flowering results from a transition from vegetative growth to reproductive growth, and time of flowering is regulated by a series of gene–environment interactions. The molecular mechanism of flowering plays a crucial role in plant growth and development, and it has become a “hot topic” in plant science. A full understanding is, self-evidently, of great importance to the identification of genes involved in plant developmental regulation. To date, a large number of genes have been discovered based on the increasing amount of sequence data available and gene expression patterns in plant organs such as flowers, leaves, and fruits. Because transcriptome sequencing can be undertaken irrespective of whether the species of interest has a sequenced reference genome, transcriptome sequencing has been recognized to be the most effective way of mining functional genes.
In the present study, the BSR-Seq method was used, employing the Illumina HiSeq TM2500 platform to screen and identify genes involved in time of flowering in tree peony. Petals from early- and late-flowering samples of an F1 population derived from a cross between two cultivars with flowering times (P. ostti ‘Feng Dan’ (early flowering) × P. suffruticosa ‘Xin Riyuejin’ (late-flowering)) were used for transcriptome sequencing, and a large number of gene sequences were obtained within a short period of time. Thus, a total of 56.51 Gb of clean data was acquired by transcriptome sequencing of samples from four groups, viz. T01 (male bulk, ‘Xin Riyuejin’, late-flowering), T02 (female bulk, ‘Feng Dan’, early-flowering), T03 (20 early-blooming flowers), and T04 (20 late-blooming flowers). Ultimately, a total of 78,645 unigenes were identified by de novo assembly.
There has been rapid progress recently in the application of transcriptome sequencing to peony, with a range of different tissues having been selected for different purposes. For example, the different developmental stages of peony flower buds were used for transcriptome sequencing by Shu et al. [
45], who constructed the first cDNA library of peony and obtained 2241 expressed sequence tags (ESTs). Gai et al. [
46] used the 454 GS FLX platform to transcriptome-sequence the dormant buds of ‘Feng Dan’ and revealed the molecular mechanism of dormancy in tree peony. A total of 50,829 unigene sequences with an average length of 585 bp were obtained from the petals of ‘Luoyang Hong’ using the HiSeq TM2000 platform, and from this the mechanism of anthocyanin synthesis in peony cut flowers was clarified [
47]. Li et al. [
48] carried out transcriptome analysis of peony seeds at different developmental stages and identified 175,875 contigs; subsequently, 2182 differentially expressed unigenes were screened and a large number of DEGs involved in fatty acid metabolism were identified, providing a molecular basis for potential strategies to increase the yield of peony seed oil. In comparison with these results, it is gratifying that the number of unigenes in the present study was as high as 78,645, which is 35 times the number of EST sequences of the flower bud transcriptome, and more than the numbers reported by Zhang and Li et al. [
47,
48]. Therefore, the present study provides a comprehensive and high-quality genetic resource for research on peony and its mechanism of flowering.
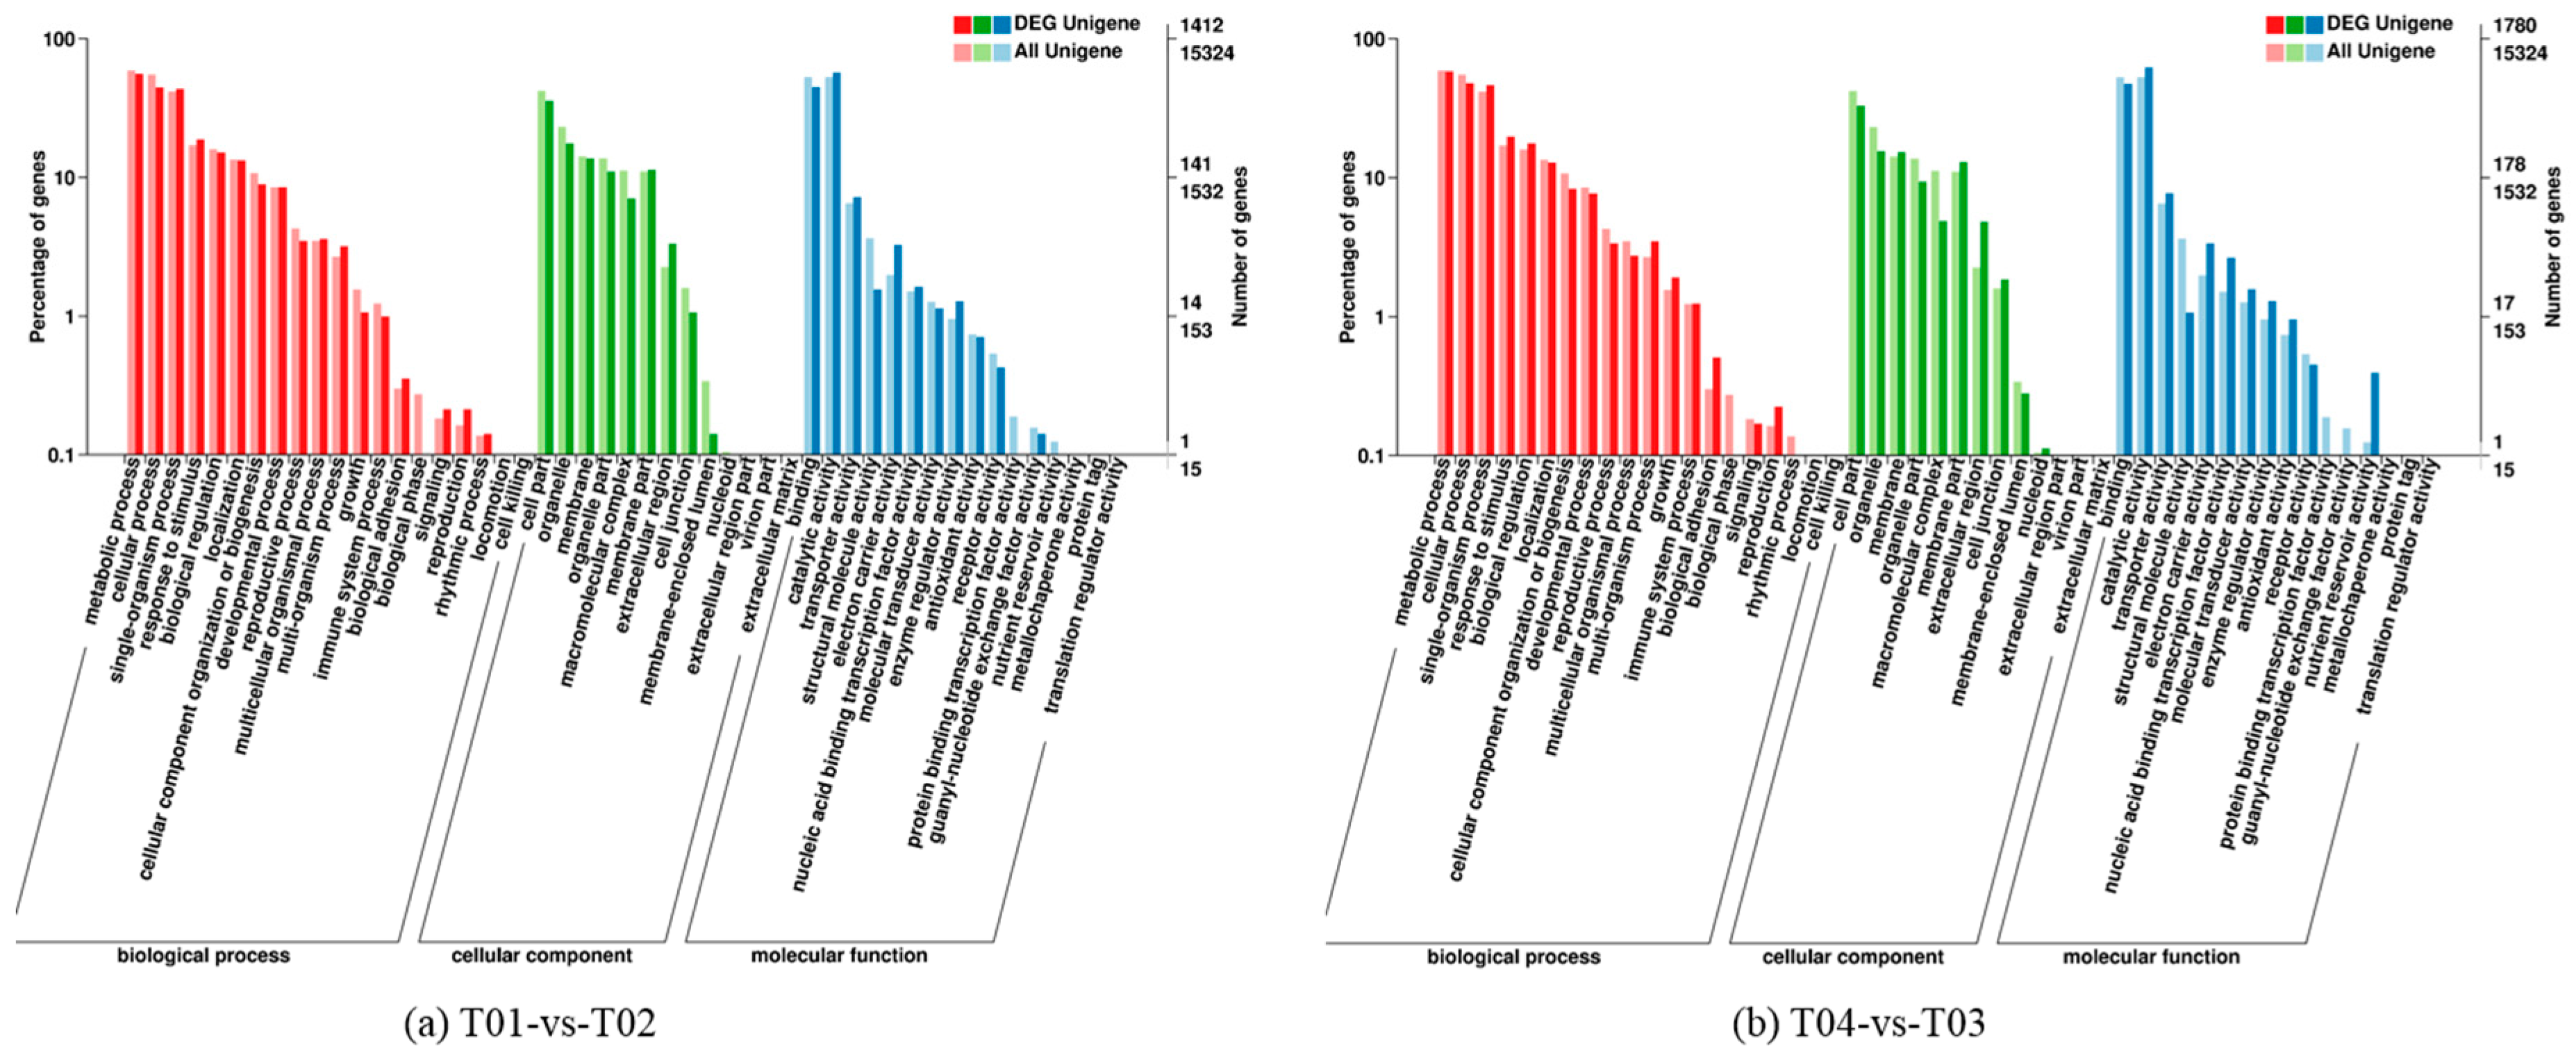
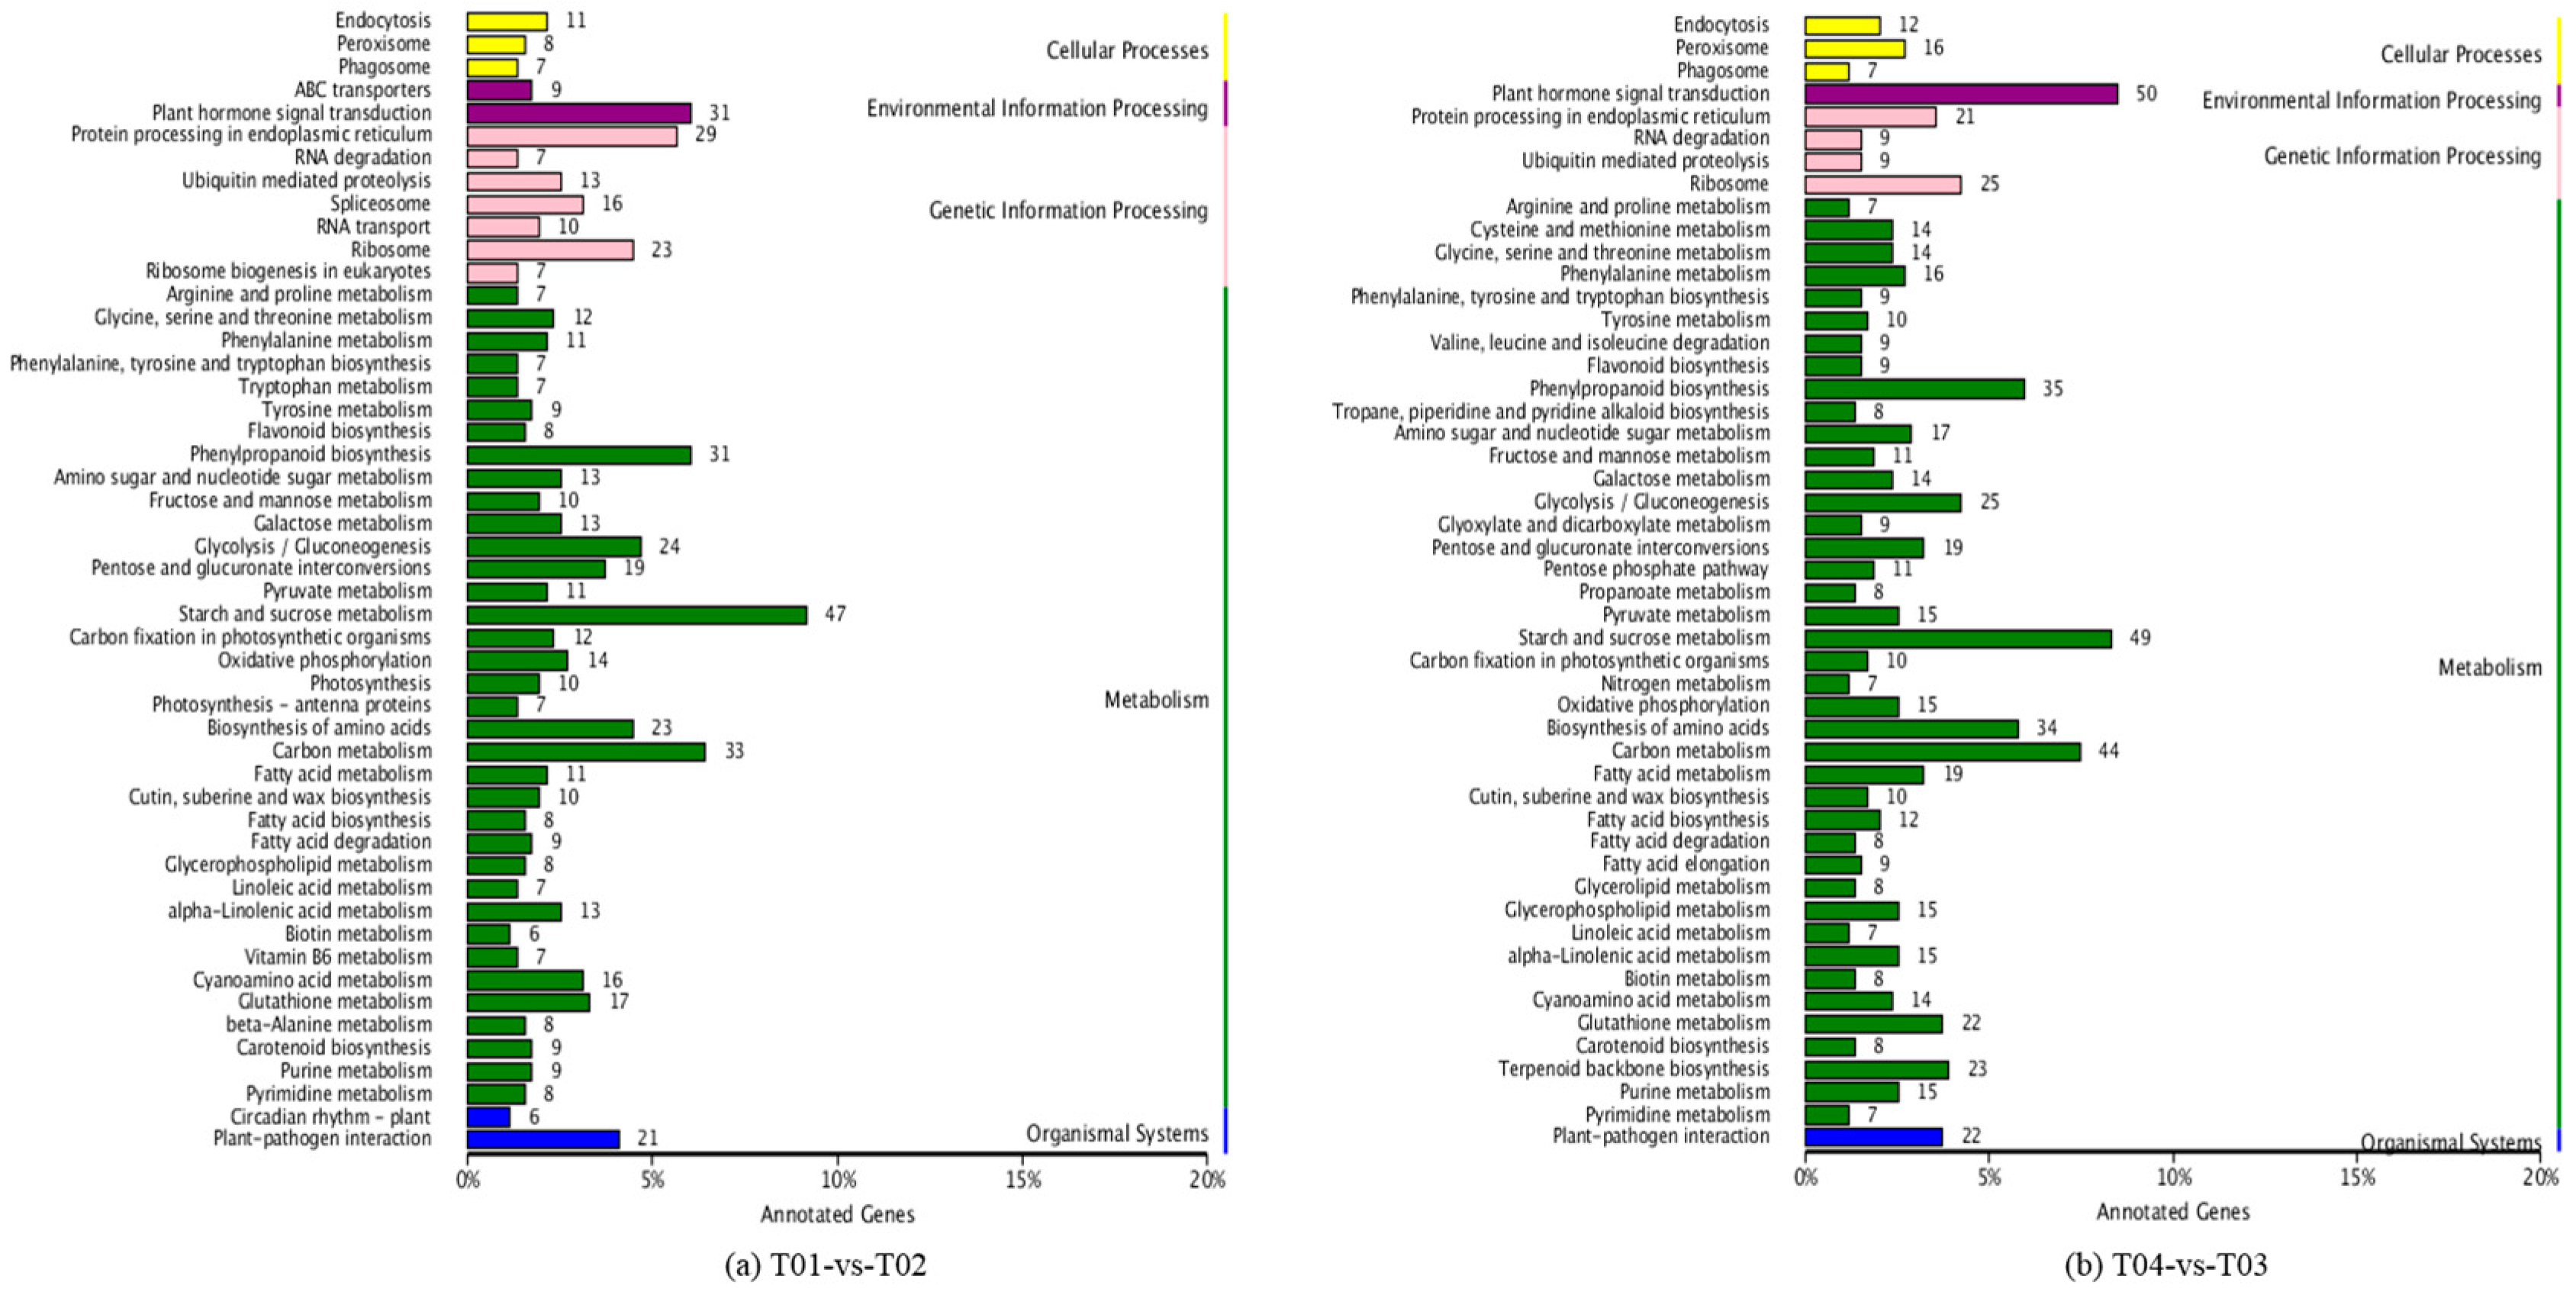
Four peony transcriptome samples (T01–T04) were sequenced in this study and, following de novo assembly and alignment to publicly available databases, a total of 28,347 annotated unigenes, 36.04% of the total, were identified. The GO classification of T01- vs. -T02 was compared with that of T03 vs. T04, and both were found to be enriched in 49 functional categories, mainly “response to stimulus”, “biological regulation”, “cell part, “organelle”, “catalytic activity”, and “binding”. Subsequently, KEGG pathway analysis revealed that the principal enriched pathways comprised “plant hormone signal transduction”, “metabolic pathways”, and “secondary metabolic pathways”. The above analysis therefore indicated that genes related to plant hormone signaling, cell metabolism, and secondary metabolism play important roles in flower development in peony. In addition, comparing T04 (late-flowering mixed pool) vs. T01 (late-flowering pool), there were 3257 DEGs, of which 1398 were up-regulated and 1859 were down-regulated; comparing T03 (early-flowering mixed pool) vs. T02 (early-flowering pool), there were 4415 DEGs, of which 1398 were up-regulated and 1859 were down-regulated.
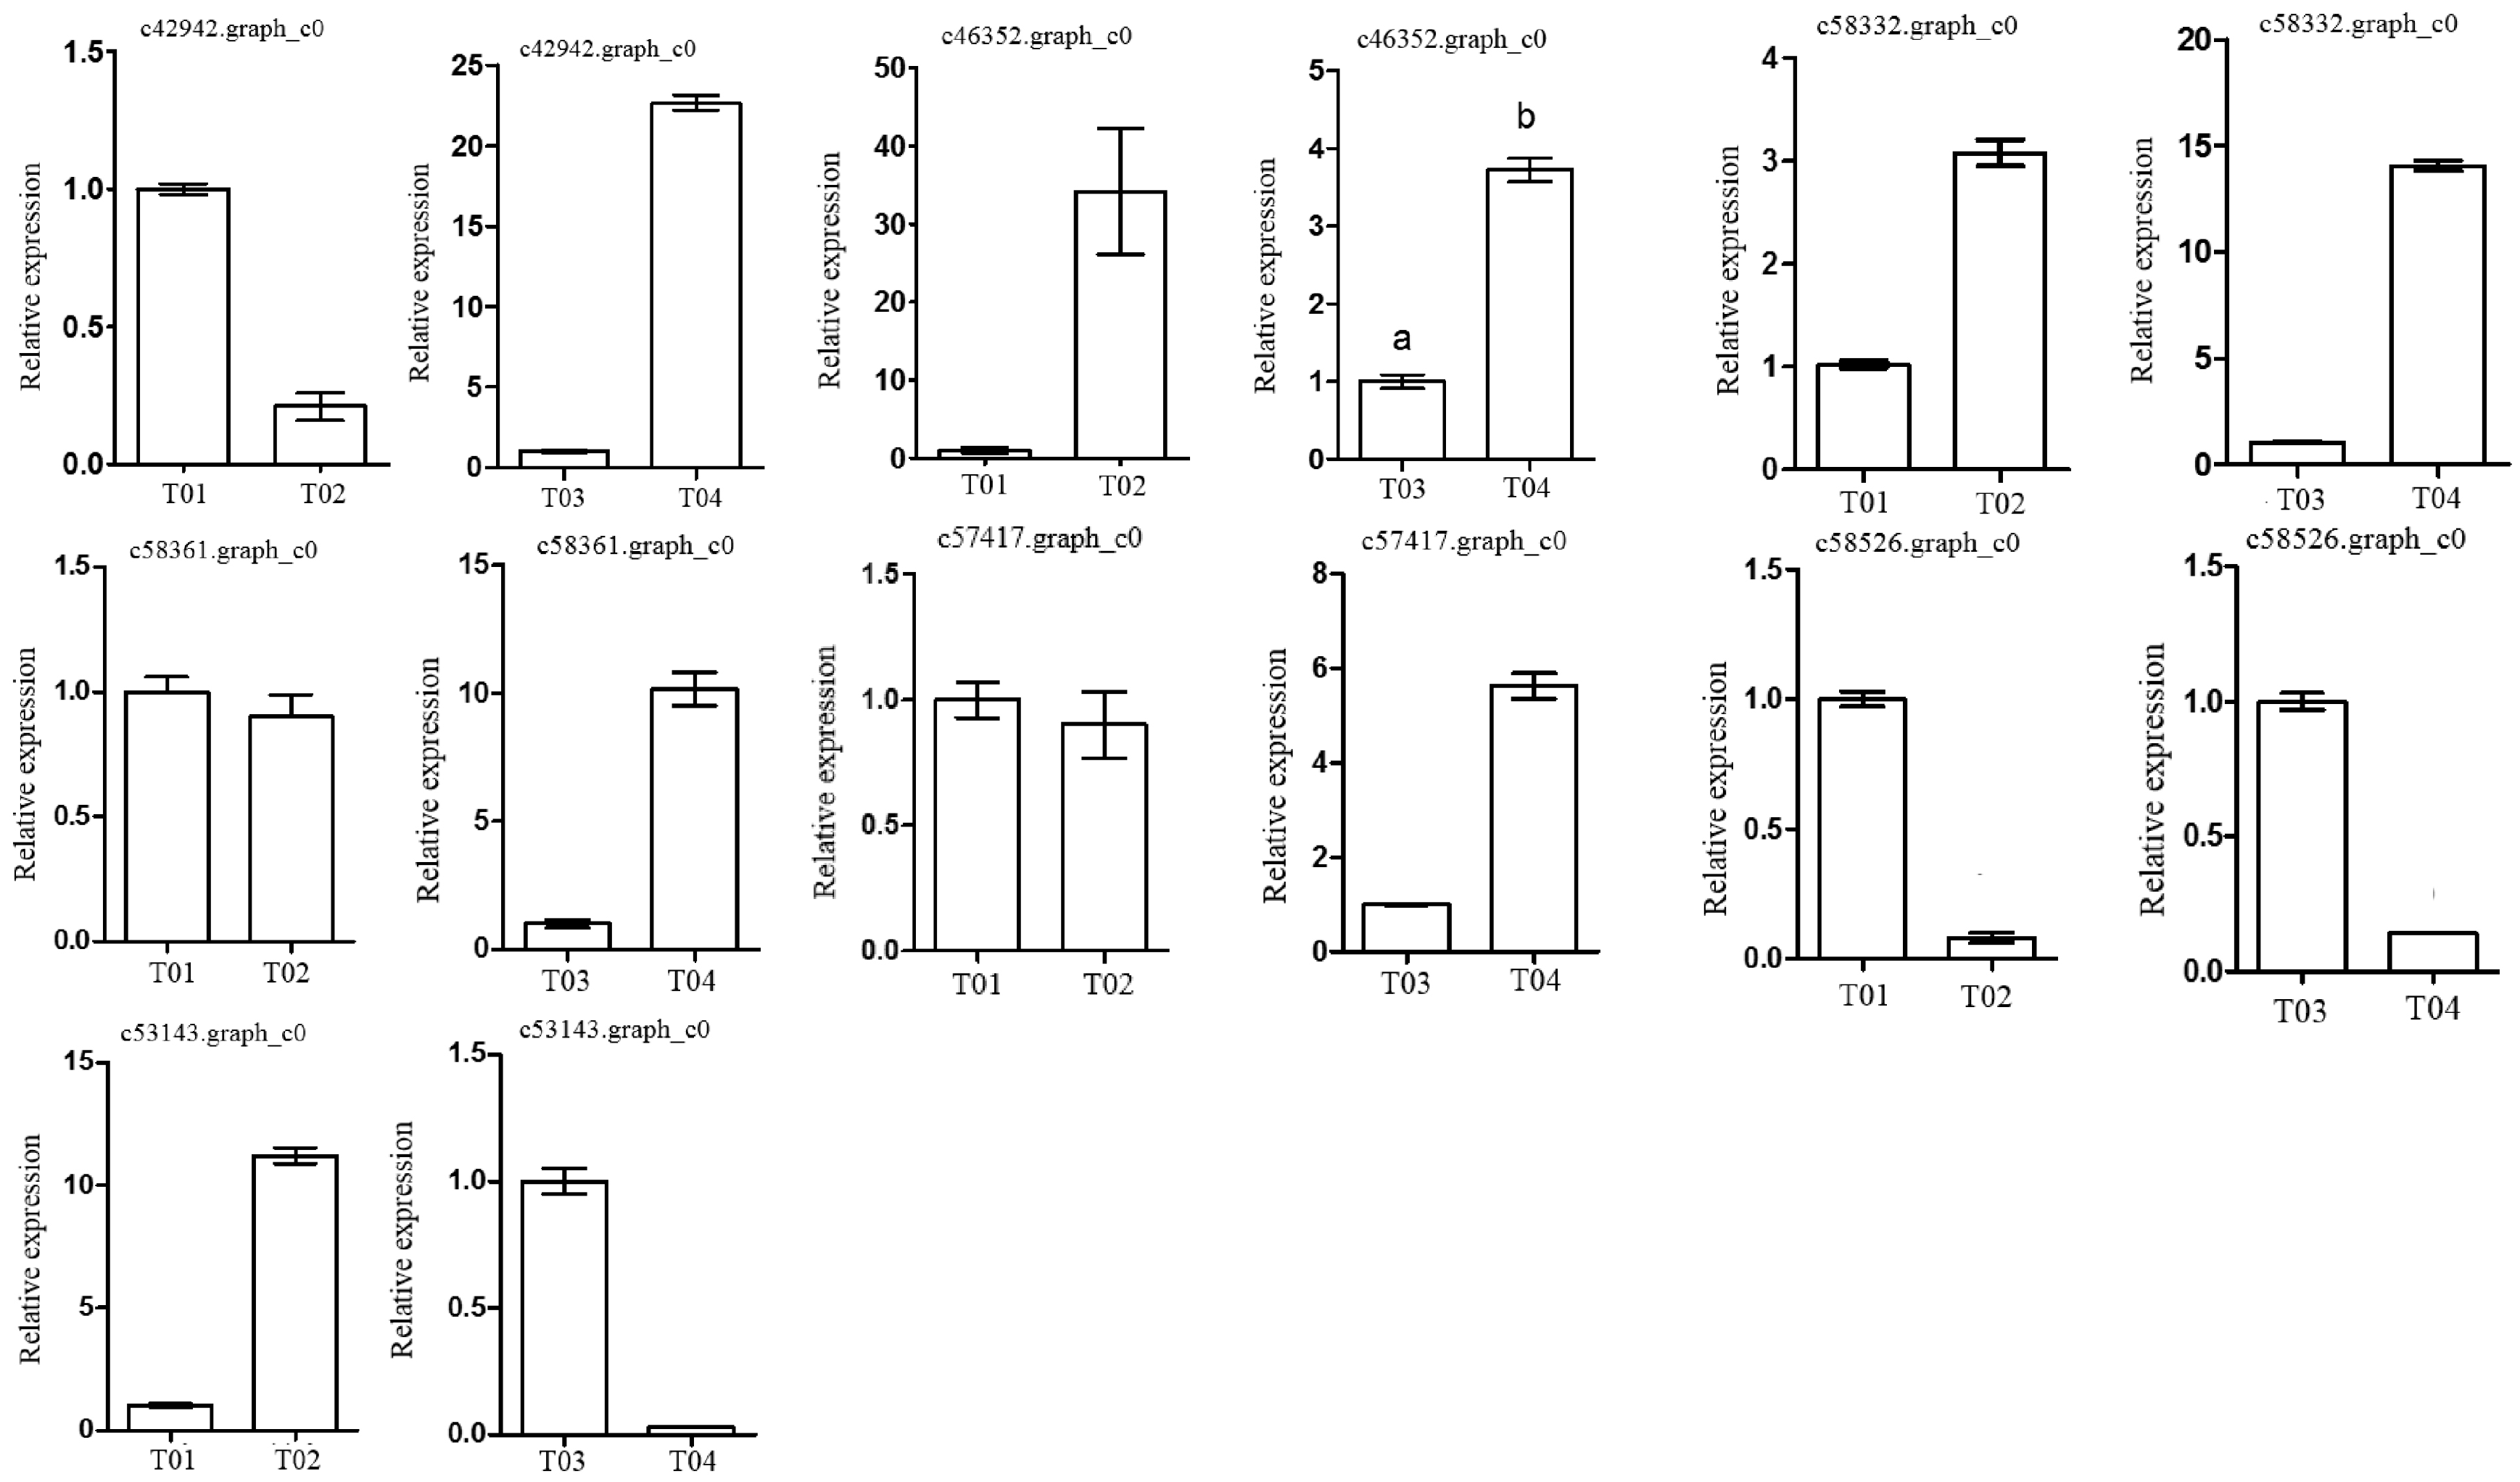
Following the BSR-seq association study, a total of seven genes involved in peony flowering were selected for functional annotation, notably
c57417.graph_c0, encoding a “removing wall acetylation” (RWA) protein, an epigenetic gene. This gene plays an important role in acetylation processes in the plant cell, and has a direct impact on the formation of cell wall polysaccharides and on related cellular functions; it affects morphology, flowering, and other plant traits, depressing the expression of
FLC and initiating flowering [
24]. Interestingly, the expression level of the gene in the late-flowering pool was lower than in the early-flowering pool, indicating that the action of the gene might be unique. The gene encoding a K
+-ion transporter protein (
c58332.graph_c0) relates to one of the three principal mineral elements that are essential for plant growth and changes in its expression could therefore have important physiological and biochemical effects. The gene
c58526.graph_c0 could regulate plant flowering via a signal transduction process.
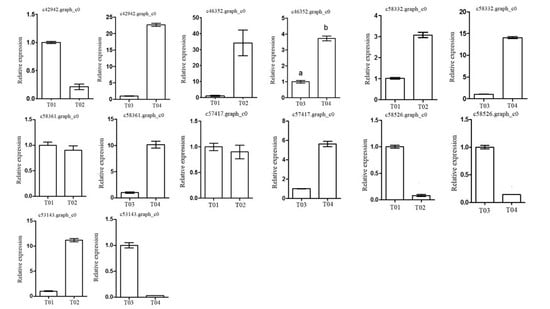
These screened genes were verified via qRT-PCR, which showed that although the expression levels of the genes in the two pairwise comparisons (T01- vs. -T02 and T04- vs. -T03) were different, the trend was consistent. The quality of the peony petal transcriptome database constructed in this study was high, and the database provides an accurate and information-rich resource for future research related to peony flowering. However, because of the large apparent variation in flowering time phenotype in the F
1 generation, which may reflect the large genetic variation between the two parental cultivars,
P. ostti ‘Feng Dan’ (early-flowering) and
P. suffruticosa ‘Xin Riyuejin’ (late-flowering), and heterosis and inbreeding depression may occur in the F
1 generation. These factors could cause epistasis or genetic interaction, and this could affect the functioning of the genes identified [
49,
50]. All these functionally annotated genes should therefore be further validated in future studies.
In addition to the seven genes mentioned above, other genes related to the four genes
PsFT,
PsVIN3,
PsCO, and
PsGA20OX are known to play important roles in the regulation of the repeat-flowering process in tree peony [
37,
38], including the unigenes
c23725.graph_c0 and
c43875.graph_c0, which may be related to the MADS-box protein SOC1,
c6585.graph_c0, which may be related to gibberellin 20 oxidase, and the
c51656.graph_c0,
c30761.graph_c0, and
c30761.graph_c0 unigenes, which may be related to the VIN3 protein. Further attention needs to be paid to these particular unigenes in future work.
In this study, the identification of genes potentially associated with peony flowering has shed light on potential control mechanisms and their possible commercial application in peony. Further studies are needed to elucidate specific functions and possible interactions at the molecular level. In other respects, the SSR and SNP markers that have been identified will be useful for characterizing the genetic diversity of peony genetic germplasm resources and for genome-wide association studies (GWAS), thus providing a theoretical basis for the conservation of germplasm and for the molecular-assisted breeding of peony.
4. Materials and Methods
4.1. Plant Materials
P. ostti ‘Feng Dan’ (an early-flowering cultivar) ×
P. suffruticosa ‘Xin Riyuejin’ (a late-flowering cultivar) were hybridized, and the two parents and 20 early- and late-flowering individuals from the F1 population selected at the full-bloom stage were used to construct BSA segregation groups [
51]. The flowering times of the F1 population and of the parent cultivars are given in
Table S4 (Supplementary Materials 2). Flower petals from the parent cultivars and the 40 F1-population individuals were collected from a farm at the Henan University of Science and Technology Experimental Station, Luoyang, China (34°60 N, 112°42 E) in April 2015. All samples were frozen in liquid nitrogen immediately after collection in the field and were stored in a −80 °C freezer pending RNA extraction.
4.2. RNA Extraction and Illumina Sequencing
Total RNA was extracted from tree peony petals using a RNA prep Pure Plant Kit (Polysaccharides & Polyphenolics-rich) (Tiangen, Beijing, China). RNA quality and concentration were assessed by electrophoresis on a 1.2% agarose gel and using a NanoDrop 2000 UV-Vis Spectrophotometer (Thermo Fisher Scientific, Wilmington, DE, USA), respectively. RNA samples were taken from each of four groups: T01 (male bulk, ‘Xin Riyuejin’, late-flowering), T02 (female bulk, ‘Feng Dan’, early-flowering), T03 (20 early-blooming flowers), and T04 (20 late-blooming flowers). These were then analyzed by Biomarker Technologies Corporation (Beijing, China).
The bulked RNA was enriched for mRNA using Oligo (dT) Beads and then randomly-cleaved into short fragments. First-strand cDNA was synthesized from mRNA using random-hexamer primers. DNA polymerase I, RNase H, dNTPs, and buffer were used to synthesize the second-strand cDNA. The double-stranded cDNA was then purified using an AMPure XP beads kit and end-repaired, and then a single nucleotide A (adenine) addition was ligated to the sequencing adapters. The required fragments were selected using AMPure XP beads and enriched by PCR amplification to create the final cDNA library. Finally, the mRNA-seq library was constructed for paired-end sequencing (reads = 125 bp) on the Illumina HiSeq TM2500 sequencing platform (Biomarker Technologies Corporation Beijing, China). In addition, library concentration and insert size were assessed using Qubit 2.0 Fluorometer (Life Technologies, Carlsbad, CA, USA) and an Agilent 2100 Bioanalyzer (Agilent Technologies, Waldbronn, Germany), and Q-PCR (an Applied Biosystems Step One machine, Applied Biosystems, Foster City, CA, USA) was used to accurately quantify the effective concentration of the library and to ensure its quality.
4.3. De Novo Assembly and Quality Control
In order to obtain high-quality clean reads data for de novo assembly, the raw data reads were filtered to remove adaptor sequences and low-quality sequences containing unknown bases (reads with ‘N’ bases) > 10% and with a Q-value < 20. At the same time, the Q20, Q30, and GC content of the clean data were calculated. All the downstream analyses were based on high-quality clean data. After obtaining the clean data, reads assembly was accomplished using Trinity software (
http://trinityrnaseq.sourceforge.net/) [
52]; the diversiform clean reads were assembled with transcripts characterized by the same subcomponent being regarded as a gene and the longest transcript of each gene being selected and defined as the unigene.
4.4. Unigene Functional Annotation and Gene Structure Analysis
4.5. Gene Expression Quantification
Reads of each sample sequenced were aligned with the unigene library using Bowtie [
62], and then the level of expression was estimated based on the alignment results and RSEM [
63]. Subsequently, the expression level of the unigene was expressed as FPKM (Fragments Per Kilobase of transcript per Million mapped reads) [
64]. FPKM can eliminate the influence of the difference between gene length and the amount of sequencing on the calculation of gene expression, hence permitting gene expression differences to be compared among different samples.
4.6. Analysis of Genes with Differential Expression (DEGs)
The recognized effective Benjamini–Hochberg method was used to correct the significant
p-value that was obtained from the original hypothesis test among the differentially expressed genes (DEGs) analysis. Finally, the corrected
p-value, the False Discovery Rate (FDR), was used as a key indicator of DEGs screening and a false-positive test was performed to reduce the expression value of a large number of genes independently. The DEGs (FDR < 0.01 and Fold Change (FC) ≥ 2) were identified by EBseq [
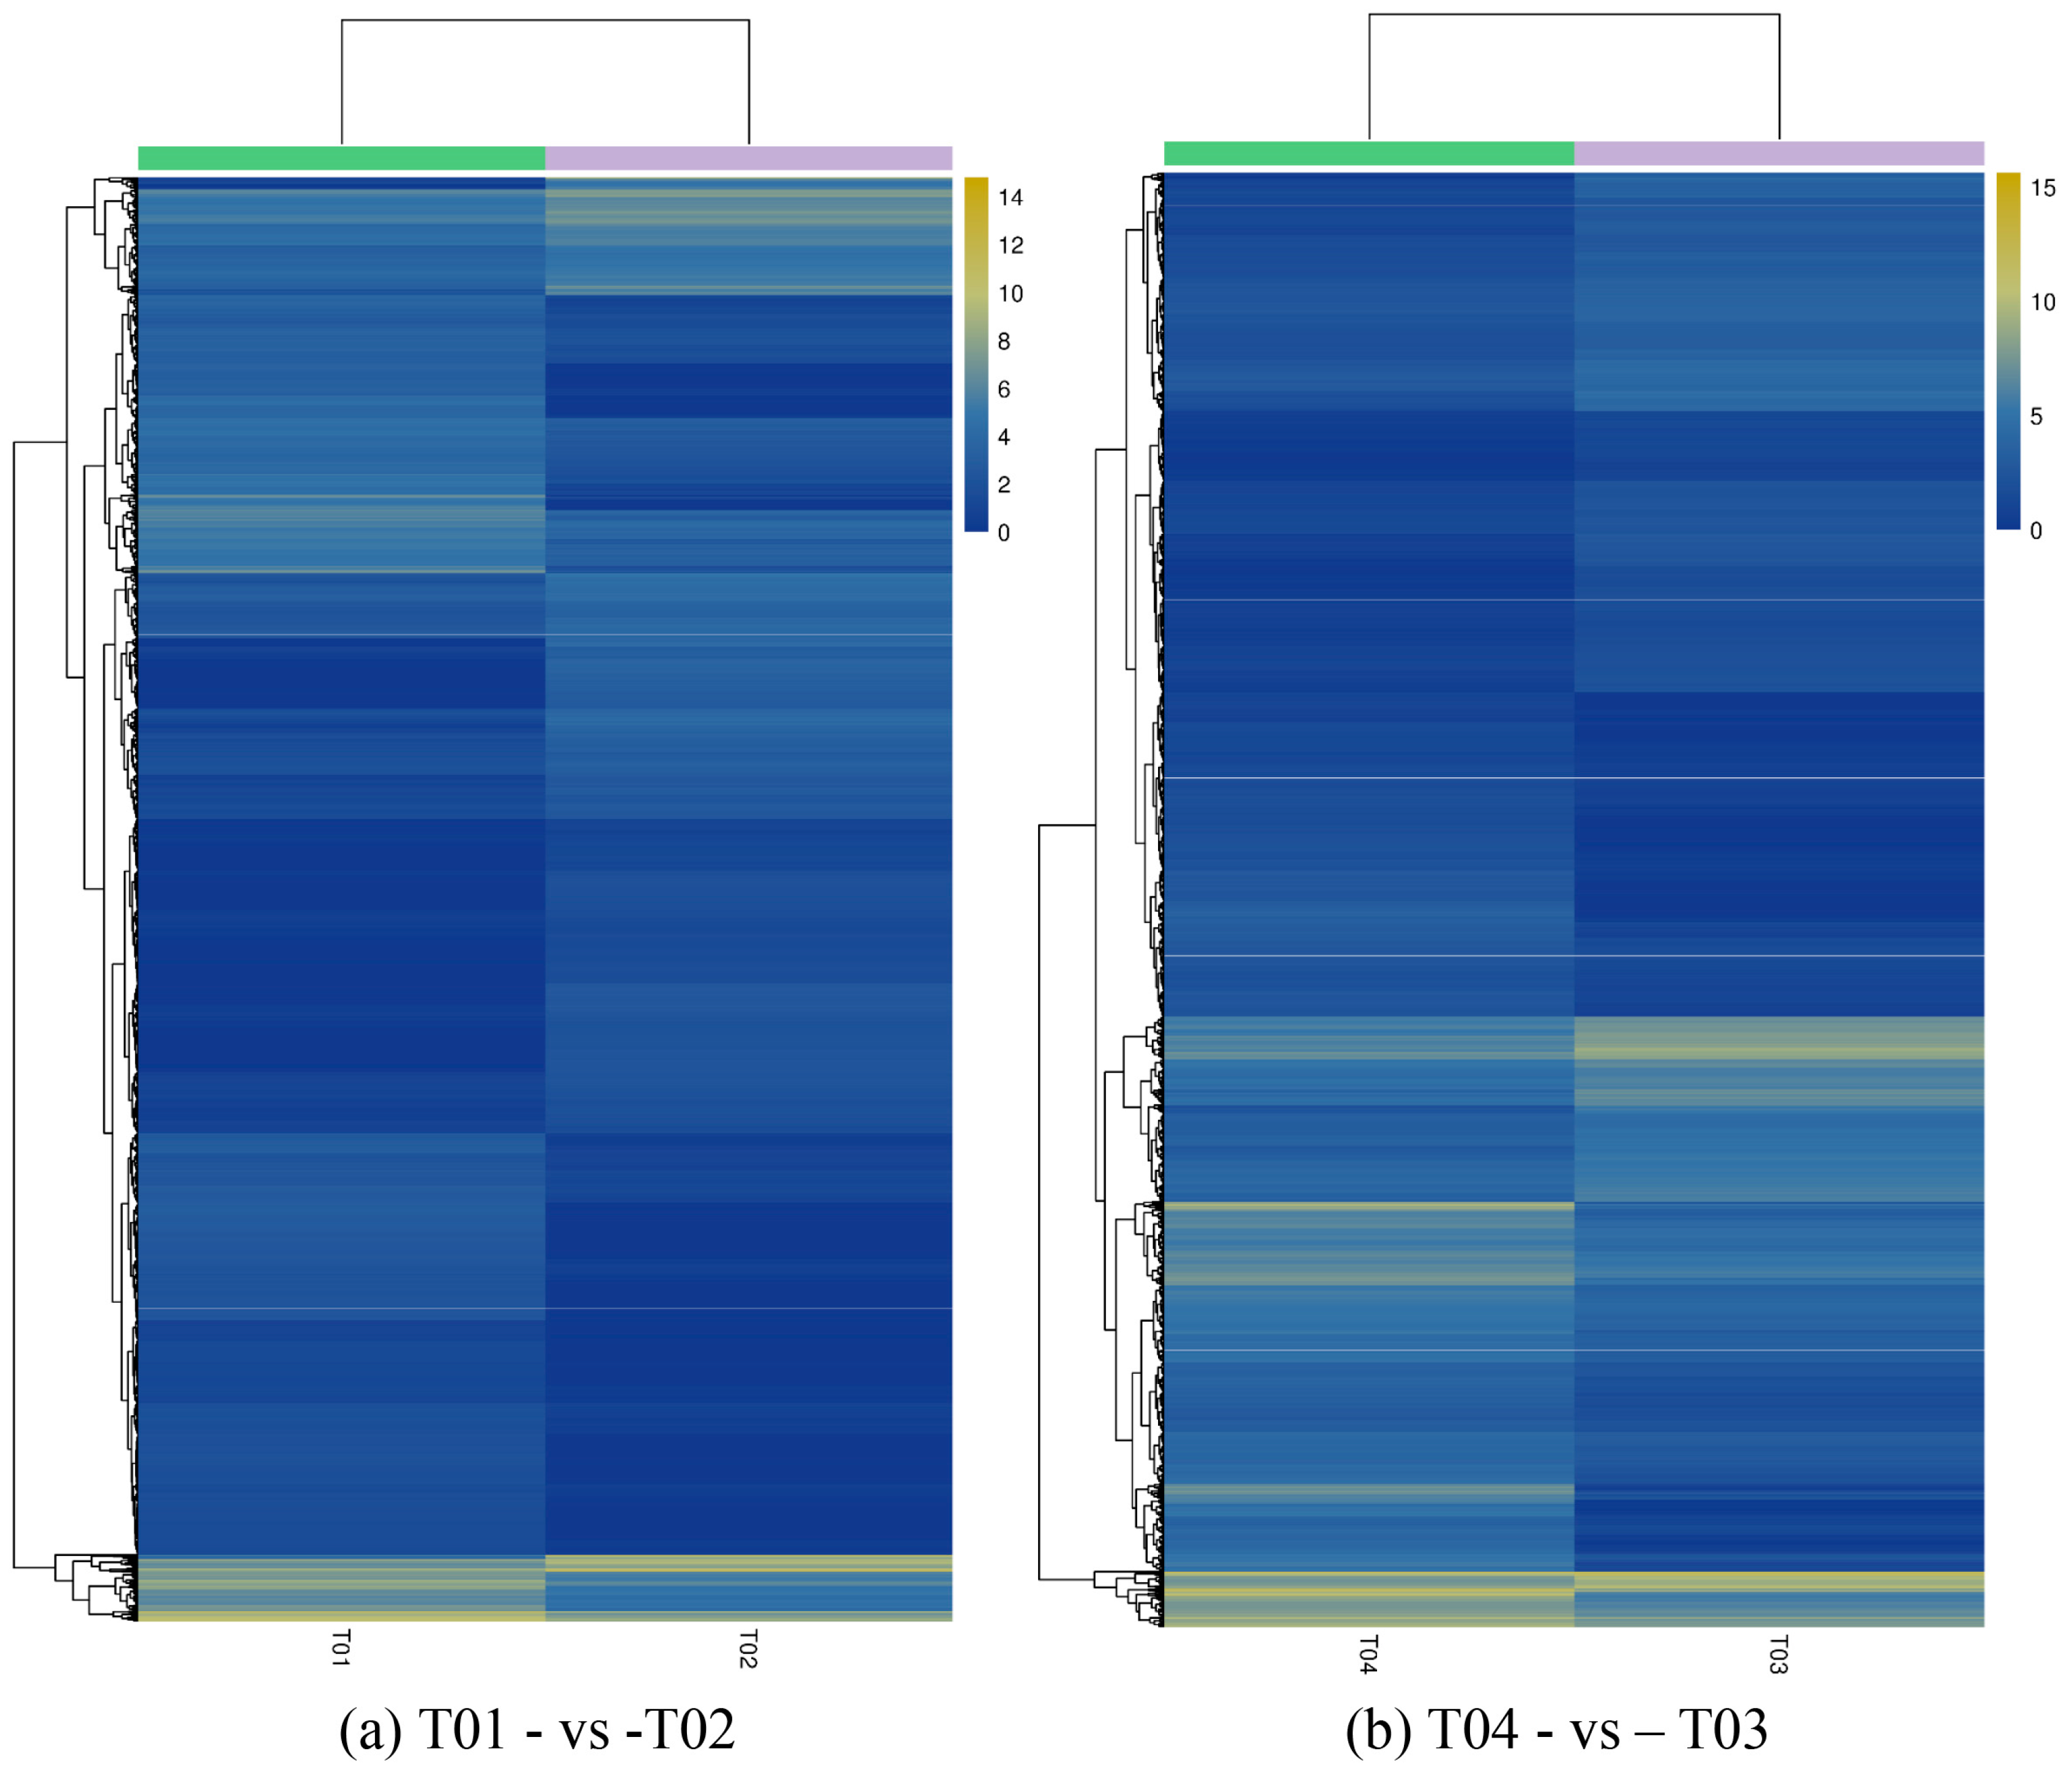
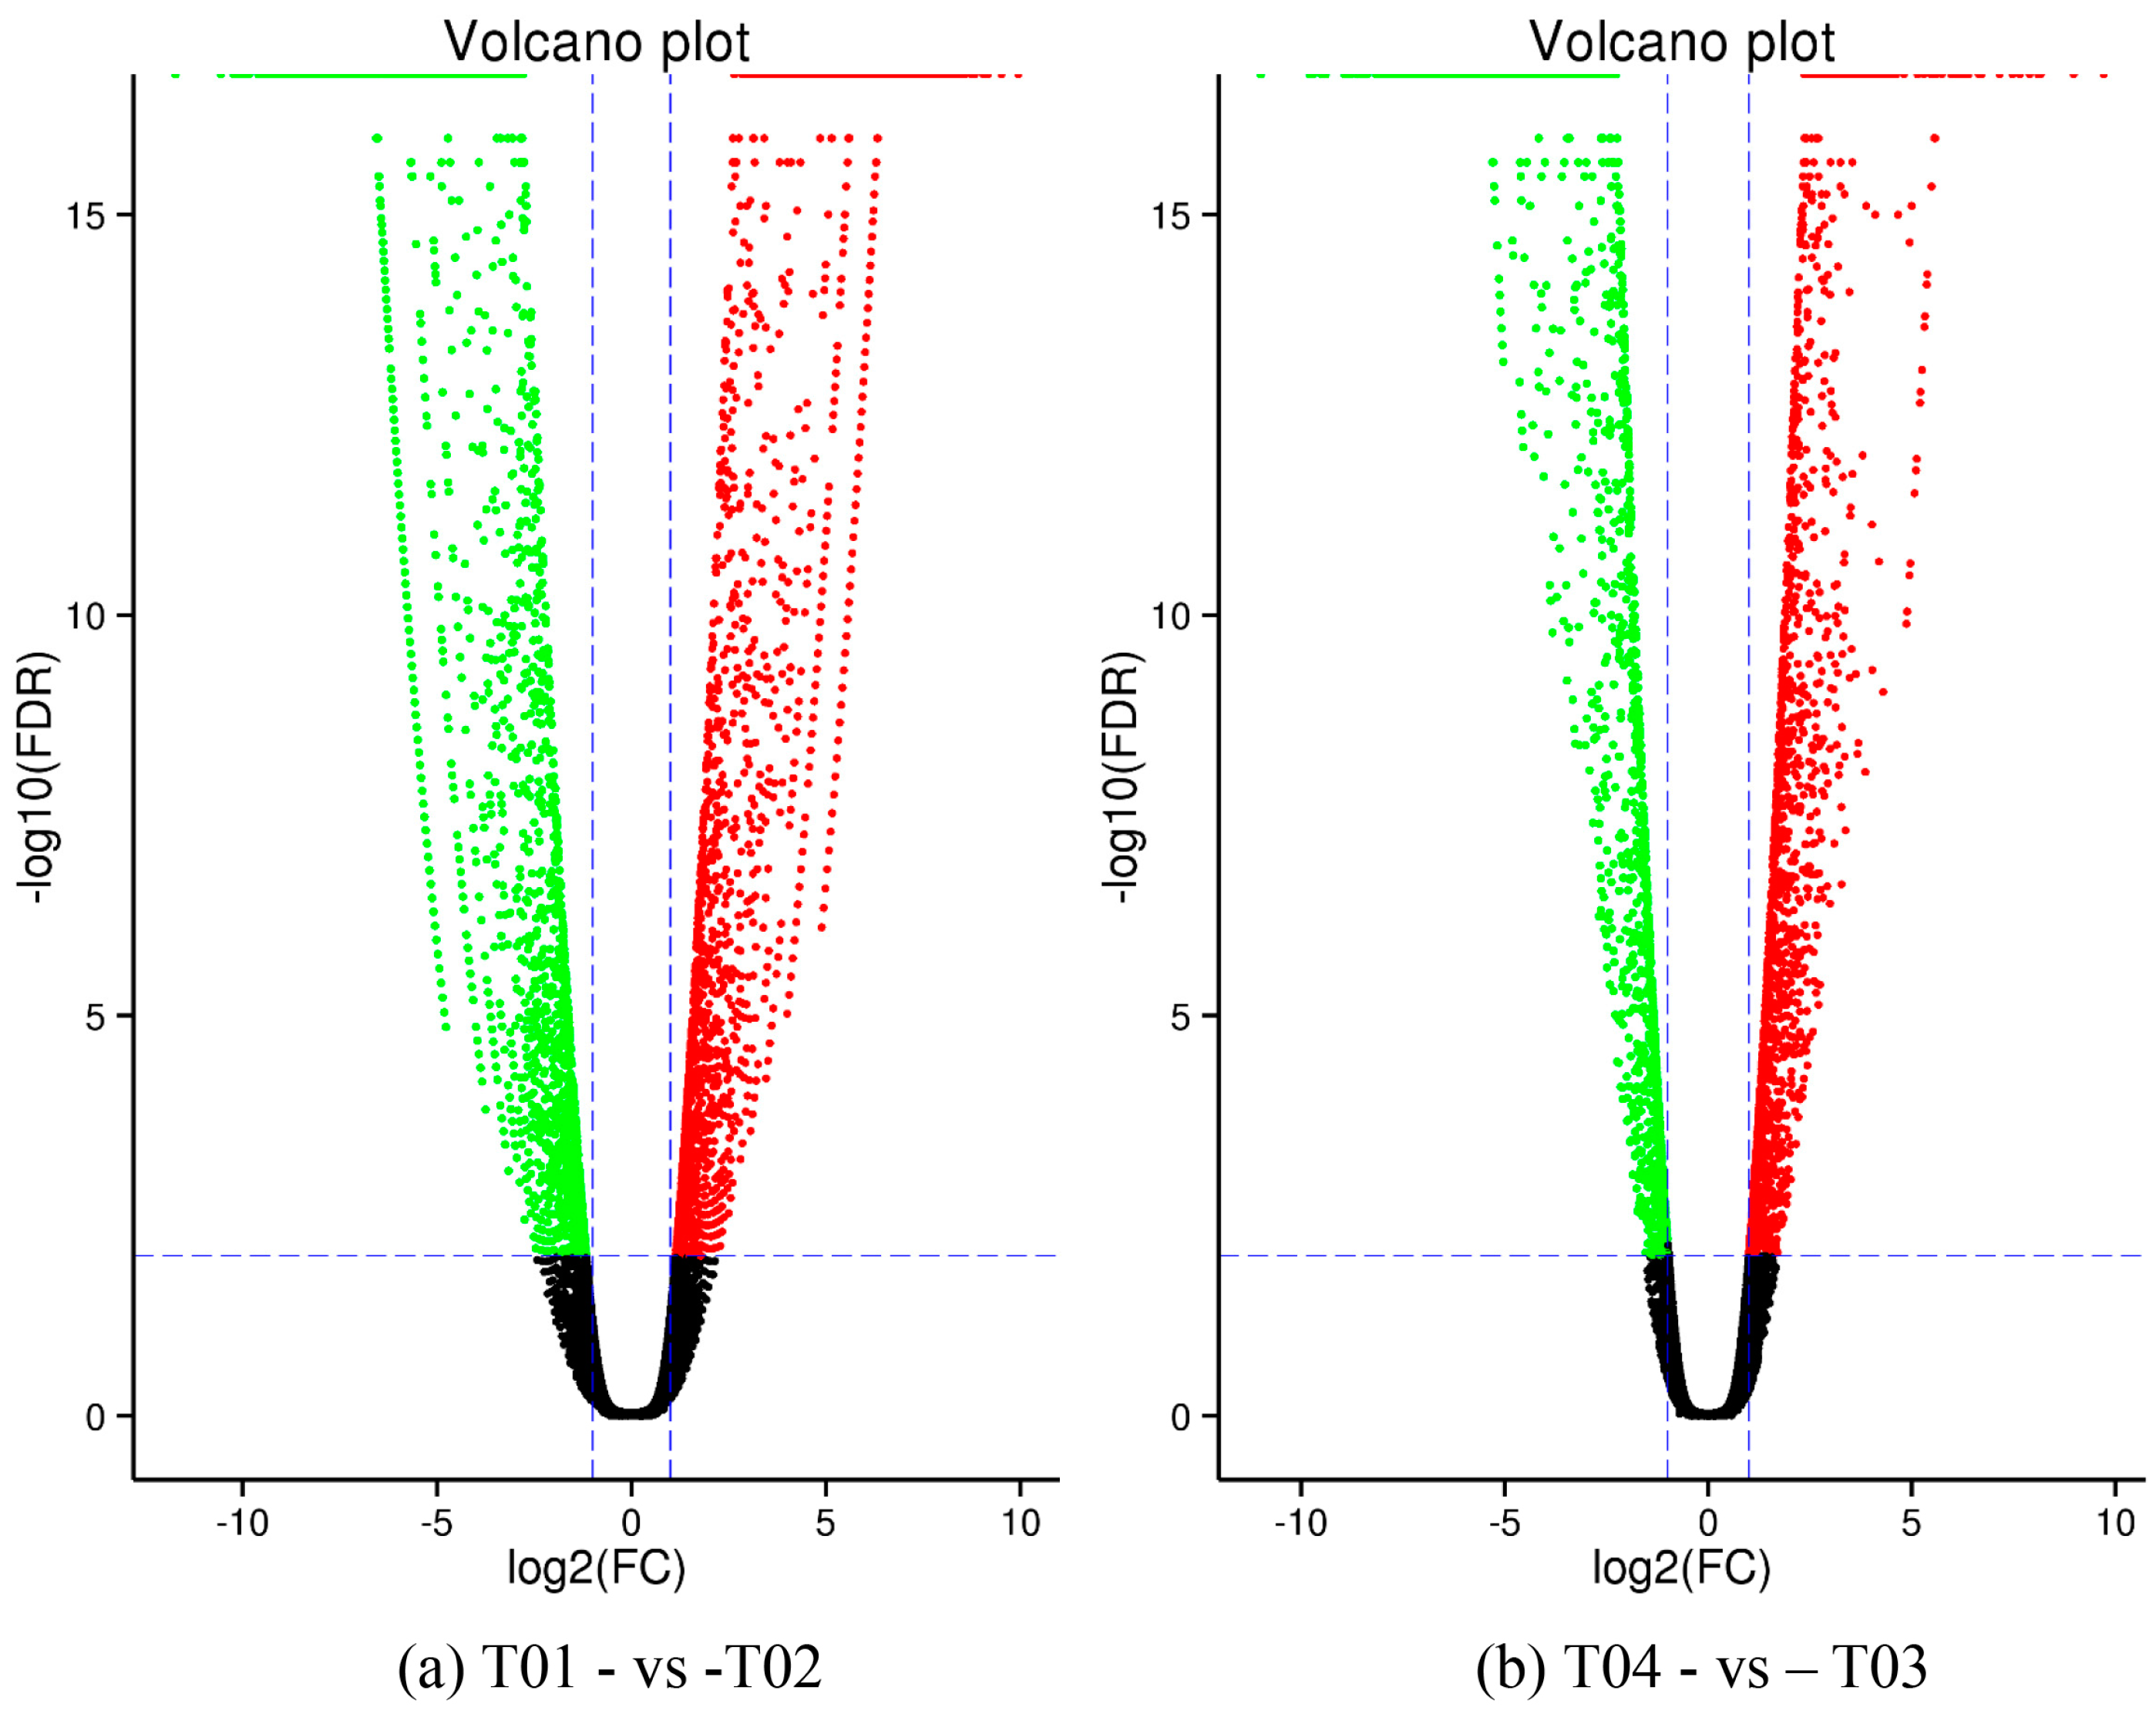
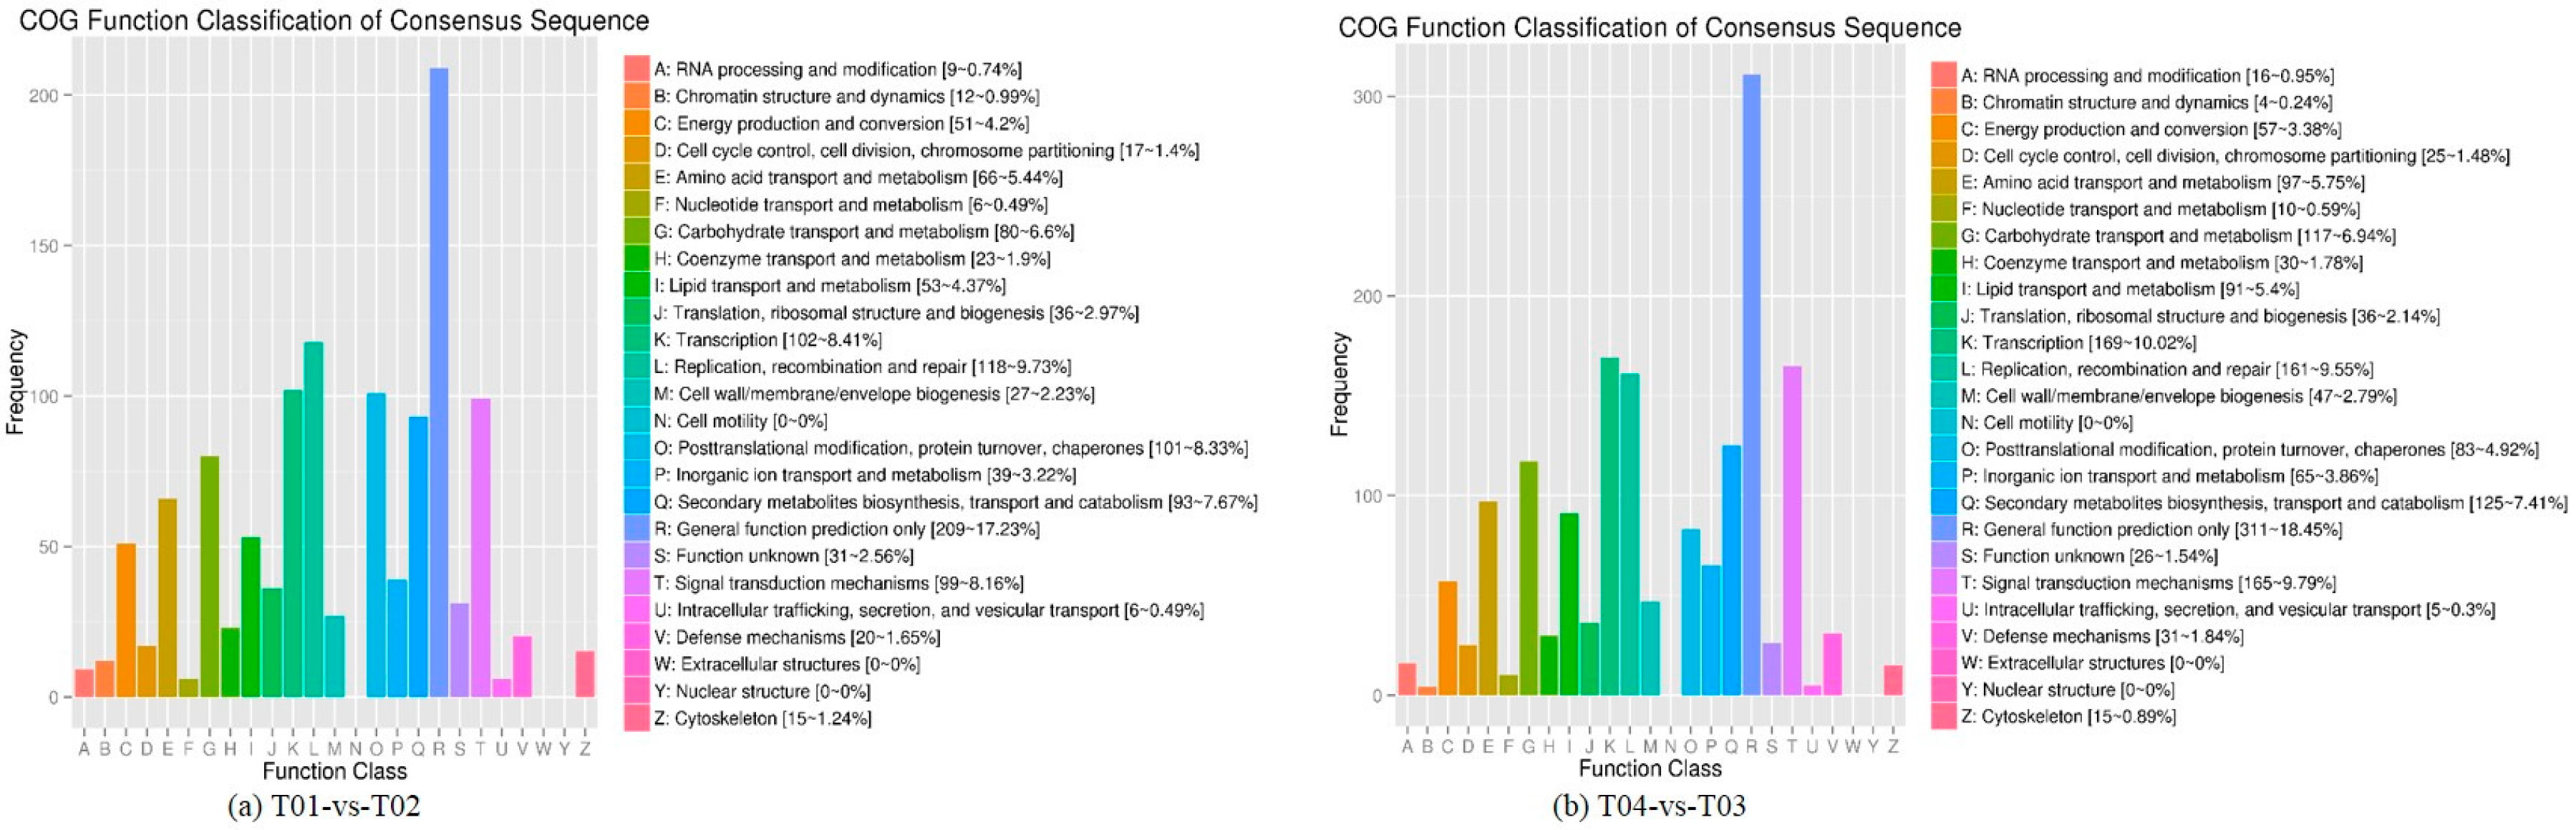
44], of which FC represents the ratio of expression between two samples (groups). In our study, four groups (T01, T02, T03, and T04) were compared with each other (T01- vs. -T02, T03 vs. T01, T03 vs. T02, T04 vs. T01, T04 vs. T02, and T04- vs. -T03) to screen out genes related to early and late flowering of peony. A volcano plot was created to intuitively show the significance of the DEGs, and a MA diagram was created to identify the distribution of gene expression abundance and differential multiples between pairs of groups. Furthermore, a hierarchical cluster analysis that clustered genes with the same or similar expression was performed to display the differential expression patterns of genes under different experimental conditions. Finally, the identified DEGs were subjected to functional annotation by databases including GO, COG, and KEGG.
4.7. BSR-Association Study and Candidate Genes Identification
The reads and unigene sequences were compared for each sample using STAR (
http://code.google.com/p/rna-star/) [
65] and the Single Nucleotide Polymorphism (SNP) site and then identified by GATK (
https://www.broadinstitute.org/gatk/) [
66]. In order to ensure the accuracy of subsequent analysis, loci for which the read support was <3 were first filtered out. To obtain high-quality reliable SNP sites and to identify through association analysis loci differing between T03 and T04, SNP discrepant-type loci were filtered out through T03 + T01 and T04 + T02, homoplastically, and then SNP consistent-type loci were filtered out through T03 + T04. The Euclidean Distance (ED) algorithm was used to calculate the region that related to the objective gene linkage. The arithmetic was based on the depth of the SNP discrepancy between T03 and T04 and the ED value was calculated according to the following formula (Equation (1)):
The higher the ED value, the greater the difference between T03 and T04 in SNPs. In order to eliminate the difference in the ED results caused by differences in sequencing between the two mixed pools, we used the frequency of each base at each locus instead of the absolute value to calculate the ED value, and this was raised to a power of 5 (ED5) to eliminate the noise generated by small variations in the estimations in our study.
Because of the lack of genomic information for peony at the chromosome level, we used the following analysis strategy in order to determine a credible association area: (1) The ED values for all loci were calculated and ED = 0.74 was used as the associated threshold; (2) Loci that exceeded the association threshold were selected and served as candidate association loci; (3) Statistics of the number of SNPs and candidate loci for every unigene difference between T03 and T04 were recorded; (4) The probability of the accumulation of association sites in each unigene was calculated from the hypergeometric distribution, calculated as follows (Equation (2)):
In the above formula, M represents the total number of differences in SNPs between the T03 and T04 mixed pools, K represents the total number of all candidate association loci, and Y represents the number of candidate association loci in the unigenes; (5) The Benjamini–Hochber method was used to multiply and correct the test for the probability of each unigene enrichment-associated locus, and then calculate the FDR value; (6) Unigenes with significant enrichment-associated sites (FDR < 0.01) were screened. Thereafter, the identified SNP-associated genes were subjected to functional annotation by databases including GO, COG, and KEGG.
4.8. Quantitative Real-Time PCR (qRT-PCR) Verification of Candidate Genes
To study candidate gene expression profiles in the four samples (T01, T02, T03, and T04), we selected the relatively stably expressed peony
Actin gene as a reference gene for qRT-PCR [
67]. cDNA synthesis was performed as described earlier (
Section 4.4). Quantitative real-time PCR was performed on a CFX ConnectTM Real-Time PCR System (Bio-Rad, Hercules, CA, USA). The primer information for
Actin and the candidate genes is shown in
Table A3. Each PCR reaction was repeated three times and the volume of the qPCR reaction was 20 μL. The cycling protocol consisted of 3 min at 94 °C, followed by 40 cycles of 15 s at 94 °C for denaturation, 15 s at 55 °C for annealing, and 20 s at 72 °C for extension. The specificity of the PCR reaction was assessed by the presence of a single peak in the dissociation curve after the amplification. Relative expressions of target genes were analyzed using the 2
−ΔΔCt algorithm [
68], in which CT values of reference genes are calculated with a geometrical.


