2.2. Performance of Quantitative Structure-Activity Relationship
To evaluate the performance of the developed
Kp QSAR, the log values of experimental
Kp for the compounds included in the datasets were compared to those predicted by the model.
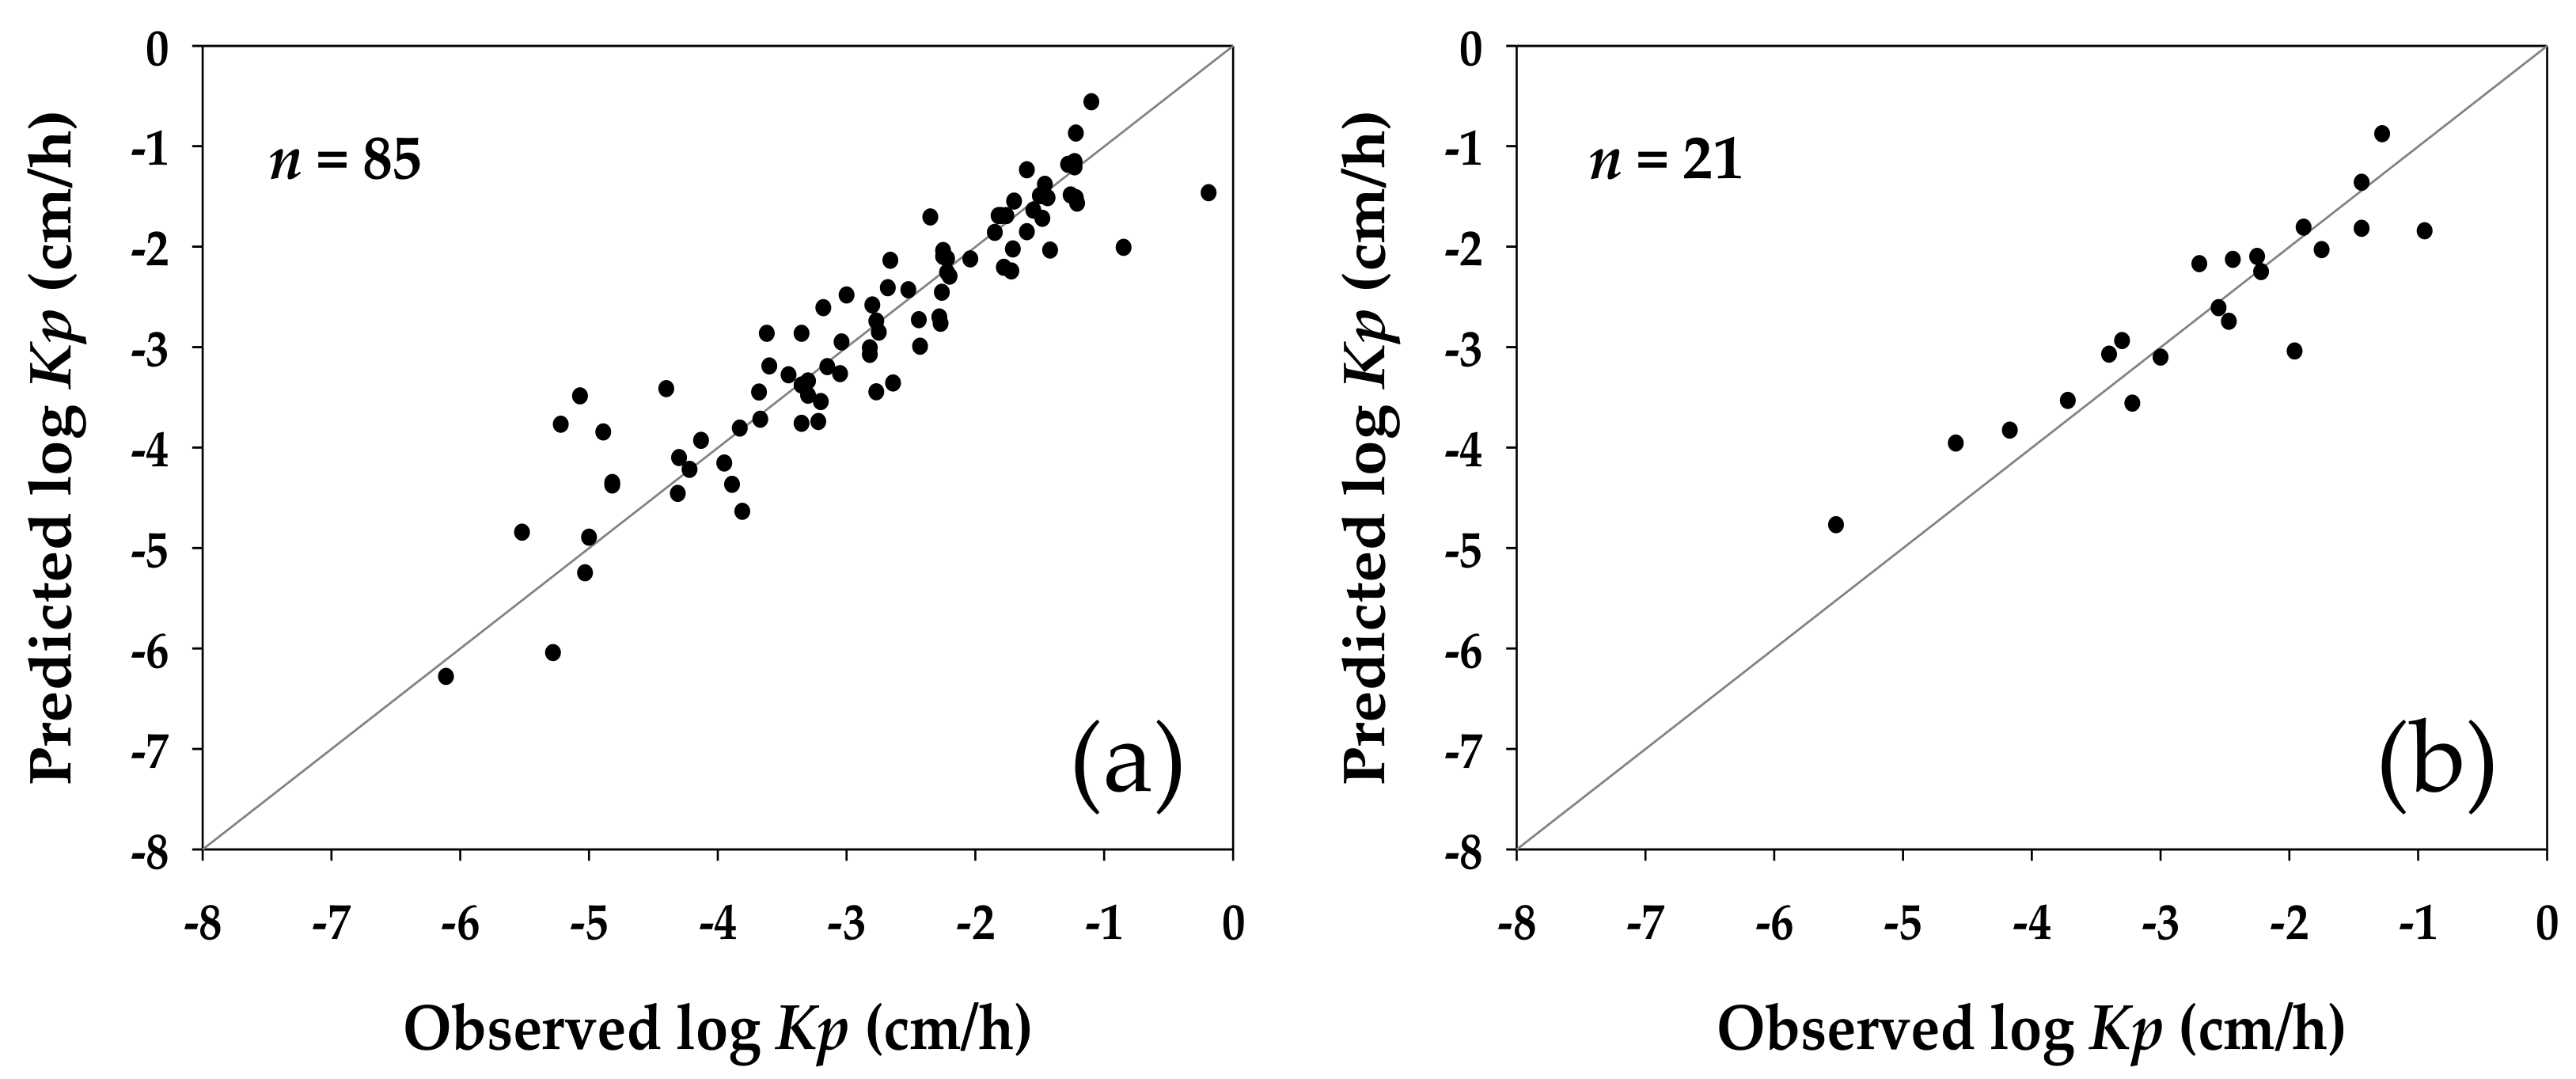
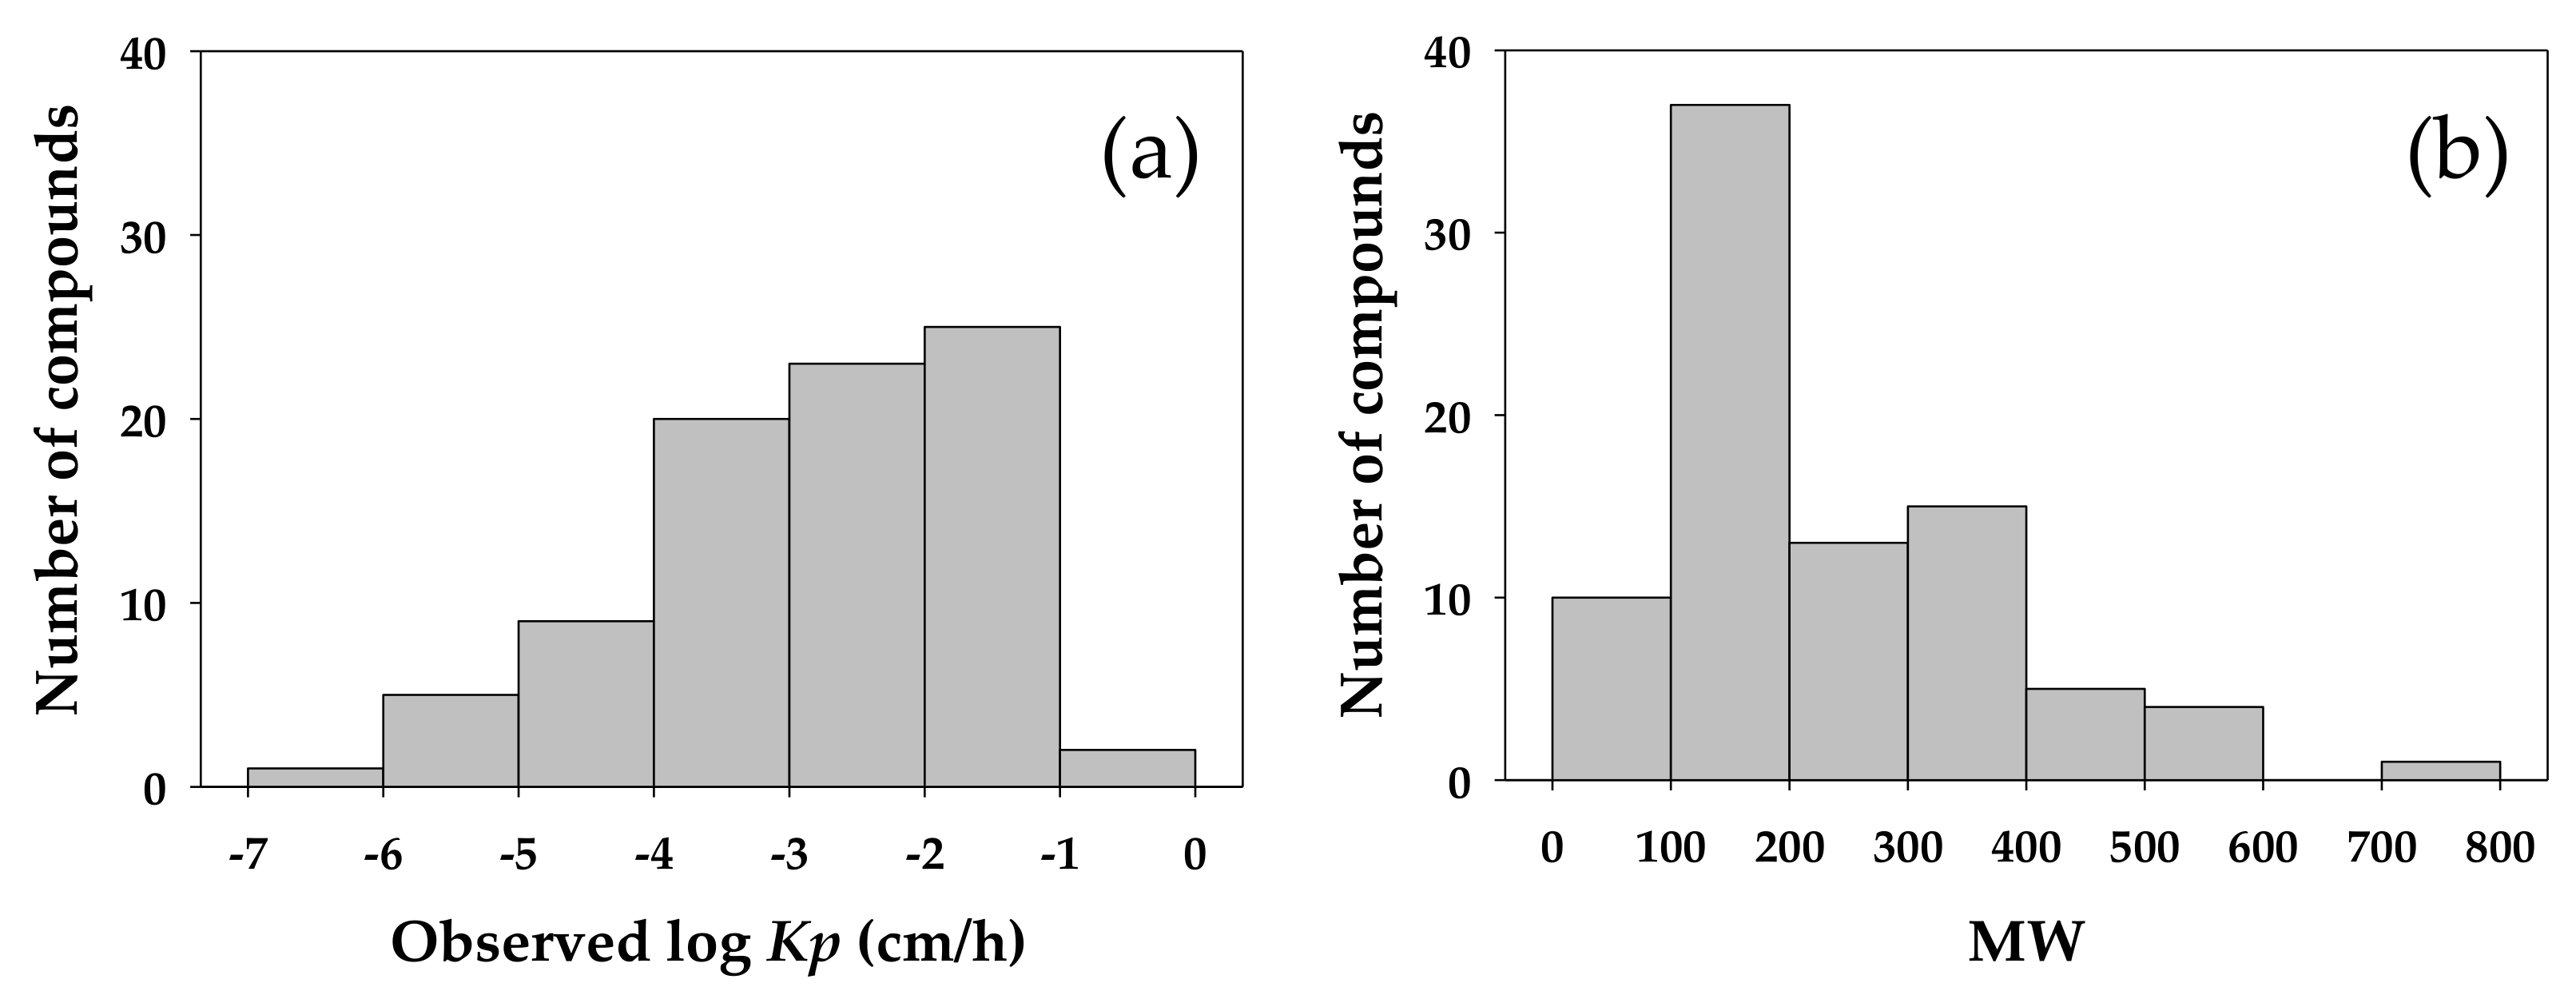
Figure 1 shows the relative distribution of the log
Kp predicted by the model against their counterparts observed in the original experiments for the compounds in the training and validation sets; and
Table 4 summarizes the fitting ability and predictive capability of the developed model in statistical terms. As the analysis demonstrated, there were no significant outliers found in either case.
A rule of thumb commonly adopted in the development of QSAR for practical application is: the difference between
R2 and
Q2 must not be too large and preferably not exceeding 0.2–0.3. In addition, a value of
Q2 greater than 0.5 is regarded as an indication of good performance, and a value greater than 0.9 as an indication of excellent performance [
25]. As shown in
Table 4, the fitting ability, as demonstrated in
R2 for the developed
Kp QSAR, was 0.858; and the predictive capability, as in
Q2, was 0.839. The difference between
R2 and
Q2 of the proposed model was 0.019. These results suggested that the developed QSAR was of an adequate predictive power for the estimation of log
Kp. Moreover, the level of error observed in the predicted value of
Kp was of a reasonable level, considering the variation inherent in the experimental determination of
Kp.
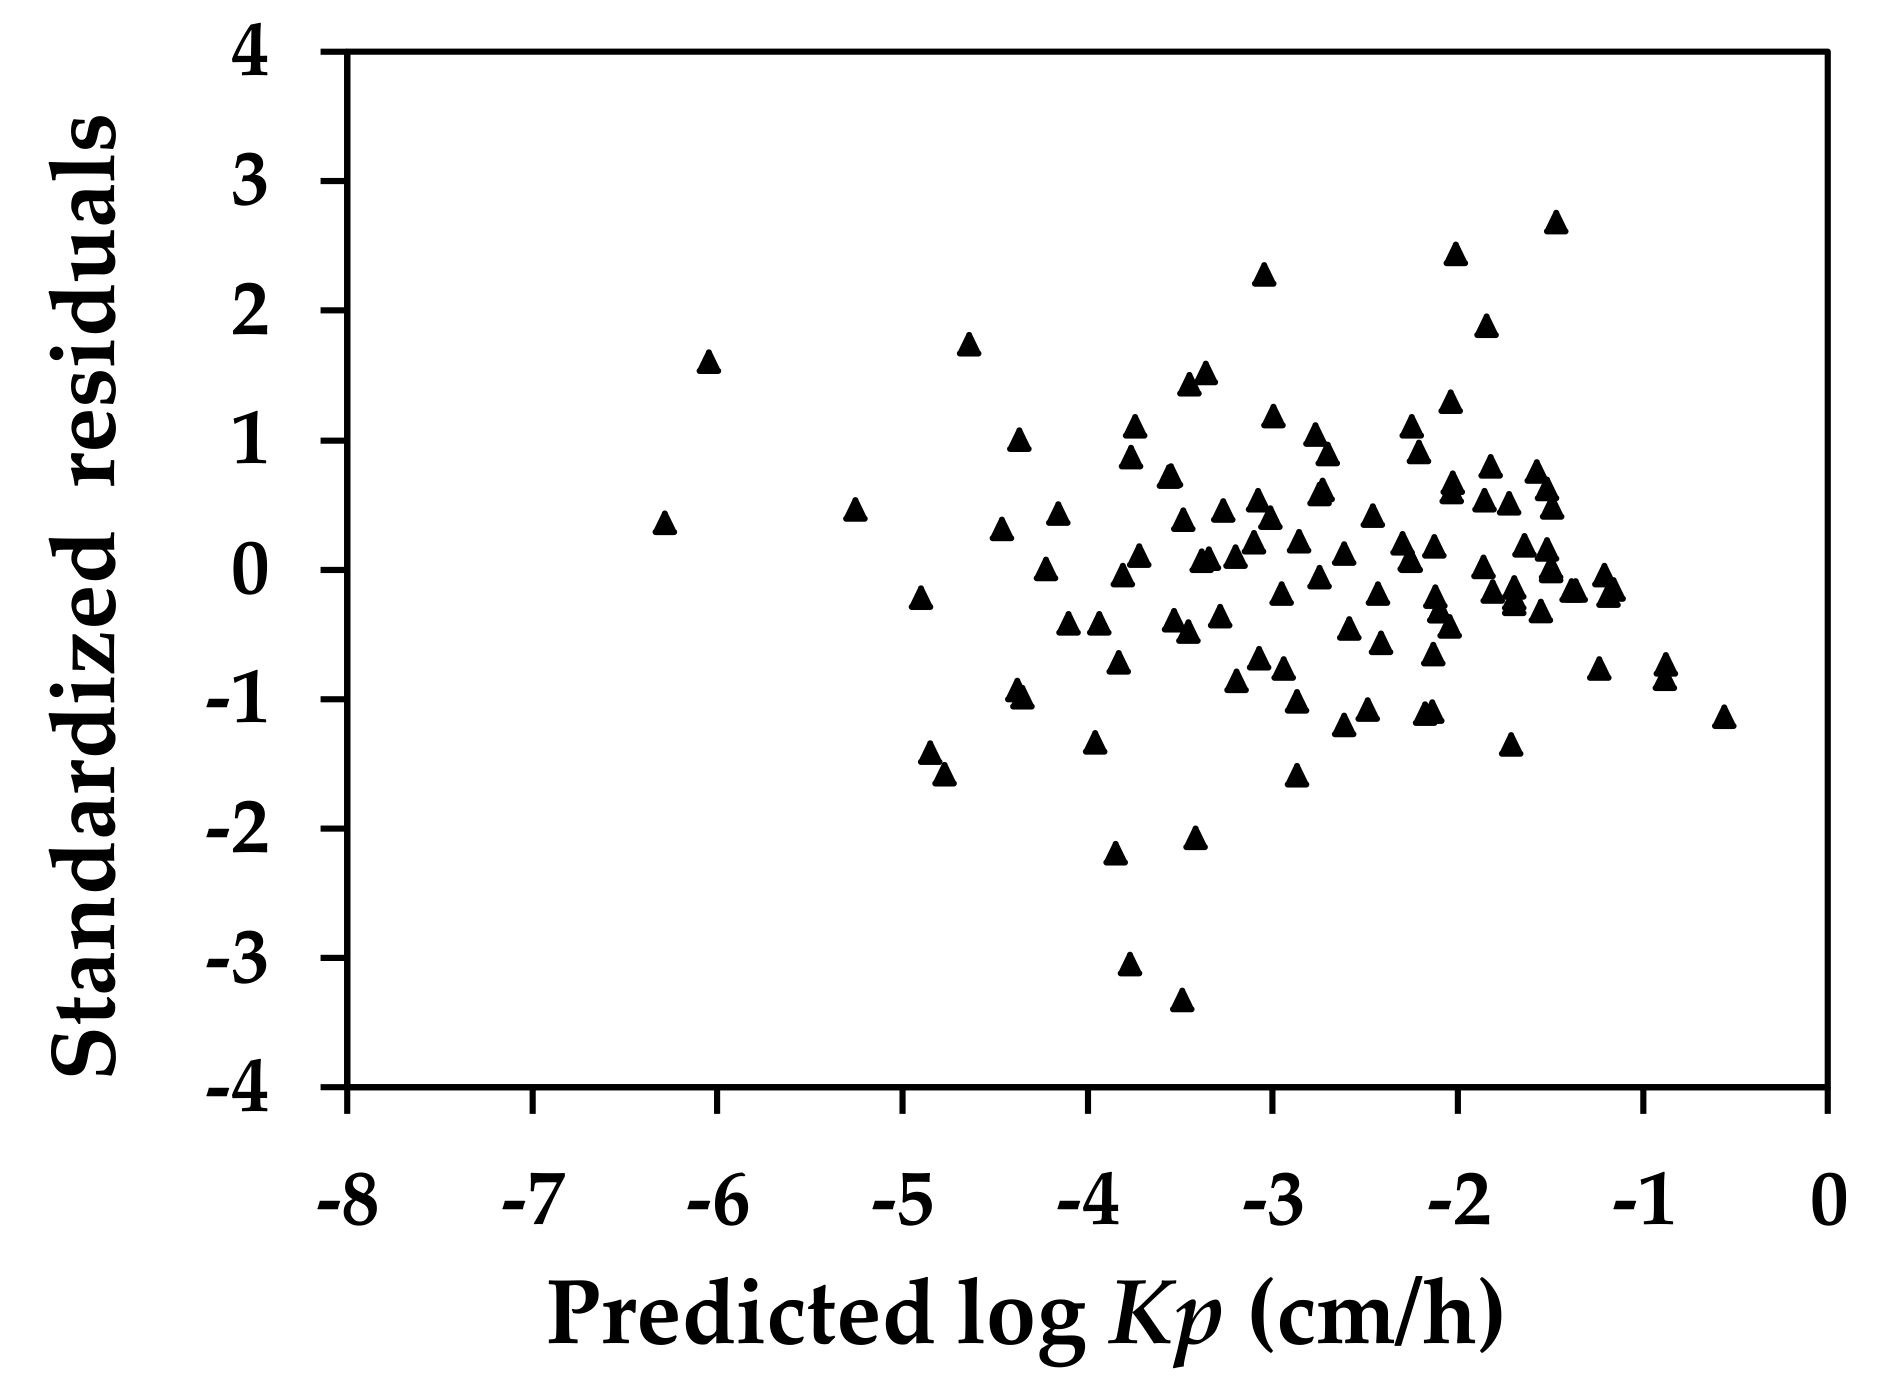
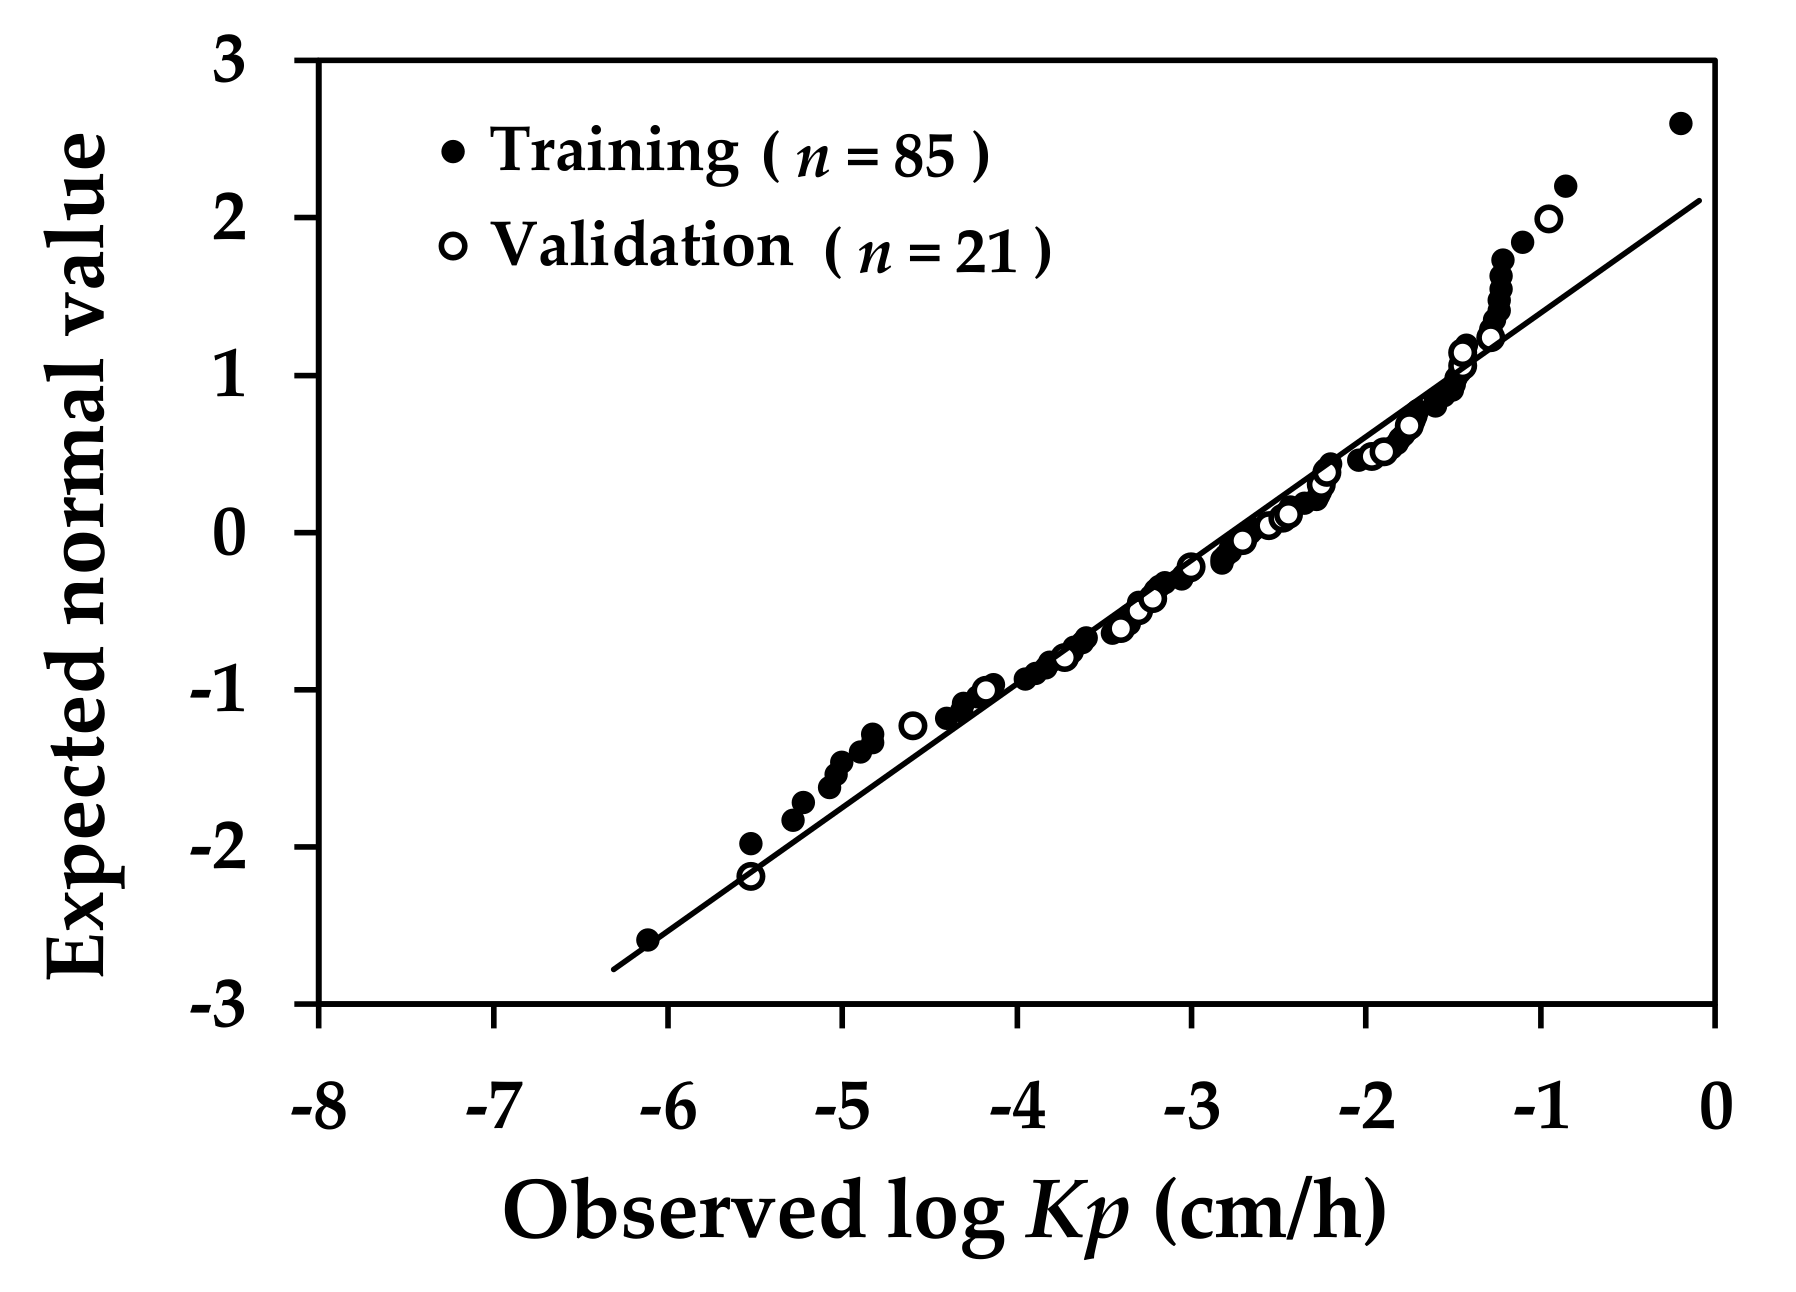
Figure 2 shows the distribution for the standardized residuals of the prediction versus the predicted log
Kp values. The result of the homoscedasticity test suggested a consistent performance of the current QSAR in predicting the
Kp for compounds of varying molecular characteristics. In the figure, the residuals for
N-nitrosodiethanolamine and atropine were ‒3.05 and ‒3.33, respectively. While these numbers were slightly more than three standardized deviations, these two compounds were not considered to be heterogeneous, given the significant variance that might be present in the processes by which these values were generated. As we introduced, when the rate of chemical permeation in the epidermal skin was experimentally determined, the procedures employed could differ significantly. As a result it was not uncommon to observe a variation of a magnitude of two orders in the
Kp values determined for the same compound when different procedures were applied in the experiment. van de Sandt et al. [
26] examined the intra- and inter-laboratory variation in the results of in vitro percutaneous absorption tests conducted among 10 European laboratories using human donor skin for three compounds of varying physicochemical properties: benzoic acid, caffeine, and testosterone. The examination reported a coefficient of variation of 6.3–52.5%, 12.0–91.4%, and 6.3–111.0% for benzoic acid, caffeine, and testosterone, respectively. The log
Kp of
N-nitrosodiethanolamine used in developing the current QSAR was of a low value, –5.22 (the
Kp was approximately 6.02 × 10
–6 cm/h) [
27]. This value was comparable to the
Kp observed for
N-nitrosodiethanolamine in the experiment where water was used as a vehicle [
28]; however, it was over 180 folds less than the level (1.1–4.1 × 10
–3 cm/h) determined when neat (undiluted) isopropyl myristate, a widely used lipoidal compound, was used as the vehicle for topical administration [
28,
29,
30].
2.3. Comparison of Current Model with Quantitative Structure-Activity Relationships Reported in Literature
In our study, we limited our introduction to and comparison with the QSARs of
Kp prediction only to those that were developed using datasets comparable to the data included in this study. As these models were representative of the
Kp QSARs developed in a different era, and many are still in wide application, this approach provided an opportunity for us via a comparison among the models to observe how the interpretation of molecular characteristics governing skin permeation of compounds changed in response to the improvement in QSAR molecular representation. Many of the models being compared in this study remain benchmarks in
Kp QSAR development [
31,
32,
33], despite that they were developed in the early days of
Kp QSAR development, e.g., the Potts and Guy model developed in 1992.
Table 5 summarizes, for the
Kp QSAR developed in this study, as well as for ten previously established
Kp QSARs reviewed by Lian et al. [
13] and Fitzpatrick et al. [
34], the data used in the development of
Kp QSAR, the number of descriptors included in the QSAR, and the fitting ability and predictive capability of the model. The models reported in Lien and Gao (1995) [
16], Barratt (1995) [
17], Potts and Guy (1995) [
18], Abraham et al. (1995) [
19], and Abraham et al. (1999) [
20] were built from a dataset smaller than the one adopted in the current study, and thus reported high
R2 in their original development processes. The influence of uneven sample size to the determination of
R2 became evident when these models were re-validated by Lian et al. using a consistent dataset of 124 compounds. This validating dataset likely overlapped to various extents with the original datasets by which these models were developed. Nonetheless, in the validation these models were found to be of poor predictive capability, with a
Q2 value ranging from 0.36–0.56, dropping significantly from the range of 0.90 to 0.96, as summarized in Fitzpatrick et al. The model by Potts and Guy in 1992 [
15] was developed using a database comparable to the one adopted in this study, but the model was reported initially with an
R2 of only 0.67. In the re-validation by Lian et al., a similar level of predictive power was observed.
A larger dataset of experimental
Kp (158 compounds) was considered in Patel et al. [
21]. One-hundred compounds in this dataset overlapped with those in the dataset applied for
Kp QSAR development in this study. In Patel et al., the predictive capability of QSAR was not investigated, i.e., all of the 158 compounds in the dataset were used in model training. Among the
Kp QSARs developed in Patel et al., the first model consisted of four descriptors and was of a
R2 of 0.76 (
Table 5, Equation (4)). Six steroid compounds, including hydrocortisone hemipimelate, hydrocortisone hemisuccinate, hydrocortisone hexanoate, hydrocortisone octanoate, hydrocortisone propinate, and hydrocortisone, were determined to be outliers to this four-descriptor model and removed from the original dataset. The second model was subsequently built using the 152 compounds remaining in the dataset and shown with an
R2 of 0.83 (
Table 5, Equation (5)). A further examination revealed an additional nine outliers among the 152 compounds used in building the second model. These outliers were removed from the dataset, and a third model was developed. The
R2 of the third and final model increased to 0.90 for the remaining 143 compounds, and no additional outliers were identified (
Table 5, Equation (6)). While the
R2 in the final model of Patel et al. appeared to be higher than the level observed for the model developed in our study, it would be difficult to determine the applicability of the final model from Patel et al. in terms of its predictive power toward unknown compounds―it was unclear as to how the removal of outliers in the development of QSARs in Patel et al. might have impacted on the interpretation of structural characteristics or molecular mechanisms involved in transepidermal transport of the solutes. As previously described, a proper validation of QSAR was required before the model could be considered for regulatory application [
35,
36], and as such, the models presented in Patel et al. might be limited from such application given the lack of sufficient validation. To meet the requirement for regulation application, in the current study the
Kp values included in the dataset for the development of
Kp QSAR were randomly divided into a training dataset and a validation dataset at a ratio of 4 to 1. The
Q2 identified for the current QSAR was 0.84, by far the highest value among the models compared in
Table 5. In addition, there were no outliers identified from the 106 compounds in the dataset for developing the current
Kp QSAR. These findings attest to the fitting and predictive capability of the proposed model.
2.4. Molecular Interactions Underlying Transepidermal Permeation of Small Molecules
The log
Kp QSAR developed in this study identified four descriptors as significant molecular characteristics that affected the epidermal transport of small molecules. These descriptors exerted their influences via: (1) molecular cyclicity for single rings in the molecule reflecting local geometrical environments in complex cyclic systems (the descriptor D/Dr10); (2) sum of topological distances between all pairs of oxygen and chlorine atoms (T(O..Cl)); (3) partitioning of molecules between the lipophilic vs. hydrophilic phases of transport medium (ALOGP); and (4) antineoplastic-like property at 80% similarity (Neoplastic-80) (
Table 2). As discussed, in the early days, the
Kp QSARs were frequently established assuming a linear correlation between the log
Kp and the regressor variables presumably indicative of lipophilicity and molecular size of a compound. The
Kp in the models reported in Potts and Guy (1992) [
15], Lien and Gao (1995) [
16], and Patel et al. (2002) [
21] (
Table 1) was statistically related to the
KOW and MW; while in the model developed by Barratt (1995) [
17] the
Kp was correlated to the
KOW and MV. These QSARs shared a feature―the physicochemical descriptors
KOW and MW/MV were combined and included in the model to suggest a mechanistic relevance of lipophilicity and molecular size to the transdermal transport of the solutes. In the current study, the molecular descriptor Ghose-Crippen octanol-water partition coefficient (ALOGP) was incorporated in the model, supporting the inference of lipophilicity being a key factor in the permeation of small molecules across the skin membrane.
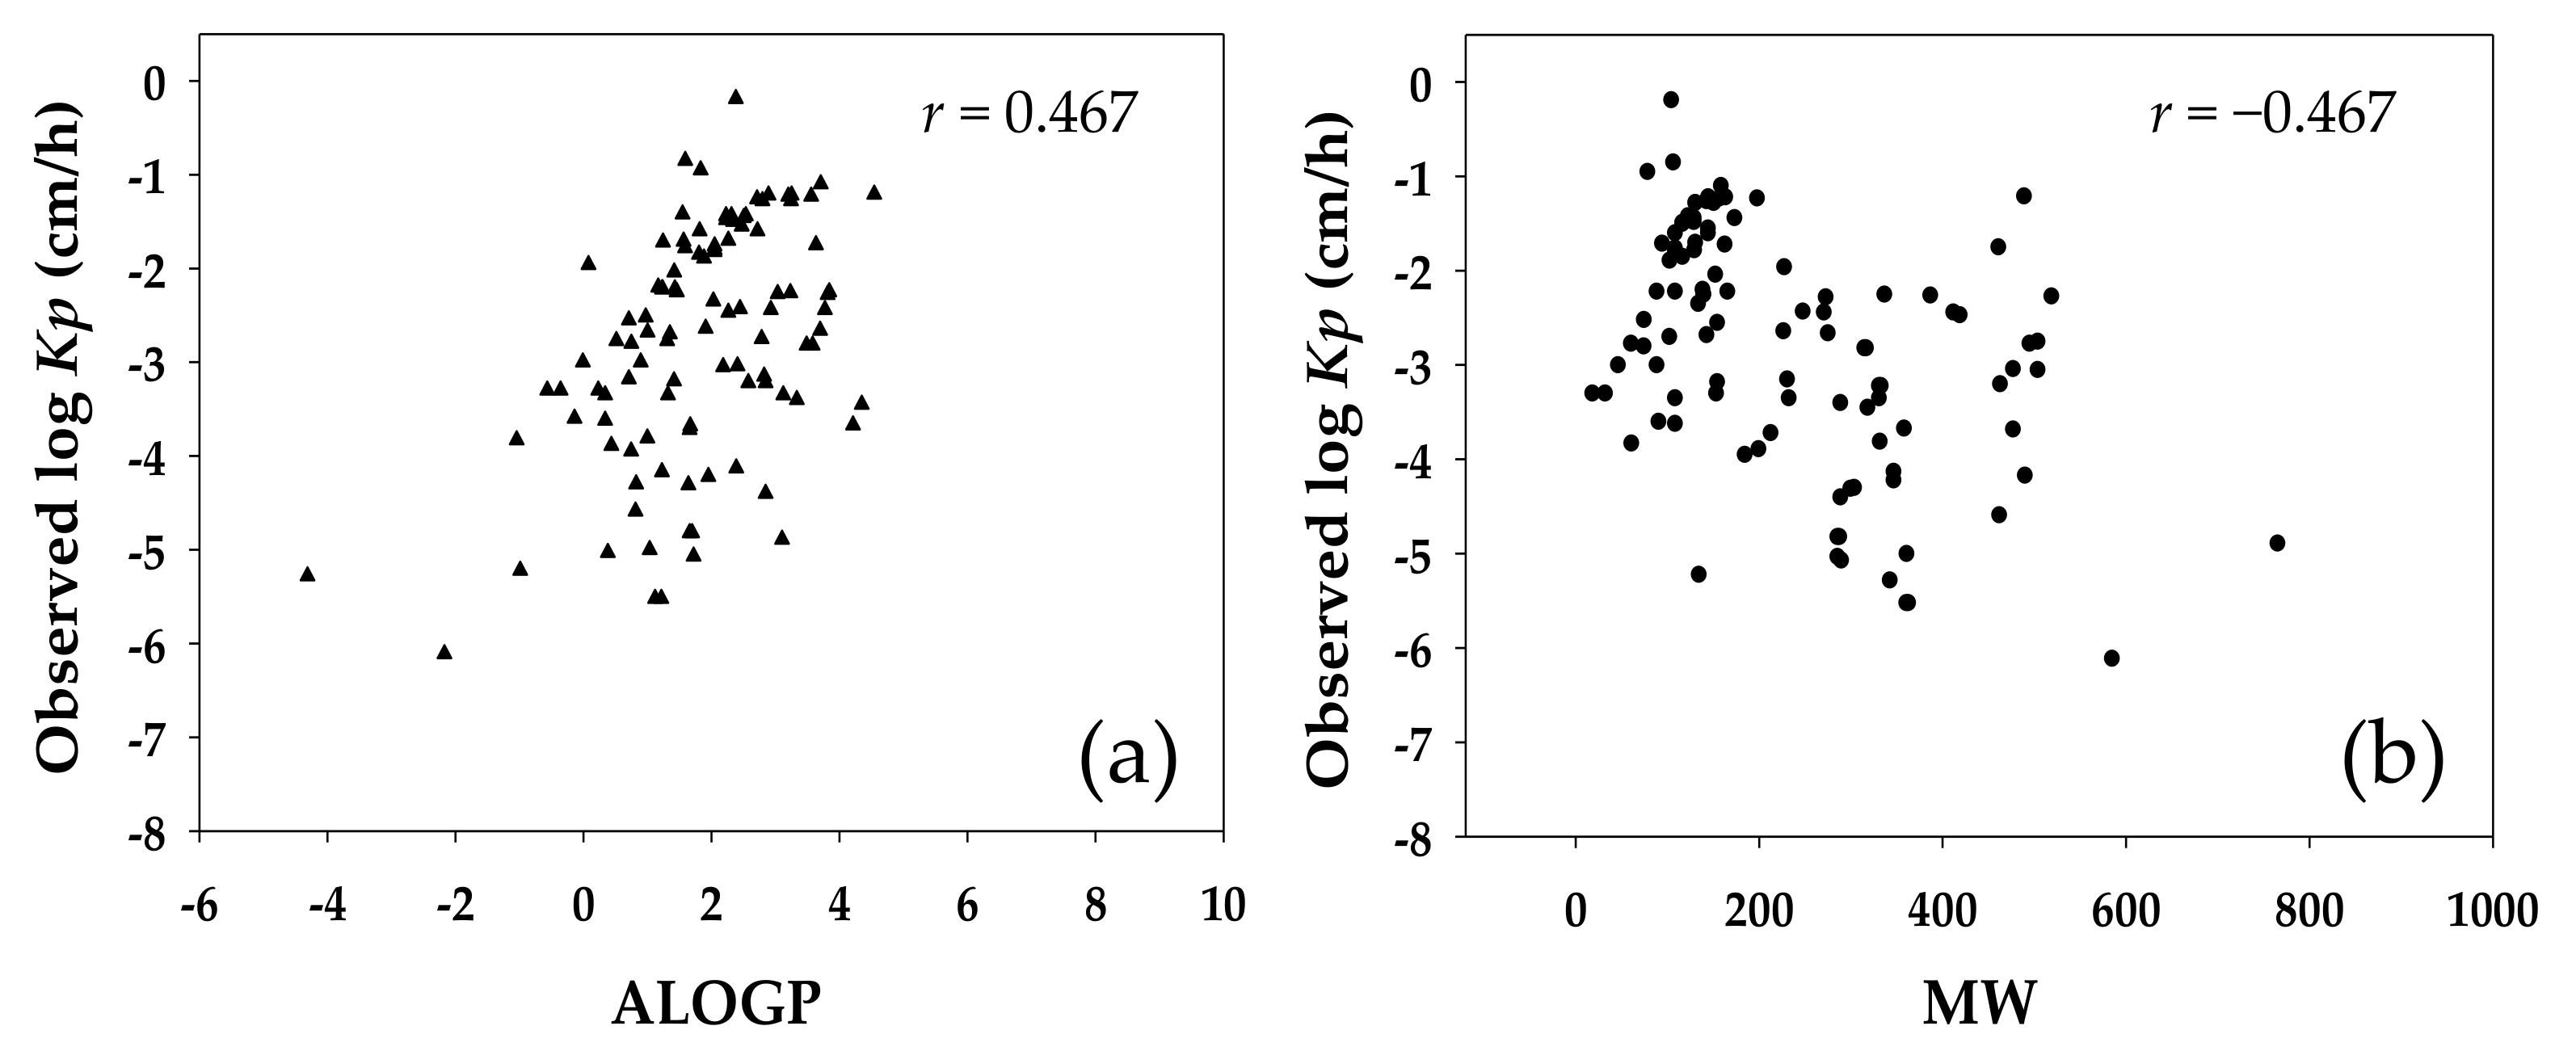
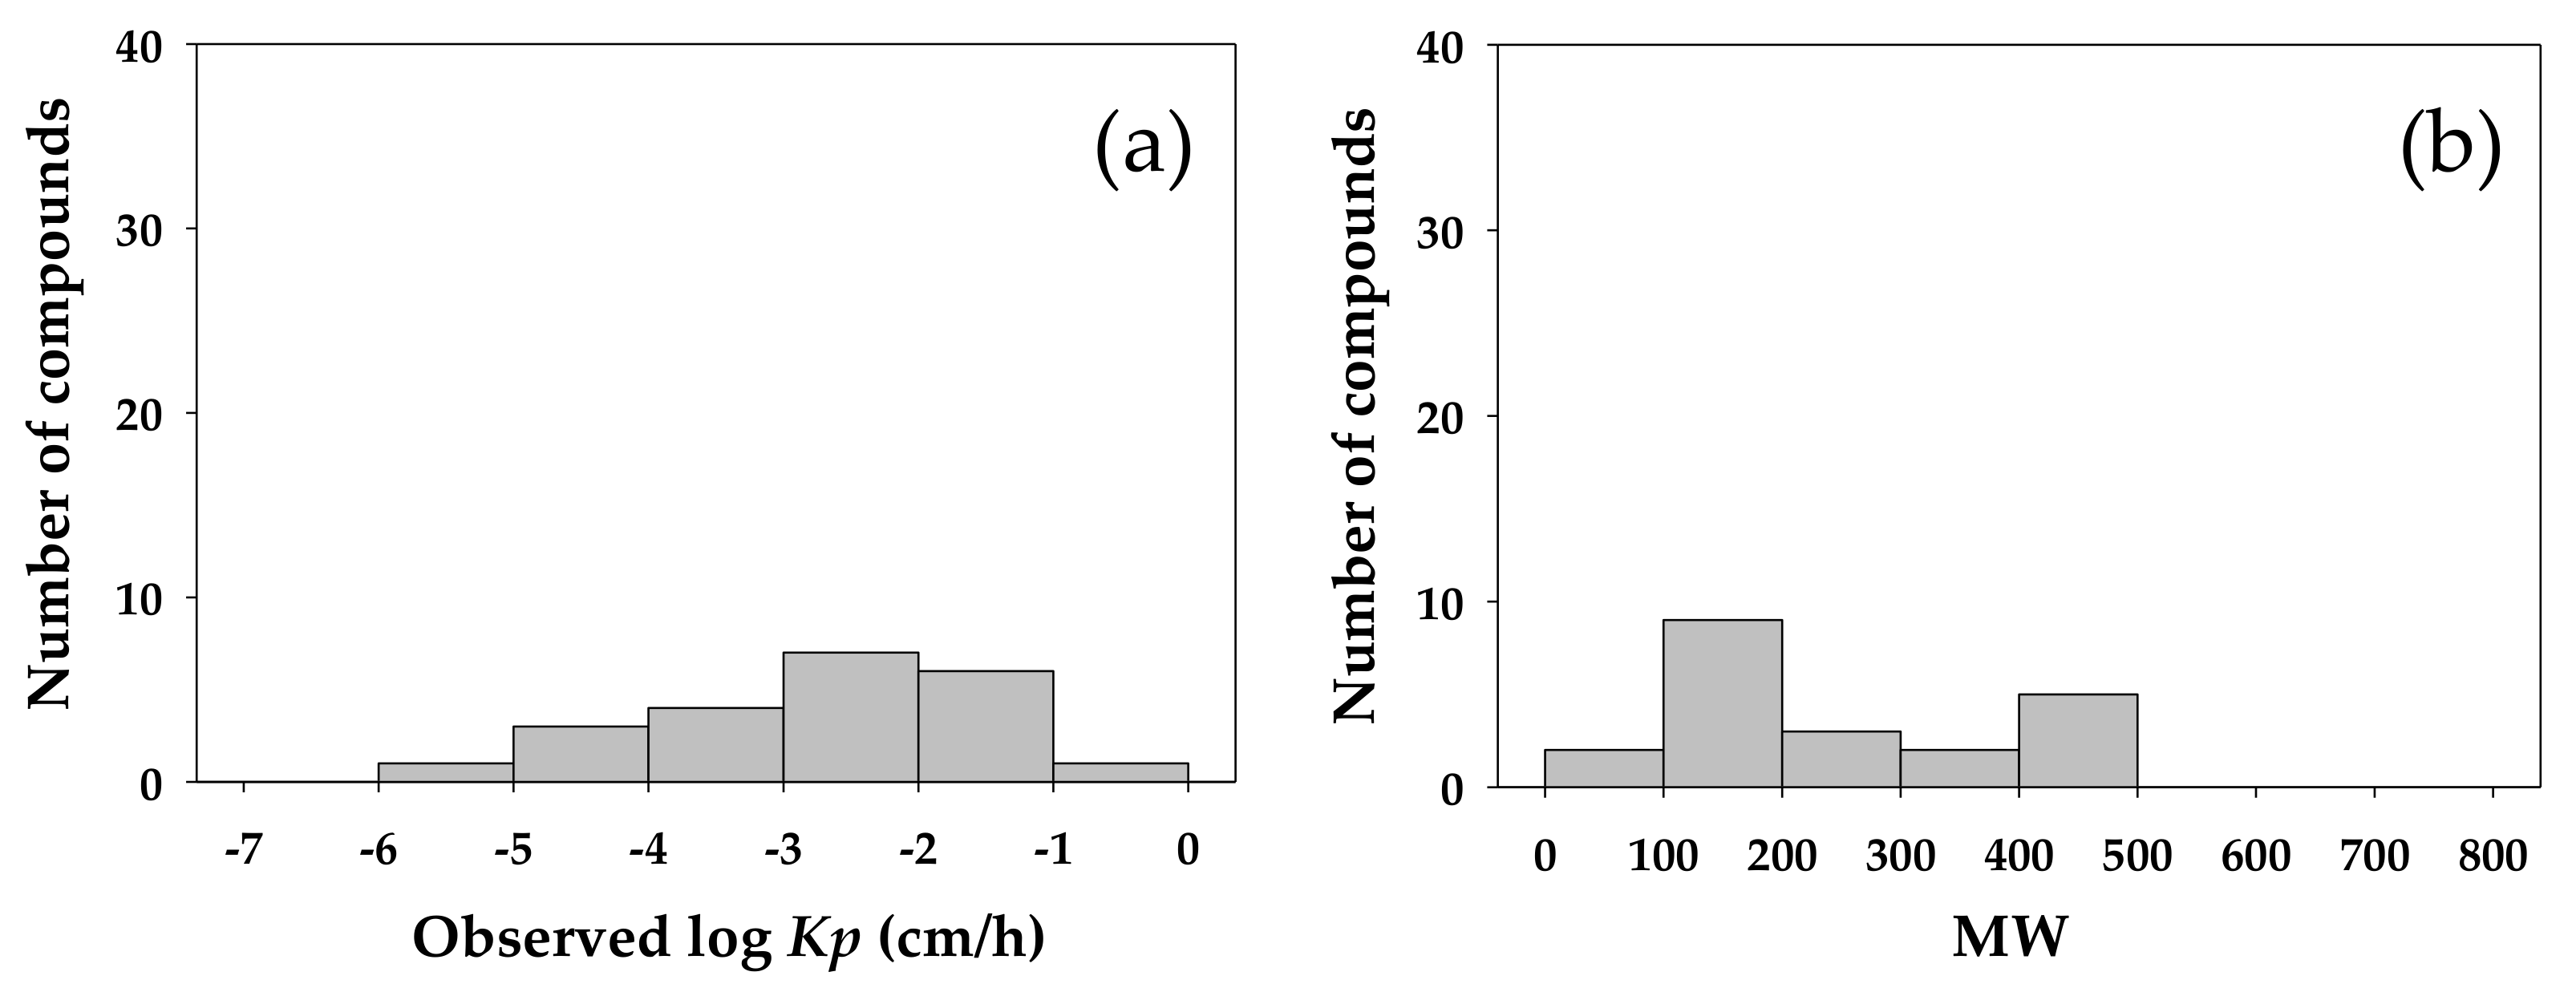
Figure 3 shows the distribution of the log value of experimentally determined
Kp for the investigated compounds against their ALOGP and MW. The experimental
Kp was moderately correlated to both the ALOGP and MW, conforming to the expected involvement of lipophilicity and molecular size in the dermal transport of small molecules. However, in the
Kp QSAR established in this study the MW was selected only indirectly in the final array of molecular descriptors.
The exclusion of MW as a principal descriptor in the current
Kp QSAR did not rule out the molecular size as a factor that contributed to the percutaneous permeation of small molecules. In the current QSAR, the molecular descriptor Ghose-Viswanadhan-Wendoloski antineoplastic-like index at 80% (Neoplastic-80) was selected to describe the transport of molecules through the stratum corneum. To the best of our knowledge, this is the first time that a composite index has been included as a descriptor in a
Kp QSAR. The drug property-related indices have been applied widely in the evaluation of compounds of toxicological or pharmacological potency. For example, pharmaceuticals have frequently been evaluated for their therapeutic index, a ratio of the dose required to produce a toxic effect to the dose needed to elicit the desired therapeutic response [
37] when a dose-response relationship was described. The comparison of the therapeutic effect versus the toxicological effect in a descriptive relationship of quantitative continuity is made on the recognition that many drugs share the same mechanisms of intercellular and intracellular transport as that of toxicants, or, in a broader sense, those of xenobiotics. In this study, the selection of a drug-related index in the
Kp QSAR was perhaps an indication that many of the small-molecular-size compounds included in the dataset in this study exhibited behaviors of transport similar to those of antineoplastic compounds when moving across the stratum corneum. Further examination of the criteria adopted in determining the 80% similarity of a compound to antineoplastics [
24] revealed a sub-domain of antineoplastic properties, including specific ranges of log
KOW, molar refractivity (AMR), MW, and number of atoms in the molecule (nAT). Chemicals of log
KOW, AMR, MW, and nAT values sitting in this sub-domain would be considered as sharing a similarity of 80% to an antineoplastic and subsequently assigned a value of 1 in the dichotomous index, whereas those of the aforementioned properties outside the sub-domain would be assigned a value of 0.
Table 6 shows the ranges of log
KOW, AMR, MW, and nAT defining the Neoplastic-80 as specified in Dragon
® and those corresponding to the 106 compounds included in the dataset in this study. For the compounds applied in the current study, the range of log
KOW, AMR, MW, and nAT covered those that were specified in the antineoplastic sub-domain, resulting in the inclusion of Neoplastic-80 as a significant descriptor in the final model. Evidently, the MW was considered for its impact on the transepidermal transport of the solutes in the current QSAR, however, only when it was integrated as a part of a comprehensive scheme of influence and weighted with the other properties.
A primary goal in this study was, through the process of
Kp QSAR development and a comparison with representative
Kp QSARs in literature developed using a comparable database, to identify the evolution in molecular representation that best described the transdermal permeation behavior of molecules. This approach allowed us the opportunity to gain insights on the molecular characteristics affecting the transport of molecules in the epidermal skin. The identification of the descriptor Neoplastic-80 and its sub-domain consisting of antineoplastic properties as being relevant to the skin permeability of compounds in this study attests to this purpose. A more recent database reported in Baba et al. [
31] collected experimentally derived permeability coefficients of 211 compounds consisting exclusively of permeability coefficients generated using an in vitro diffusion system of excised human skin. The aqueous donor solution in the diffusion system contained no organic solvents or permeation enhancers. This database was considered more consistent, as various criteria (e.g., requirements on in vitro study, use of human skin, use of aqueous vehicle, etc.) were applied in the process of
Kp review, and recognized as more applicable to somewhat structurally complex compounds [
32]. However, this database was not adopted in this study, as a primary goal in the current study was to compare between the
Kp model developed in this study with representative QSAR models developed using similar and comparable databases. The
Kp values generated for chemicals present in the solvent vehicle [
38] or in a state of ionization [
33] were not considered in this study neither, as the percutaneous absorption behavior of the molecules in these states could be a mixed result of influences from molecular properties as well as from a compromised integrity in the dermal barrier functions.
The
Kp QSAR developed in this study is also one of potential for practical application. In the current
Kp QSAR, the descriptors ALOGP and Neoplastic-80 are molecular property descriptors while D/Dr10 and T(O..Cl) are topological ones. For Neoplastic-80, a positive identification is made when the values of log
KOW, AMR, MW, and nAT in the molecule of the compound fall in the ranges specified in the sub-domain (
Table 6). The values of the properties in the sub-domain are available from online databases or reports in literature, and if necessary there are also algorithms amenable to the users for their calculation. For the topological descriptors, their values may also be derived following straightforward calculations, if an estimation using computer software or programs is unavailable. For example, the value of T(O..Cl) for the compound 2,4-dichlorophenol (CAS 120-83-2) is calculated as the sum of the topological distance from the chlorine in the
ortho position of phenol to the hydroxyl group (3) and the distance from the chlorine in the
para position to the hydroxyl group (5), yielding a final value of 8. The
Kp QSAR developed in this study should serve as one of application potential with new perspectives on the molecular behaviors of compounds moving across the skin membrane.
In recent years, machine learning algorithms, such as artificial neural networks (ANN) and support vector machines, have been applied in developing predictive models. However, these methods may not be readily applied to building QSAR models from limited data. For example, the ANN has been frequently applied in developing nonlinear models for predicting skin permeability of chemicals [
38,
39,
40]. When developing a three-layer ANN, assuming an input layer of simply five inputs (descriptors), a hidden layer of 10 nodes, and an output layer of one output (target property), the total number of parameters (weights and bias) in the ANN model will be 71 (5 × 10 + 10 + 10 × 1 + 1). As it is commonly required in the development of a predictive model that the ratio of the number of parameters in the model to the number of samples in the supporting dataset to be less than one-fifth, the number of parameters as estimated in this case inevitably results in overfitting the samples in our
Kp dataset. Baba et al. [
31] also commented that the ANNs were likely to overfit the given data and be trapped in local minima. In addition, their network structures could not be fully determined. In comparison, an MLR model of five descriptors would require the generation of only six parameters, which would make the MLR model much more amenable to the users. Considering the size of the dataset available in this study, the MLR was adopted as the mechanism in the QSAR development.


