Article

Inhibitory Effects of Bioassay-Guided Isolation of Anti-Glycation Components from Taraxacum coreanum and Simultaneous Quantification

Pharmaceutical Botany Laboratory, College of Pharmacy, Chung-Ang University, Heukseok-dong, Dongjak-gu, Seoul 156-756, Korea
*
Author to whom correspondence should be addressed.
Molecules 2018, 23(9), 2148; https://doi.org/10.3390/molecules23092148
Submission received: 3 August 2018 / Revised: 16 August 2018 / Accepted: 23 August 2018 / Published: 27 August 2018
(This article belongs to the Special Issue Bioactives from Bioprocessing: Sources and Production)

Abstract

:
Inhibition of the formation of advanced glycation end products (AGEs) is an attractive strategy in diabetes treatment. Taraxacum coreanum extracts were suggested to have antidiabetic effects. However, studies on the components of T. coreanum are lacking, and there is no report on the inhibitory effects of T. coreanum on the formation of AGEs. Therefore, T. coreanum extracts and fractions were tested for their inhibitory effects on α-glucosidase and AGEs formation in two systems (bovine serum albumin (BSA)–glucose and BSA–methylglyoxal (MGO)). Bioassay-guided isolation of compounds from T. coreanum led to six flavones (16) and four hydroxycinnamic acid derivatives (711). Compound 11 exhibited the highest inhibitory activity against α-glucosidase and AGEs formation and had the highest content in T. coreanum extract. All compounds except compound 9 showed a stronger inhibition than the positive control in the BSA-glucose and BSA-MGO system. In addition, T. coreanum showed a higher content of bioactive compounds and stronger inhibition of AGE formation and α-glucosidase activity than T. officinale. Our study demonstrated the preventive and therapeutic efficacy of T. coreanum and its potential use as a cost-effective phytopharmaceutical in complementary therapy against type-2 diabetes and its complications.

1. Introduction

Protein glycation, also called Maillard reaction, is a nonenzymatic reaction that occurs between the amino and carbonyl groups of proteins, lipids, and nucleic acids and results in the formation of a group of heterogeneous compounds called advanced glycation end products (AGEs). These compounds form covalent bonds with proteins, which results in changes in the structural and functional properties of proteins. The interaction between AGEs and their receptors (RAGE) causes oxidative stress, thrombosis, and inflammatory reactions [1,2]. The rate of AGE formation is accelerated in diabetes [3]. Unless long-term uncontrolled, it can lead to a series of complications such as cataracts, atherosclerosis, neuropathy, retinopathy, nephropathy, and delayed wound healing. The tissue concentrations of AGE were twofold higher in diabetic patients with end-stage renal disease than in diabetic patients without renal disease [4]. Additionally, diabetic patients with Alzheimer’s disease had increased accumulation of AGEs and upregulated RAGE in the brains [5], and patients with heart failure-associated cardiac stiffness showed myocardial accumulation of AGEs [6]. AGEs formation can be suppressed through use of inhibitors [7]. Some synthetic compounds, such as aminoguanidine (AMG) exhibit a high AGE-inhibitory activity; however, they are associated with various adverse effects in vivo and are not suitable for food applications [7]. Thus, research on natural products that can inhibit the formation of AGEs has recently increased [8]. Antioxidants, which include plant extracts and their active ingredients, are widely used to inhibit the formation of AGEs in vivo and in food [9]. Amadori products, such as deoxyglucosones, glyoxal, and methylglyoxal (MGO), are intermediates produced during AGEs formation in humans [10].
Dandelions (Taraxacum) is a member of the Asteraceae family and grows widely on roadsides and rural sites located in warm temperate zones. There are 30–57 varieties of Taraxacum, and many microspecies are divided into nine sections. Taraxacum species have been used as a herbal medicine for a long time [11,12]. Taraxacum coreanum NAKAI, known as “white dandelion”, is native to Korea and Japan and grows mainly in South Korea. Moreover, T. coreanum has been reported to have various biological activities, including antioxidant [13], anti-inflammatory [14], anti-fungal [15], and anti-cancer [16]. In addition, polysaccharides, b-sitosterol, daucosterol, taraxasteryl acetate, chrysoeriol, diosmetion, luteolin, luteolin-7-glucoside, esculetin, 5-hydroxypyttolidin-2-one, taraxinic acid, and taraxinic acid-1′-β-d-glucopyranoside were isolated from T. coreanum [16,17]. According to previous studies [18,19], T. coreanum had a higher content of phenolic compounds, antioxidant activity, and tyrosinase inhibitory activity than T. officinale, which was commonly known as dandelion. Additionally, T. coreanum extracts were reported to show anti-diabetes effects [20]. However, studies on the components of T. coreanum are still lacking, and there is no report on the inhibitory effects on the formation of AGEs of T. coreanum as well as T. offcinale. Therefore, this study was carried out to isolate the major components from T. coreanum extracts and evaluate their inhibitory effects on α-glucosidase activity, which is related to diabetes, and the formation of fluorescent AGEs in bovine serum albumin (BSA)/glucose and BSA/methylglyoxal (MGO) systems using fluorescence spectroscopy. In addition, we evaluate the excellence of T. coreanum compared to T. offcinale.

2. Results and Discussion

2.1. AGE Formation in BSA-glucose and BSA-MGO Systems, and α-Glucosidase Inhibitory Activities of the Extracts and Fractions from T. coreanum
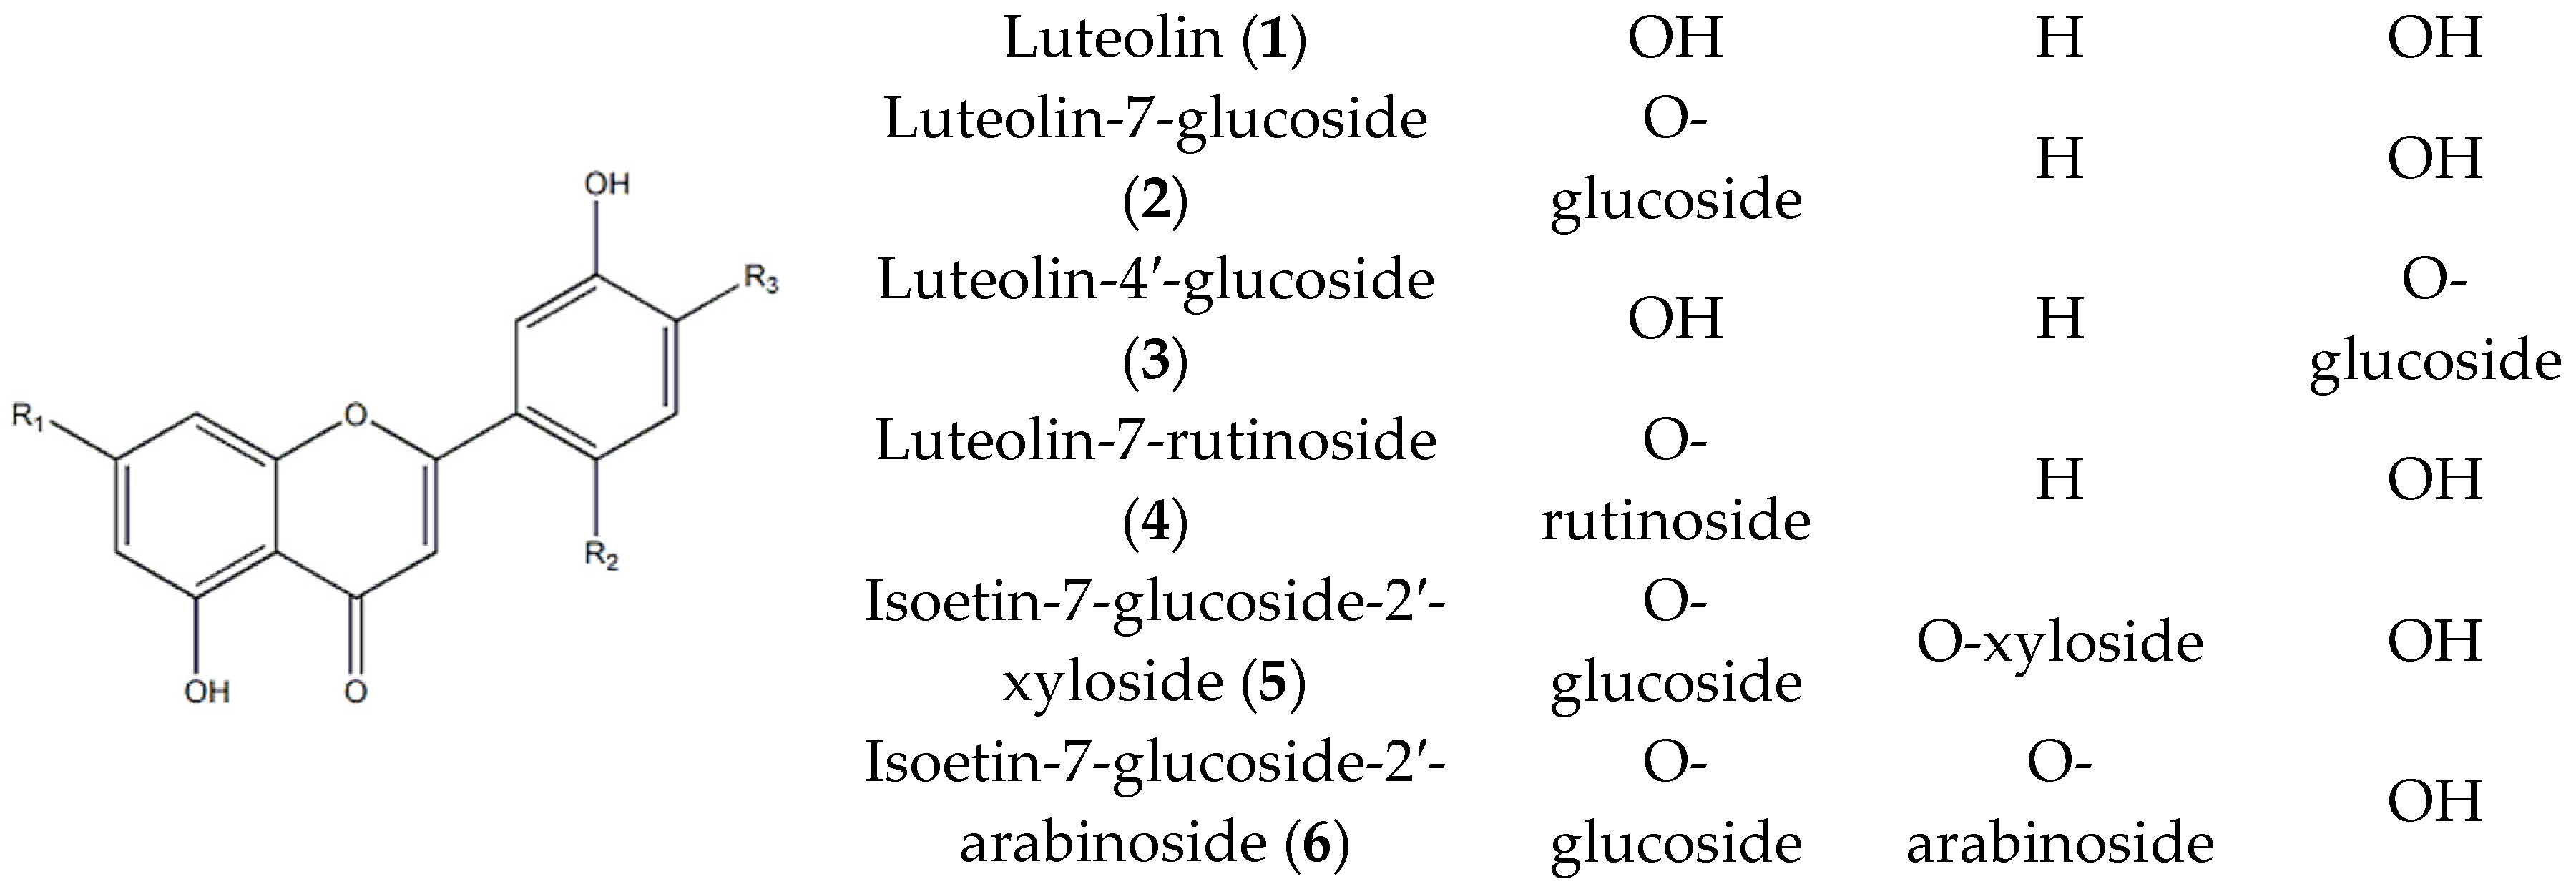
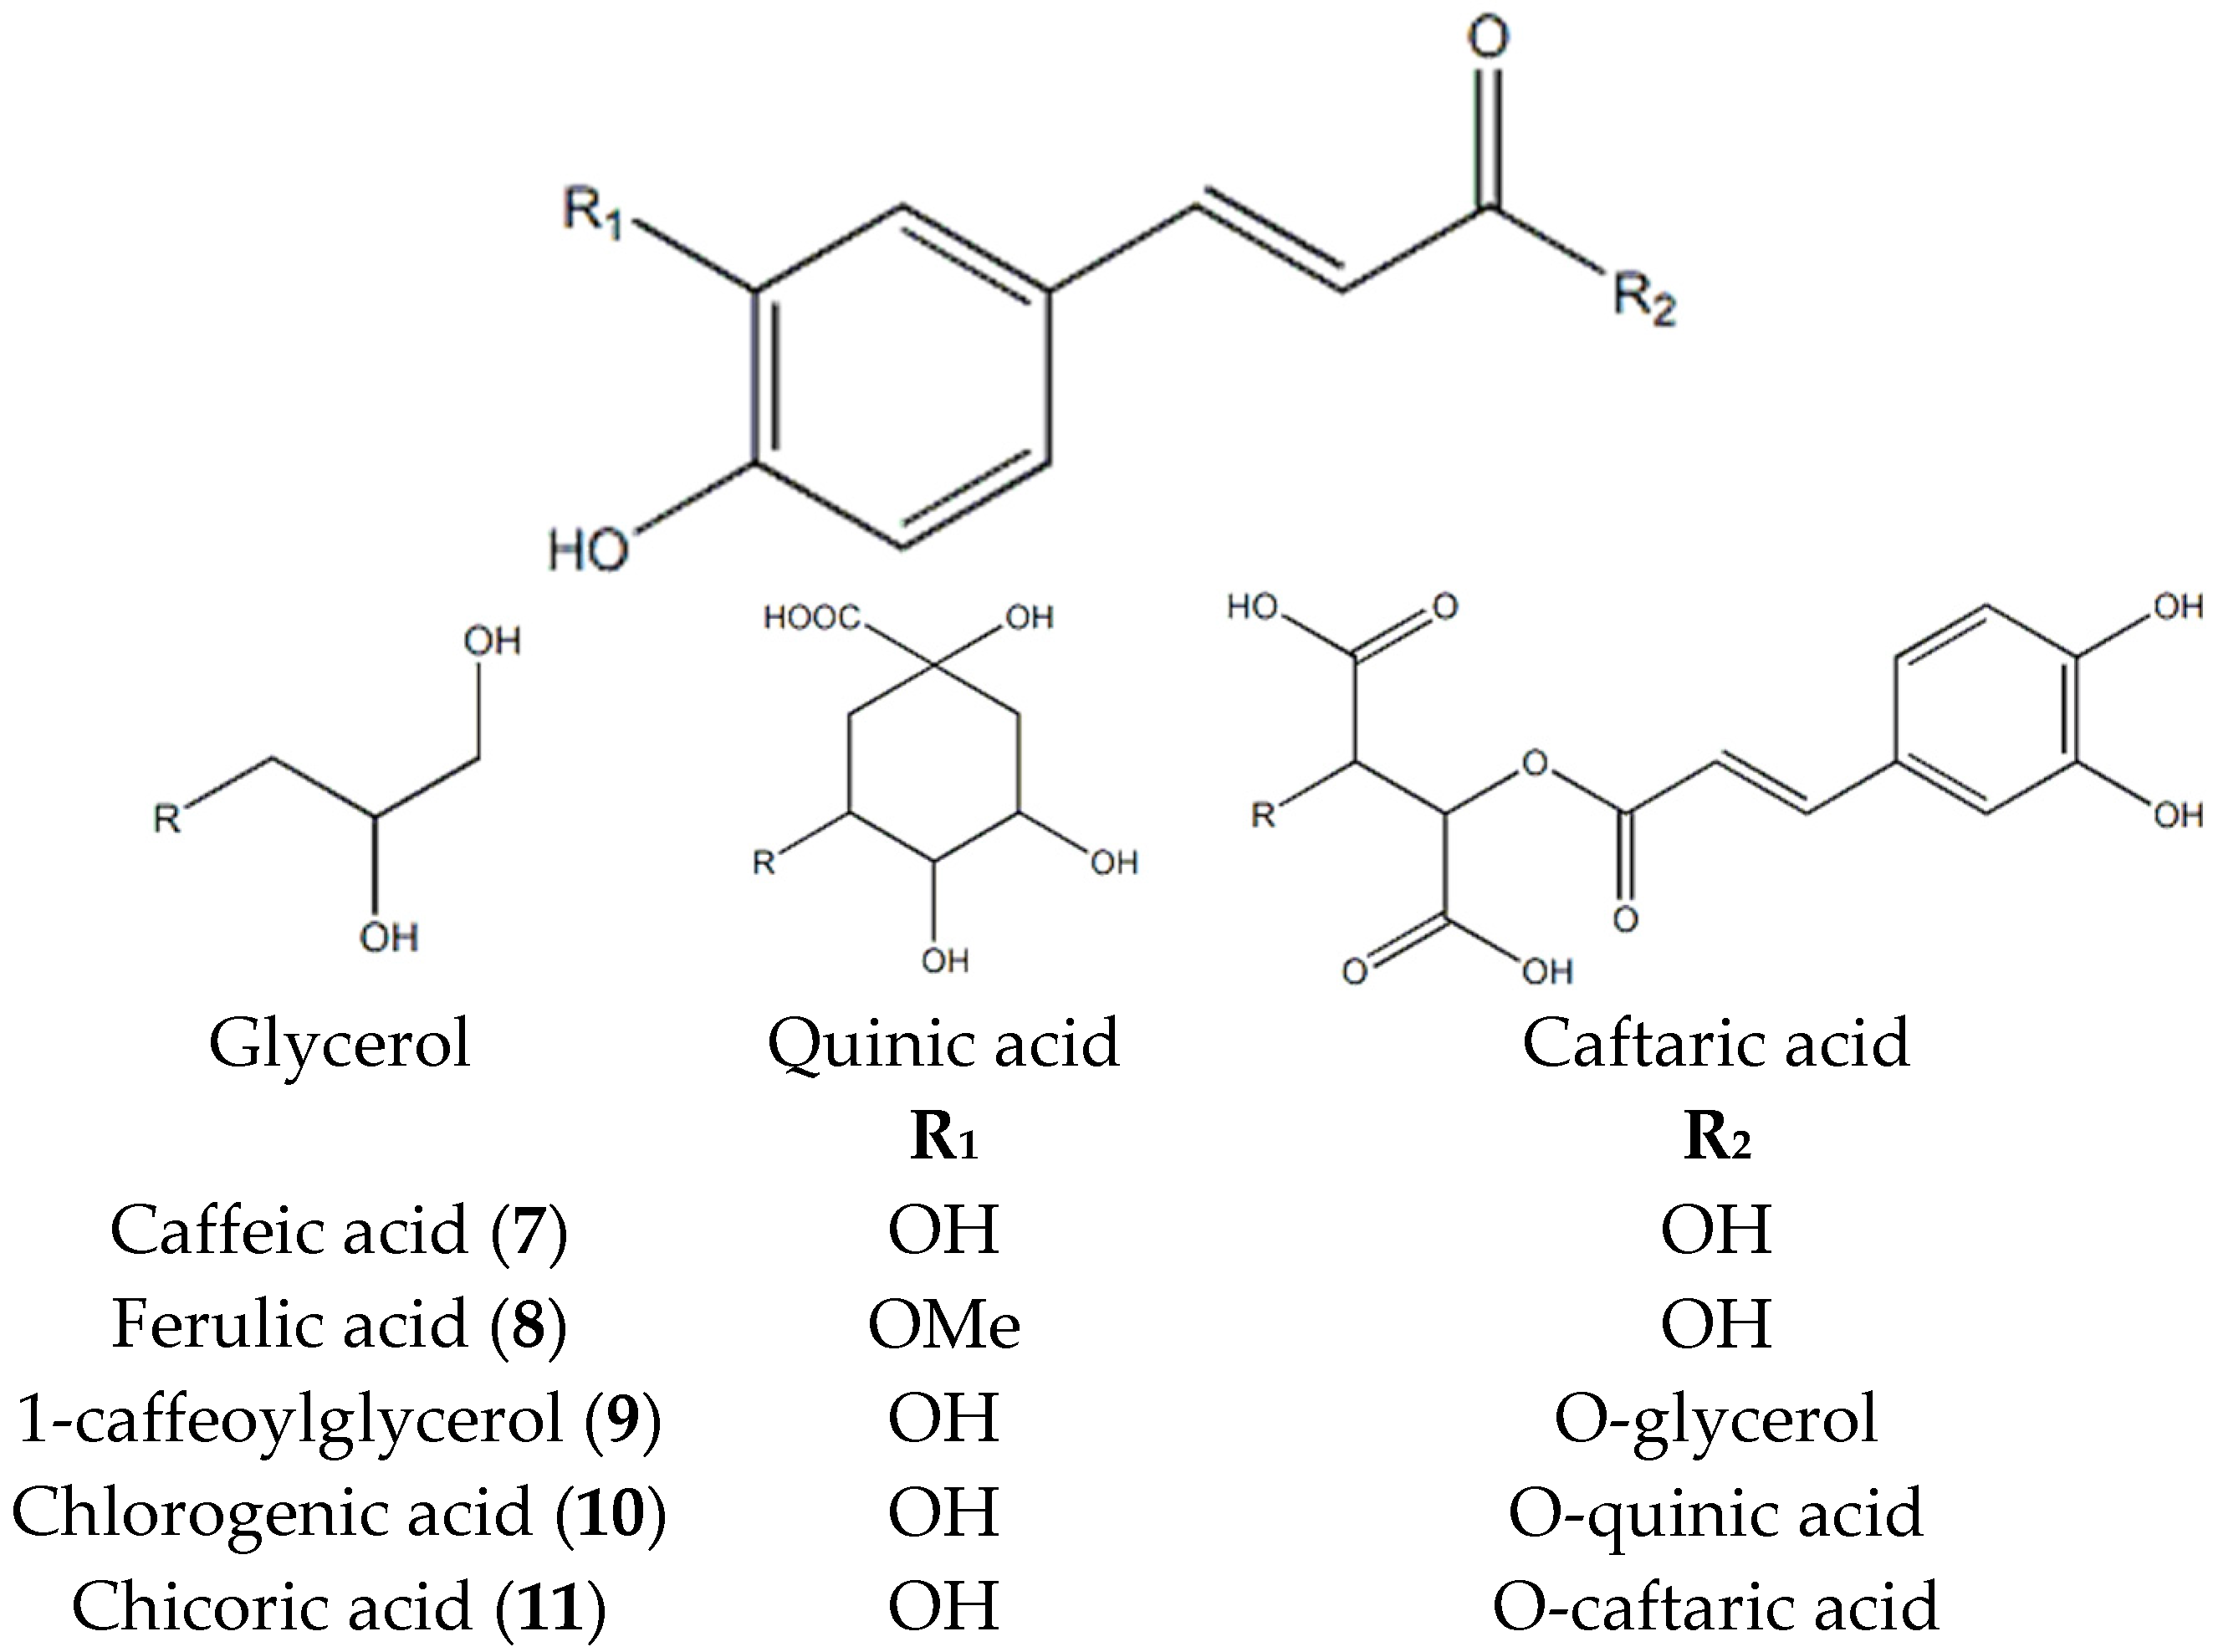
Accumulation of AGEs in the body is implicated in the development of chronic degenerative diseases [21]. AGE inhibition is a therapeutic option for diabetes that is not based on controlling of postprandial blood glucose level. This approach could be useful in the prevention or reduction of diabetic complications [22]. Therefore, studies have been performed to develop AGE inhibitors. Owing to the importance of AGEs in the pathogenesis of various related diseases, AGE inhibitors have received increased attention. methylglyoxal (MGO) is a crucial intermediate for the formation of AGEs in vivo [10]. In addition, α-glucosidase inhibitors are believed to act as anti-diabetic agents by impeding sugar degradation and attenuating postprandial hyperglycemia. Thus, inhibition of α-glucosidase activity and carbohydrate hydrolysis would be beneficial for controlling blood glucose levels in diabetic patients [23]. In this study, inhibitory effects on AGE formation were determined in bovine serum albumin (BSA)-glucose and BSA-MGO systems to demonstrate the effects of T. coreanum in preventing diabetic complications. We also examined α-glucosidase inhibitory activity of T. coreanum to demonstrate its potential in preventing diabetes. The results are summarized in Table 1.
The extract with 100% methanol (Ext), n-Hexane (Hx), dichloromethane (DCM), and EA fractions from T. coreanum exhibited inhibition of α-glucosidase (IC50 values of 1623.08 ± 184.40, 1270.70 ± 72.58, 2041.44 ± 469.46, and 544.53 ± 36.46 μg/mL, respectively). Similar to the results of Kim et al. [24], T. coreanum extracts showed stronger inhibition (IC50 values of 444.97 ± 55.86 µg/mL) than T. officinale extracts (IC50 values of 2195.89 ± 267.35 µg/mL). Regarding the inhibitory activity of AGE formation in both BSA-glucose and BSA-MGO systems, EA fractions of T. coreanum (IC50 values of 119.47 ± 12.06 and 127.47 ± 23.87 µg/mL) exhibited the highest inhibition, while the Hx fraction had mild activity. Among T. coreanum and T. officinale extracts, T. coreanum showed higher inhibition in both BSA-glucose and BSA-MGO systems (IC50 values of 183.97 ± 28.52 and 98.82 ± 2.51) than T. officinale (IC50 values of 201.25 ± 33.99 and 105.37 ± 24.42 µg/mL).

2.2. Identification of Compounds 111 Isolated from T. coreanum

Chromatographic separation of ethyl acetate (EA), n-butanol (BuOH), and water fractions from T. coreanum were performed by bioassay-guided isolation. The results revealed that six flavones (16) and four hydroxycinnamic acids (711) were isolated from EA, BuOH, and water fractions. Compounds 111 isolated from T. coreanum were identified as luteolin (1) [25], luteolin-7-glucoside (2) [25], luteolin-4′-glucoside (3) [26], luteolin-7-rutinoside (4) [27], isoetin-7-glucoside-2′-xyloside (5) [28,29], isoetin-7-glucoside-2′-arabinoside (6) [28,29], caffeic acid (7) [30,31], 1-caffeoylglycerol (8) [32], ferulic acid (9) [33], chlorogenic acid (10) [34], and chicoric acid (11) [35] by comparing spectroscopic (1H-, 13C-NMR) and LC-MS data from previous studies (Figure 1). The m/z data and the retention time of each compound are shown in Table 2. The observed mass value accuracy of compounds 111 is within the 5 ppm range, indicating that the results are credible. HPLC analysis was performed to determine the major components of T. coreanum extracts. (Figure 2). The inhibitory activity of compounds 111 on α-glucosidase and AGE formation was also determined (Table 3).

2.3. AGE Formation in BSA-glucose and BSA-MGO Systems and α-Glucosidase Inhibitory Activities of Compound 111 Isolated from T. coreanum

Regarding AGE formation inhibitory activity in BSA-glucose system, glycosylation at the C-7 position of flavones improved chelation effect and glycosylation at the C-4′ position of flavones decreased the inhibitory capacity [36]. It was same result that the lower inhibitory activity of compound 3, which was glycosylated at C-4′, had than that of compounds 26 (glycosylation at the C-7 position). In addition, compound 2, which was glycosylated at the C-7 position of luteolin-type flavonols, showed the highest inhibitory activity, followed by luteolin (compound 1) with no glycosylation, and compounds 5 and 6 with glycosylation at the C-7 and C-2′ position of isoetin-type flavonols. The IC50 values of compounds 26 were 122.81 ± 2.02, 423.30 ± 18.04, 253.3 ± 18.04, 268.18 ± 3.41, and 238.05 ± 13.82 μM, respectively. In contrast, compound 3 (only glycosylation at C-2′ position) had the lowest IC50 values with 423.30 ± 18.04 mM. Among hydroxycinnamic acids, derivatives of both caffeic acid and tartaric acid (compound 11) showed higher inhibitory activity than derivatives of caffeic acid and quinic acid (compound 10). Compounds 8 and 9 showed mild activity, with IC50 values of 324.21 ± 8.29 and 306.99 ± 10.16 μM. Compound 10 demonstrated slight inhibition, with IC50 value of 704.86 ± 167.44 μM.
In BSA-MGO system, compound 1 showed the highest inhibitory activity with IC50 value of 66.11 ± 17.06 μM, followed by compounds 2 and 3, which was glycosylated at the C-7 or C-4′ position of flavones, and compounds 46, which had two glycosylations. The inhibitory capacity of compounds 46 was weaker than that of other flavone compounds, but stronger than compounds 89. Among hydroxycinnamic acids, compounds 911, which have a glycerol group, quinic acid, or caftaric acid, showed similar inhibitory potentials, with IC50 values of 140.72 ± 67.36, 138.18 ± 1.91 μM, and 141.21 ± 8.76, respectively. Compound 8, which had an IC50 value of 151.67 ± 65.36, exhibited weaker inhibitory activities than flavones and other compounds.
Finally, regarding α-glucosidase activity, compounds 3, 4, and 11 possessed the most potent activity (IC50 value of 598.24 ± 146.52, 670.50 ± 50.83, and 639.25 ± 12.51 μg/mL, respectively). Compounds 10 and 2 were the second most potent α-glucosidase inhibitors (IC50 value with 1148.67 ± 162.05 and 1455.95 ± 162.32 μg/mL, respectively), followed by compounds 7 and 8 (IC50 value of 5134.55 ± 803.54 and 2951.13 ± 3.94 μg/mL, respectively). In contrast, compounds 1, 5, 6, and 9 demonstrated no inhibitory activity and had IC50 values >500 μM or were ND. The results are summarized in Table 2.

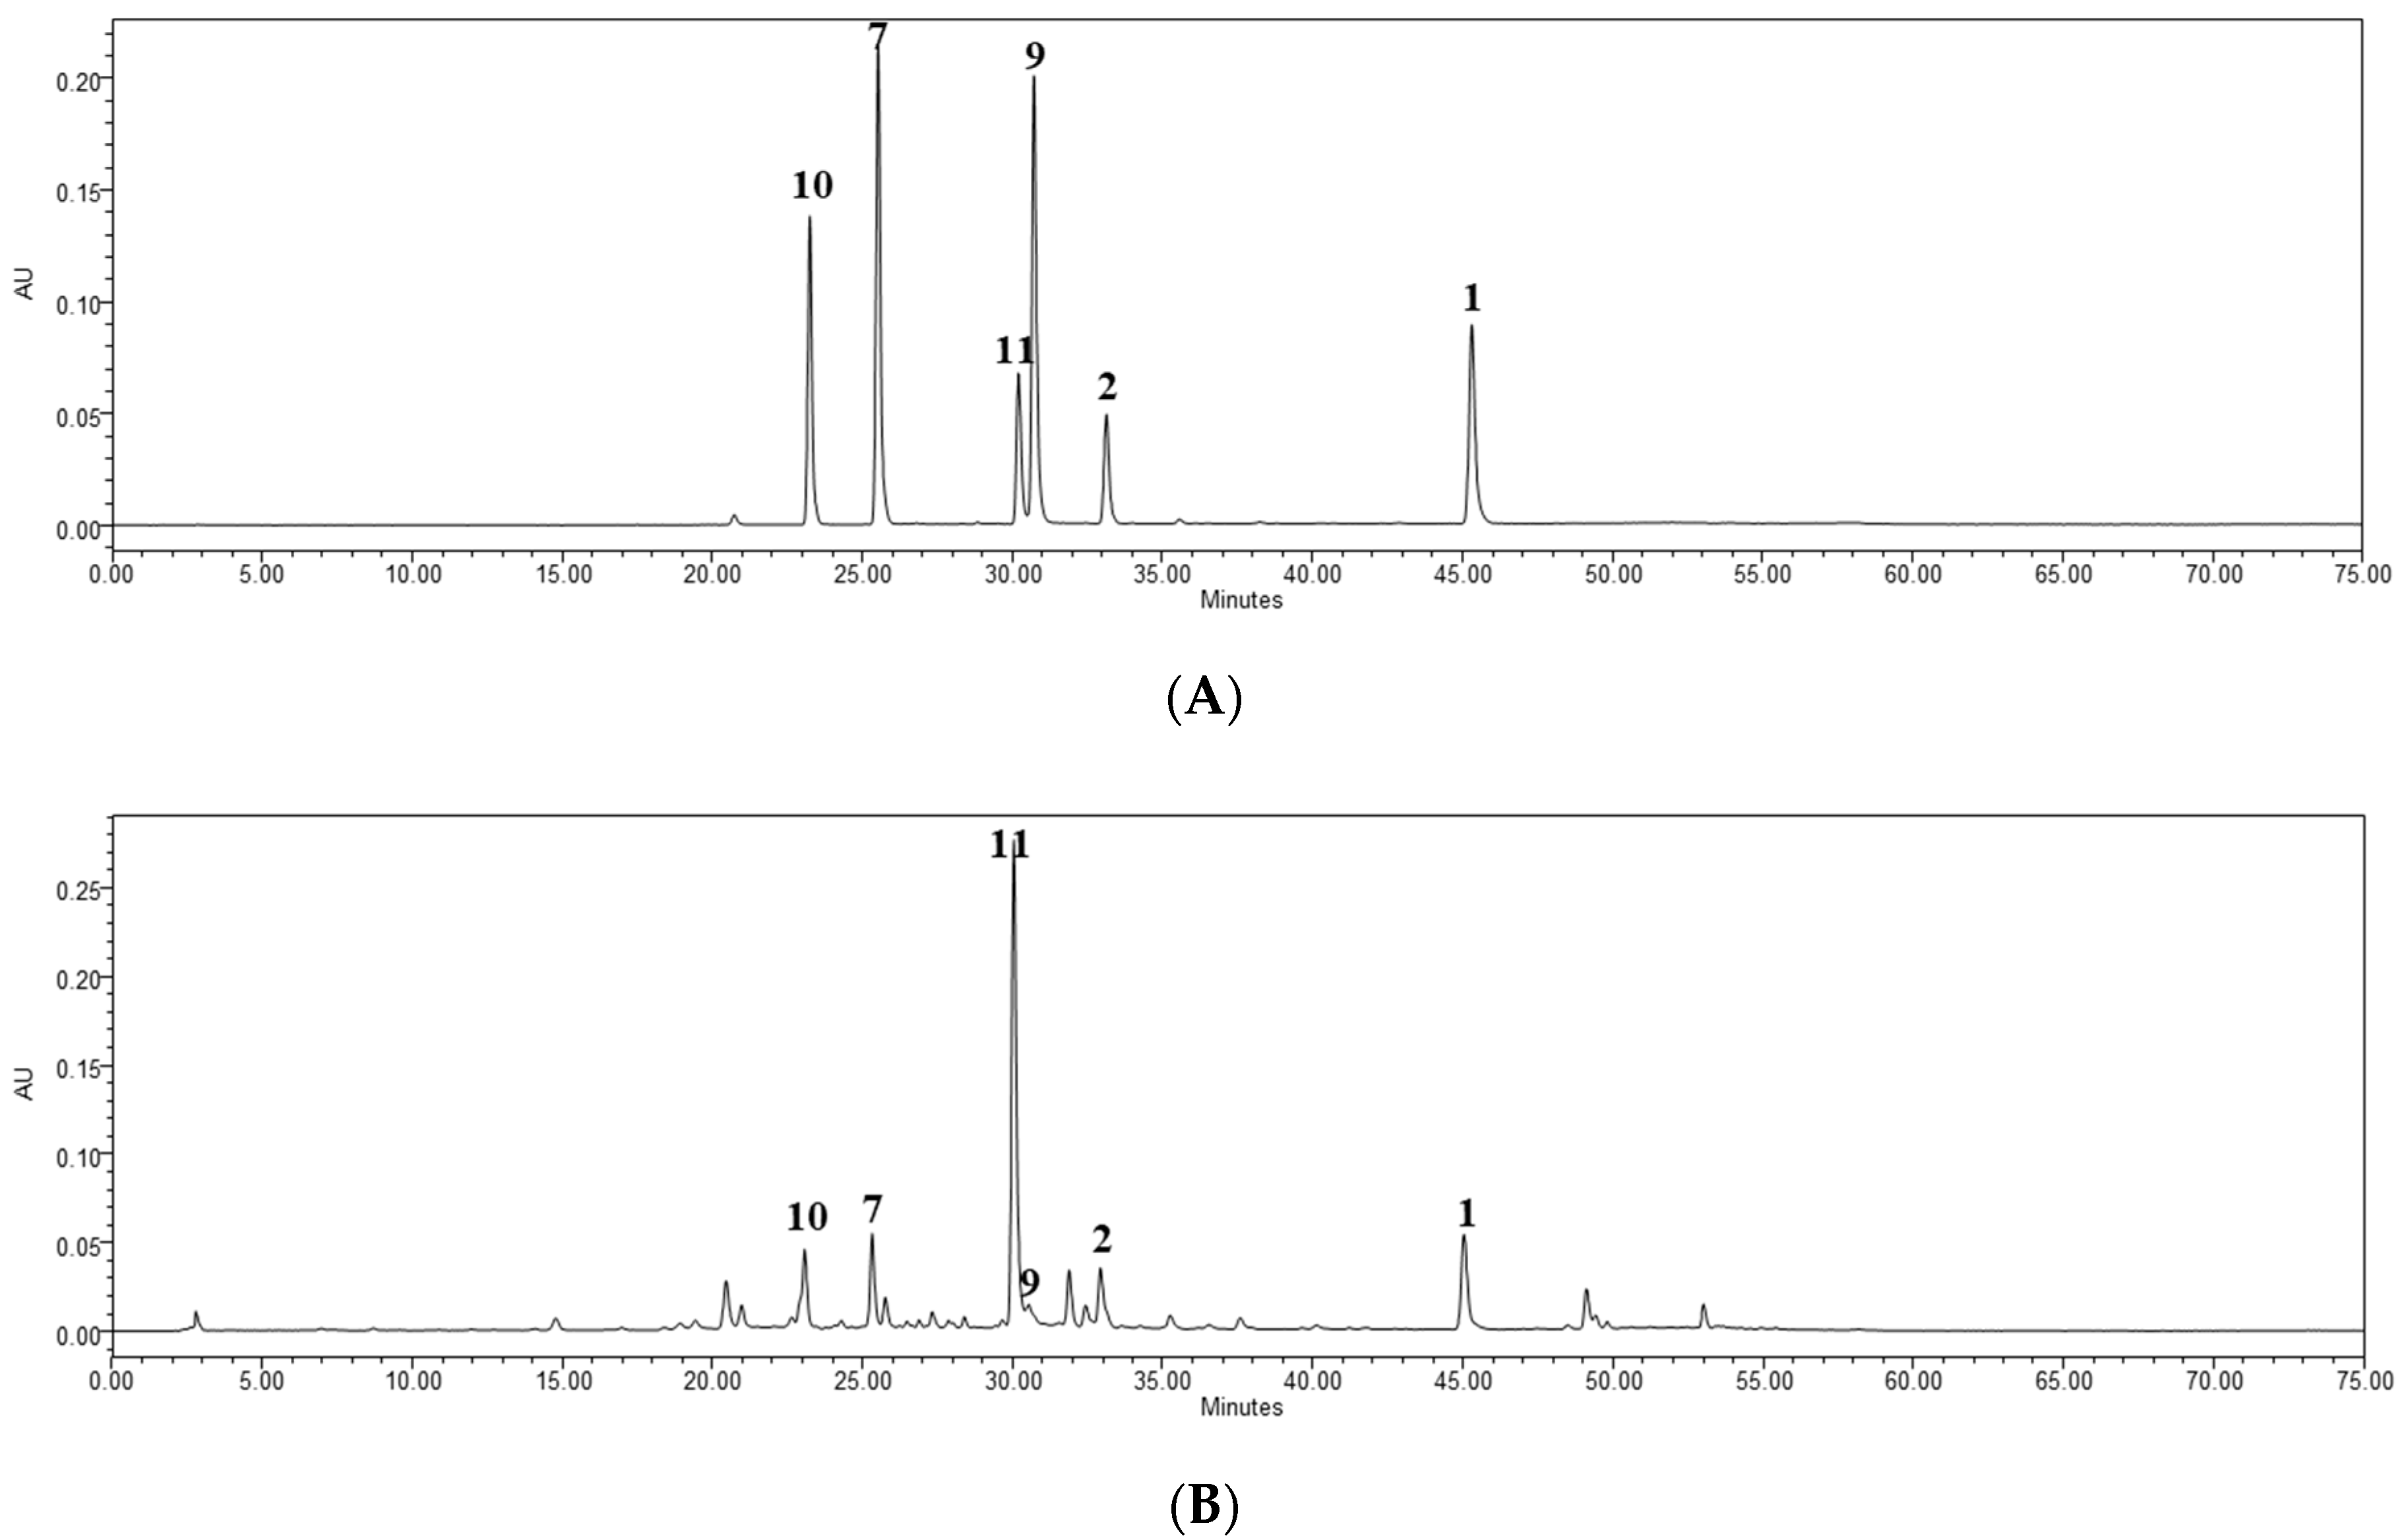
2.4. Quantitative HPLC Analysis of Six Bioactive Compounds

HPLC analysis was performed for quantitative evaluation of the active components of T. coreanum extract (Figure 2). After a preliminary screening of the collected samples, compound 11 was identified as the major component of T. coreanum extract, and compounds 9 and 10 were the second major components. The six compounds (1, 2, 7, 911) that showed the most potent inhibitory activity against AGE formation were examined. To establish a quality-control standard, this study developed a standard extraction method. The six major compounds were extracted using different solvent compositions and extraction times (Table 4). These six compounds were extracted with 50% ethanol (216.69 mg/g), and the content was extracted from 30 to 90 min stably. Based on the contents of the six compounds, 30–90 min extraction with 50% ethanol was the optimized solvent condition. Among T. coreanum and T. officinale, the contents of all compounds except compound 7 were higher in T. coreanum than in T. officinale, but the content of compound 7 was significantly lower than that of other compounds. In particular, the content of compound 11, which is the major bioactive compound, is about more 125.84 (mg/g) than T. officinale. (Figure 3). The quantitative study suggested that the IC50 values of the tested samples were inversely proportional to the total content of compounds 1, 2, 7, 911, indicating that these six compounds could play important roles in the inhibition of AGE formation. This finding suggested that, for medicinal purposes, HPLC analysis of these six compounds cac be performed for obtaining quality-control standards of T. coreanum. Actually, the T. coreanum extraction (extracted with 50% ethanol) demonstrated better inhibition activity than the 100% methanol extraction in all assay. In addition, we collected eight samples of T. coreanum from different regions, including Gyeongsangnam-do, Gyeongsangbuk-do, Gyeonggi-do, Chungcheongnam-do, Jeollabuk-do, and Gangwon-do. The contents of compounds 1 and 11 were the highest in samples obtained from Gyeongsangnam-do, Sancheong; compound 2 was highest in samples from Gyeongsangbuk-do, Yeongcheon; compound 8 was highest in samples from Gyeongsangnam-do, Sancheong, and Chungcheongnam-do, Taean; and compound 10 was highest in samples from Gyeongsangbuk-do, Yeongcheon and Gangwon-do, Yanggu. The content of compound 9 was 5 mg/g in average, and contained almost the same amount in all samples. Considering the total content of the six major bioactive compounds of T. coreanum, the most abundant compounds were harvested from Gyeongsangnam-do, Sancheong. The average content of major components in the extract was calculated based on quantitative analysis. We suggested that T. coreanum harvested from Gyeongsangnam-do, Sancheong was the best useful natural alternative medicine for diabetic complications. The results are summarized in Table 5.

3. Materials and Methods

3.1. Plant Materials

The aerial parts of T. coreanum (harvested Jiri-mountain, Sancheong-gun, Korea) were purchased from Kyung-Dong market, Seoul, Korea. In addition, the aerial parts of T. coreanum were collected from Sancheong, Yeongcheon, Gimpo, Taean, Jeongeup, Yanggu, and Bonghwa in Korea for analysis. Prof. Whang Wan Kyunn identified T. coreanum, which was purchased from Kyung-Dong market.

3.2. Instruments and Reagents

Methanol (MeOH), ethanol (EtOH), Hx, DCM, EA, BuOH, and distilled water were used for extraction, fractionation, and open column chromatography. Sephadex LH-20 (25–100 μm; Pharmacia, Stockolm, Sweden), MCI CHP 20P (Supelco, St. Louis, MO, USA), and ODS gel (400–500 mesh; Waters, Milford, MA, USA) were used for open column chromatography. Dimethyl sulfoxide-d6 (DMSO-d6) and methanol-d4 (CD3OD) were used as solvents for NMR analysis. Molecular weight was determined by using ultrahigh performance liquid chromatography and high-resolution mass spectrometry (UHPLC-HRMS) coupled with electrospray ionization hybrid linear trap-quadruple-Orbitrap MS (ESI/LTQ-Orbitrap) using an Ultimate 3000 RSLC (Thermo, Darmstadt, Germany). 1H-nuclear magnetic resonance (NMR) spectra were recorded at 600 MHz and 13C-NMR spectra were recorded at 150 MHz on a JEOL spectrometer. The chemical shifts are expressed in parts per million (ppm) on the δ scale and as coupling constants (J) in Hertz. HPLC was conducted using Empower Pro 2.0 software and determination was performed using WATERS 2695 system pump with a Waters 996 Photodiode array detector (USA). A Waters Kromasil C18 (4.6 × 250 mm, 5 μm) column was used as the separation column. HPLC-grade solvents, such as MeOH and distilled water (H2O), were purchased from J. T. Baker® (Phillipsburg, PA, USA). HPLC-grade phosphoric acid was obtained from DEAJUNG Chemical (Siheung, Gyeonggi, Korea). Reagents and solvents, including BSA, d-(−)-fructose, d-(+)-glucose, AMG, MGO, sodium azide, sodium phosphate buffer, α-glucosidase from Saccharomyces cerevisiae (Saccharomycetaceae), 4-nitrophenyl α-d-glucopyranoside (p-NPG), potassium phosphate buffer, acarbose, and sodium carbonate were purchased from Sigma-Aldrich Chemical Company (St. Louis, MO, USA).

3.3. Extraction, Fractionation, and Isolation from T. coreanum

The aerial parts of T. coreanum (6.5 kg) were dried and powdered prior to extraction with MeOH (20 L × 3) at 20–25 °C. Then, the filtrate was evaporated to dryness (1.17 kg) under reduced pressure, suspended in water (H2O), and then partitioned using Hx, EA, DCM, and BuOH. The result yielded Hx (16.6 g), DCM (80.48 g), EA (24.55 g), BuOH (101.93 g), and water (250.34 g) fractions.
The EA fraction was chromatographed with a Sephadex LH-20 solvent system to increase the elution of MeOH:Water (30:70 to 100:0), and it yielded eight sub-fractions. Compound 1 was isolated from sub-fraction 13 using MCI gel chromatography with 70% MeOH. Compound 2 was isolated from sub-fraction 9 using MCI gel chromatography with 50% MeOH. Sub-fraction 10 was separated using Sephadex LH-20 with 50% MeOH to obtain fractions 10-1 to 10-7. Separation of sub-fraction 10-3 using MCI gel chromatography with a 40% MeOH solvent system yielded seven fractions. Sub-fractions 10-3-7 were separated using MCI gel with a 50% MeOH solvent system to collect the fractions. Compound 3 was isolated from fractions 10-3-7-5 using Sephadex LH-20 with 40% MeOH. Sub-fraction 7 was separated using MCI gel column chromatography with 30% MeOH to obtain fractions 7-1 to 7-10. Separation of sub-fraction 7-5 using MCI gel column chromatography with 40% MeOH solvent system yielded four fractions. Compound 4 was isolated from sub-fractions 7-5-1 using Sephadex LH-20 with 40% MeOH. In addition, sub-fraction 7-8 was subjected to MCI gel chromatography with 50% MeOH and sub-fraction 7-8-2 was subjected to ODS column chromatography (50% MeOH) to yield compound 8. Sub-fraction 4 was separated using Sephadex LH-20 column chromatography with 20% MeOH to obtain fractions 4-1 to 4-5. Separation of sub-fraction 4-2 using MCI gel chromatography with 30% MeOH solvent system yielded four fractions, and compound 7 was isolated from sub-fraction 4-2-1 using ODS column chromatography with an eluent of 50% MeOH. In addition, sub-fraction 4-2-2 was subjected to ODS column chromatography with 50% MeOH to yield compound 9.
A portion of the BuOH fraction was separated using a Sephadex LH-20 column chromatography with a gradient elution solvent system of 30% to 100% MeOH to give six sub-fractions. Sub-fraction 2 was applied to MCI gel chromatography using a 10% to 60% MeOH gradient elution solvent system to yield sub-fractions 2-1 to 2-12. Compound 5 was isolated from sub-fraction 2-9 using a Sephadex LH-20 with 20% MeOH. In addition, compound 6 was isolated from sub-fraction 2-10 using MCI column chromatography with 50% MeOH. Sub-fractions 2-11 was isolated by recrystallization to yield compounds 10.
A portion of the water fraction was separated using Diaion HP-20 column chromatography with water, and then separated with 30%, 50%, 80%, and 100% MeOH. Sub-fraction 2 (50% MeOH) was applied to Sephadex LH-20 column chromatography using a 5% MeOH solvent system to yield sub-fractions, and sub-fraction 2-4 was subjected to MCI column chromatograph with 10% MeOH to yield sub-fraction 2-4-2. Sub-fraction 2-4-2 was chromatographed on ODS column with 10% MeOH to yield compound 11.

3.4. Identification of Compounds Isolated from T. coreanum

Luteolin (1): C15H10O6 ESI/LTQ-Orbitrap-HRMS m/z: 287.0546 [M + H]+; 1H-NMR (600 MHz, DMSO-d6): 7.41 (1H, dd, J = 1.8, 8.4 Hz, H-6′), 7.39 (1H, d, J = 2.4 Hz, H-2′), 6.89 (1H, d, J = 8.4 Hz, H-3′), 6.66 (1H, s, H-3), 6.43 (1H, d, J = 1.8 Hz, H-8), 6.18 (1H, d, J = 1.8 Hz, H-6); 13C-NMR (150 MHz, DMSO-d6): 181.8 (C-4), 164.3 (C-7), 164.0 (C-2), 161.6 (C-5, 2), 157.4 (C-9), 149.8 (C-4′), 145.9 (C-3′), 121.7 (C-6′), 119.1 (C-1′), 116.15 (C-5′), 113.5 (C-2′), 103.8 (C-10), 103.0 (C-3), 99.0 (C-6), 94.0 (C-8).
Luteolin-7-glucoside (2): C21H20O11; ESI/LTQ-Orbitrap-HRMS m/z: 449.1076 [M + H]+; 1H-NMR (600 MHz, DMSO-d6): 7.44 (2H, dd, J = 7.8, 9.0 Hz, H-2′, 6′), 6.90 (1H, d, J = 8.4 Hz, H-3′), 6.78 (1H, s, H-3), 6.74 (1H, s, H-8), 6.43 (1H, s, H-6), 5.07 (1H, d, J = 7.8 Hz, H-1′′); 13C-NMR (150 MHz, DMSO-d6): 181.7 (C-4), 164.3 (C-7), 162.7 (C-2), 160.9 (C-5), 156.7 (C-9), 149.8 (C-4′), 145.6 (C-3′), 121.0 (C-6′), 118.9 (C-1′), 115.8 (C-5′), 113.3 (C-2′), 105.1 (C-10), 102.9 (C-3), 99.6 (C-1′′), 99.3 (C-6), 94.5 (C-8), 76.9 (C-5′′), 76.2 (C-3′′), 72.9 (C-2′′), 69.3 (C-4′′), 60.4 (C-6′′).
Luteolin-4′-glucoside (3): C21H20O11; ESI/LTQ-Orbitrap-HRMS m/z: 449.1076 [M + H]+; 1H-NMR (600 MHz, DMSO-d6): 7.76 (1H, S, H-6′), 7.63 (1H, d, J = 9.0 Hz, H-2′), 6.94 (1H, d, J = 7.2 Hz, H-3′), 6.75 (1H, s, H-3), 6.50 (1H, s, H-8), 6.16 (1H, s, H-6), 4.86 (1H, d, J = 6.6 Hz, H-1′′); 13C-NMR (150 MHz, DMSO-d6): 181.7 (C-4), 164.3 (C-2), 164.0 (C-7), 161.6 (C-52), 157.4 (C-9), 149.8 (C-4′), 145.9 (C-3′), 121.7 (C-6′), 119.1 (C-1′), 116.15 (C-5′), 113.5 (C-2′), 103.8 (C-10), 103.0 (C-3), 102.2 (C-1′′), 99.2 (C-6), 94.3 (C-8), 77.5 (C-5′′), 76.1 (C-3′′), 73.5 (C-2′′), 70.1 (C-4′′), 61.0 (C-6′′).
Luteolin-7-rutinoside (4): C27H30O15; ESI/LTQ-Orbitrap-HRMS m/z: 595.1650 [M + H]+; 1H-NMR (600 MHz, DMSO-d6): 7.41 (2H, dd, J = 9.0, 12.0 Hz, H-2′, 6′), 6.88 (1H, d, J = 7.8 Hz, H-3′), 6.70 (1H, s, H-3), 6.66 (1H, s, H-8), 6.41 (1H, s, H-6), 5.04 (1H, d, J = 7.8 Hz, H-1′′), 4.5 (1H, s, H-1′′′); 13C-NMR (150 MHz, DMSO-d6): 182.4 (C-4), 165.1 (C-2), 163.4 (C-7), 161.8 (C-5), 157.4 (C-9), 150.7 (C-4′), 146.4 (C-3′), 121.7 (C-6′), 119.8 (C-1′), 116.6 (C-5′), 114.0 (C-2′), 105.9 (C-10), 103.6 (C-3), 101.1 (C-1′′), 100.4 (C-1′′′), 100.0 (C-6), 95.3 (C-8), 76.8, 76.1, 73.6, 72.6, 71.3, 70.8, 70.1, 68.9, 66.6, 18.3.
Isoetin-7-glucoside-2′-xyloside (5): C26H28O16; ESI/LTQ-Orbitrap-HRMS m/z: 597.1443 [M + H]+; 1H-NMR (600 MHz, DMSO-d6): 7.29 (1H, s, H-6′), 7.07 (1H, s, H-3), 6.74 (1H, s, H-3′), 6.72 (1H, s, H-8), 6.43 (1H, s, H-6), 5.08 (1H, d, J = 7.2 Hz, H-1′′), 4.88 (1H, d, J = 6.6 Hz, H-1′′′); 13C-NMR (150 MHz, DMSO-d6): 181.9 (C-4), 162.7 (C-7), 161.4 (C-2), 160.9 (C-5), 156.9 (C-9), 150.1 (C-4′), 149.8 (C-2′), 140.4 (C-5′), 114.3 (C-6′), 110.4 (C-1′), 108.5 (C-3), 105.0 (C-3′), 104.1 (C-10), 101.9 (C-1′′′), 99.6 (C-1′′), 99.1 (C-6), 94.3 (C-8), 76.9 (C-5′′′), 76.2 (C-3′′), 76.1 (C-3′′′), 73.0 (C-2′′′), 72.9 (C-2′′), 69.3 (C-4′′′), 69.1 (C-4′′), 65.6 (C-5′′), 60.4 (C-6′′′).
Isoetin-7-glucoside-2′-arabinoside (6): C26H28O16; ESI/LTQ-Orbitrap-HRMS m/z: 597.1448 [M + H]+; 1H-NMR (600 MHz, DMSO-d6): 7.30 (1H, s, H-6′), 7.16 (1H, s, H-3), 6.75 (1H, s, H-3′), 6.72 (1H, s, H-8), 6.42 (1H, d, J = 1.8 Hz, H-6), 5.09 (1H, d, J = 7.2 Hz, H-1′′), 4.86 (1H, d, J = 6.6 Hz, H-1′′′); 13C-NMR (150 MHz, DMSO-d6): 182.2 (C-4), 162.9 (C-7), 161.6 (C-2), 161.2 (C-5), 157.1 (C-9), 150.2 (C-4′, 2′), 140.5 (C-5′), 114.6 (C-6′), 110.4 (C-1′), 108.8 (C-3), 105.2 (C-3′), 104.2 (C-10), 101.6 (C-1′′′), 99.8 (C-1′′), 99.3 (C-6), 94.5 (C-8), 77.1 (C-5′′′), 76.4 (C-3′′′), 73.1 (C-2′′), 72.3 (C-2′′′), 70.5 (C-3′′), 69.5 (C-4′′′), 67.1 (C-4′′), 65.2 (C-5′′), 60.6 (C-6′′′).
Caffeic acid (7): C9H8O4; ESI/LTQ-Orbitrap-HRMS m/z: 179.0340 [M + H]+; 1H-NMR (600 MHz, DMSO-d6): 7.43 (1H, m, H-7), 7.02 (1H, s, H-2), 6.96 (1H, m, H-6), 6.76 (1H, d, J = 7.8 Hz, H-5), 6.19 (1H, m, H-8); 13C-NMR (150 MHz, DMSO-d6): 168.5 (C-9), 148.6 (C-4), 146.1 (C-3), 145.1 (C-7), 126.2 (C-1), 121.7 (C-6), 116.3 (C-5), 115.6 (C-2), 115.1 (C-8).
1-caffeoylglycerol (8): C12H14O6; ESI/LTQ-Orbitrap-HRMS m/z: 253.0340 [M − H]; 1H-NMR (600 MHz, DMSO-d6): 7.49 (1H, t, J = 7.8 Hz, H-7), 7.05 (1H, s, H-2), 6.99 (1H, d, J = 7.8 Hz, H-6), 6.76 (1H, d, J = 7.2 Hz, H-5), 6.26 (1H, t, J = 12.6, Hz, H-8), 4.15 (1H, m, H-1′a), 4.01 (1H, m, H-1′b), 3.70 (1H, m, H-2′), 3.38 (1H, m, H-3′); 13C-NMR (150 MHz, DMSO-d6): 166.8 (C-9), 148.7 (C-7), 145.8 (C-4), 145.3 (C-3), 125.6 (C-1), 121.6 (C-6), 116.0 (C-5), 114.9 (C-2), 114.1 (C-8), 69.6 (C-2′), 65.8 (C-1′), 62.9 (C-3′).
Ferulic acid (9): C10H10O4; ESI/LTQ-Orbitrap-HRMS m/z: 193.0497 [M − H]; 1H-NMR (600 MHz, DMSO-d6): 7.46 (1H, m, H-7), 7.24 (1H, s, H-2), 7.05 (1H, d, J = 8.4 Hz, H-6), 6.75 (1H, d, J = 8.4 Hz, H-5), 6.33 (1H, d, J = 15.6 Hz, H-8), 3.77 (1H, s, H-10); 13C-NMR (150 MHz, DMSO-d6): 168.0 (C-9), 149.1 (C-4), 147.9 (C-3), 144.5 (C-7), 125.8 (C-1), 122.8 (C-6), 115.6 (C-5), 115.5 (C-8), 111.1 (C-2), 55.7 (C-10).
Chlorogenic acid (10): C12H14O6; ESI/LTQ-Orbitrap-HRMS m/z: 353.0875 [M − H]; 1H-NMR (600 MHz, DMSO-d6): 7.41 (1H, d, J = 15.6 Hz, H-7′), 7.02 (1H, m, H-2′), 6.98 (1H, m, H-6′), 6.76 (1H, d, J = 8.4 Hz, H-5′), 6.15 (1H, d, J = 15.6 Hz, H-8′), 5.07 (1H, d, J = 5.7 Hz, H-3), 3.91 (1H, s, H-5), 3.55 (1H, s, H-4), 2.02 (2H, m, H-2), 2.02(1H, m, H-6a), 1.78 (1H, m, H-6b); 13C-NMR (150 MHz, DMSO-d6): 175.46 (C-7), 166.28 (C-9′), 148.86 (C-4′), 146.07 (C-3′), 145.48 (C-7′), 126.10 (C-1′), 121.93 (C-6′), 116.25 (C-5′), 115.21 (C-2′), 114.79 (C-8′), 73.99 (C-1), 71.39 (C-5), 70.84 (C-4), 68.59 (C-3), 37.69 (C-2), 36.75 (C-6).
Chicoric acid (11): C22H18O12; ESI/LTQ-Orbitrap-HRMS m/z: 473.0719 [M − H]; 1H-NMR (600 MHz, MeOH-d4): 7.47 (2H, d, J = 11.4 Hz, H-7′, 7′′), 7.05 (2H, s, H-2′, 2′′), 6.94 (2H, s, H-6′, 6′′), 6.75 (2H, s, H-5′, 5′′), 6.27 (2H, d, J = 15.0 Hz, H-8′, 8′′), 5.54 (2H, s, H-2, 3); 13C-NMR (150 MHz, DMSO-d6): 172.4 (C-1, 4), 166.7 (C-9′, 9′′), 147.5 (C-4′, 4′′), 145.2 (C-3′, 3′′), 144.7 (C-7′, 7′′), 125.7 (C-1′, 1′′), 121.0 (C-6′, 6′′), 144.5 (C-5′, 5′′), 113.3 (C-2′, 2′′), 113.1 (C-8′, 8′′), 73.6 (C-2, 3).

3.5. UHPLC-ESI/LTQ-Orbitrap-HRMS Conditions

A UHPLC-ESI/LTQ-Orbitrap-HRMS was used to determine the molecular weights of the isolated compounds. The samples were dissolved in distilled water. The column (Hypersil GOLD C18, 2.1 × 50 mm, 1.9 μm, Thermo) and sampler temperatures were maintained at 30 and 15 °C, respectively. Ultraviolet (UV) radiation was not used.
Solvent A (0.1% formic acid in water) and solvent B (0.1% formic acid in acetonitrile) were used as gradient linear mobile phases (0–18 min, 0–50% B; 18–20 min, 50–100% B). All eluents were filtered with a 0.45 μm polyvinylidene fluoride (PVDF) syringe filter. The flow rate was adjusted to 0.3 mL/min. The injection volume was 5.0 µL for the standard solution that was used. The optimized conditions for the analysis were as follows: heater temperature, 300 °C; capillary temperature, 360 °C; aux gas flow rate, 10 L/h; sheath gas flow rate, 45 L/h; S-lens RF level, 50.0 V; spray capillary voltage, 3.0 kV; full MS resolution, 35,000 (FWHM @ m/z 200); full MS AGC target, 3e6; and full MS maximum IT, 200 ms.

3.6. Measurement of BSA-glucose and Fructose Inhibitory Activity

Inhibition of AGE formation in BSA-glucose system was determined using the spectrophotometric method described previously [37]. All test samples were dissolved in 10% DMSO. The assay mixture was 50 mM phosphate buffer (pH 7.4) with 0.02% sodium azide, BSA (10 mg/mL), 0.4 M d-fructose and d-glucose, and sample or buffer. This mixture was incubated at 60 °C for 2 days. After incubation, the fluorescence was measured (excitation and emission wavelengths 350 and 450 nm, respectively) in a 96-black well plate. We used AG as a positive control. Three replicate samples were run for each set. The inhibitory activity on AGE formation was calculated using the following formula: {(Ac − As)/Ac} × 100, where Ac is fluorescence of the control, and As is the fluorescence of the sample.

3.7. Measurement of BSA-MGO Inhibitory Activity

This assay was performed according to a previously described method, with modifications [38]. The inhibitory effect on protein glycation induced by MGO (40% aqueous solution) and the main reactive intermediate compound formed in Maillard reaction were evaluated. All test samples were dissolved in 10% DMSO. The assay mixture was 50 mM phosphate buffer (pH 7.4) with 0.02% sodium azide, BSA (1 mg/mL), 7 mM MGO, and sample or buffer. This mixture was incubated at 60 °C for 2 days. After incubation, fluorescence was measured on (excitation and emission wavelengths of 340 and 420 nm, respectively) in a 96-black well plate. We used AG as a positive control. Three replicate samples were run for each set. The inhibitory activity was calculated using the same equation applied in BSA-glucose assay.

3.8. Measurement α-Glucosidase Inhibitory Activity

This assay was performed using a 96-well microplate reader and a spectrophotometer. The reaction mixture contained 100 mM phosphate buffer (pH 6.8), 2.5 mM p-NPG, and sample or buffer. A chromogenic substance was used for quantification purposes. After the addition of mixture solution to each well, 10 mM phosphate buffer (20 µL, pH 6.8) containing 0.2 U/mL α-glucosidase was added. This mixture was incubated at 37 °C for 15 min. The reaction was stopped by adding 80 µL of 0.2 mol/L sodium carbonate solution. The absorbance was measured at 405 nm immediately after stopping the reaction using a SUNRISE microplate reader. Acarbose dissolved in 10% DMSO was used as the positive control. Three replicate samples were run for each set. The inhibitory activity was calculated using the equation applied in BSA-glucose assay, but absorbance was measured instead of fluorescence.

3.9. Statistical Analysis

All assays were performed in triplicate. Data were presented as mean ± standard deviation (SD) and analyzed by using one-way ANOVA. The data were considered to have statistical significance at p < 0.05.

3.10. HPLC Analysis

To identify the six major compounds from T. coreanum, a Waters Kromasil column C18 (4.6 × 250 mm, 5 μm) column was used for determination major compounds in T. coreanum. Solvent A (0.2% phosphoric acid in water) and solvent B (methanol) were used as gradient linear mobile phases (0–15 min, 93–81% B; 15–25 min, 81–60% B; 25–45 min, 60–40% B) at a mobile phase rate of 1 mL/min. All eluents were filtered with a 0.45 μm PVDF syringe filter. The injection volume was 10 μL, and compounds were measured at a wavelength of 330 nm. For preparation of extract stock solutions, plant powders were sonicated with MeOH for 60 min and dried under vacuum by using a rotary evaporator at 50 °C. Then, they were dissolved in MeOH to a concentration of 10,000 ppm. Standard compound stock solutions were dissolved in MeOH. All analyzed solutions were strained using a 0.45 μm PVDF membrane filter prior to injection. The standard calibration curve was constructed using five concentrations. The linear relationship between peak area and concentration is presented in Table 6. The concentrations of the six major compounds were calculated using regression equations based on the calibration curves. To optimize the extraction conditions, a patent extraction method was performed using MeOH and EtOH with different solvent compositions (30%, 50%, 70%, and 100%) and extracted for 30, 60, 90, and 120 min, respectively.

4. Conclusions

After confirming that EA, BuOH, and water fraction of T. coreanum exhibited the strongest inhibitory capacities, we isolated the 11 major bioactive compounds of T. coreanum and characterized their structures. The isolated bioactive compounds inhibited AGE formation in two systems and α-glucosidase activity, which is related to diabetes and its complications. Compounds 3, 4, and 11 exhibited stronger inhibitory activity than other compounds against α-glucosidase. All compounds except compound 9 showed a stronger inhibition than the positive control and compound 11 showed the strongest activity in the BSA-glucose system. In the BSA-MGO system, all compounds showed a higher inhibition rate than the positive control. Compound 11 exhibited higher AGE-inhibitory activity than the positive control in the two systems and showed higher inhibitory potency against α-glucosidase, followed by compound 10. Compounds 1, 2, 7, 911 with a high inhibitory effect were investigated content of T. coreanum from variety region in Korea and T. officinale using HPLC. T. coreanum showed higher content of these bioactive compounds than T. officinale. Indeed, T. coreanum showed stronger inhibition of AGE formation and α-glucosidase activity than T. officinale. We suggested that T. coreanum was superior to T. officinale and that compounds 10 and 11 were the major components, which are responsible for the antidiabetic effects of T. coreanum. We also suggested that 30–90 min extraction with 50% ethanol was the optimized solvent condition and T. coreanum harvested from Gyeongsangnam-do, Sancheong was the most useful natural alternative medicine for diabetic complications. Based on these results, we demonstrated the preventive and therapeutic efficacy of T. coreanum and its potential use as a cost-effective phytopharmaceutical medicine in complementary therapy against type-2 diabetes and its complications. It is required to evaluate whether further research, including in vivo studies and clinical trials on the efficacy of these isolated compounds, are sufficient to the compounds be used in clinical applications. In addition, the isolated compound may have a beneficial therapeutic effect on other diseases.

Author Contributions

K.H.L. and W.K.W. conceived and designed the experiments; K.H.L. performed the extraction, isolation, bioactivities experiments, and quantitative analysis, analyzed the data, and wrote the paper.

Funding

This research was supported by the Chung-Ang University Graduate Research Scholarship in 2017.

Conflicts of Interest

The authors declare no conflict of interest.

References

  1. Ho, S.-C.; Chang, P.-W.; Tong, H.-T.; Yu, P.-Y. Inhibition of fluorescent advanced glycation end-products and N-Carboxymethyllysine formation by several floral herbal infusions. Int. J. Food Prop. 2013, 17, 617–628. [Google Scholar] [CrossRef]
  2. Sharma, C.; Kaur, A.; Thind, S.S.; Singh, B.; Raina, S. Advanced glycation End-products (AGEs): An emerging concern for processed food industries. J. Food Sci. Technol. 2015, 52, 7561–7576. [Google Scholar] [CrossRef] [PubMed]
  3. Semba, R.D.; Nicklett, E.J.; Ferrucci, L. Does accumulation of advanced glycation end products contribute to the aging phenotype? J. Gerontol. A Biol. Sci. Med. Sci. 2010, 65A, 963–975. [Google Scholar] [CrossRef] [PubMed]
  4. Makita, Z.; Radoff, S.; Rayfield, E.J.; Yang, Z.; Skolnik, E.; Delaney, V.; Friedman, E.A.; Cerami, A.; Vlassara, H. Advanced glycosylation end products in patients with diabetic nephropathy. N. Engl. J. Med. 1991, 325, 836–842. [Google Scholar] [CrossRef] [PubMed]
  5. Valente, T.; Gella, A.; Fernàndez-Busquets, X.; Unzeta, M.; Durany, N. Immunohistochemical analysis of human brain suggests pathological synergism of Alzheimer′s disease and diabetes mellitus. Neurobiol. Dis. 2010, 37, 67–76. [Google Scholar] [CrossRef] [PubMed]
  6. Van Heerebeek, L.; Hamdani, N.; Handoko, M.L.; Falcao-Pires, I.; Musters, R.J.; Kupreishvili, K.; Ijsselmuiden, A.J.; Schalkwijk, C.G.; Bronzwaer, J.G.; Diamant, M.; et al. Diastolic stiffness of the failing diabetic heart: Importance of fibrosis, advanced glycation end products, and myocyte resting tension. Circulation 2008, 117, 43–51. [Google Scholar] [CrossRef] [PubMed]
  7. Cristina, D.-A. Carboxymethyl-lysine: Thirty years of investigation in the field of AGE formation. Food Funct. 2016, 7, 46–57. [Google Scholar]
  8. Uribarri, J.; Del Castillo, M.D.; de la Maza, M.P.; Filip, R.; Gugliucci, A.; Luevano-Contreras, C.; Macías-Cervantes, M.H.; Bastos, D.H.M.; Medrano, A.; Menini, T.; et al. Dietary advanced glycation end products and their role in health and disease. Adv. Nutr. 2015, 6, 461–473. [Google Scholar] [CrossRef] [PubMed]
  9. Wu, C.-H.; Huang, S.-M.; Lin, J.-A.; Yen, G.-C. Inhibition of advanced glycation endproduct formation by foodstuffs. Food Funct. 2011, 2, 224–234. [Google Scholar] [CrossRef] [PubMed]
  10. Li, X.; Zheng, T.; Sang, S.; Lv, L. Quercetin inhibits advanced glycation end product formation by trapping methylglyoxal and glyoxal. J. Agric. Food Chem. 2014, 62, 12152–12158. [Google Scholar] [CrossRef] [PubMed]
  11. Kirchner, A. Der gemeine Lowenzahn, Taraxacum officinale Web. Der Versuch einer monographie in landwirtschaftlicher betrachtung. Zeitschrift fur Acker-und Pflanzenbau. 1955, 99, 488–518. [Google Scholar]
  12. Faber, K. Dandelion-Taraxacum officinale Weber. Pharmazie 1958, 13, 423–436. [Google Scholar] [PubMed]
  13. Lee, S.; Choi, M.J.; Choi, J.M.; Lee, S.; Kim, H.Y.; Cho, E.J. Flavonoids from Taraxacum coreanum protect from radical-induced oxidative damage. J. Med. Plant. Res. 2012, 6, 5377–5384. [Google Scholar]
  14. Lee, M.-H.; Kang, H.; Lee, K.; Yang, G.; Ham, I.; Bu, Y.; Kim, H.; Choi, H.-Y. The aerial part of Taraxacum coreanum extract has an anti-inflammatory effect on peritoneal macrophages in vitro and increases survival in a mouse model of septic shock. J. Ethnopharmacol. 2013, 146, 1–8. [Google Scholar] [CrossRef] [PubMed]
  15. Paul, N.C.; Kim, W.K.; Woo, S.K.; Park, M.S.; Yu, S.H. Diversity of endophytic fungi associated with Taraxacum coreanum and their antifungal activity. Mycobiology 2006, 34, 185–190. [Google Scholar] [CrossRef] [PubMed]
  16. Choi, J.-H.; Shin, K.-M.; Kim, S.-Y.; Hong, J.-P.; Lee, Y.S.; Kim, H.J.; Park, H.-J.; Lee, K.-T. Taraxinic Acid, a hydrolysate of sesquiterpene lactone glycoside from the Taraxacum coreanum NAKAI, induces the differentiation of human acute promyelocytic leukemia HL-60 Cells. Biol. Pharm. Bull. 2002, 25, 1446–1450. [Google Scholar] [CrossRef] [PubMed]
  17. Lee, S.; Han, S.; Kim, H.M.; Lee, J.M.; Mok, S.-Y.; Lee, S. Isolation and identification of phytochemical constituents from Taraxacum coreanum. J. Korean Soc. Appl. Biol. Chem. 2011, 54, 73–78. [Google Scholar] [CrossRef]
  18. Im, D.Y.; Lee, K.I. Nitric oxide production inhibitory and scavenging activity and tyrosinase inhibitory activity of extracts from Taraxacum officinale and Taraxacum coreanum. Korean J. Med. Crop. Sci. 2011, 19, 362–367. [Google Scholar] [CrossRef]
  19. Lee, H.H.; Lee, S.Y. Cytotoxic and antioxidant effects of Taraxacum coreanum Nakai. and T. officinale WEB. extracts. Korean J. Med. Crop. Sci. 2008, 16, 79–85. [Google Scholar]
  20. Oh, C.H.; Shin, N.S.; Kwan, J.; Lee, K.G.; Lee, S.R.; Lee, C.H. Antidiabetic Effects of water extract from Taraxacum coreanum Nakai in type II diabetic mice. Korean J. Orient. Physiol. Pathol. 2012, 26, 707–713. [Google Scholar]
  21. Szawara-Nowak, D.; Koutsidis, G.; Wiczkowski, W.; Zieliñski, H. Evaluation of the in vitro inhibitory effects of buckwheat enhanced wheat bread extracts on the formation of advanced glycation end-products (AGEs). LWT-Food Sci. Technol. 2014, 58, 327–334. [Google Scholar] [CrossRef]
  22. Yang, J.Y.; Park, J.H.; Chung, N.; Lee, H.S. Inhibitory potential of constituents from Osmanthus fragrans and structural analogues against advanced glycation end products, α-Amylase, α-Glucosidase, and oxidative stress. Sci. Rep. 2017, 7, 45746. [Google Scholar] [CrossRef] [PubMed]
  23. Lee, C.-C.; Lee, B.-H.; Lai, Y.-J. Antioxidation and antiglycation of Fagopyrum tataricum ethanol extract. J. Food Sci. Technol. 2015, 52, 1110–1116. [Google Scholar] [CrossRef] [PubMed]
  24. Kim, H.-Y.; Lim, S.-H.; Prak, Y.H.; Ham, H.J.; Lee, K.-J.; Park, D.S.; Kim, K.-H.; Kim, S. Screening of α-Amylase, α-Glucosidase and Lipase inhibitory activity with Gangwon-do wild plants extracts. J. Korean Soc. Food Sci. Nutr. 2011, 40, 308–315. [Google Scholar] [CrossRef]
  25. Lee, S.; Han, S.; Kim, H.M.; Lee, J.M.; Kim, J.; Park, C.-G.; Lee, S. Simultaneous determination of luteolin and luteoloside in dandelions using HPLC. Hort. Environ. Biotechnol. 2011, 52, 536–540. [Google Scholar] [CrossRef]
  26. Kassem, M.; Mosharrafa, S.A.; Saleh, N.A.; Abdel-Wahabb, S.M. Two new flavonoids from Retama raetam. Fitoterapia 2000, 71, 649–654. [Google Scholar] [CrossRef]
  27. Shalaby, N.M.; Maghraby, A.S.; el-Hagrassy, A.M. Effect of Daucus carota var. boissieri extracts on immune response of schistosoma mansoni infected mice. Folia Microbiol. 1999, 44, 441–448. [Google Scholar] [CrossRef]
  28. Gluchoff-Fiasson, K.; Favre-Bonvin, J.; Fiasson, J.L. Glycosides and acylated glycosides of isoetin from European species of Hypochoeris. Phytochemistry 1991, 30, 1670–1675. [Google Scholar] [CrossRef]
  29. Shi, S.Y.; Zhou, C.X.; Xu, Y.; Tao, Q.F.; Bai, H.; Lu, F.S.; Lin, W.Y.; Chen, H.Y.; Zheng, W.; Wang, L.W.; et al. Studies on chemical constituents from herbs of Taraxacum mongolicum. Zhongguo Zhong Yao Za Zhi 2008, 33, 1147–1157. [Google Scholar] [PubMed]
  30. Bi, Y.-F.; Zhieng, X.-K.; Feng, W.-S.; Shi, S.-P. Isolation and structural identification of chemical constituents from Selaginella tamariscina (Beauv.) Spring. Yao Xue Xue Bao = Acta Pharm. Sinica 2004, 39, 41–45. [Google Scholar]
  31. Forino, M.; Tartaglione, L.; Dell’Aversano, C.; Ciminiello, P. NMR-based identification of the phenolic profile of fruits of Lycium barbarum (goji berries). Isolation and structural determination of a novel N-feruloyl tyramine dimer as the most abundant antioxidant polyphenol of goji berries. Food Chem. 2016, 194, 1254–1259. [Google Scholar] [CrossRef] [PubMed]
  32. Nguyen, P.H.; Zhao, B.T.; Lee, J.H.; Kim, Y.H.; Min, B.S.; Woo, M.H. Isolation of benzoic and cinnamic acid derivatives from the grains of Sorghum bicolor and their inhibition of lipopolysaccharide-induced nitric oxide production in RAW 264.7 cells. Food Chem. 2015, 168, 512–519. [Google Scholar] [CrossRef] [PubMed]
  33. Iwahashi, H.; Morishita, H.; Osaka, N.; Kido, R. 3-O-feruloyl-4-O-caffeoylquinic acid from coffee beans. Phytochemistry 1985, 24, 630–632. [Google Scholar] [CrossRef]
  34. Schmidt, B.; Jaroszewski, J.W.; Bro, R.; Witt, M.; Staerk, D. Combining PARAFAC analysis of HPLC-PDA profiles and structural characterization using HPLC-PDA-SPE-NMR-MS experiments: Commercial preparations of St. John’s Wort. Anal. Chem. 2008, 80, 1978–1987. [Google Scholar] [CrossRef] [PubMed]
  35. Cheminata, A.; Zawatzky, R.; Becker, H.; Brouillard, R. Caffeoyl conjugates from Echinacea species: Structures and biological activity. Phytochemistry 1988, 27, 2787–2794. [Google Scholar] [CrossRef]
  36. Crascì, L.; Lauro, M.R.; Puglisi, G.; Panico, A. Natural antioxidant polyphenols on inflammation management: Anti-glycation activity vs metalloproteinases inhibition. Crit. Rev. Food Sci. Nutr. 2018, 58, 893–904. [Google Scholar] [CrossRef] [PubMed]
  37. Lee, Y.K.; Bang, H.J.; Oh, J.B.; Whang, W.K. Bioassay-guided isolated compounds from Morinda officinalis inhibit alzheimer′s disease pathologies. Molecules 2017, 22, 1638. [Google Scholar]
  38. Ou, J.; Huang, J.; Wang, M.; Ou, S. Effect of rosmarinic acid and carnosic acid on AGEs formation in vitro. Food Chem. 2017, 221, 1057–1061. [Google Scholar] [CrossRef] [PubMed]
Sample Availability: Samples of the compounds are not available from the authors.
Figure 1. Structures of the compounds 111.
Molecules 23 02148 g001aMolecules 23 02148 g001b
Figure 2. Chromatograms of (A) standards mixture and (B) T. coreanum ext.
Molecules 23 02148 g002
Figure 3. Content of major compounds in Taraxacum coreanum and T. officinale.
Molecules 23 02148 g003
Table 1. IC50 of the extracts and fractions from T. coreanum on advanced glycation end-product (AGE) formation in BSA/glucose and BSA/ MGO systems and α-glucosidase inhibitory activities.
SampleIC50 a (μg/mL)
BSA/GlucoseBSA/MGOα-Glucosidase
Ext.360.41 ± 23.58 ***311.33 ± 14.86 ***1623.08 ± 184.40 ***
Hx fr.ND d529.24 ± 4.75 *1270.70 ± 72.58 ***
DCM fr.297.10 ± 5.26 **247.47 ± 23.87 ***2041.44 ± 469.46 **
EA fr.119.47 ± 12.06 **127.31 ± 5.51 ***554.53 ± 36.46 ***
BuOH fr.333.71 ± 27.02 **171.40 ± 69.28 *ND d
Water fr.435.60 ± 59.57 **213.96 ± 3.38 ***ND d
T. officinale201.25 ± 33.99 ***105.37 ± 24.42 **2195.89 ± 267.35 **
T. coreanum183.97 ± 28.52 **98.82 ± 2.51 *444.97 ± 55.86 **
AMG b218.57 ± 24.38 ***67.51 ± 5.27 **-
Acarbose c--116.86 ± 7.23 **
Data are presented as mean ± SD (n = 3). a IC50 calculated from the least-squares regression line of the logarithmic concentrations plotted against the residual activity. b AMG was used as a positive control of AGE formation inhibitory activities. c Acarbose was used as a positive control of α-glucosidase inhibitory activity. d ND: not detected. * Indicates a significant difference from control; * p < 0.5, ** p < 0.05, *** p < 0.005. -: not measured.
Table 2. Identification of compounds 111 in T. coreanum by UHPLC-ESI/LTQ-Orbitrap-HRMS analysis.
Compound No.Rt (min)FormulaMass ModeTheoretical MassObserved MassAss Error (Da)Mass Accuracy (ppm)
16.86C15H10O6Positive287.0550287.05460.00041.4
25.89C21H20O11Positive449.1078449.10760.00020.4
36.36C21H20O11Positive449.1078449.10760.00020.4
45.86C27H30O15Positive595.1657595.16500.00071.2
55.01C26H28O16Positive597.1450597.14480.00020.3
65.26C26H28O16Positive597.1450597.14430.00071.2
75.01C26H28O16Positive597.1450597.14480.00020.3
84.30C9H8O4Negative179.0339179.03400.00010.6
95.78C12H14O6Negative193.0495193.04970.00021.0
104.87C10H10O4Negative253.0707253.07140.00071.4
114.13C16H18O9Negative353.0867353.08750.00082.3
Table 3. IC50 of the compounds 111 from T. coreanum on advanced glycation end-product (AGE) formation and α-glucosidase inhibitory activities.
CompoundIC50 a (μM)
BSA/GlucoseBSA/MGOα-Glucosidase
1236.48 ± 9.11 **66.11 ± 17.06 **ND
2122.81 ± 2.02 ***107.83 ± 8.14 **1455.95 ± 126.32 ***
3423.30 ± 18.04 **90.81 ± 21.74 **598.24 ± 146.52 *
4253.31 ± 5.10 **135.65 ± 2.64 **670.50 ± 50.83 ***
5268.18 ± 3.41 **129.79 ± 28.27 **ND d
6238.05 ± 13.82 ***148.37 ± 36.29 **ND d
7324.21 ± 8.29 **79.65 ± 23.45 ***5134.55 ± 803.54 **
8306.99 ± 10.16 **151.67 ± 65.36 **2951.13 ± 3.94 *
9704.86 ± 167.43 *140.72 ± 67.78 **ND d
1083.62 ± 55.49 ***138.18 ± 1.91 **1148.67 ± 162.05 **
1164.70 ± 16.73 **141.21 ± 8.76 **639.25 ± 12.51 ***
AMG b601.53 ± 50.35 ***295.21 ± 42.67 ***-
Acarbose c--355.86 ± 17.25 ***
Data are presented as mean ± SD (n = 3). a IC50 calculated from the least-squares regression line of the logarithmic concentrations plotted against the residual activity. b AMG was used as a positive control of AGE formation inhibitory activity. c Acarbose was used as a positive control of α-glucosidase inhibitory activity. d ND: not detected. * Indicates a significant difference from control; * p < 0.5, ** p < 0.05, *** p < 0.005. -: not measured.
Table 4. Content of compounds 1, 2, 7, 911 with respect to different solvent compositions and extraction time. MeOH: methanol; EtOH: ethanol.
Solvent CompositionCompound 1 (mg/g)Compound 2 (mg/g)Compound 7 (mg/g)Compound 9 (mg/g)Compound 10 (mg/g)Compound 11 (mg/g)
30% MeOH 60 min0.31 ± 0.070.49 ± 0.040.47 ± 0.134.58 ± 0.773.64 ± 0.35131.98 ± 9.02
50% MeOH 60 min0.17 ± 0.050.65 ± 0.090.36 ± 0.094.66 ± 0.454.81 ± 0.45181.58 ± 9.80
70% MeOH 60 min0.21 ± 0.030.61 ± 0.110.46 ± 0.044.71 ± 0.354.66 ± 0.72173.37 ± 11.15
100% MeOH 60 min0.20 ± 0.020.32 ± 0.020.23 ± 0.024.53 ± 0.101.59 ± 0.1946.06 ± 4.44
30% EtOH 60 min0.27 ± 0.040.73 ± 0.060.60 ± 0.064.62 ± 0.374.35 ± 0.31161.46 ± 5.19
50% EtOH 60 min0.39 ± 0.090.76 ± 0.070.47 ± 0.064.69 ± 0.455.40 ± 0.19204.98 ± 12.60
70% EtOH 60 min0.20 ± 0.070.68 ± 0.090.46 ± 0.014.68 ± 0.755.23 ± 0.26203.60 ± 0.98
100% EtOH 60 min0.16 ± 0.040.30 ± 0.040.35 ± 0.054.39 ± 0.650.90 ± 0.3333.65 ± 4.45
70% MeOH 30 min0.19 ± 0.050.61 ± 0.040.50 ± 0.044.77 ± 0.415.15 ± 0.44206.12 ± 3.14
70% MeOH 60 min0.41 ± 0.100.79 ± 0.090.49 ± 0.094.75 ± 0.435.19 ± 0.49210.91 ± 2.24
70% MeOH 90 min0.24 ± 0.010.75 ± 0.110.48 ± 0.124.76 ± 0.394.99 ± 0.30208.72 ± 1.15
70% MeOH 120 min0.27 ± 0.030.73 ± 0.210.60 ± 0.144.62 ± 0.454.35 ± 0.41161.46 ± 0.95
Data are mean ± SD (n = 3) in mg/g dried sample.
Table 5. Content of compounds 1, 2, 7, 9, 10 by region in Korea.
SampleContents (mg/g)
12791011
Gyeongsangnam-do, Sancheong83.33 ± 0.1428.30 ± 0.094.08 ± 0.094.59 ± 0.1512.82 ± 0.21562.36 ± 6.21
Gyeongsangbuk-do, Yeongcheon41.37 ± 0.0944.10 ± 0.111.23 ± 0.054.45 ± 0.0920.32 ± 0.66215.27 ± 0.2.11
Gyeonggi-do, Gimpo5.08 ± 0.046.40 ± 0.041.17 ± 0.014.39 ± 0.112.02 ± 0.0446.33 ± 0.96
Chungcheongnam-do, Taean7.05 ± 0.0215.87 ± 0.125.19 ± 0.054.47 ± 0.192.75 ± 0.04106.10 ± 2.64
Jeollabuk-do, Jeongeup7.10 ± 0.0513.24 ± 0.073.69 ± 0.014.62 ± 0.1610.53 ± 0.02230.07 ± 2.98
Gangwon-do, Yanggu1.23 ± 0.021.38 ± 0.091.52 ± 0.014.48 ± 0.054.54 ± 0.0470.16 ± 1.65
Gangwon-do, Yanggu1.06 ± 0.012.03 ± 0.092.80 ± 0.034.54 ± 0.0424.11 ± 0.47230.27 ± 3.11
Gyeongsangbuk-do, Bonghwa10.10 ± 0.0817.66 ± 0.092.57 ± 0.094.56 ± 0.0413.14 ± 0.69180.62 ± 2.64
Data are mean ± SD (n = 3) in mg/g dried sample.
Table 6. Linear relation between peak area and concentration (n = 3).
Compound NumberRt (min)Regression Equationr2Linear Range (µg/mL)LOD (µg/mL)LOQ (µg/mL)
1 y = 24 , 645 x + 3862.8 0.99990.5–500.120.36
2 y = 11 , 593 x + 2829.2 0.99990.5–500.240.73
7 y = 42 , 466 x 819.39 0.99990.5–500.220.67
9 y = 442 , 002 x ( 2 × 10 6 ) 0.97280.5–500.270.82
10 y = 26 , 896 x 4511.4 0.99980.5–500.130.40
11 y = 16 , 122 x 2382.2 0.99990.5–500.310.95

