Pharmacokinetic Studies of Three Alkaloids in Rats After Intragastrical Administration of Lycopodii Herba Extract by LC-MS/MS

Abstract
:
1. Introduction
2. Results and Discussion
2.1. Optimization of LC-MS/MS Conditions
2.2. Optimization of Sample Pretreatment
2.3. Method Validation
2.3.1. Selectivity, Crosstalk, and Carryover Effect
2.3.2. Linearity, LLOQ, and ULOQ
2.3.3. Precision and Accuracy
2.3.4. Extraction Recovery and Matrix Effect
2.3.5. Stability
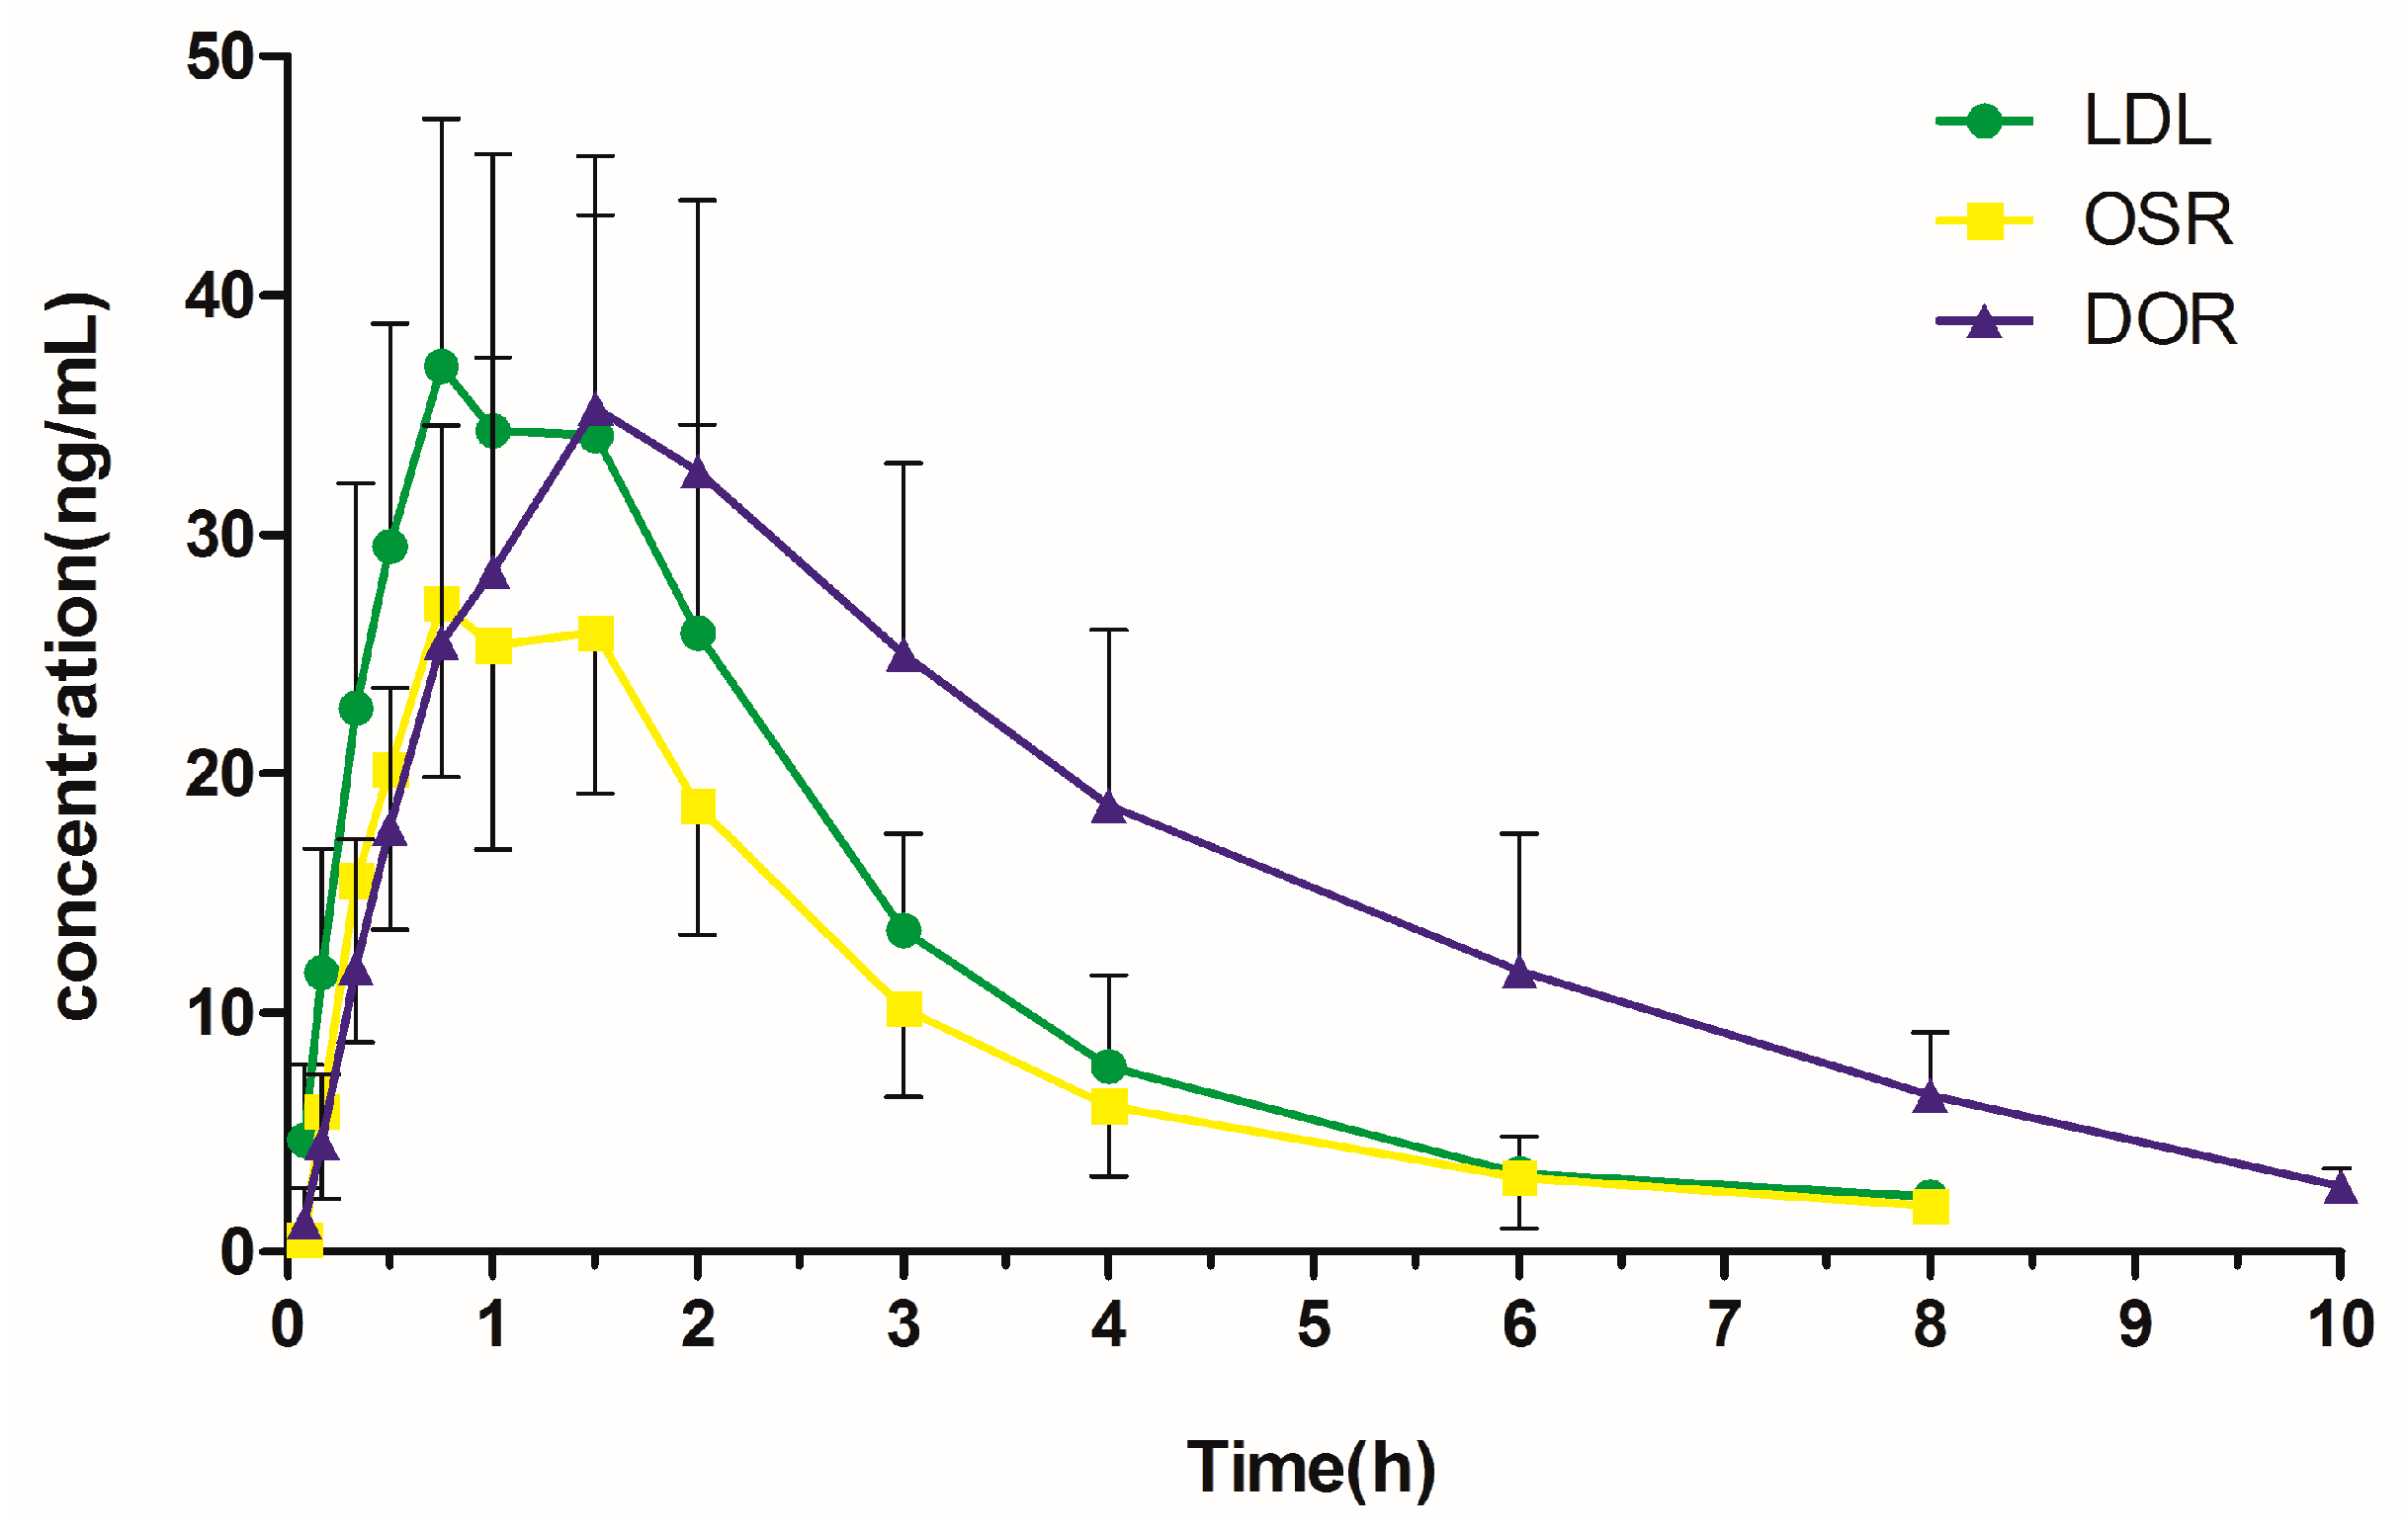
2.4. Pharmacokinetic Study
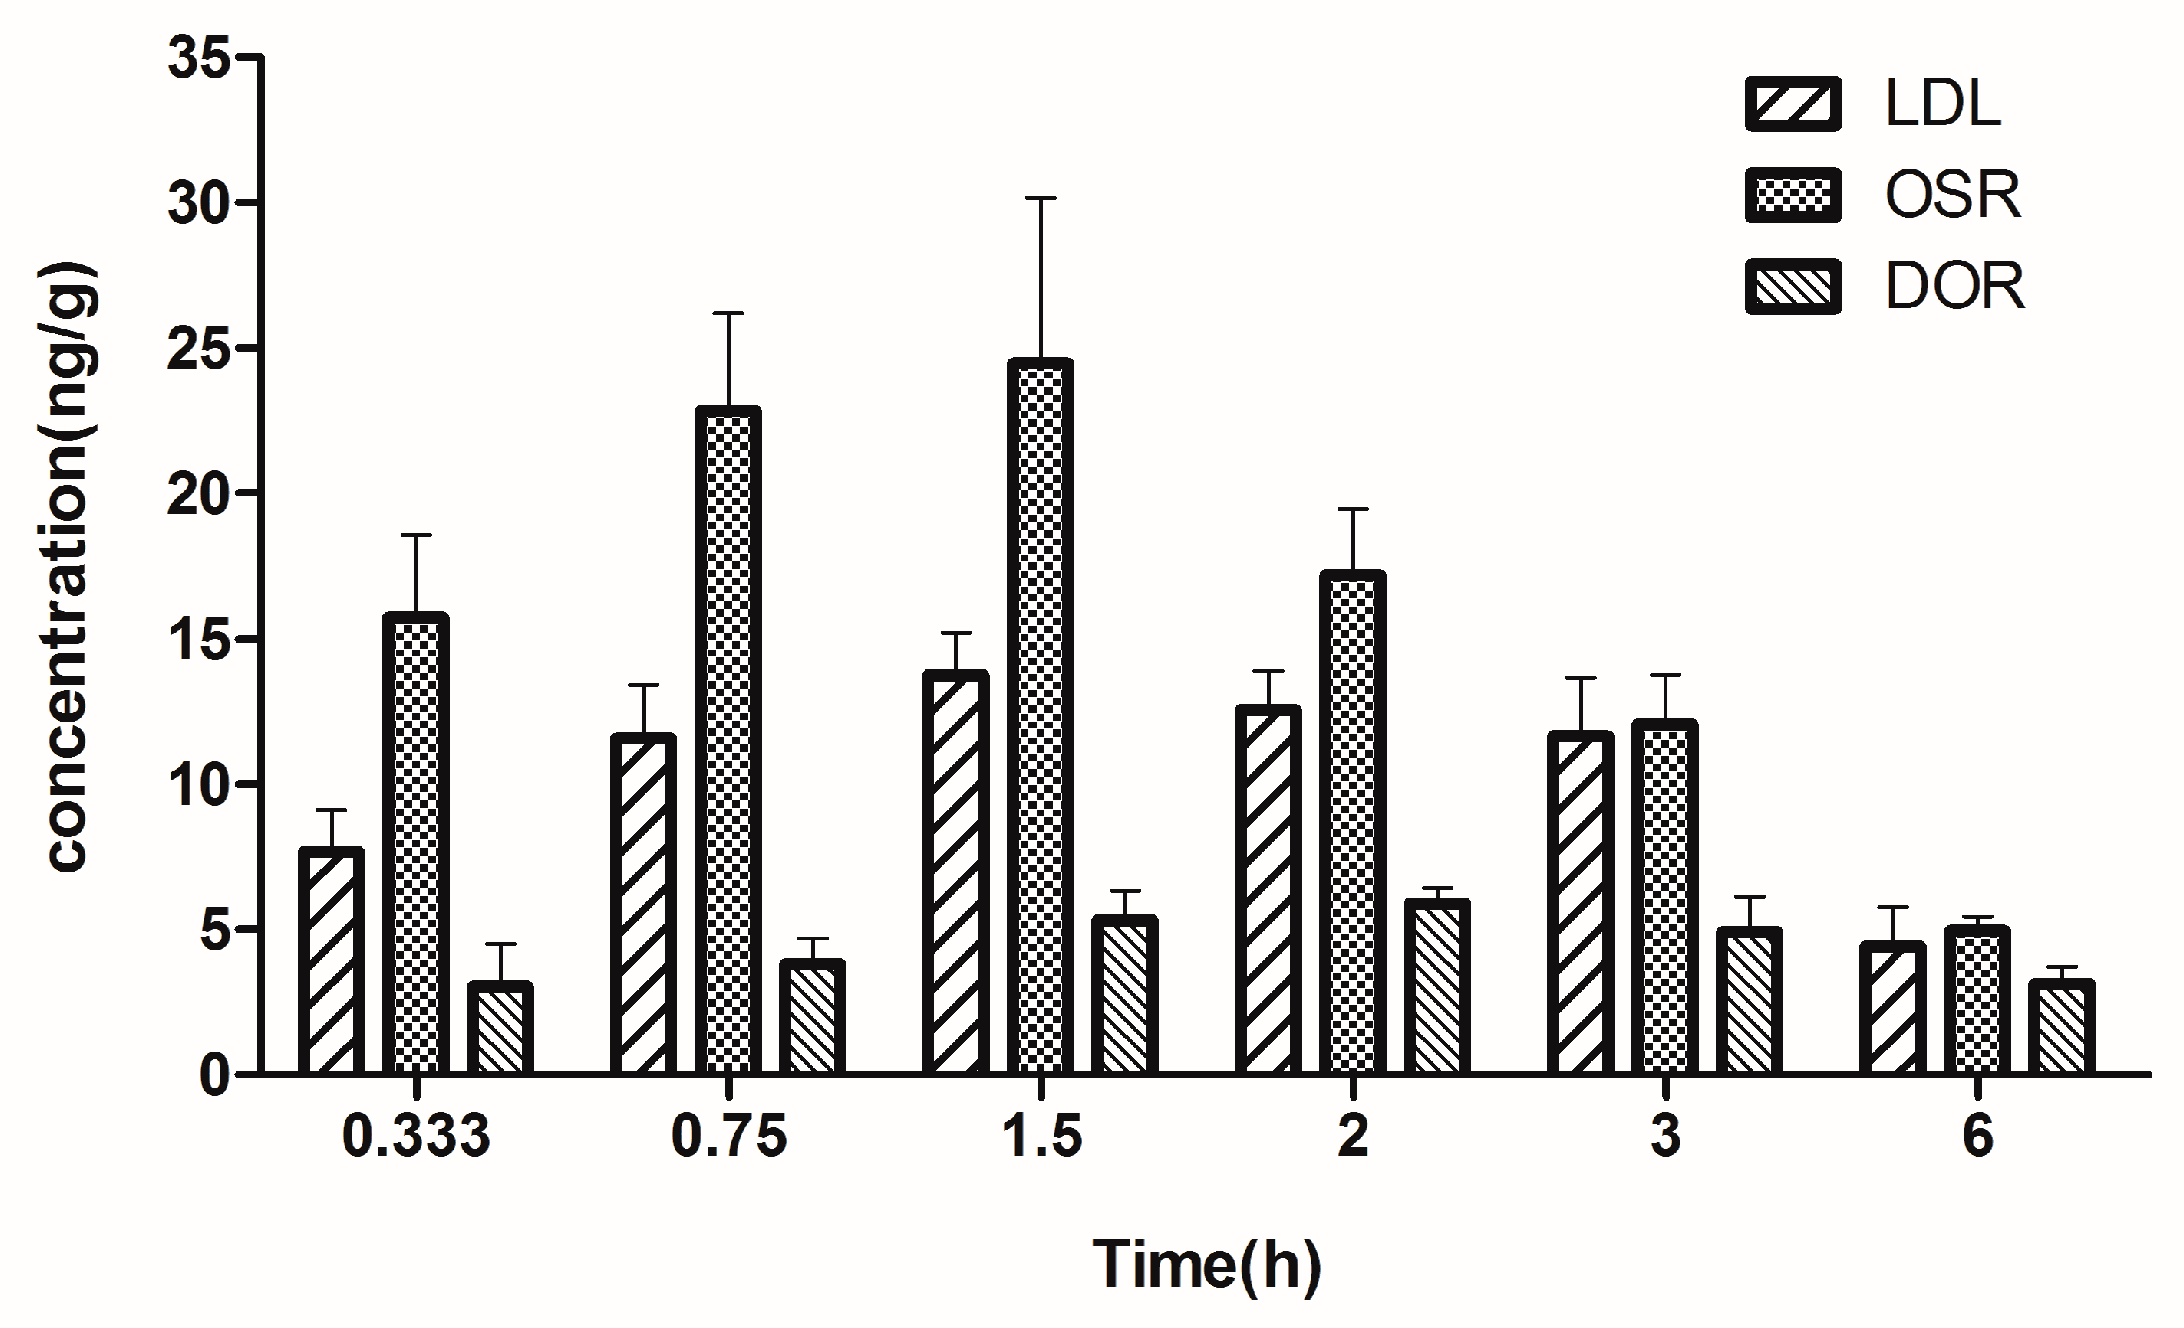
2.5. Brain Tissue Distribution Study
3. Materials and Methods
3.1. Chemicals and Reagents
3.2. Preparation of L. Herba Extract
3.3. Instrumentation for LC-MS/MS
3.4. Preparation of Calibration Standards and QC Samples
3.5. Animals Experiments
3.6. Samples Preparation
3.7. Method Validations
3.8. Plasma Pharmacokinetic Study
3.9. Brain Tissue Distribution Study
4. Conclusions
Supplementary Materials
Author Contributions
Funding
Acknowledgments
Conflicts of Interest
References
- Li:, B.; Zhang, W.D.; He, Y.R.; Lu, L.; Kong, D.Y.; Shen, Y.H. New Alkaloids from Lycopodium japonicum. Chem. Pharm. Bull. 2012, 60, 1448–1452. [Google Scholar] [CrossRef]
- Ao, P.; Zhou, Z.G.; Han, Y.S.; Yin, L.Y.; Bian, X.Y. Effect of Chloroform Extracts from Lycopodium Clavatum on RF, TNF-α, IL-1β, IL-6 of Rats with Adjuvant Arthritis. Inf. Tradit. Chin, Med. 2013, 03, 129–131. [Google Scholar] [CrossRef]
- Lv, H.; Zhou, Z.G.; Bian, X.Y.; Han, Y.S. Experimental study on influence on lycopodii extracts to AA rat RF and Ig. J. Harbin University Commerce 2008, 03, 274–276. [Google Scholar] [CrossRef]
- Zou, G.X.; You, X.M. Evaluation of free radical scavenging ability of different extracts from Lycopodii Herba by DPPH· assay. Drug Eval. Res. 2012, 05, 359–361. [Google Scholar]
- Tian, Y.Q.; Hu, G.W.; Guo, M.Q. Components and Anti-HepG2 Activity Comparison of Lycopodium Alkaloids from Four Geographic Origins. Evidence-Based Complement. Altern. Med. 2016, 2016, 1–9. [Google Scholar] [CrossRef]
- Wang, X.J.; Li, L.; Yu, S.S.; Ma, S.G.; Qu, J.; Liu, Y.B.; Li, Y.; Wang, Y.; Tang, W. Five new fawcettimine-related alkaloids from Lycopodium japonicum Thunb. Fitoterapia 2013, 91, 74–81. [Google Scholar] [CrossRef] [PubMed]
- Li, X.L.; Zhao, Y.; Cheng, X.; Tu, L.; Peng, L.Y.; Xu, G.; Zhao, Q.S. Japonicumins A-D: Four new compounds from Lycopodium japonicum. Helv. Chim. Acta 2006, 89, 1467–1473. [Google Scholar] [CrossRef]
- Zhu, Y.; Dong, L.B.; Zhang, Z.J.; Fan, M.; Zhu, Q.F.; Qi, Y.Y.; Liu, Y.C.; Peng, L.Y.; Wu, X.D.; Zhao, Q.S. Three new Lycopodium alkaloids from Lycopodium japonicum. J Asian Nat. Prod. Res. 2019, 21, 17–24. [Google Scholar] [CrossRef]
- Wang, X.J.; Li, L.; Si, Y.K.; Yu, S.S.; Ma, S.G.; Bao, X.Q.; Zhang, D.; Qu, J.; Liu, Y.B.; Li, Y. Nine new lycopodine-type alkaloids from Lycopodium japonicum Thunb. Tetrahedron 2013, 69, 6234–6240. [Google Scholar] [CrossRef]
- Yang, Q.; Zhu, Y.; Zhan, R.; Chen, Y.-g. A New Fawcettimine-Related Alkaloid from Lycopodium japonicum. Chem. Nat. Compd. 2018, 54, 729–731. [Google Scholar] [CrossRef]
- Fu, J.G.; Xu, G.Q.; Ding, R.; Lin, G.Q.; Sun, B.F. Asymmetric total synthesis of Lycopodium alkaloids α-obscurine, N-desmethyl-α-obscurine, β-obscurine and N-desmethyl-β-obscurine. Org. Chem. Front. 2016, 3, 62–65. [Google Scholar] [CrossRef]
- Wang, X.J.; Zhang, G.J.; Zhuang, P.Y.; Zhang, Y.; Yu, S.S.; Bao, X.Q.; Zhang, D.; Yuan, Y.H.; Chen, N.H.; Ma, S.G. Lycojaponicumins A-C, three alkaloids with an unprecedented skeleton from Lycopodium japonicum. Org. Lett. 2012, 14, 2614–2617. [Google Scholar] [CrossRef] [PubMed]
- Cai, Z.Y.; Zhou, Z.G.; Ping, L.I.; Qin, Y. Advances in studies on chemical constituents in Lycopodii Herba and their pharmacological activities. Chin. Tradit. Herb.Drugs 2015, 46, 297–304. [Google Scholar] [CrossRef]
- Zhang, Y.; Yi, P.; Chen, Y.; Mei, Z.-n.; Hu, X.; Yang, G.-z. Lycojaponicuminol A-F: Cytotoxic serratene triterpenoids from Lycopodium japonicum. Fitoterapia 2014, 96, 95–102. [Google Scholar] [CrossRef]
- Sun, Z.H.; Li, W.; Tang, G.H.; Yin, S. A new serratene triterpenoid from Lycopodium japonicum. J. Asian Nat. Prod. Res. 2017, 19, 299–303. [Google Scholar] [CrossRef] [PubMed]
- Cai, X.; Pan, D.; Chen, Y.; Wu, W.; Liu, X. The isolation and identification of the anthraquinones from lycopodium japonicum L. and lycopodium obscurum L. J. Shanghai Medica 1991, 05, 383–385. [Google Scholar]
- Yang, Z.B.; Zhong, C.N.; Sun, C.B.; Mao, H.L. Analysis of chemical constituents of volatileoils from lycopod herb. Chin. J. Hosp. Pharm. 2008, 13, 1067–1070. [Google Scholar] [CrossRef]
- You, X.M.; Yan, Y.J.; Zou, G.X.; Jiang, H.; Zheng, H. Study on the Quality Standard of Lycopodium Japonicum Thunb. J. Liaoning University Tradit. Chin. Med. 2012, 14, 15–17. [Google Scholar] [CrossRef]
- Ayer, W.A.; Bowman, W.R.; Joseph, T.C.; Smith, P. The synthesis of dl-lycopodine. J. Am. Chem. Soc. 1968, 90, 1648–1650. Available online: https://www.ncbi.nlm.nih.gov/pubmed/5636804 (accessed on 19 May 2019). [CrossRef]
- Mandal, S.K.; Biswas, R.; Bhattacharyya, S.S.; Paul, S.; Dutta, S.; Pathak, S.; Khuda-Bukhsh, A.R. Lycopodine from Lycopodium clavatum extract inhibits proliferation of HeLa cells through induction of apoptosis via caspase-3 activation. Eur. J. Pharmacol. 2010, 626, 115–122. [Google Scholar] [CrossRef]
- Hardardottir, I.; Olafsdottir, E.S.; Freysdottir, J. Dendritic cells matured in the presence of the lycopodium alkaloid annotine direct T cell responses toward a Th2/Treg phenotype. Phytomedicine 2015, 22, 277–282. [Google Scholar] [CrossRef] [PubMed]
- Halldorsdottir, E.S.; Jaroszewski, J.W.; Olafsdottir, E.S. Acetylcholinesterase inhibitory activity of lycopodane-type alkaloids from the Icelandic Lycopodium annotinum ssp. alpestre. Phytochemistry 2010, 71, 149–157. [Google Scholar] [CrossRef] [PubMed]
- Zou, G.X.; You, X.M.; Jiang, H.; Wang, G.H. A sensitive high performance liquid chromatography-ultraviolet (HPLC-UV) method for the quantitation of α-obscurine in rat plasma and its application to pharmacokinetic studies. J. Med. Plants Res. 2014, 8, 269–273. [Google Scholar] [CrossRef]
- Williamson, E.M. Synergy and other interactions in phytomedicines. Phytomedicine 2001, 8, 401–409. [Google Scholar] [CrossRef]
- Khalifa, S.A.M.; Medina, P.D.; Erlandsson, A.; El-Seedi, H.R.; Silvente-Poirot, S.; Poirot, M. The novel steroidal alkaloids dendrogenin A and B promote proliferation of adult neural stem cells. Biochem. Biophys. Res. Commun. 2014, 446, 681–686. [Google Scholar] [CrossRef]
- Code of Practice for the Housing and Care of Animals Used in Scientific Procedures. Available online: http://www.official-documents.gov.uk/document/hc8889/hc01/0107/0107.pdf (accessed on 14 April 2016).
- U.S. Department of Health and Human Services Food and Drug Administration. Available online: https://www.fda.gov/downloads/Drugs/GuidanceComplianceRegulatoryInformation/Guidances/UCM070107.pdf (accessed on 21 May 2018).
Sample Availability: Samples of lycodoline, α-obscurine, N-demethyl-α-obscurine are available from the authors. |


| Analytes | Precursor m/z [M + H]+ | Product m/z | CE (eV) |
|---|---|---|---|
| LDL | 264.0 | 246.0 | 27 |
| OSR | 275.0 | 244.0 | 24 |
| DOR | 261.0 | 244.0 | 21 |
| IS | 257.0 | 240.0 | 20 |
| Biosamples | Analytes | Regression Equation | r | Linear Range (ng/mL) | LLOQ (ng/mL) | ULOQ (ng/mL) |
|---|---|---|---|---|---|---|
| plasma | LDL | y = 0.07541 x + 0.00113 | 0.9984 | 2.0–80 | 2.0 | 80 |
| OSR | y = 0.03665 x − 0.00666 | 0.9946 | 1.5–60 | 1.5 | 60 | |
| DOR | y = 0.05349 x + 0.00171 | 0.9959 | 2.0–80 | 2.0 | 80 | |
| brain | LDL | y = 0.22353 x + 0.06646 | 0.9911 | 1.0–10 | 1.0 | 10 |
| OSR | y = 0.11798 x − 0.01198 | 0.9936 | 2.0–20 | 2.0 | 20 | |
| DOR | y = 0.17938 x − 0.01427 | 0.9916 | 0.5–5.0 | 0.5 | 5.0 |
| Biosamples | Analytes | Theorical Concentration (ng/mL) | Intra-Day | Inter-Day | ||||
|---|---|---|---|---|---|---|---|---|
| Measured Concentration (ng/mL) | RE (%) | RSD (%) | Measured Concentration (ng/mL) | RE (%) | RSD (%) | |||
| plasma | LDL | 6.0 | 5.73 | −4.5 | 7.5 | 5.99 | −0.2 | 7.4 |
| 24 | 25.25 | 5.2 | 6.5 | 24.34 | 1.4 | 6.3 | ||
| 60 | 63.76 | 6.3 | 7.3 | 59.94 | −0.1 | 7.1 | ||
| OSR | 4.5 | 4.77 | 6.1 | 12.3 | 4.68 | 3.9 | 9.6 | |
| 18 | 17.12 | −4.9 | 5.2 | 17.91 | −0.5 | 5.4 | ||
| 45 | 43.06 | −4.3 | 7.0 | 43.90 | −2.4 | 6.5 | ||
| DOR | 6.0 | 6.38 | 6.3 | 9.6 | 6.25 | 4.2 | 7.8 | |
| 24 | 26.22 | 9.2 | 8.7 | 25.24 | 5.2 | 7.6 | ||
| 60 | 65.76 | 9.6 | 12.3 | 63.12 | 5.2 | 8.7 | ||
| brain | LDL | 2.0 | 1.82 | −8.8 | 14.2 | 1.94 | −3.0 | 13.2 |
| 5.0 | 4.60 | −8.1 | 13.4 | 4.75 | −4.9 | 10.1 | ||
| 8.0 | 7.37 | −7.8 | 9.0 | 7.76 | −3.0 | 7.8 | ||
| OSR | 4.0 | 3.61 | −9.6 | 11.4 | 3.94 | −1.5 | 12.1 | |
| 10 | 10.80 | 8.0 | 12.0 | 10.01 | 0.1 | 10.9 | ||
| 16 | 17.37 | 8.6 | 10.5 | 16.31 | 1.9 | 10.1 | ||
| DOR | 1.0 | 0.95 | −4.7 | 13.6 | 0.98 | −2.2 | 11.3 | |
| 2.5 | 2.37 | −5.3 | 13.3 | 2.45 | −2.0 | 9.9 | ||
| 4.0 | 3.70 | −7.5 | 11.3 | 3.78 | −5.4 | 9.6 | ||
| Biosamples | Analytes | Concentration | Matrix Effect | Extraction Recovery | ||
|---|---|---|---|---|---|---|
| (ng/mL) | Mean (%) | RSD (%) | Mean (%) | RSD (%) | ||
| plasma | LDL | 6.0 | 109.5 | 8.4 | 83.5 | 5.1 |
| 24 | 114.4 | 4.3 | 104.8 | 8.0 | ||
| 60 | 95.1 | 4.2 | 96.3 | 5.5 | ||
| OSR | 4.5 | 100.2 | 13.5 | 102.5 | 8.2 | |
| 18 | 100.7 | 7.4 | 110.1 | 10.1 | ||
| 45 | 97.3 | 2.1 | 105.2 | 6.6 | ||
| DOR | 6.0 | 88.8 | 7.6 | 103.7 | 3.3 | |
| 24 | 103.5 | 6.8 | 98.7 | 8.4 | ||
| 60 | 97.2 | 4.1 | 104.6 | 6.0 | ||
| IS | 150 | 105.3 | 9.1 | 98.6 | 7.6 | |
| brain | LDL | 2.0 | 91.9 | 9.4 | 81.5 | 5.8 |
| 5.0 | 92.1 | 9.1 | 91.9 | 8.1 | ||
| 8.0 | 91.2 | 3.1 | 85.5 | 3.3 | ||
| OSR | 4.0 | 86.3 | 7.1 | 84.2 | 10.9 | |
| 10 | 88.8 | 6.3 | 91.1 | 5.2 | ||
| 16 | 85.1 | 6.2 | 94.9 | 6.7 | ||
| DOR | 1.0 | 86.0 | 2.9 | 81.2 | 13.1 | |
| 2.5 | 94.8 | 10.6 | 83.7 | 13.2 | ||
| 4.0 | 85.5 | 6.3 | 82.7 | 6.0 | ||
| IS | 60 | 87.7 | 8.7 | 99.3 | 10.4 | |
| Samples | Analytes | Concentration (ng/mL) | Stability | |||||||
|---|---|---|---|---|---|---|---|---|---|---|
| Short-Term | Post-Preparation | Three Freeze–Thaw | Long-Term | |||||||
| RE% | RSD% | RE% | RSD% | RE% | RSD% | RE% | RSD% | |||
| plasma | LDL | 6.0 | 3.9 | 1.0 | 6.3 | 8.7 | 2.7 | 4.7 | 9.0 | 2.6 |
| 60 | −4.4 | 8.4 | 1.6 | 5.3 | 1.8 | 4.5 | 9.2 | 6.7 | ||
| OSR | 4.5 | 10.0 | 12.0 | 7.7 | 8.8 | 7.1 | 13.4 | 8.2 | 4.3 | |
| 45 | −4.7 | 7.5 | 3.6 | 7.1 | −2.9 | 5.1 | 6.6 | 5.5 | ||
| DOR | 6.0 | 8.6 | 12.3 | 11.8 | 11.8 | 10.9 | 12.7 | 12.5 | 6.3 | |
| 60 | 3.5 | 6.9 | 4.9 | 8.5 | 5.5 | 3.0 | 11.6 | 4.9 | ||
| brain | LDL | 2.0 | −9.1 | 9.3 | −2.5 | 13.6 | 3.0 | 9.7 | 2.1 | 12.6 |
| 8.0 | −5.0 | 13.5 | 2.5 | 9.4 | 3.4 | 8.8 | −5.7 | 9.3 | ||
| OSR | 4.0 | −4.0 | 12.5 | −8.6 | 14.3 | −2.4 | 11.0 | −6.8 | 9.1 | |
| 16 | −5.1 | 11.0 | −3.0 | 14.8 | 2.0 | 8.7 | −4.4 | 10.0 | ||
| DOR | 1.0 | −4.9 | 10.4 | −9.0 | 10.4 | −3.2 | 11.2 | −2.0 | 12.5 | |
| 4.0 | −3.5 | 9.4 | 5.1 | 9.2 | 3.2 | 13.3 | −4.0 | 9.4 | ||
| Parameters | LDL | OSR | DOR |
|---|---|---|---|
| Cmax (ng/mL) | 37.25 ± 10.60 | 27.70 ± 7.70 | 35.53 ± 10.44 |
| Tmax (h) | 0.79 ± 0.10 | 0.92 ± 0.30 | 1.58 ± 0.20 |
| t1/2 (h) | 1.27 ± 0.31 | 1.37 ± 0.44 | 2.24 ± 0.25 |
| AUC0→t (ng·h/mL) | 101.25 ± 33.96 | 71.88 ± 24.13 | 156.91 ± 55.38 |
| AUC0→∞ (ng·h/mL) | 104.92 ± 34.85 | 78.49 ± 28.22 | 167.11 ± 54.78 |
| Vz (L/kg) | 7.58 ± 3.38 | 13.30 ± 4.83 | 6.68 ± 2.95 |
© 2019 by the authors. Licensee MDPI, Basel, Switzerland. This article is an open access article distributed under the terms and conditions of the Creative Commons Attribution (CC BY) license (http://creativecommons.org/licenses/by/4.0/).
Share and Cite
Ma, D.; Gu, X.; Wang, X.; Liu, Y.; Di, X. Pharmacokinetic Studies of Three Alkaloids in Rats After Intragastrical Administration of Lycopodii Herba Extract by LC-MS/MS. Molecules 2019, 24, 1930. https://doi.org/10.3390/molecules24101930
Ma D, Gu X, Wang X, Liu Y, Di X. Pharmacokinetic Studies of Three Alkaloids in Rats After Intragastrical Administration of Lycopodii Herba Extract by LC-MS/MS. Molecules. 2019; 24(10):1930. https://doi.org/10.3390/molecules24101930
Chicago/Turabian StyleMa, Dongke, Xiaoting Gu, Xin Wang, Youping Liu, and Xin Di. 2019. "Pharmacokinetic Studies of Three Alkaloids in Rats After Intragastrical Administration of Lycopodii Herba Extract by LC-MS/MS" Molecules 24, no. 10: 1930. https://doi.org/10.3390/molecules24101930
APA StyleMa, D., Gu, X., Wang, X., Liu, Y., & Di, X. (2019). Pharmacokinetic Studies of Three Alkaloids in Rats After Intragastrical Administration of Lycopodii Herba Extract by LC-MS/MS. Molecules, 24(10), 1930. https://doi.org/10.3390/molecules24101930