
Chemical Profiles of Cultivated Agarwood Induced by Different Techniques

Abstract
1. Introduction
2. Results
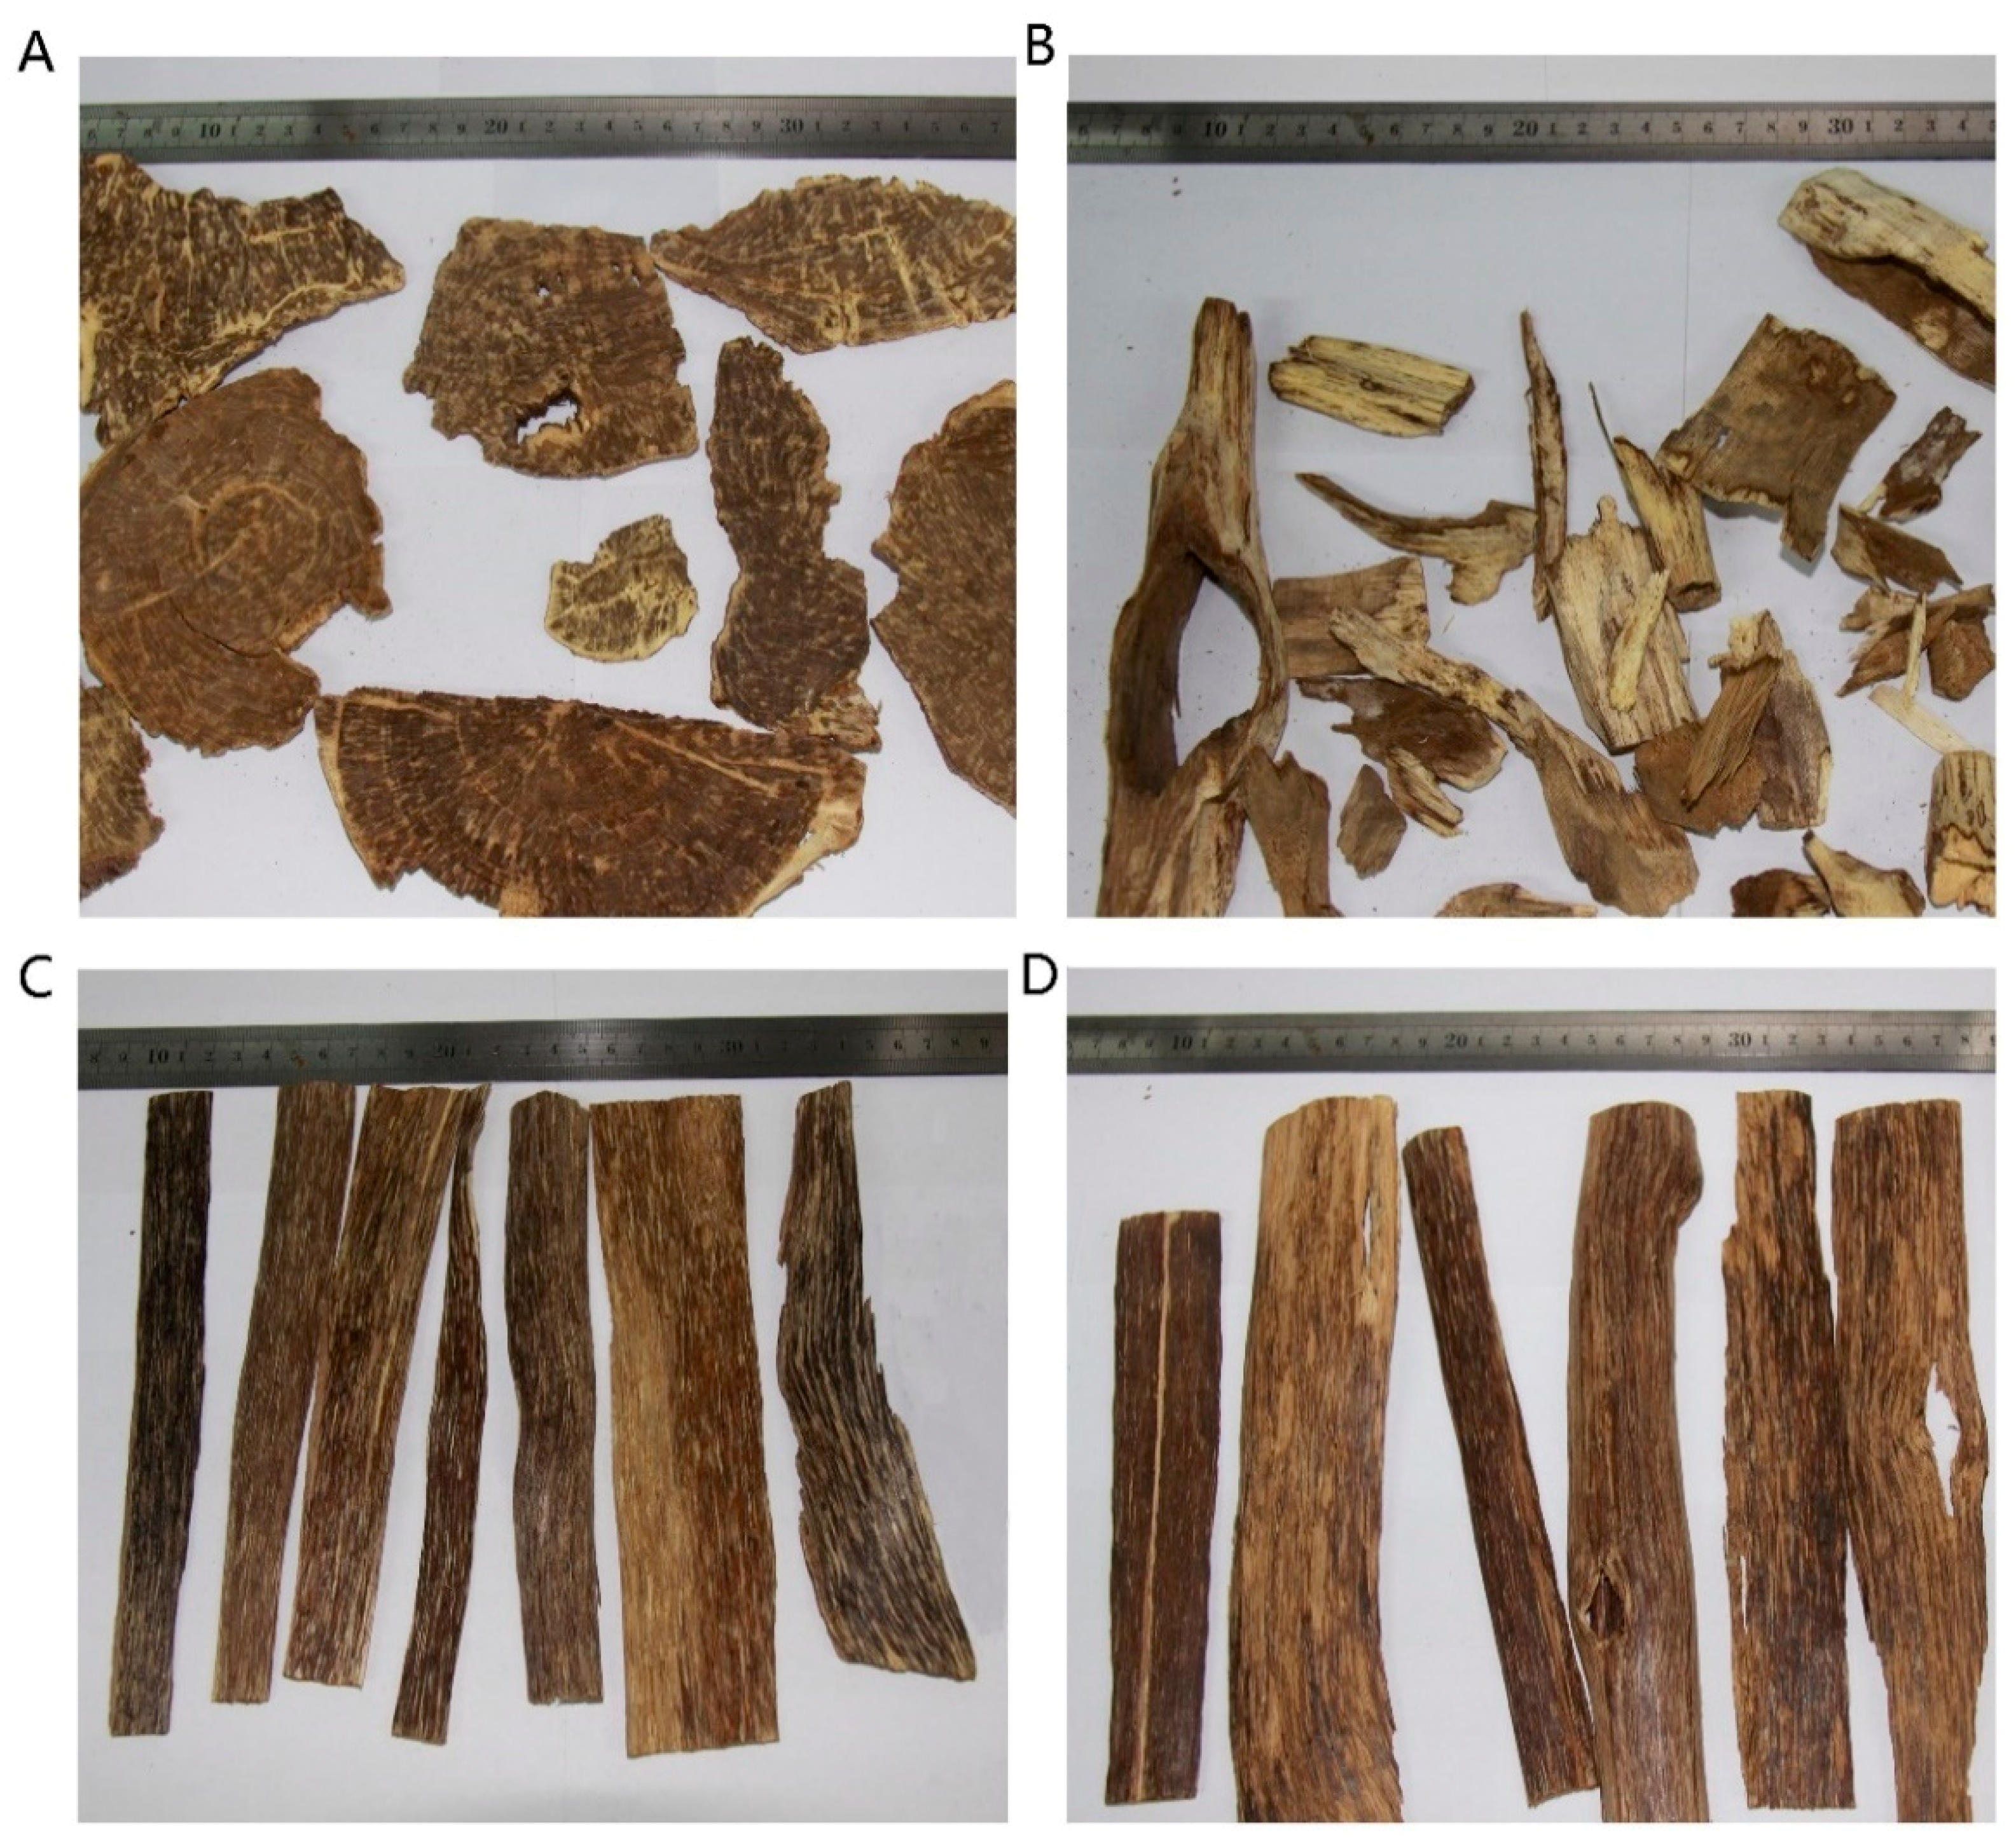
2.1. Morphological Observations of Agarwoods Induced by Different Techniques
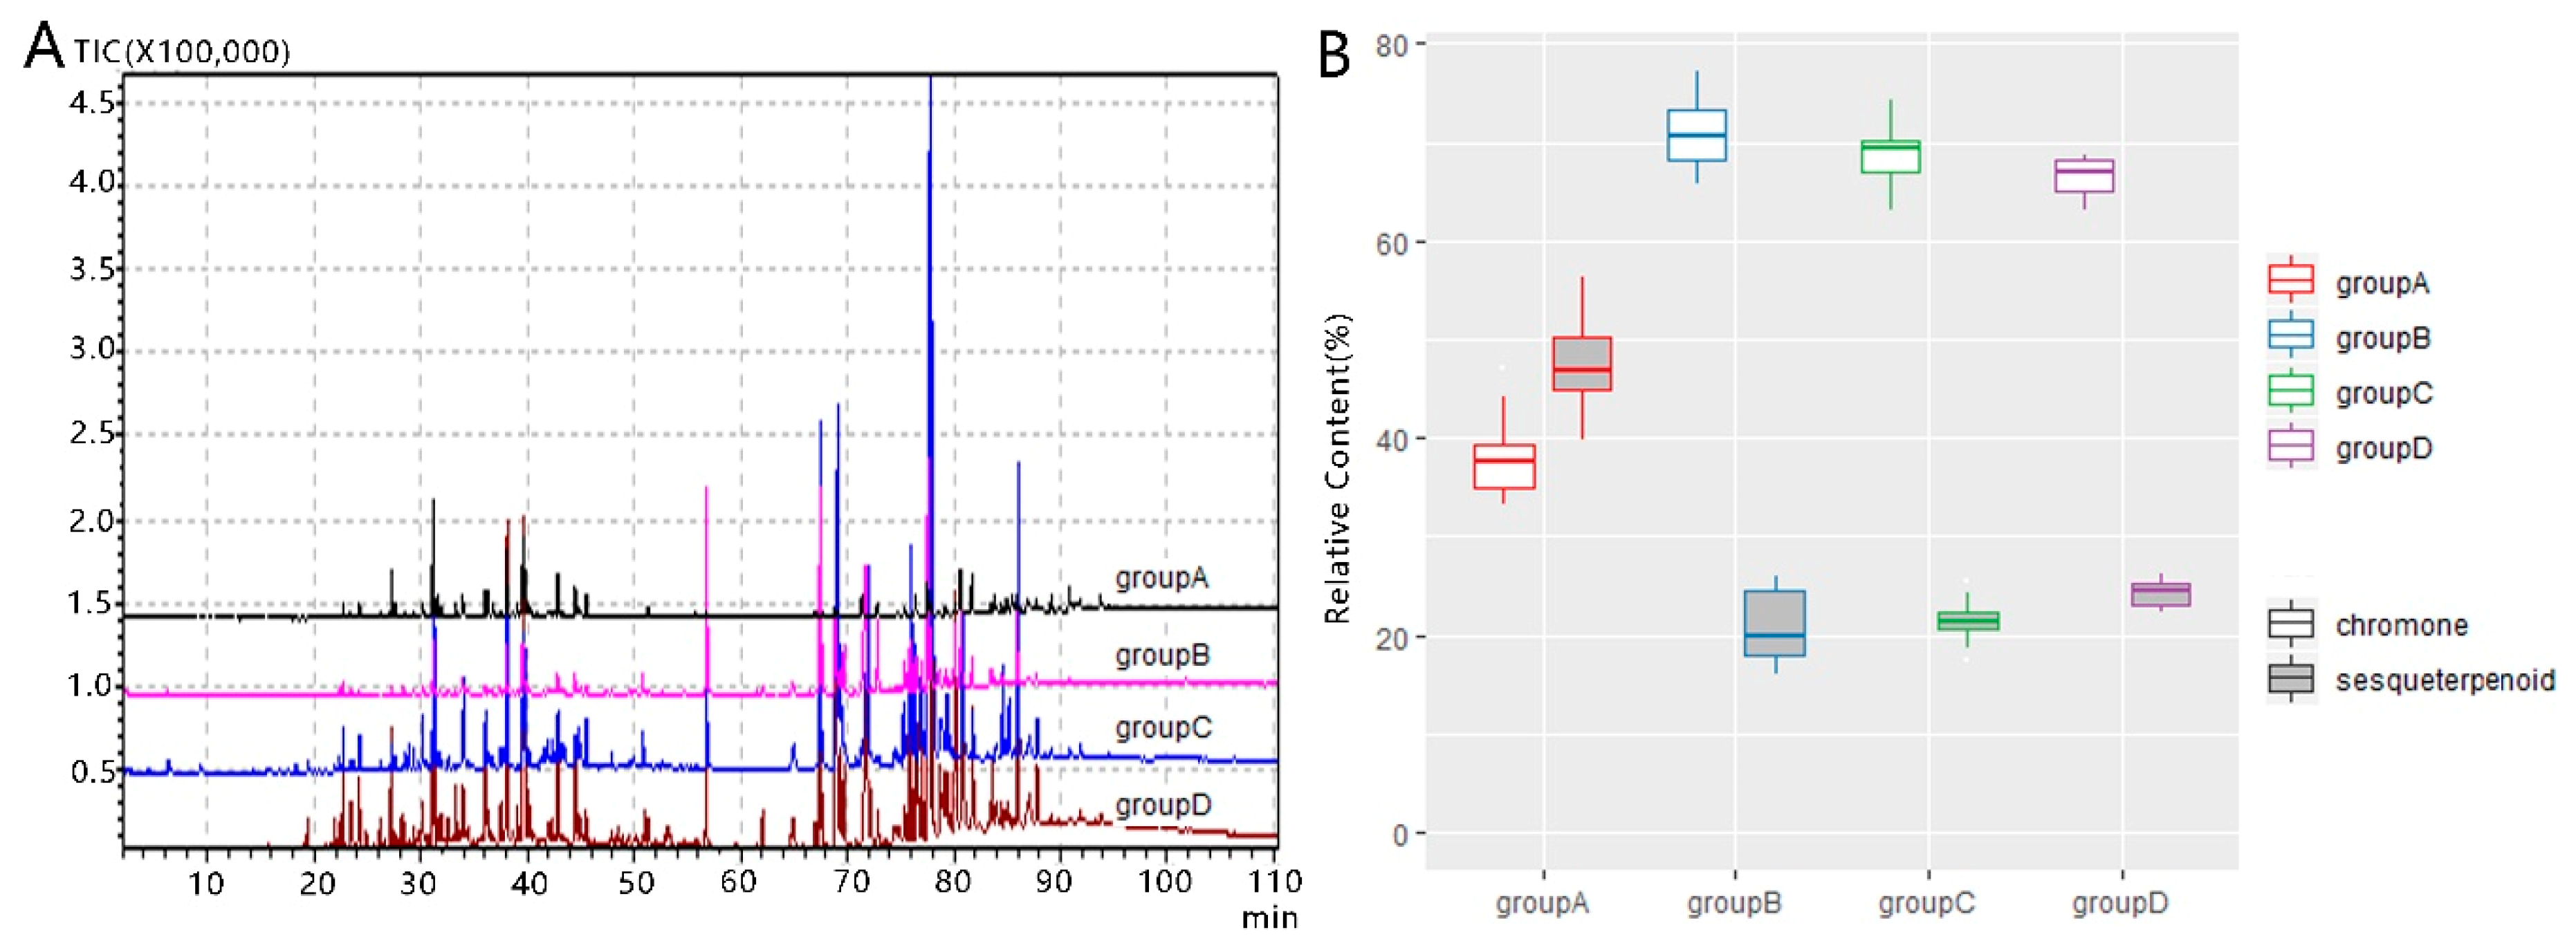
2.2. GC-MS Analysis
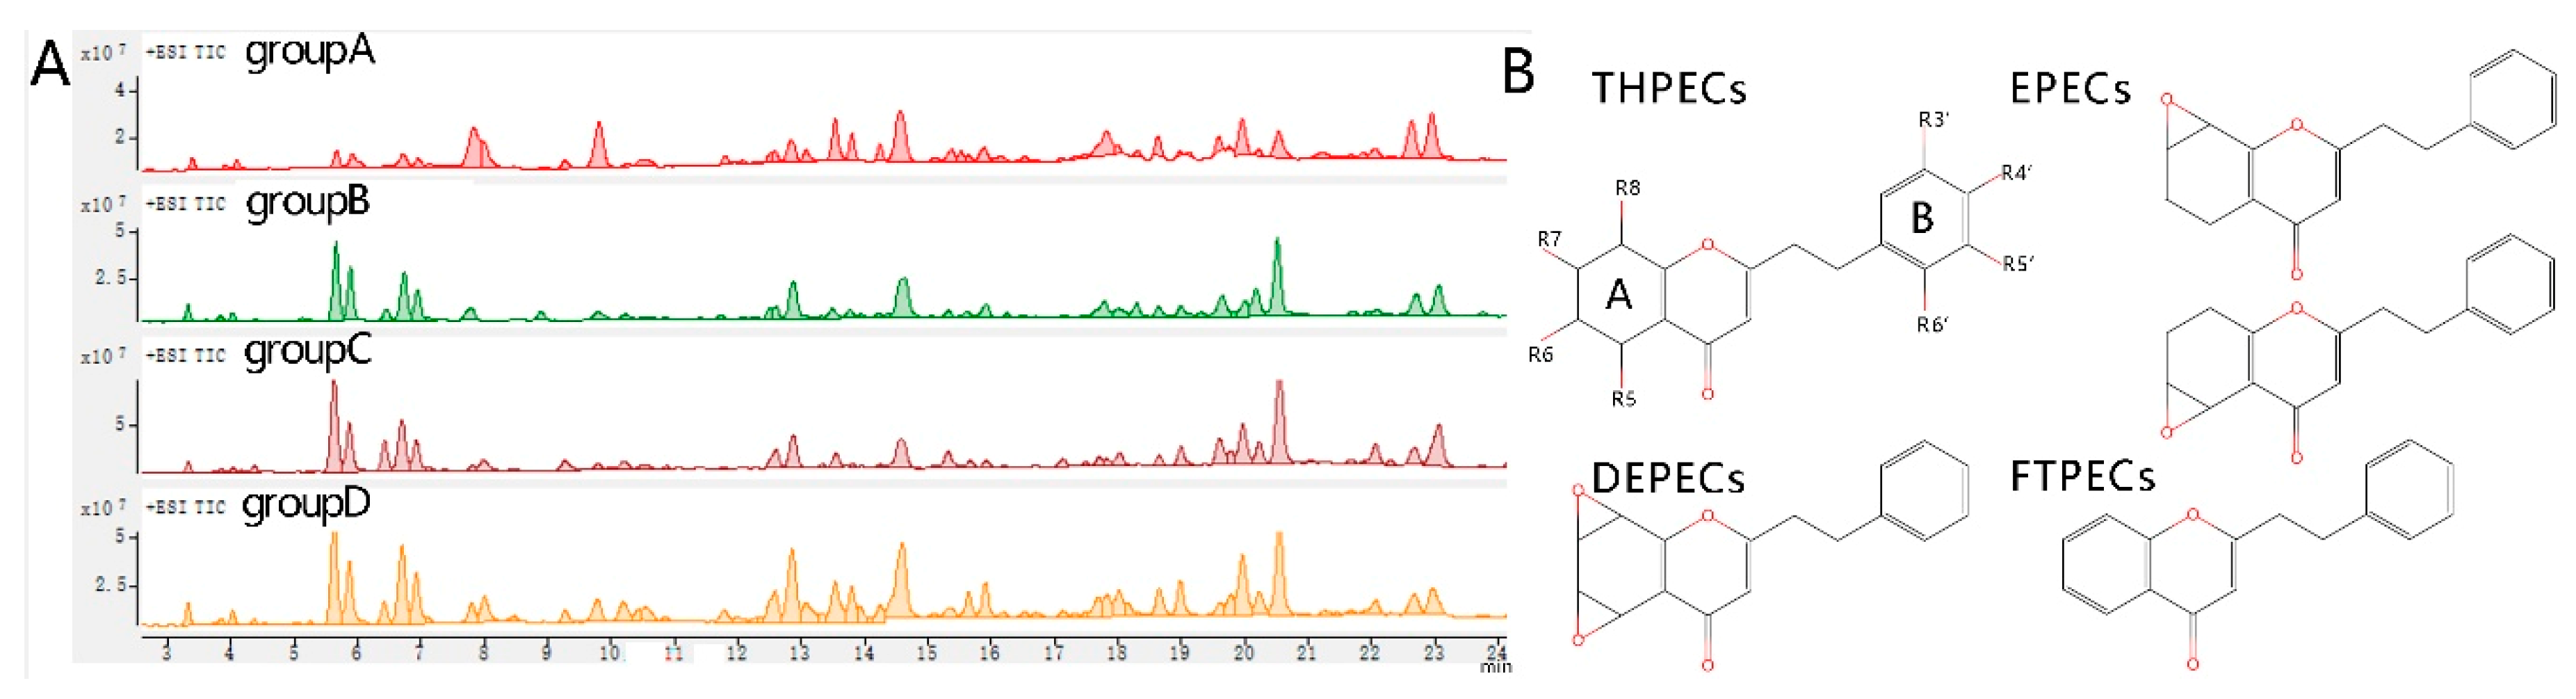
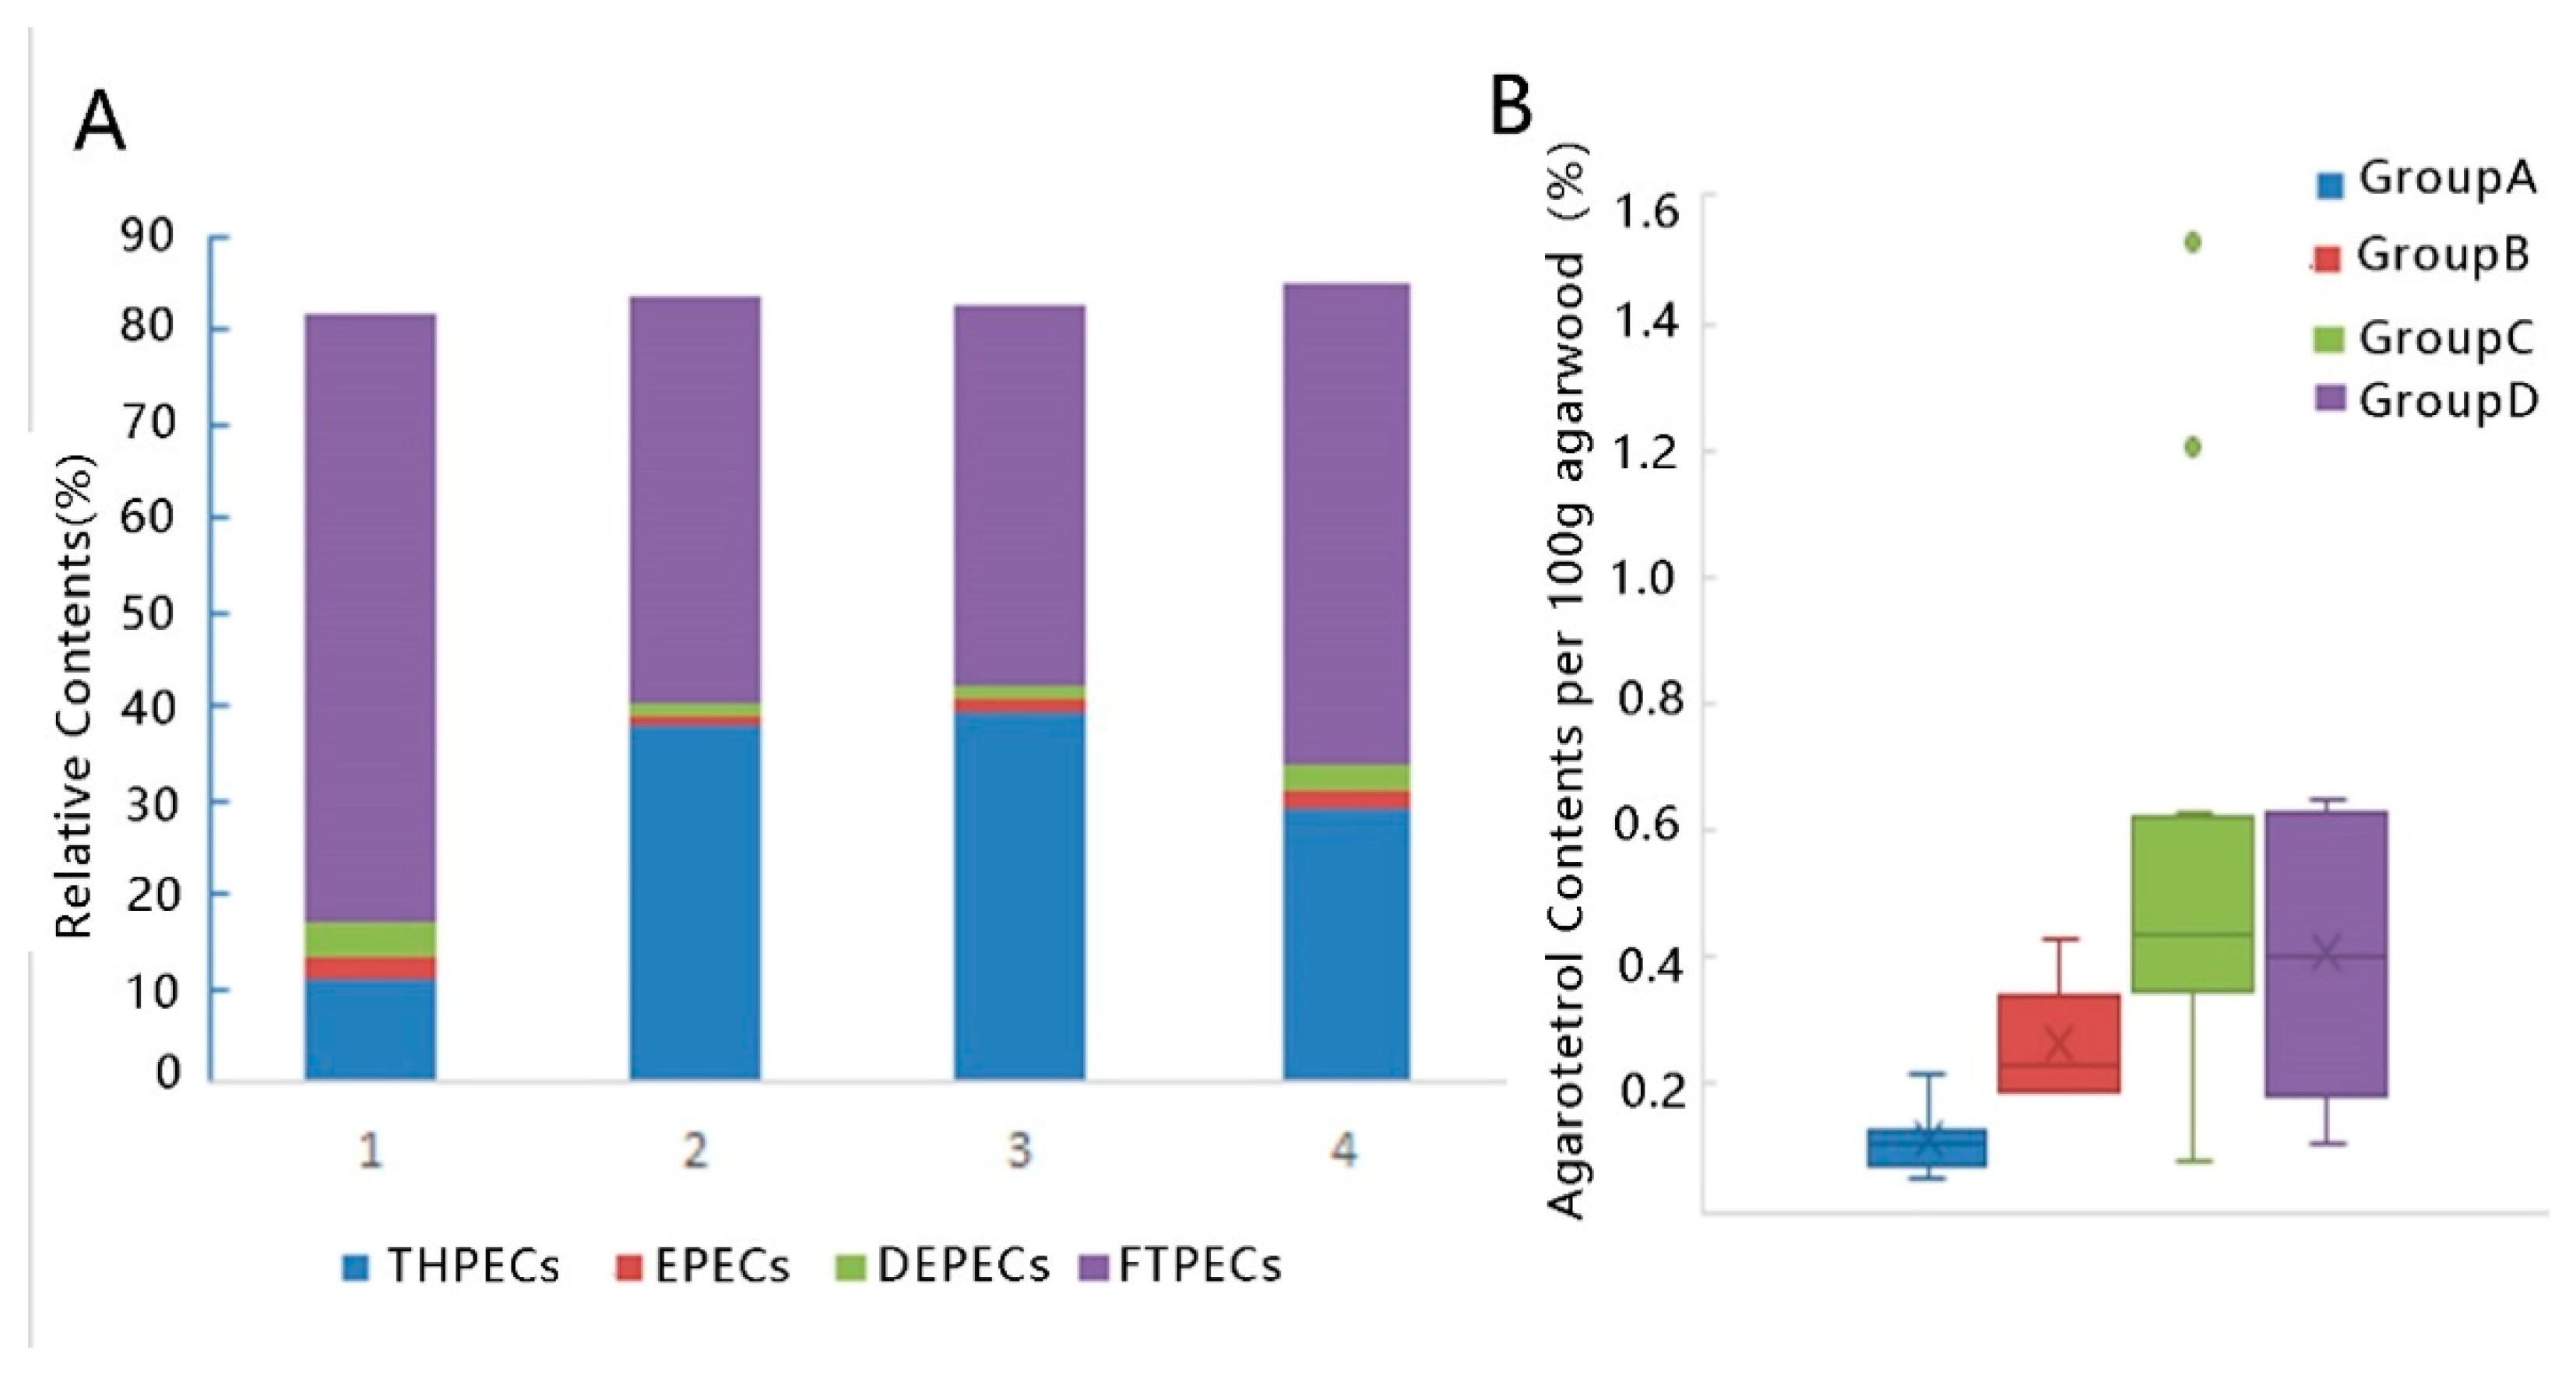
2.3. LC-MS Analysis
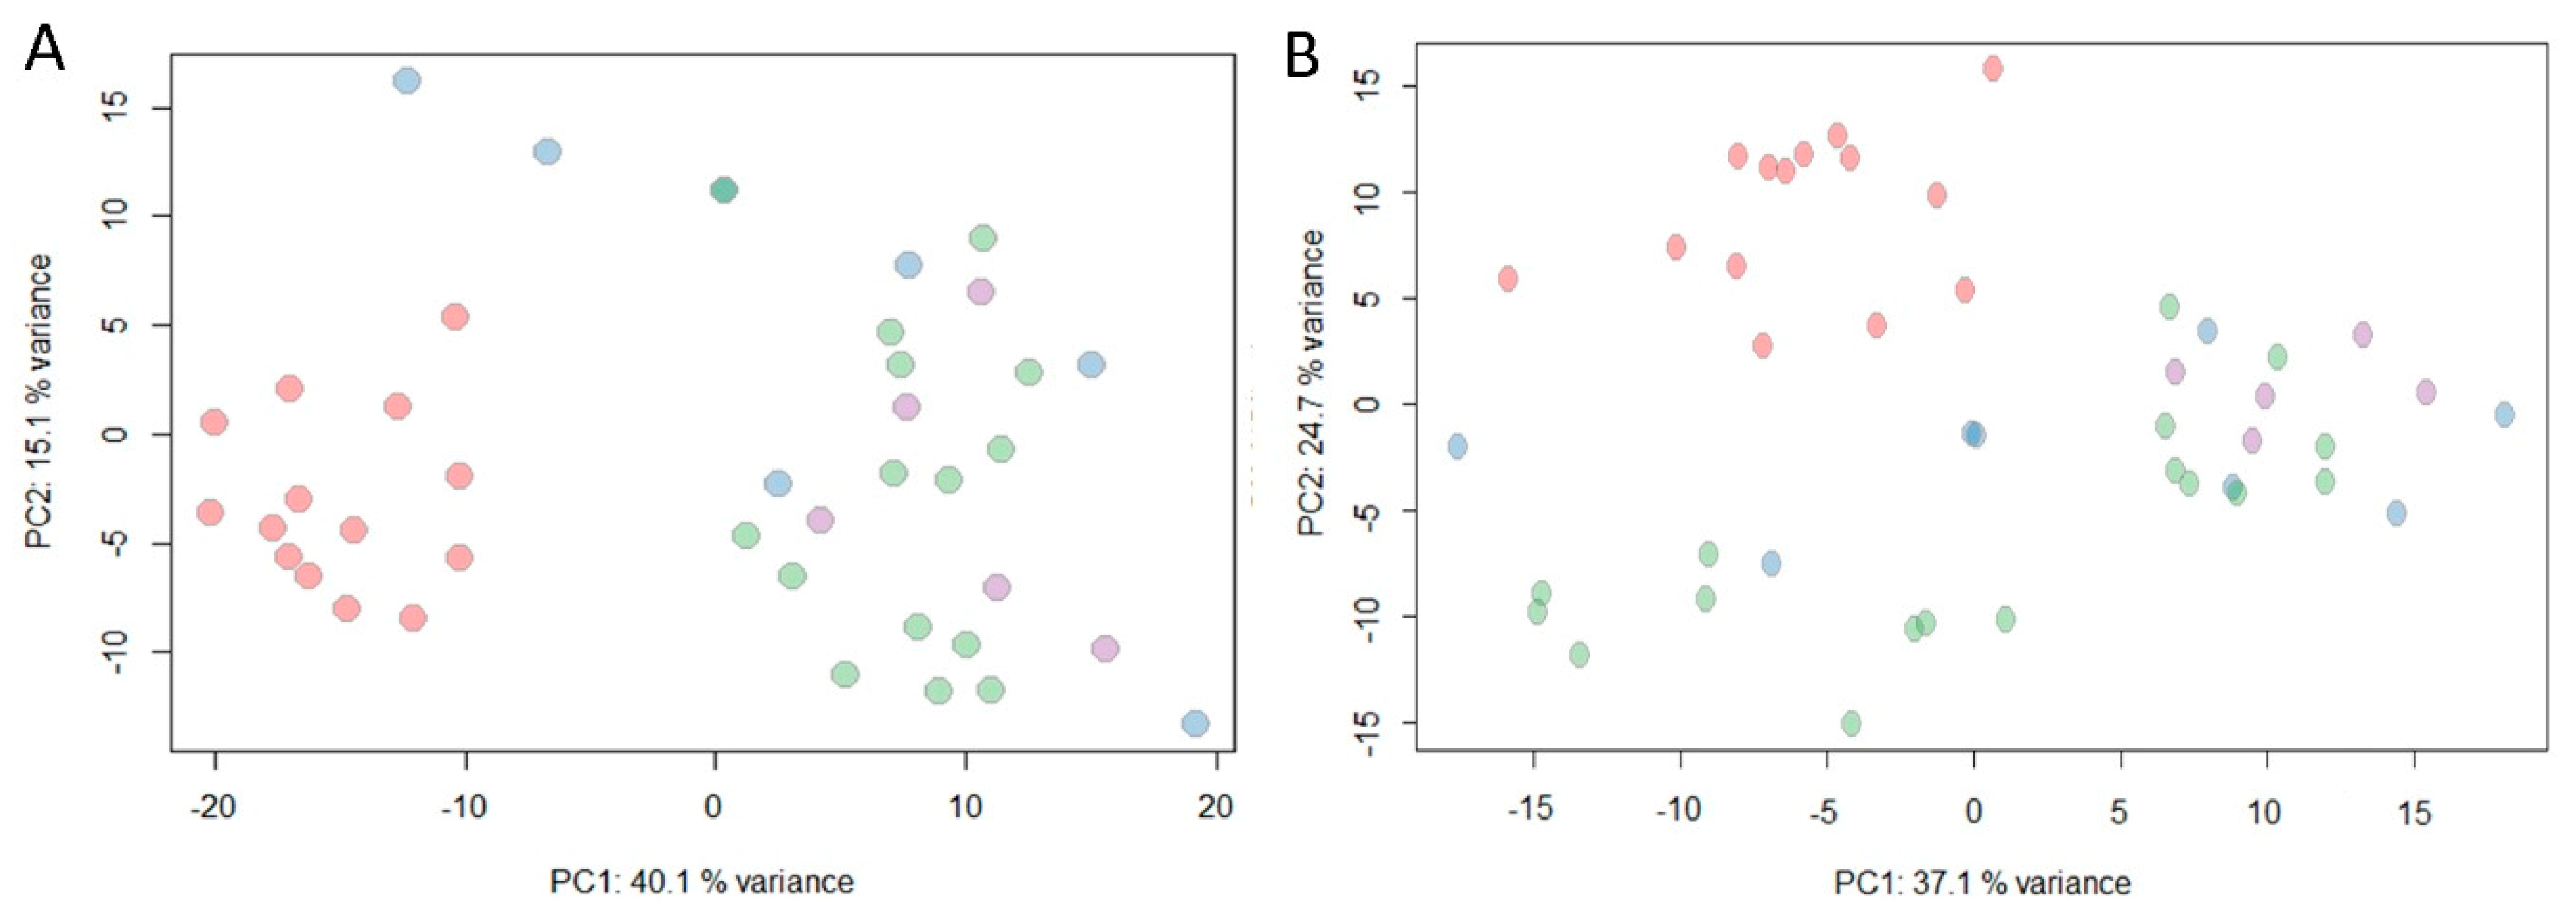
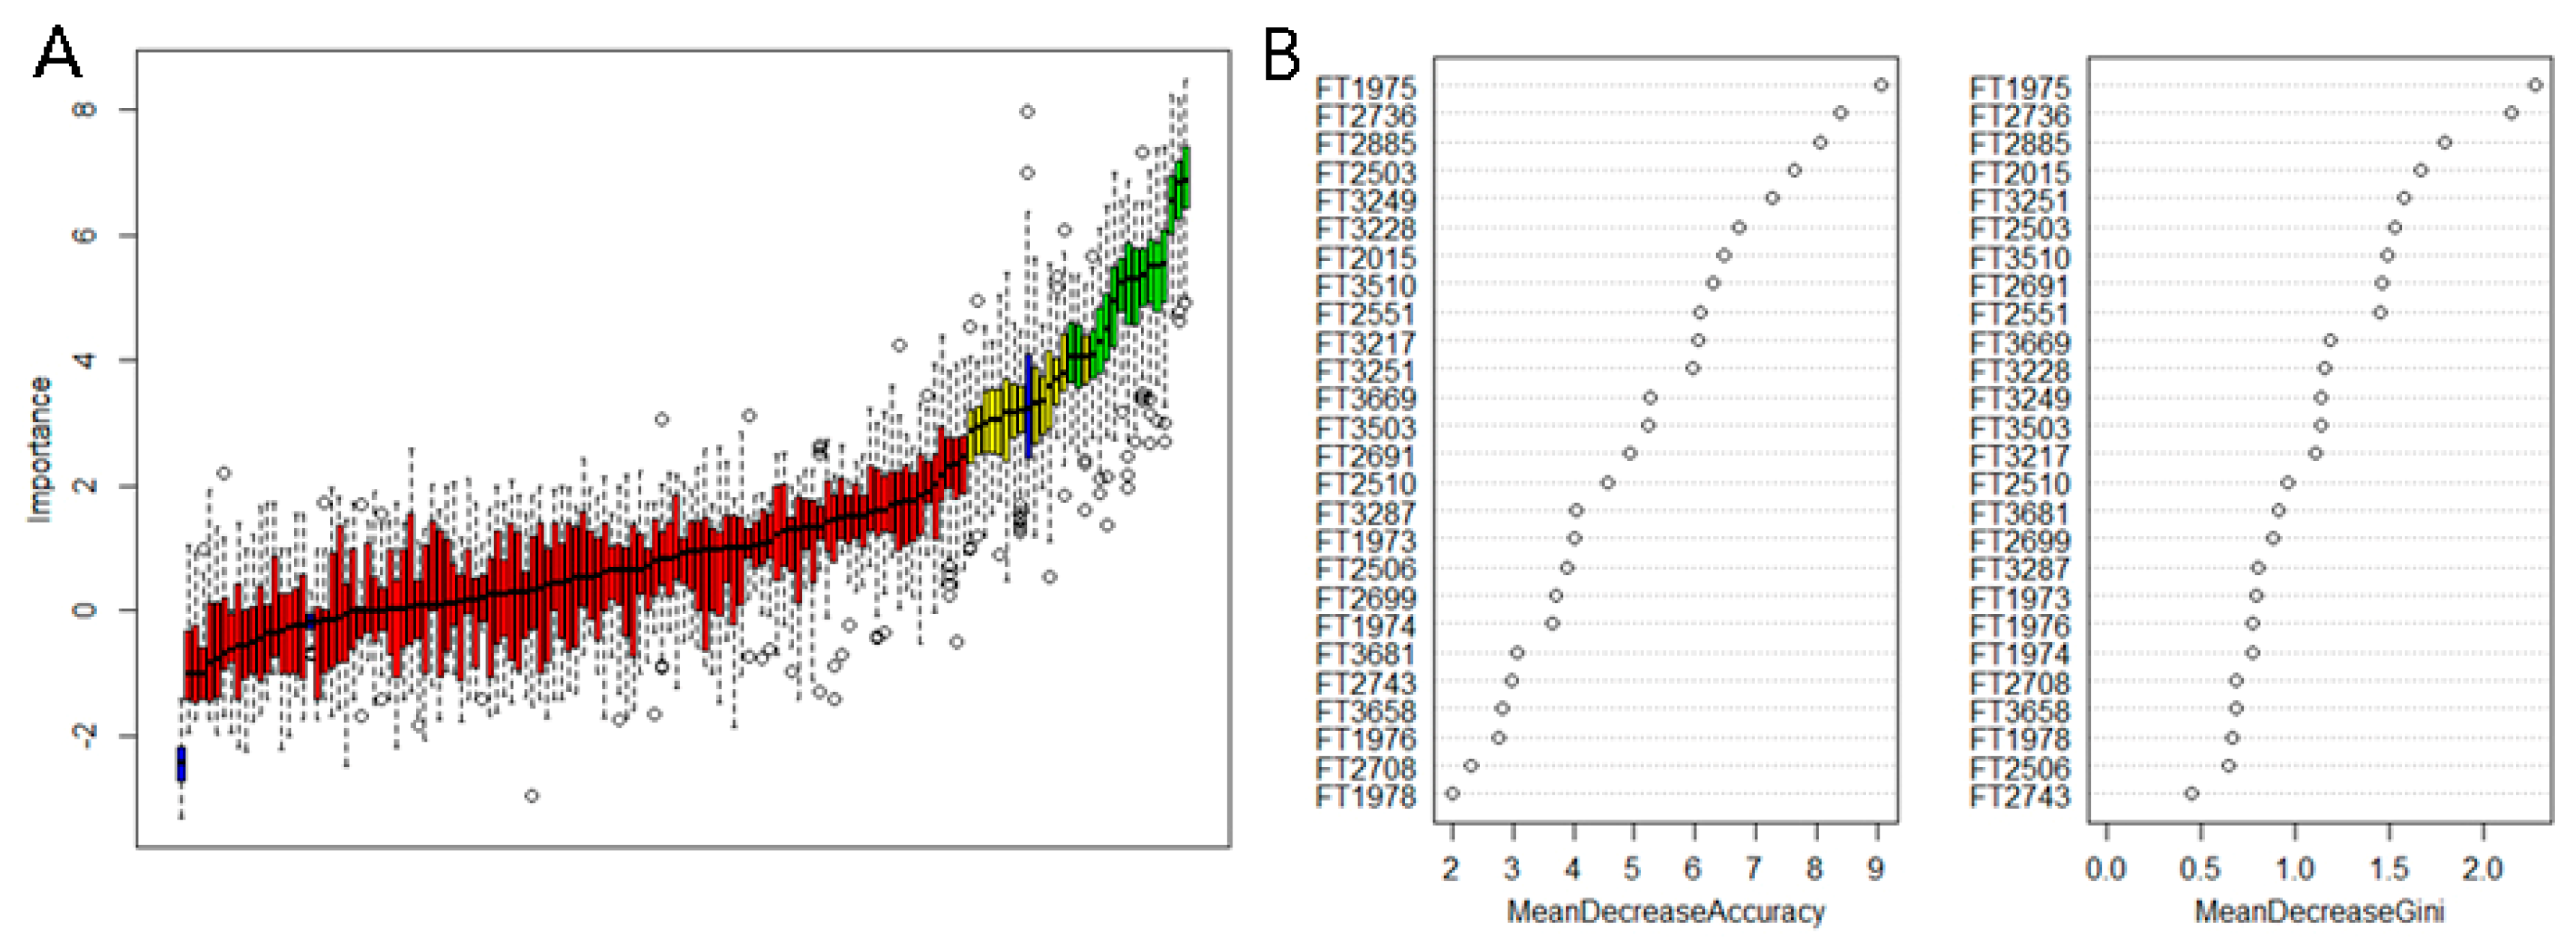
2.4. Multivariate Analysis
3. Discussion
4. Materials and Methods
4.1. Agarwood Materials and Reagents
4.2. Sample Preparation
4.3. GC-MS Analysis
4.4. LC-MS/MS Analysis
4.5. Data Processing and Analysis
Author Contributions
Funding
Acknowledgments
Conflicts of Interest
References
- Kristanti, A.N.; Tanjung, M.; Aminah, N.S. Review: Secondary Metabolites of Aquilaria, a Thymelaeaceae Genus. Mini. Rev. Org. Chem. 2018, 15, 36–55. [Google Scholar] [CrossRef] [PubMed]
- Ye, W.; Wu, H.; He, X.; Wang, L.; Zhang, W.; Li, H.; Fan, Y.; Tan, G.; Liu, T.; Gao, X. Transcriptome Sequencing of Chemically Induced Aquilaria sinensis to Identify Genes Related to Agarwood Formation. PLoS ONE 2016, 11, e0155505. [Google Scholar] [CrossRef] [PubMed]
- Mohamed, R.; Wong, M.T.; Halis, R. Microscopic observation of ‘gaharu’ wood from Aquilaria malaccensis. Pertanika J. Sci. Technol. 2013, 36, 43–50. [Google Scholar]
- Ye, W.; Zhang, W.; Liu, T.; Zhu, M.; Li, S.; Li, H.; Huang, Z.; Gao, X. iTRAQ-Based Quantitative Proteomic Analysis of Chemically Induced Aquilaria sinensis Provides Insights into Agarwood Formation Mechanism. Proteomics 2018, 18, e1800023. [Google Scholar] [CrossRef] [PubMed]
- Putra, D.A.; Shiou, Y.L.; Diana, E.; Rozi, M. History and perspectives of induction technology for agarwood production from cultivated Aquilaria in Asia: A review. J. For. Res. 2019, 30, 1–11. [Google Scholar]
- Chen, X.; Liu, Y.; Yang, Y.; Feng, J.; Liu, P.; Sui, C.; Wei, J. Trunk surface agarwood-inducing technique with Rigidoporus vinctus: An efficient novel method for agarwood production. PLoS ONE 2018, 13, e019811. [Google Scholar] [CrossRef]
- Chen, X.; Zhu, X.; Feng, M.; Zhong, Z.; Zhou, X.; Chen, X.; Ye, W.; Zhang, W.; Gao, X. Relationship between Expression of Chalcone Synthase Genes and Chromones in Artificial Agarwood induced by Formic Acid Stimulation Combined with Fusarium sp. A2 Inoculation. Molecules 2017, 22, 686. [Google Scholar] [CrossRef]
- Zhou, X.; Chen, L.Y.; Chen, X.D.; Zhong, Z.J.; Li, H.H.; Zhang, W.M.; Gao, X.X. Analysis and evaluation of chemically induced artificial agarwood. China J. Chin. Materia Med. 2017, 42, 3159–3166. [Google Scholar]
- Li, Y.; Sheng, N.; Wang, L.; Li, S.; Chen, J.; Lai, X. Analysis of 2-(2-Phenylethyl)chromones by UPLC-ESI-QTOF-MS and Multivariate Statistical Methods in Wild and Cultivated Agarwood. Int. J. Mol. Sci. 2016, 17, 771. [Google Scholar] [CrossRef] [PubMed]
- Chen, H.; Yang, Y.; Xue, J.; Wei, J.; Zhang, Z.; Chen, H. Comparison of compositions and antimicrobial activities of essential oils from chemically stimulated agarwood, wild agarwood and healthy Aquilaria sinensis (Lour.) gilg trees. Molecules 2011, 16, 4884–4896. [Google Scholar] [CrossRef] [PubMed]
- Yang, J.; Dong, W.; Kong, F.; Liao, G.; Wang, J.; Li, W.; Mei, W.; Dai, H. Characterization and Analysis of 2-(2-Phenylethyl)-chromone Derivatives from Agarwood (Aquilaria crassna) by Artificial Holing for Different Times. Molecules 2016, 21, 911. [Google Scholar] [CrossRef] [PubMed]
- Liu, Y.; Chen, J.; Qian, J.; Lin, H.; Sun, N.; Huang, Z. Evolutionary analysis and structural characterization of Aquilaria sinensis sesquiterpene synthase in agarwood formation: A computational study. J. Theor. Biol. 2018, 456, 249–260. [Google Scholar] [CrossRef] [PubMed]
- Gao, Z.H.; Yang, Y.; Zhang, Z.; Zhao, W.T.; Meng, H.; Jin, Y.; Huang, J.Q.; Xu, Y.H.; Zhao, L.Z.; Liu, J.; et al. Profiling of microRNAs under wound treatment in Aquilaria sinensis to identify possible microRNAs involved in agarwood formation. Int. J. Biol. Sci. 2014, 10, 500–510. [Google Scholar] [CrossRef] [PubMed][Green Version]
- Dong, X.J.; Gao, B.; Feng, Y.; Liu, X.; Wang, J.; Wang, J.L.; Tu, P.; Wang, X. Production of 2-(2-phenylethyl)chromones in Aquilaria sinensis calli under different treatments. Plant. Cell Tissue Organ. Culture 2018, 135, 53–62. [Google Scholar] [CrossRef]
- Liao, G.; Dong, W.H.; Yang, J.L.; Li, W.; Wang, J.; Mei, W.L.; Dai, H.F. Monitoring the Chemical Profile in Agarwood Formation within One Year and Speculating on the Biosynthesis of 2-(2-Phenylethyl)Chromones. Molecules 2018, 23, 1261. [Google Scholar] [CrossRef] [PubMed]
- Liu, Y.Y.; Chen, D.L.; Wei, J.H.; Feng, J.; Zhang, Z.; Yang, Y.; Zheng, W. Four New 2-(2-Phenylethyl)chromone Derivatives from Chinese Agarwood Produced via the Whole-Tree Agarwood-Inducing Technique. Molecules 2016, 21, 1433. [Google Scholar] [CrossRef]
- Liu, Y.; Chen, H.; Yang, Y.; Zhang, Z.; Wei, J.; Meng, H.; Chen, W.; Feng, J.; Gan, B.; Chen, X.; et al. Whole-tree agarwood-inducing technique: An efficient novel technique for producing high-quality agarwood in cultivated Aquilaria sinensis trees. Molecules 2013, 18, 3086–3106. [Google Scholar] [CrossRef]
- Wang, S.; Yu, Z.; Wang, C.; Wu, C.; Guo, P.; Wei, J. Chemical Constituents and Pharmacological Activity of Agarwood and Aquilaria Plants. Molecules 2018, 23, 342. [Google Scholar] [CrossRef]
- Wang, M.R.; Li, W.; Luo, S.; Zhao, X.; Ma, C.H.; Liu, S.X. GC-MS Study of the Chemical Components of Different Aquilaria sinensis (Lour.) Gilgorgans and Agarwood from Different Asian Countries. Molecules 2018, 23, 2168. [Google Scholar] [CrossRef]
- Shao, H.; Kong, F.D.; Wang, H.; Mei, W.L.; Dai, H.F. Qinanmer, a new compound from Chinese agarwood ‘Qi-Nan’ originating from Aquilaria sinensis. J. Asian. Nat. Prod. Res. 2017, 19, 935–940. [Google Scholar] [CrossRef]
- Xia, B.; Li, J.; Yang, D.; Mei, W.; Ding, L.; Zhou, Y. A rapid and highly specific method to evaluate the presence of 2-(2-phenylethyl) chromones in agarwood by supercritical fluid chromatography-mass spectrometry. Eur. J. Mass Spectrom (Chichester) 2014, 20, 395–402. [Google Scholar] [CrossRef]
- Ismail, S.N.; Maulidiani, M.; Akhtar, M.T.; Abas, F.; Ismail, I.S.; Khatib, A.; Ali, N.A.M.; Shaari, K. Discriminative Analysis of Different Grades of Gaharu (Aquilaria malaccensis Lamk.) via (1)H-NMR-Based Metabolomics Using PLS-DA and Random Forests Classification Models. Molecules 2017, 22, 1612. [Google Scholar] [CrossRef]
- Kao, W.Y.; Hsiang, C.Y.; Ho, S.C.; Ho, T.Y.; Lee, K.T. Chemical Profiles of Incense Smoke Ingredients from Agarwood by Headspace Gas Chromatography-Tandem Mass Spectrometry. Molecules 2018, 23, 2969. [Google Scholar] [CrossRef] [PubMed]
- Ahn, S.; Ma, C.T.; Choi, J.M.; An, S.; Lee, M.; Le, T.H.V.; Pyo, J.J.; Lee, J.; Choi, M.S.; Kwon, S.W.; et al. Adiponectin-Secretion-Promoting Phenylethylchromones from the Agarwood of Aquilaria malaccensis. J. Nat. Prod. 2019. [CrossRef] [PubMed]
- Wang, S.; Wang, C.; Peng, D.; Liu, X.; Wu, C.; Guo, P.; Wei, J. Agarwood Essential Oil Displays Sedative-Hypnotic Effects through the GABAergic System. Molecules 2017, 22, 2190. [Google Scholar] [CrossRef]
- Lee, S.Y.; Rozi, M.; Yin, Y.F.; Rasool, S.; Turjaman, M.; Gao, Z.H.; Subasinghe, S.M.C.U.P.; Tajuddin, S.N.; Kakino, M.; Karlinasari, L.; et al. Keeping up Appearances: Agarwood Grades and Quality. Agarwood, Tropical Forestry; Springer Science+ Business Media: Singapore, 2016; pp. 149–167. [Google Scholar]
- Xu, Y.; Zhang, Z.; Wang, M.; Wei, J.; Chen, H.; Gao, Z.; Sui, C.; Luo, H.; Zhang, X.; Yang, Y.; et al. Identification of genes related to agarwood formation: Transcriptome analysis of healthy and wounded tissues of Aquilaria sinensis. Bmc Genomics. 2013, 14, 227. [Google Scholar] [CrossRef] [PubMed]
- Zhang, Z.; Wei, J.; Han, X.; Liang, L.; Yang, Y.; Meng, H.; Xu, Y.; Gao, Z. The sesquiterpene biosynthesis and vessel-occlusion formation in stems of Aquilaria sinensis (Lour.) Gilg trees induced by wounding treatments without variation of microbial communities. Int. J. Mol. Sci. 2014, 15, 23589–23603. [Google Scholar] [CrossRef]
- National Pharmacopoeia Committee. Pharmacopoeia of the People’s Republic of China; Chinese Medical Science and Technology Press: Beijing, China, 2015; p. 185. [Google Scholar]
- Mei, W.L.; Yang, D.L.; Wang, H.; Yang, J.L.; Zeng, Y.B.; Guo, Z.K.; Dong, W.H.; Li, W.; Dai, H.F. Characterization and determination of 2-(2-phenylethyl)chromones in agarwood by GC-MS. Molecules 2013, 18, 12324–12345. [Google Scholar] [CrossRef] [PubMed]
- Yan, D.; Wong, Y.F.; Whittock, S.P.; Koutoulis, A.; Shellie, R.A.; Marriott, P.J. Sequential Hybrid Three-Dimensional Gas Chromatography with Accurate Mass Spectrometry: A Novel Tool for High-Resolution Characterization of Multicomponent Samples. Anal. Chem. 2018, 90, 5264–5271. [Google Scholar] [CrossRef]
- Li, W.; Cai, C.H.; Dong, W.H.; Guo, Z.K.; Wang, H.; Mei, W.L.; Dai, H.F. 2-(2-phenylethyl)chromone derivatives from Chinese agarwood induced by artificial holing. Fitoterapia 2014, 98, 117–123. [Google Scholar] [CrossRef]
Not available. |


| No | RT | Similarity | RIE | RIL | Compound Name | MW | Formula | Types |
|---|---|---|---|---|---|---|---|---|
| 1 | 2.317 | 88 | 990 | 982 | Benzaldehyde | 106 | C7H6O | Aromatic compound |
| 2 | 4.542 | 88 | 1156 | 1160 | Benzocyclohexane | 106 | C10H12 | Aromatic compound |
| 3 | 6.275 | 90 | 1230 | 1228 | benzylacetone | 148 | C10H20O | Aromatic compound |
| 4 | 19.336 | 84 | 1460 | 1454 | 7-epi-trans-seqsquisablinene hydrate | 222 | C15H26O | Sesquiterpenoid |
| 5 | 21.000 | 93 | 1594 | / | Epi-gamma-Eudesmol | 222 | C15H26O | Eudesmane-type Sesquiterpenoid |
| 6 | 21.912 | 95 | 1612 | 1598 | Agarospirol | 222 | C15H26O | Agarospirane-type Sesquiterpenoid |
| 7 | 22.051 | 80 | 1615 | 1598 | Hinesol | 222 | C15H26O | Guaiane-type Sesquiterpenoid |
| 8 | 22.273 | 82 | 1619 | 1614 | Guaiol | 222 | C15H26O | Guaiane-type Sesquiterpenoid |
| 9 | 22.492 | 86 | 1624 | / | Tran-guaienol | 222 | C15H26O | Guaiane-type Sesquiterpenoid |
| 10 | 22.701 | 91 | 1628 | 1614 | Guaiol | 222 | C15H26O | Guaiane-type Sesquiterpenoid |
| 11 | 23.334 | 78 | 1641 | 1635 | Isolongifolol | 222 | C15H26O | Sesquiterpenoid |
| 12 | 23.983 | 75 | 1653 | 1638 | Zingerone | 194 | C11H14O3 | Other |
| 13 | 24.202 | 75 | 1658 | 1645 | 6-isopropenyl-4,8a-dimethyl-4a,5,6,7,8,8a-heahydro-1H-naphthalenone | 218 | C15H22O | Eudesmane-type sesquiterpenoid |
| 14 | 24.616 | 77 | 1669 | 1645 | (5s,7s,10s)-selina-3,11-dien-9-one | 218 | C15H22O | Eudesmane-type sesquiterpenoid |
| 15 | 26.158 | 80 | 1698 | 1681 | 2-(4a,8-Dimethyl-1,2,3,4a,5,6,7-octahydro-naphthalenenol | 220 | C15H24O | Eudesmane-type sesquiterpenoid |
| 16 | 26.541 | 80 | 1709 | 1645 | (5s,7s,9s,10s)-(+)-selina-3,11-dein-9-ol | 222 | C15H26O | Guaiane-type Sesquiterpenoid |
| 17 | 27.626 | 80 | 1719 | 1651 | Alpha endesm-11-en-1-alpha-ol | 222 | C15H26O | Eudesmane-type sesquiterpenoid |
| 18 | 27.939 | 81 | 1743 | / | Aromadendrane-4,10-diol | 218 | C15H26O2 | Sesquiterpenoid |
| 19 | 29.681 | 88 | 1761 | / | cryptomeridiol | 240 | C15H28O2 | Sesquiterpenoid |
| 20 | 30.503 | 80 | 1771 | / | 2,6-Dimethyl-6-(4methyl-3-pentenyl)-2-cyclohexene-1-carboxaledehyde | 220 | C15H24O | Aromatic compound |
| 21 | 31.181 | 80 | 1790 | / | Kessane | 220 | C15H24O | sesquiterpenoid |
| 22 | 31.225 | 80 | 1800 | / | naphthalenone | 218 | C15H24O | Eudesmane-type sesquiterpenoid |
| 22 | 31.499 | 75 | 1804 | / | Kessanyl acetate | 280 | C17H28O3 | sesquiterpenoid |
| 23 | 31.913 | 76 | 1811 | / | Curcumenol | 234 | C15H22O2 | sesquiterpenoid |
| 24 | 36.743 | 78 | 1892 | / | Benzocycloheptenol | 222 | C15H26O | sesquiterpenoid |
| 25 | 38.025 | 75 | 1913 | 1904 | 6-[1-(Hydroxymethyl)vinyl]-4,8a-dimethyl-1,2-4a-5,6,7,8a-octahydro-2-naphthalenol | 236 | C15H24O 2 | sesquiterpenoid |
| 26 | 38.522 | 80 | 1921 | 1916 | naphthalenone | 234 | C15H22O2 | sesquiterpenoid |
| 27 | 39.641 | 80 | 1938 | / | phenanthrenone | 250 | C15H22O3 | other |
| 28 | 42.840 | 82 | 1992 | / | Isopimaral | 286 | C20H30O | diterpenes |
| 29 | 56.821 | 96 | 2272 | / | 2-(2-phenethyl)chromone | 250 | C17H14O2 | chromones |
| 30 | 59.365 | / | 2356 | / | PEC: A ring:1OH | 266 | C17H14O3 | chromones |
| 31 | 62.061 | / | 2389 | / | PEC: A ring:1OH | 266 | C17H14O3 | chromones |
| 32 | 64.721 | / | 2458 | / | 6,8-Dihydroxy-2-(2-phenylethyl)chromone | 282 | C17H14O4 | chromones |
| 33 | 64.817 | / | 2463 | / | PEC: A ring:1OH | 266 | C17H14O3 | chromones |
| 34 | 64.882 | / | 2470 | / | PEC: B ring: 1OH, 1OCH3 | 296 | C18H16O4 | chromones |
| 35 | 67.430 | / | 2532 | / | PEC: A ring: 1 OCH3 | 280 | C18H16O3 | chromones |
| 36 | 67.533 | 94 | 2539 | / | 2-(4-Methoxyphenethyl) 4H-chromone | 280 | C18H16O3 | chromones |
| 37 | 68.779 | / | 2569 | / | 6,8-Dihydroxy-2-(2-phenylethyl)chromone | 282 | C17H14O4 | chromones |
| 38 | 69.021 | / | 2572 | / | 6,8-Dihydroxy-2-(2-phenylethyl)chromone | 282 | C17H14O4 | chromones |
| 39 | 69.149 | / | 2579 | / | 6-Hydroxy-8-chloro-2-(2-phenylethyl)chromone | 300 | C17H13ClO3 | chromones |
| 40 | 69.350 | / | 2583 | / | PEC: A ring: 1OH, 1OCH3 | 296 | C18H16O4 | chromones |
| 41 | 71.133 | 2633 | Agaretetrol | 318 | C17H18O6 | chromones | ||
| 42 | 71.355 | / | 2639 | / | PEC: A ring: 1OH, | 266 | C17H14O3 | chromones |
| 43 | 72.773 | / | 2678 | / | EPEC: B ring: 1OH | 284 | C17H16O4 | chromones |
| 44 | 72.873 | / | 2683 | / | PEC: B ring: 1OH, 1 OCH3 | 296 | C18H16O4 | chromones |
| 45 | 74.124 | / | 2716 | / | PEC: A ring: 1OH, 1 OCH3, B ring: 1 OCH3 | 326 | C19H18O5 | chromones |
| 46 | 74.852 | / | 2734 | / | 5,8-Dihydroxy-2-[2-(4-methoxyphenyl)ethyl]chromone | 312 | C18H16O5 | chromones |
| 47 | 75.450 | / | 2751 | / | EPEC: A ring: 1OH,1 OCH3, 1 epo | 314 | C18H18O5 | chromones |
| 48 | 76.361 | / | 2780 | / | EPEC: A ring: 2OH, 1 epo | 300 | C17H16O5 | chromones |
| 49 | 77.476 | / | 2813 | / | PEC:B ring: 2 OCH3 | 310 | C19H18O4 | chromones |
| 50 | 77.678 | / | 2819 | / | PEC: A ring: 2OH, B ring: 1 OCH3 | 312 | C18H16O5 | chromones |
| 51 | 79.350 | / | 2863 | / | PEC: A ring: 1OH, 1 OCH3 | 296 | C18H16O4 | chromones |
| 52 | 80.050 | / | 2890 | / | Stigmasterol | 412 | C29H48O | stigmasterol |
| 53 | 80.208 | / | 2901 | / | THPEC: A ring: 4OH B ring 1 OCH3 | 348 | C18H20O7 | chromones |
| 54 | 80.616 | / | 2907 | / | PEC: A ring: 1OH, B ring: 1OCH3 | 296 | C18H16O4 | chromones |
| 55 | 81.142 | / | 2923 | / | PEC: A ring:2OH, B ring: 1OCH3, 1OH | 328 | C18H16O6 | chromones |
| 56 | 81.676 | / | 2939 | / | PEC: A ring: 1 OCH3, B ring: 1 OCH3, 1OH | 326 | C19H18O5 | chromones |
| 57 | 83.152 | / | 2985 | / | PEC: A ring: 1 OCH3, 1OH; B ring: 1 OCH3, 1OH | 342 | C19H18O6 | chromones |
| 58 | 83.484 | / | 2995 | / | PEC: A ring: 1 OCH3, B ring: 1 OCH3, 1OH | 326 | C19H18O5 | chromones |
| 59 | 83.821 | / | 3006 | / | PEC: A ring:2OH, B ring: 1 OCH3, 1OH | 328 | C18H16O6 | chromones |
| 60 | 84.961 | / | 3042 | PEC: A ring: 1 OCH3, 2OH; B ring: 1 OCH3, | 342 | C19H18O6 | chromones | |
| 61 | 85.498 | / | 3059 | PEC: A ring: 1OH, B ring: 1 OCH3, 1OH | 312 | C18H16O5 | chromones | |
| 62 | 85.916 | / | 3073 | / | PECs: A ring: 2 OCH3,B: 1 OCH3 | 340 | C20H20O5 | chromones |
| 63 | 86.952 | / | 3106 | / | PEC: A ring: 1OH, B ring: 1 OCH3, 1OH | 312 | C18H16O5 | chromones |
| 64 | 87.695 | / | 3130 | / | PEC: A ring: 1 OCH3, 1OH; B ring: 1OCH3 | 326 | C19H18O5 | chromones |
| 65 | 88.537 | 88 | 3178 | / | stigmasterol | 412 | C29H48O | Steriods |
| 66 | 89.950 | / | 3205 | / | PEC: A ring: 1 OCH3, 1OH; B ring: 1 OCH3, 1OH | 342 | C19H18O6 | chromones |
| 67 | 90.813 | 92 | 3234 | / | gamma-Sitosterol | 414 | C29H50O | Steriods |
| 68 | 91.042 | / | 3242 | / | PEC: A ring: 1Cl, 1OH; B ring: 1 OCH3, 1OH | 346 | C18H15ClO5 | chromones |
| 69 | 91.814 | / | 3268 | / | PEC: A ring: 2 OCH3; B ring: 1 OCH3, 1OH | 356 | C20H20O6 | chromones |
| 70 | 93.730 | / | 3334 | / | PEC: A ring: 1 OCH3, 1OH; B ring: 1 OCH3, 1OH | 342 | C19H18O6 | chromones |
| 71 | 94.495 | 87 | 3361 | / | Gamma-Sitostenone | 412 | C29H48O | Steriods |
| No | RT (min) | MF | MW | Compounds | Fragment Ions |
|---|---|---|---|---|---|
| 1 | 2.628 | C19H23O9 | 394 | THPECs: A ring:4 OH, B ring:1OH,2 OCH3 | 377,361,331,167 |
| 2 | 3.328 | C18H21O8 | 364 | THPECs: A ring:4 OH, B ring:1OH,1 OCH3 | 347, 329, 301, 137 |
| 3 | 3.85 | C18H21O8 | 364 | THPECs: A ring:4 OH, B ring:1OH,1 OCH3 | 347, 329, 301, 137 |
| 4 | 4.028 | C18H21O8 | 364 | THPECs: A ring:4 OH, B ring:1OH,1 OCH3 | 347,329,301,137 |
| 5 | 5.616 | C17H18O6 | 318 | Agarotetrol * | 301, 283, 255, 91 |
| 6 | 5.876 | C18H20O7 | 348 | THPECs: A ring:4 OH, B ring:1 OCH3 | 331,313,121 |
| 7 | 6.4 | C17H18O6 | 318 | THPECs: A ring:4 OH, | 301, 283, 255, 91 |
| 8 | 6.689 | C17H18O6 | 318 | THPECs: A ring:4 OH, | 301, 283, 255, 91 |
| 9 | 6.922 | C18H20O7 | 348 | THPECs: A ring:4 OH, B ring:1 OCH3 | 331,313,121 |
| 10 | 7.788 | C18H18O7 | 346 | EPECs: A ring:2 OH, B ring:1OH, 1 OCH3 | 329, 301, 137 |
| 11 | 7.988 | C18H18O7 | 346 | EPECs: A ring:2OH, B ring:1OH, 1 OCH3 | 329, 301, 137 |
| 12 | 7.988 | C18H18O7 | 358 | DEPECs: B ring 1 OH, 2 OCH3 | 329, 167 |
| 13 | 8.427 | C18H186O | 330 | EPECs: A ring:2 OH, B ring:1 OCH3 | 311,121 |
| 14 | 8.992 | C18H16O6 | 328 | DEPECs: B ring 1 OH, 1 OCH3 | 137 |
| 15 | 9.261 | C19H22O7Cl | 396 | THPECs: A ring:3OH,1Cl OCH3, B ring:1 OCH3 | 379, 121 |
| 16 | 9.772 | C18H186O | 328 | DEPECs: B ring 1 OH, 1 OCH3 | 301,137 |
| 17 | 10.238 | C18H186O | 332 | THPECs: A ring:3 OH, B ring:1 OCH3 | 315,121 |
| 18 | 10.533 | C19H22O5 | 330 | THEPECs: A ring:2 OH, B ring:1 OCH3 | 313,121 |
| 19 | 11.783 | C18H186O | 328 | DEPECs: B ring:1 OCH3,1OH | 301,137 |
| 20 | 12.505 | C18H20ClO6 | 366 | THPECs: A ring:3OH,1Cl OCH3, B ring:1 OCH3 | 349, 121 |
| 21 | 12.583 | C17H18ClO5 | 336 | THPECs: A ring:1Cl, 3 OH | 319, 301, 283, 273, 91 |
| 22 | 12.849 | C19H22O5 | 330 | THPECs: A ring:3 OH, B ring:1 OCH3 | 313,121 |
| 23 | 13.083 | C19H16O6 | 342 | FTPECs: A ring:1 OCH3,1OH B ring:1 OCH3,1OH | 237,137 |
| 24 | 13.538 | C19H16O6 | 342 | FTPECs: A ring:1 OCH3,1OH B ring:1 OCH3,1OH | 237,137 |
| 25 | 13.805 | C18H185O | 312 | FTPECs: A ring:1OH, B ring:1 OCH3,1OH | 137 |
| 26 | 14.244 | C18H16O5 | 312 | FTPECs: A ring:2OH, B ring:1 OCH3 | 121 |
| 27 | 14.556 | C18H16O5 | 312 | FTPECs: A ring: 1OH, 1OCH3 B ring:1 OH | 107 |
| 28 | 15.105 | C19H18O5 | 326 | FTPECs: A ring: 2OH, B ring: 1OH, 1 OCH3 | 137 |
| 29 | 15.372 | C20H20O6 | 356 | FTPECs: A ring: OH, 2 OCH3, B ring: 1 OCH3 | 121, |
| 30 | 15.899 | C20H20O6 | 356 | FTPECs: A ring: 2 OCH3, B ring: 1OH, 1 OCH3 | 137,221 |
| 31 | 16.188 | C17H14O3 | 266 | FTPECs: B ring: 1OH | 107,161 |
| 32 | 16.533 | C18H16O4 | 296 | FTPECs: A ring: 1OH, 1 OCH3, B ring: 1 OCH3 | 121 |
| 33 | 17.833 | C19H18O5 | 326 | FTPECs: A ring: 2 OCH3, B ring: 1OH | 107 |
| 34 | 17.999 | C18H16O4 | 296 | FTPECs: A ring: 1OH, 1 OCH3, B ring: 1 OCH3 | 121 |
| 35 | 18.310 | C19H18O5 | 326 | FTPECs: A ring: 1OH, 1 OCH3, B ring: 1 OCH3 | 121 |
| 36 | 18.655 | C18H16O4 | 296 | FTPECs: A ring: 1OH, 1 OCH3 | 91 |
| 37 | 19.010 | C17H14O3 | 266 | FTPECs: B ring: 1OH | 107 |
| 38 | 20.232 | C20H20O5 | 340 | FTPECs: A ring: 2 OCH3, B ring: 1 OCH3 | 121 |
| 39 | 20.549 | C19H18O4 | 310 | FTPECs: A ring: 2 OCH3 | 91 |
| 40 | 21.688 | C18H16O3 | 280 | 2-[2-(4-Methoxyphenyl)ethyl] chromone * | 121 |
| 41 | 22.088 | C17H14O2 | 250 | 2-(2-phenyethyl) chromone * | 91 |
| 42 | 20.232 | C20H20O5 | 340 | FTPECs: A ring: 2 OCH3, B ring: 1 OCH3 | 121 |
| 43 | 20.549 | C19H18O4 | 310 | FTPECs: A ring: 2 OCH3 | 91 |
| No | RT | MW | Type | Molecular Formula |
|---|---|---|---|---|
| FT1975 | 14.6 | 334 | THPECs: A ring: 4OH, B ring: 1OH | C17H18O7 |
| FT2736 | 17.916 | 326 | FTPECs: A ring: 2OCH3, B ring: 1OH | C19H18O5 |
| FT2885 | 17.633 | 266 | FTPECs: B ring: 1OH | C17H14O3 |
| FT2015 | 14.7 | 304 | Unknown | C20H32O2 |
| FT3251 | 19.333 | 300 | FTPECs: A ring: 1OH, 1Cl | C17H13ClO3 |
| FT2503 | 16.033 | 282 | Sesquiterpenoid | C16H26O4 |
| FT3510 | 19.85 | 218 | Sesquiterpenoid | C15H22O |
| FT2691 | 16.567 | 296 | FTPECs: A ring: 1OH, 1OCH3, B ring: 1OCH3 | C18H16O4 |
| FT2551 | 17.85 | 326 | FTPECs: A ring: 2OCH3, B ring: 1OH | C19H18O5 |
| No | Group | Origin | No | Group | Origin | No | Group | Origin |
|---|---|---|---|---|---|---|---|---|
| S1 | A | Zhongshan, Guangdong | S17 | B | Haikou, Hainan | S33 | C | Haikou, Hainan |
| S2 | A | Zhongshan, Guangdong | S18 | B | Dongguan, Guangdong | S34 | C | Haikou, Hainan |
| S3 | A | Zhongshan, Guangdong | S19 | B | Dongguan, Guangdong | S35 | C | Haikou, Hainan |
| S4 | A | Dongguan, Guangdong | S20 | B | Dongguan, Guangdong | S36 | C | Haikou, Hainan |
| S5 | A | Dongguan, Guangdong | S21 | B | Haikou, Hainan | S37 | C | Haikou, Hainan |
| S6 | A | Dongguan, Guangdong | S22 | B | Haikou, Hainan | S38 | C | Haikou, Hainan |
| S7 | A | Dongguan, Guangdong | S23 | B | Haikou, Hainan | S39 | C | Haikou, Hainan |
| S8 | A | Dongguan Guangdong | S24 | C | Yulin, Guangxi | S40 | C | Zhongshan, Guangdong |
| S9 | A | Dongguan, Guangdong | S25 | C | Zhongshan, Guangdong | S41 | D | Puer, Yunan |
| S10 | A | Dongguan, Guangdong | S26 | C | Zhongshan, Guangdong | S42 | D | Puer, Yunan |
| S11 | A | Haikou, Hainan | S27 | C | Zhongshan, Guangdong | S43 | D | Puer, Yunan |
| S12 | A | Hainan, Haikou | S28 | C | Zhongshan, Guangdong | S44 | D | Xishuangbana Yunnan |
| S13 | A | Haikou, Hainan | S29 | C | Zhongshan, Guangdong | S45 | D | Puer, Yunan |
| S14 | A | Haikou, Hainan | S30 | C | Zhongshan, Guangdong | S46 | D | Zhongshan, Guangdong |
| S15 | B | Huazhou, Guangxi | S31 | C | Huazhou, Guangxi | S47 | D | Haikou, Hainan |
| S16 | B | Zhongshan, Guangdong | S32 | C | Haikou, Hainan | S48 | D | Beihai, Guangxi |
© 2019 by the authors. Licensee MDPI, Basel, Switzerland. This article is an open access article distributed under the terms and conditions of the Creative Commons Attribution (CC BY) license (http://creativecommons.org/licenses/by/4.0/).
Share and Cite
Yan, T.; Yang, S.; Chen, Y.; Wang, Q.; Li, G. Chemical Profiles of Cultivated Agarwood Induced by Different Techniques. Molecules 2019, 24, 1990. https://doi.org/10.3390/molecules24101990
Yan T, Yang S, Chen Y, Wang Q, Li G. Chemical Profiles of Cultivated Agarwood Induced by Different Techniques. Molecules. 2019; 24(10):1990. https://doi.org/10.3390/molecules24101990
Chicago/Turabian StyleYan, Tingting, Sheng Yang, Yuan Chen, Qian Wang, and Gaiyun Li. 2019. "Chemical Profiles of Cultivated Agarwood Induced by Different Techniques" Molecules 24, no. 10: 1990. https://doi.org/10.3390/molecules24101990
APA StyleYan, T., Yang, S., Chen, Y., Wang, Q., & Li, G. (2019). Chemical Profiles of Cultivated Agarwood Induced by Different Techniques. Molecules, 24(10), 1990. https://doi.org/10.3390/molecules24101990