
Features of the Molecular Structure and Luminescence of Rare-Earth Metal Complexes with Perfluorinated (Benzothiazolyl)phenolate Ligands

 , , , and
Abstract
:
1. Introduction
2. Results and Discussion
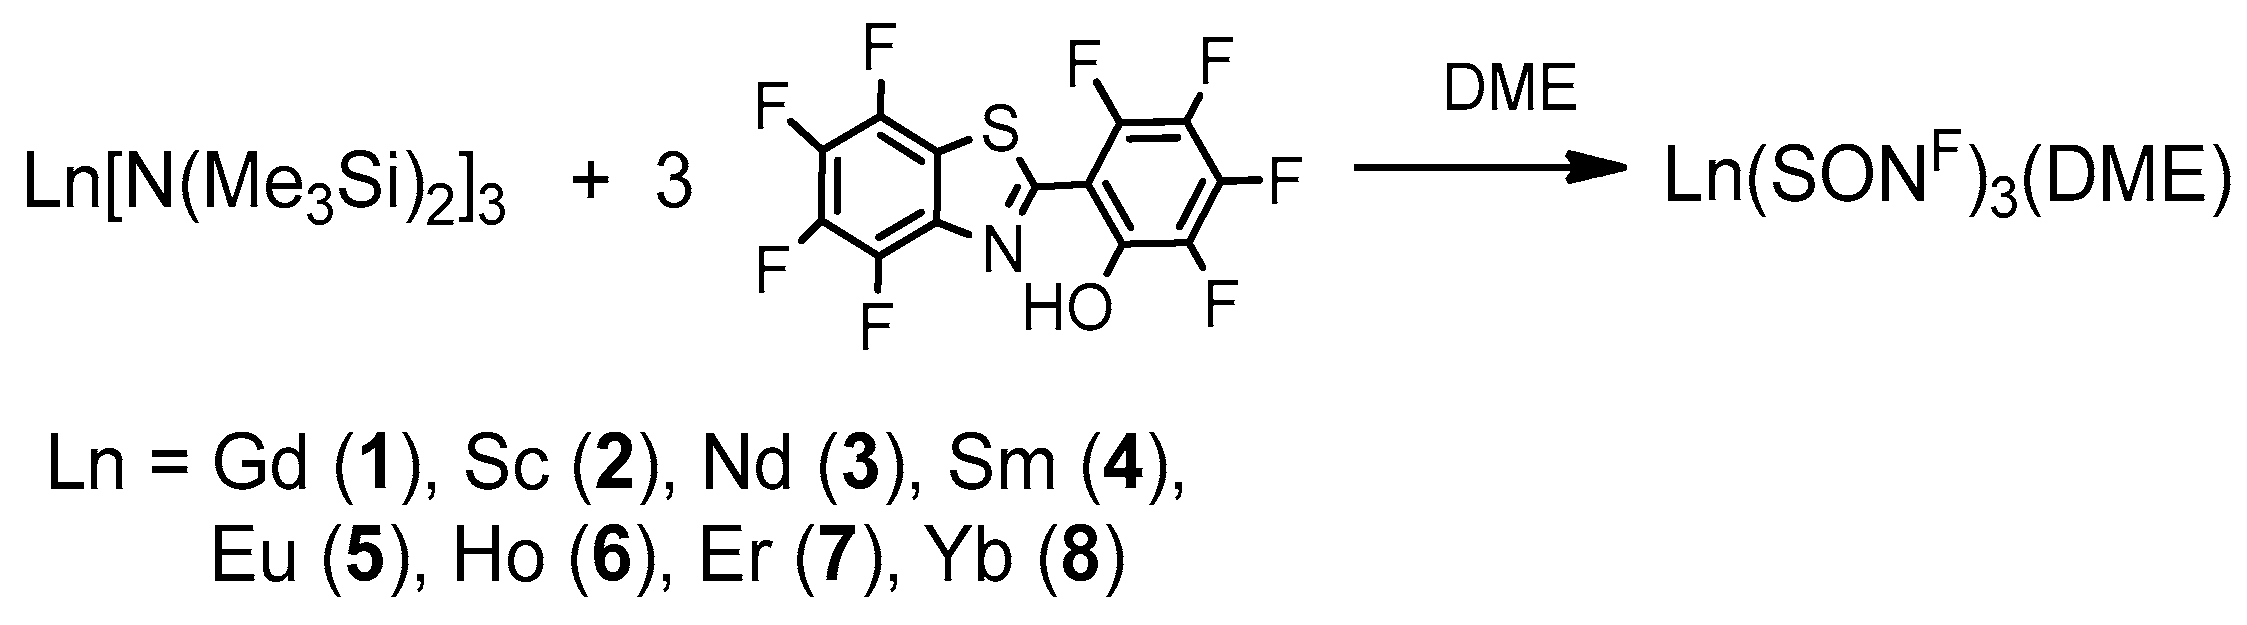
2.1. Synthesis
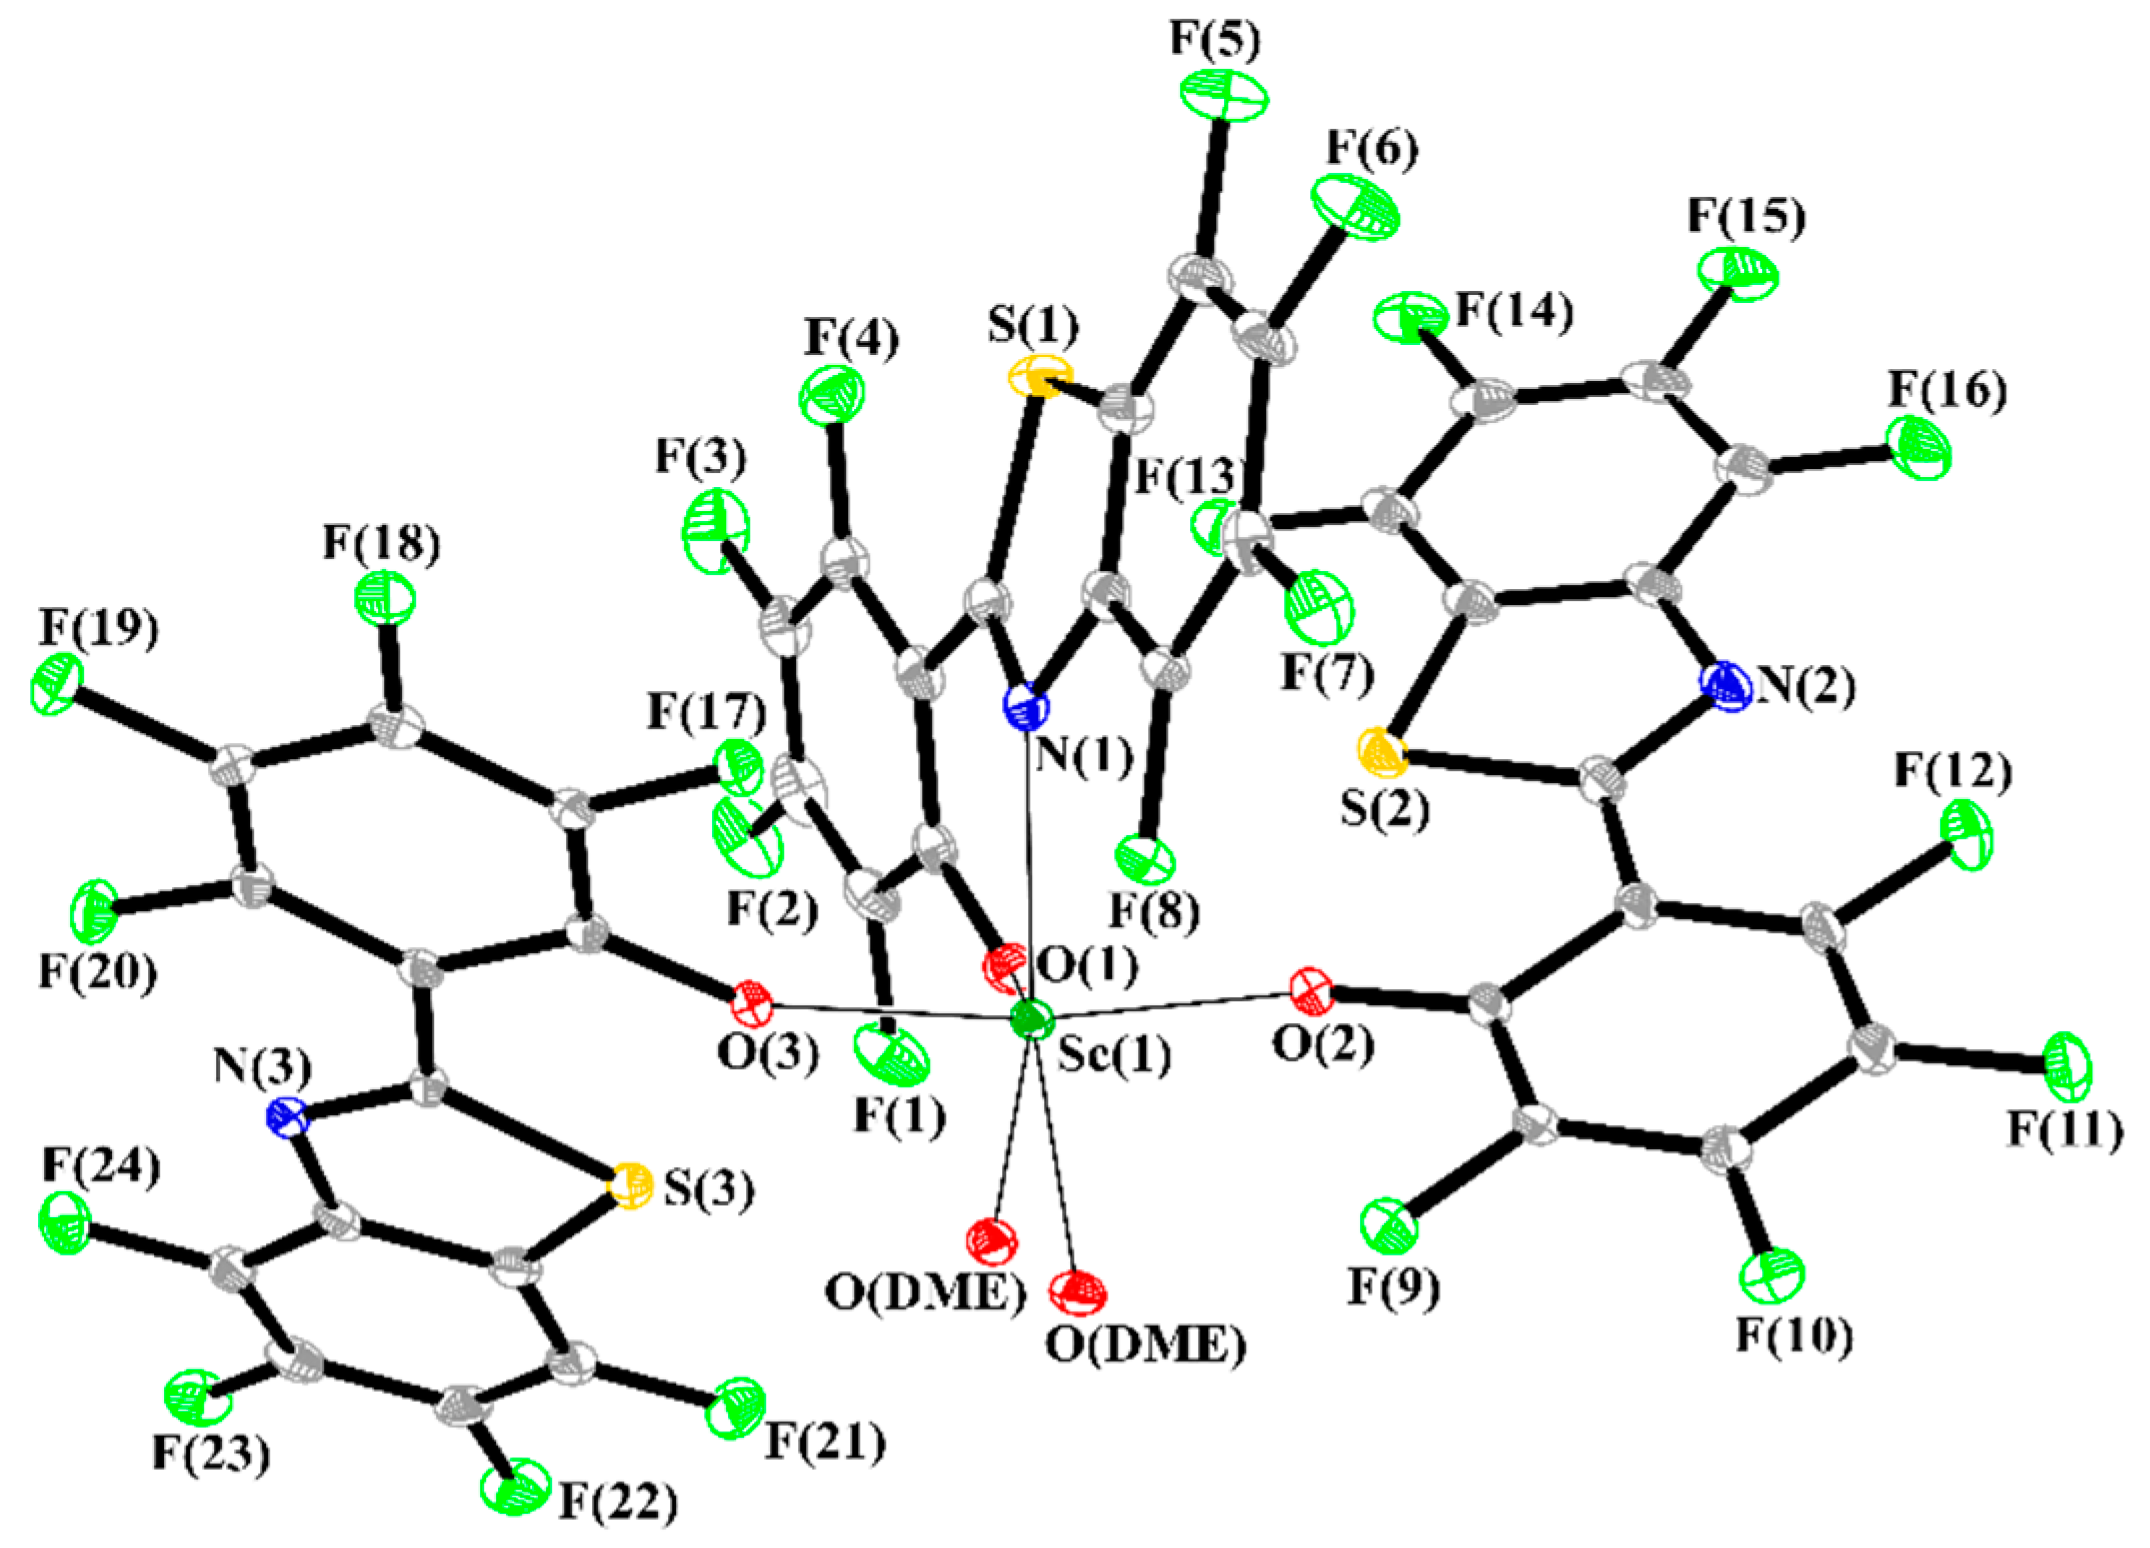
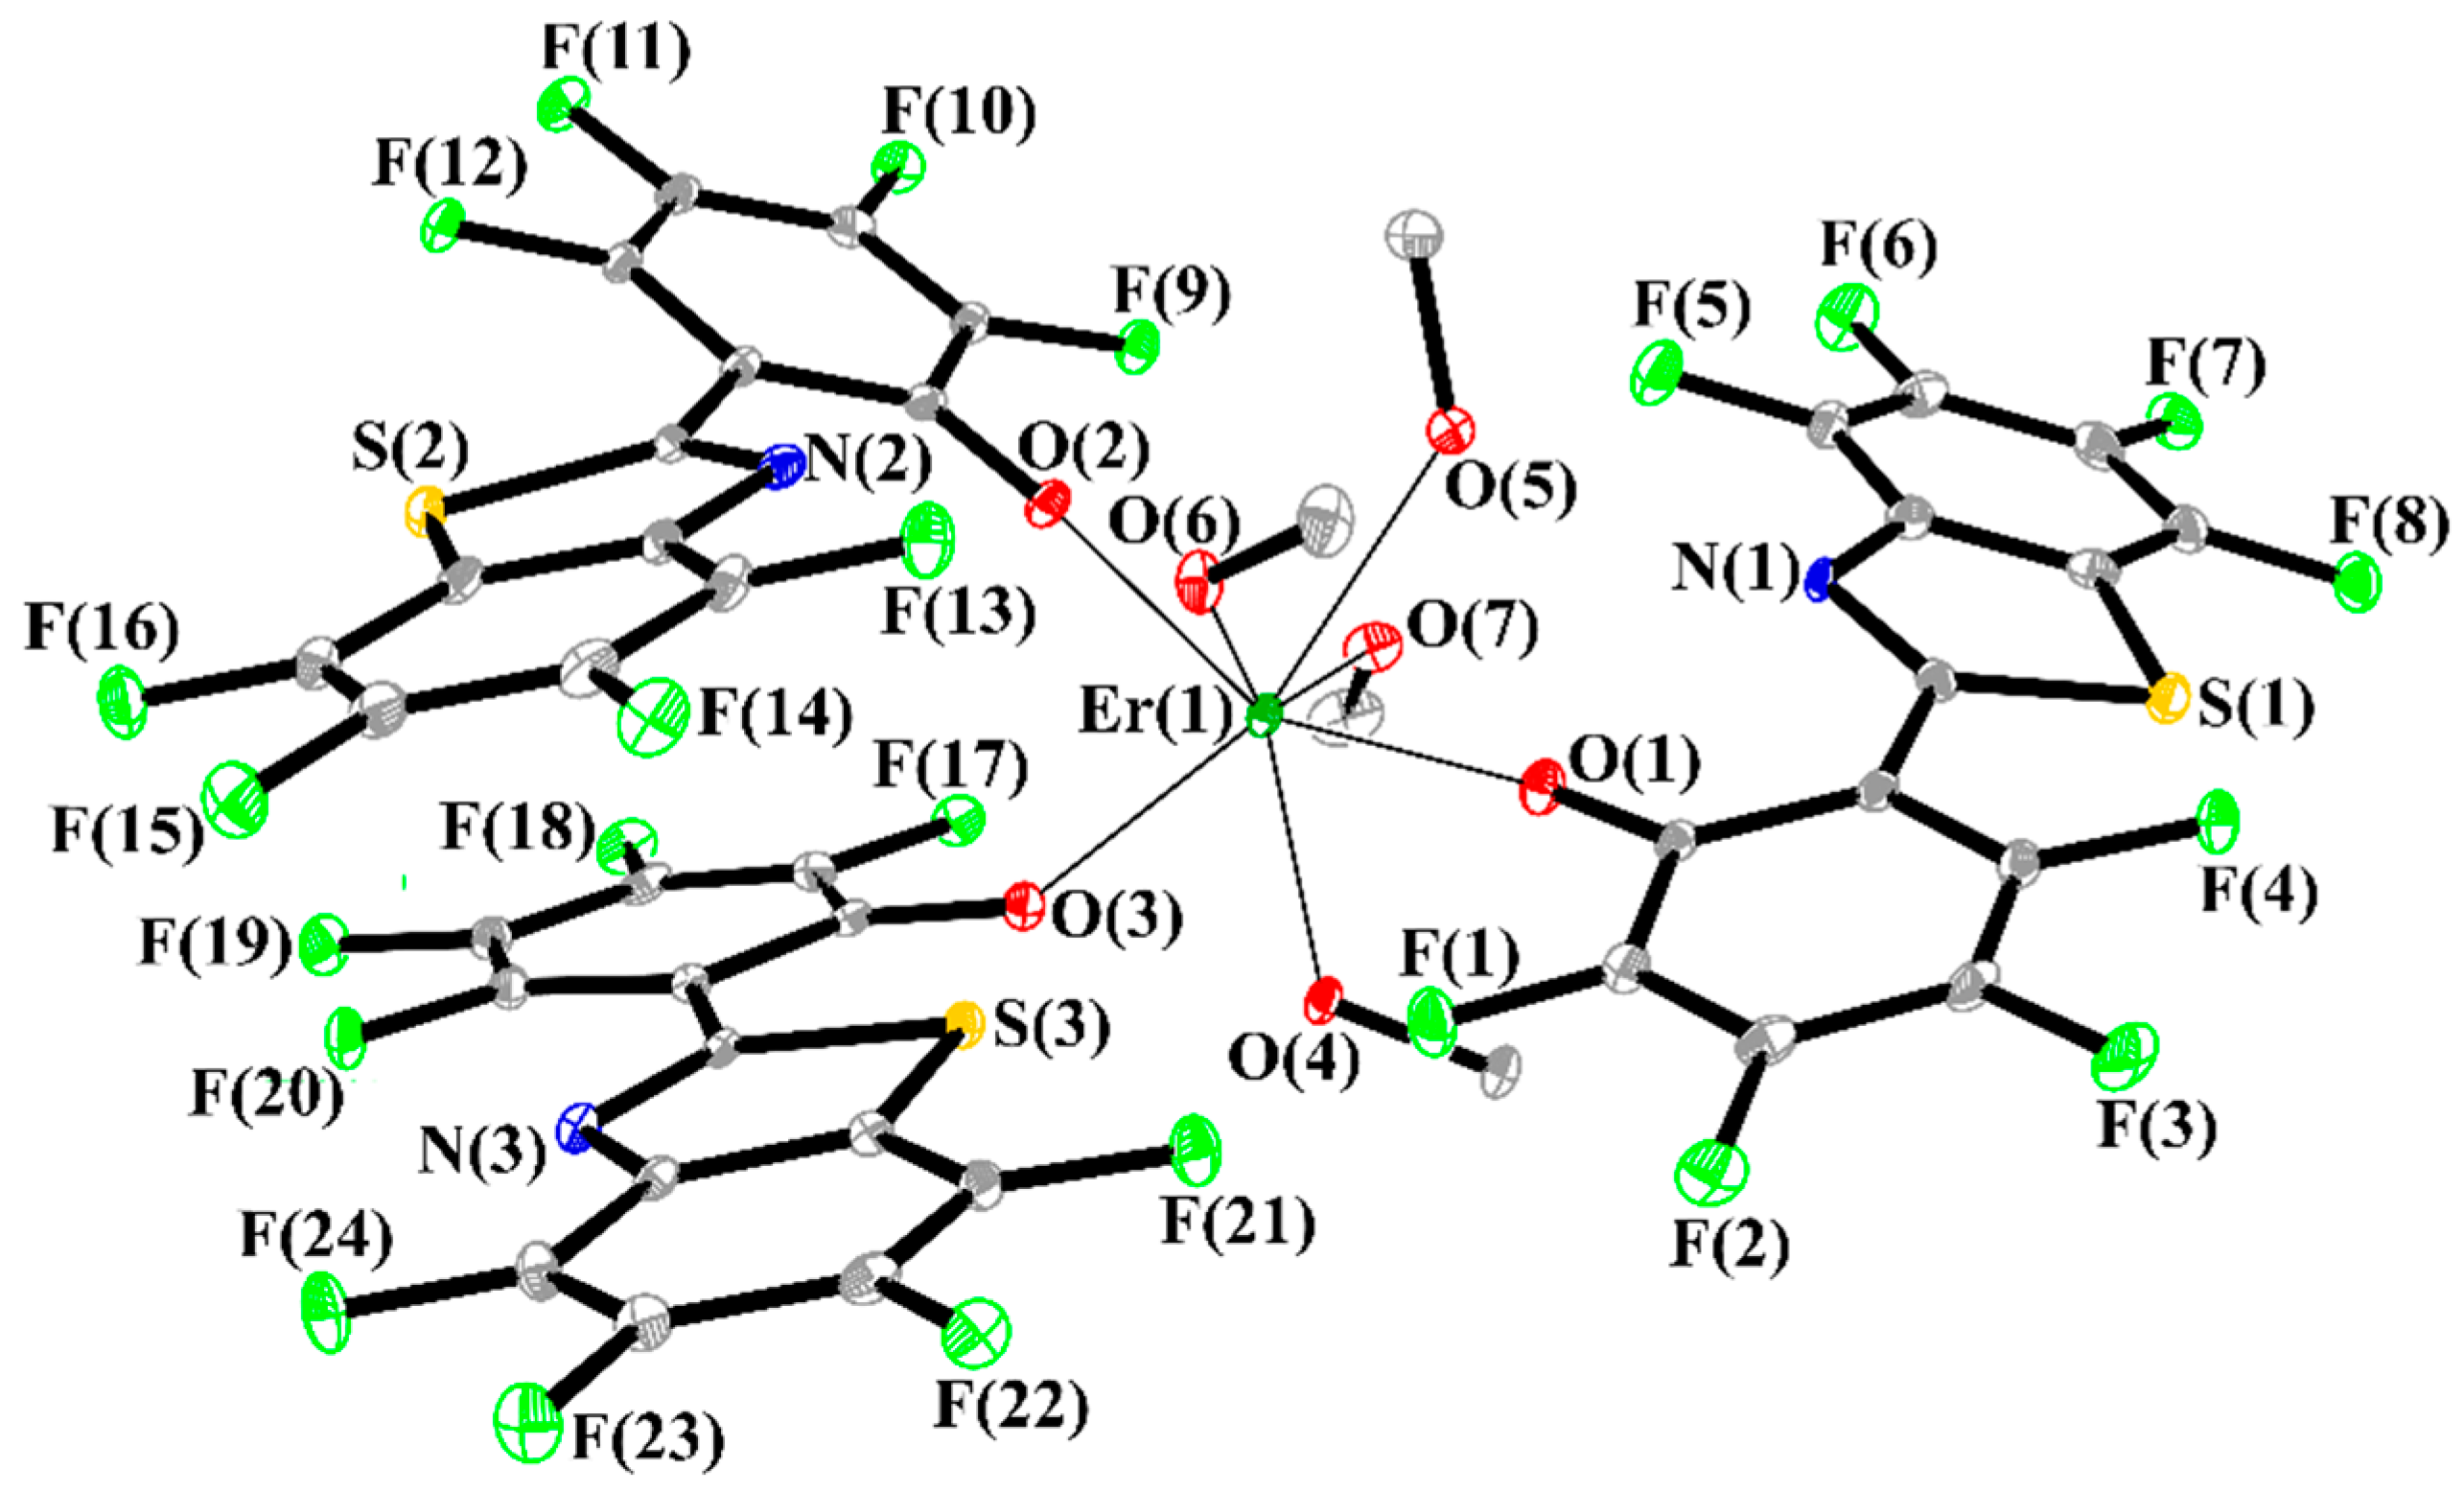
2.2. Crystal Structures of H(SONF), 2 and 7
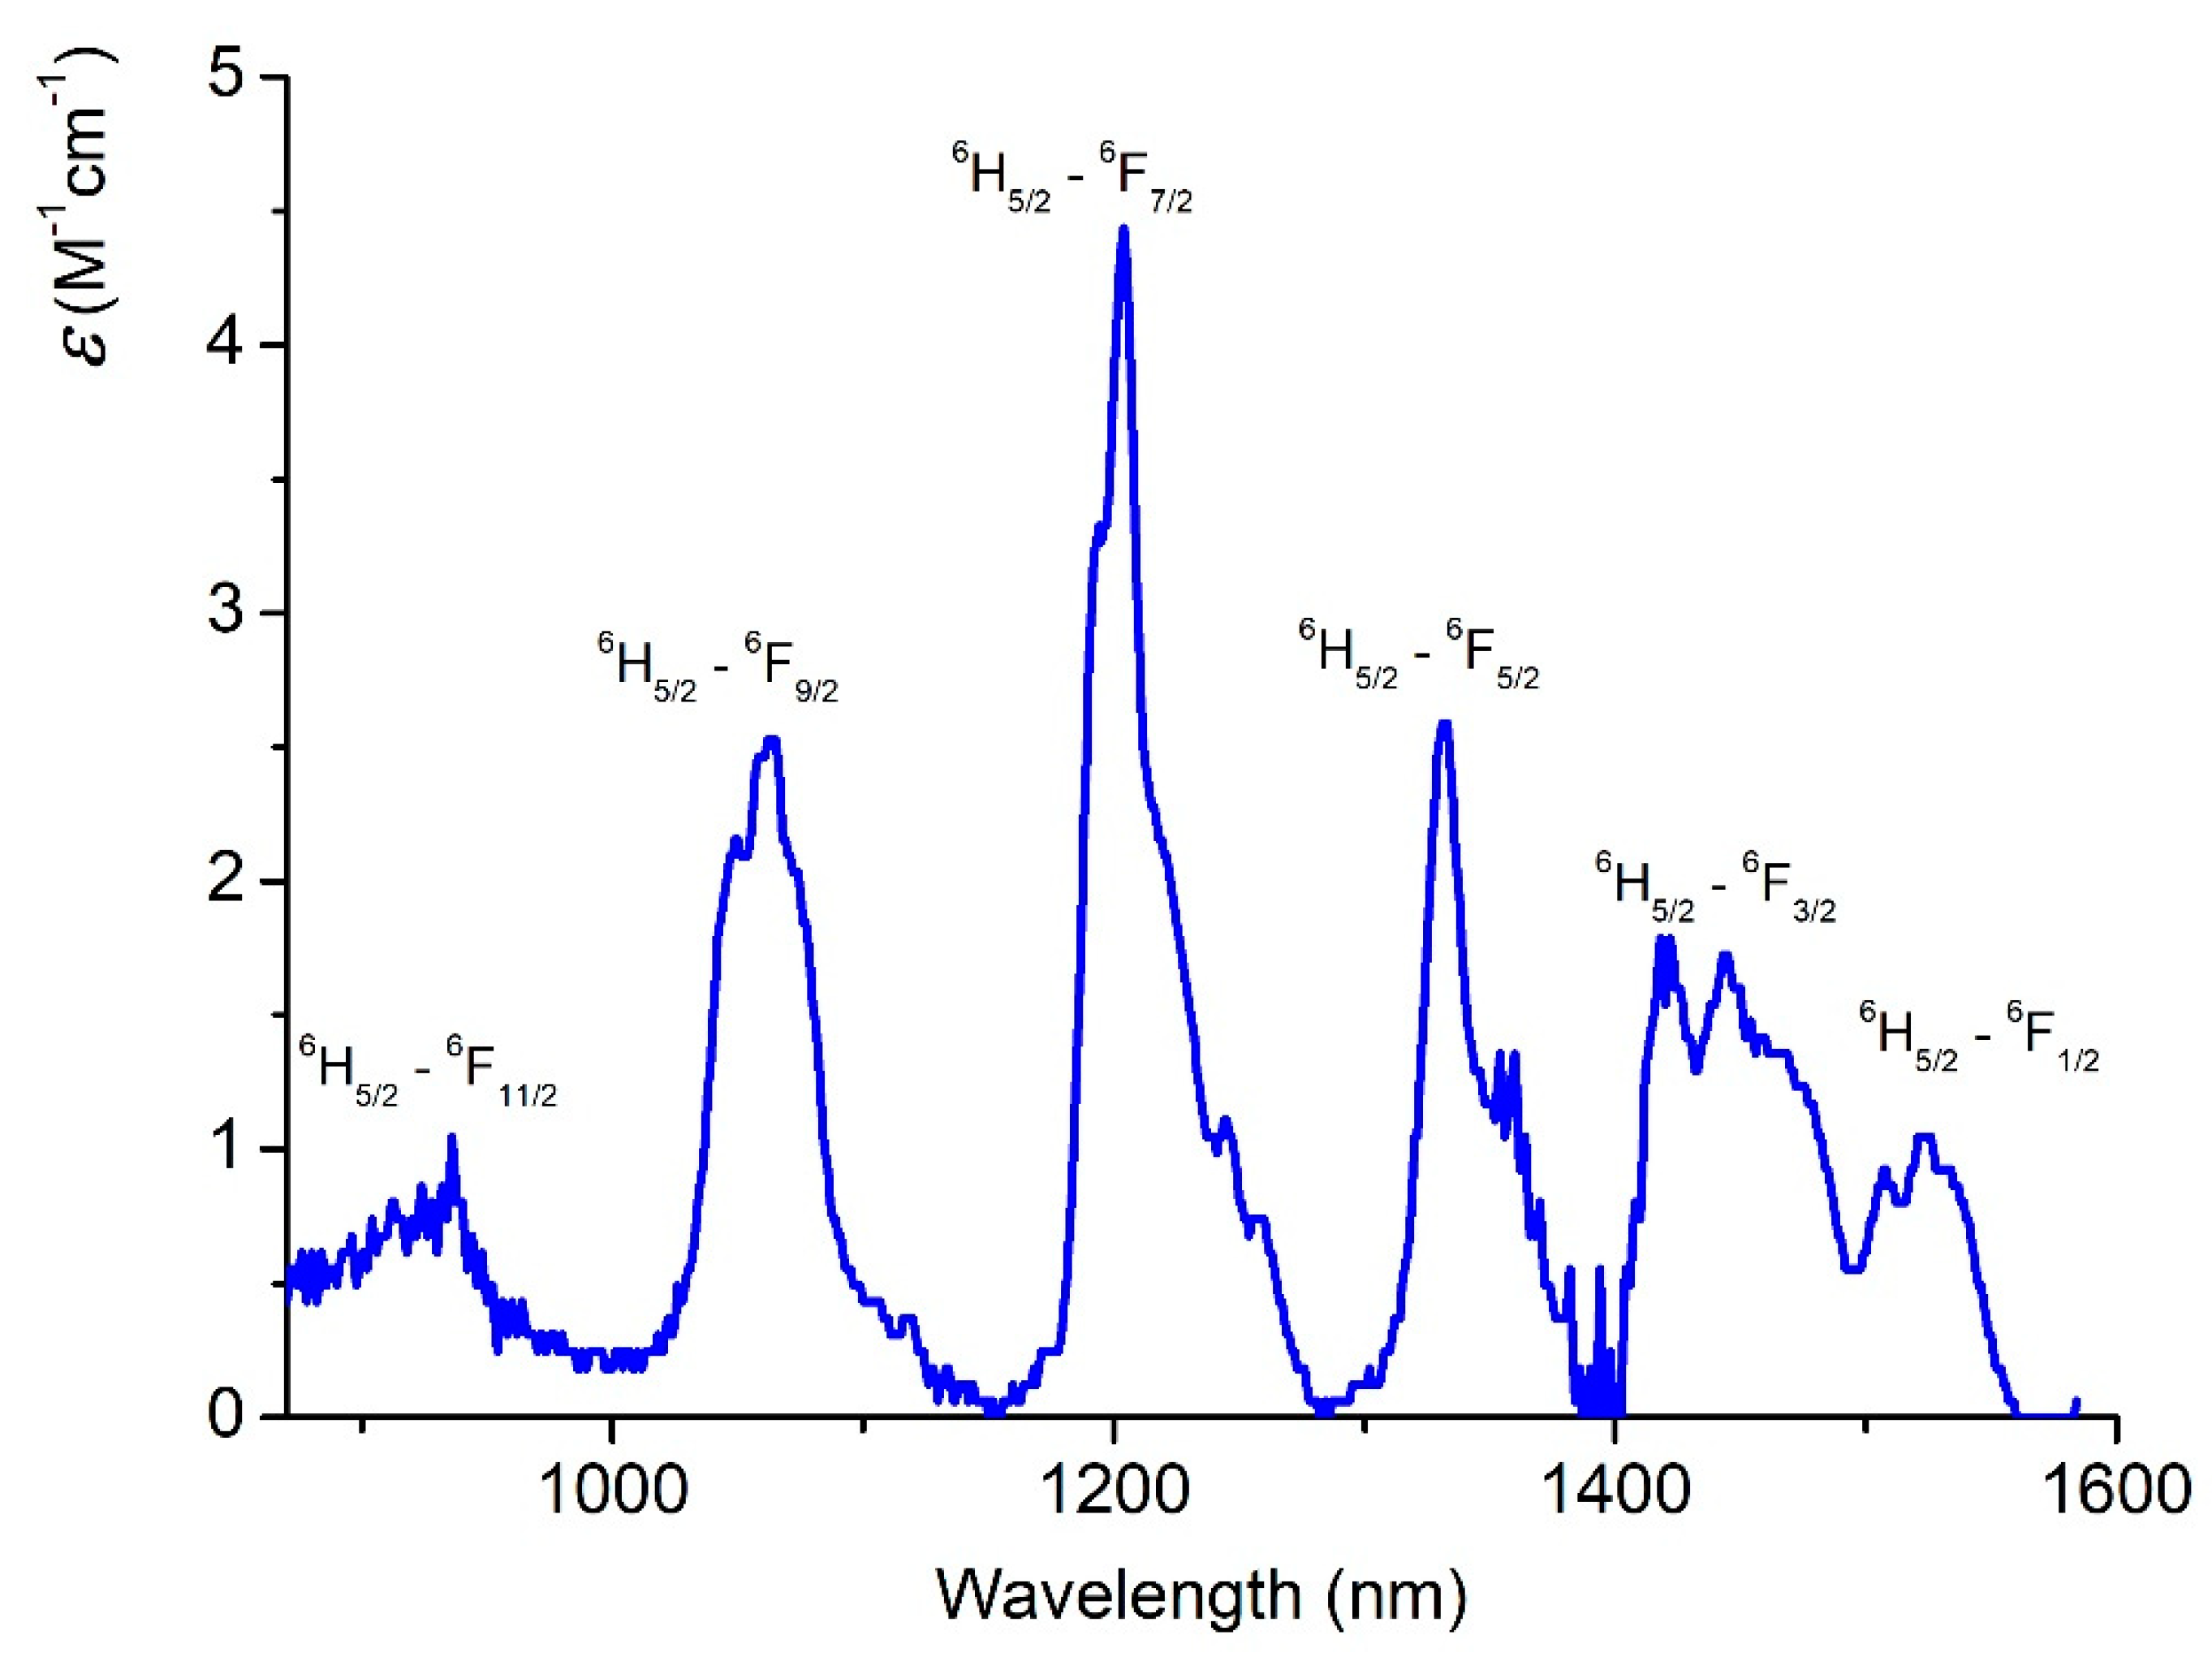
2.3. Absorption Spectra and Judd-Ofelt Analysis
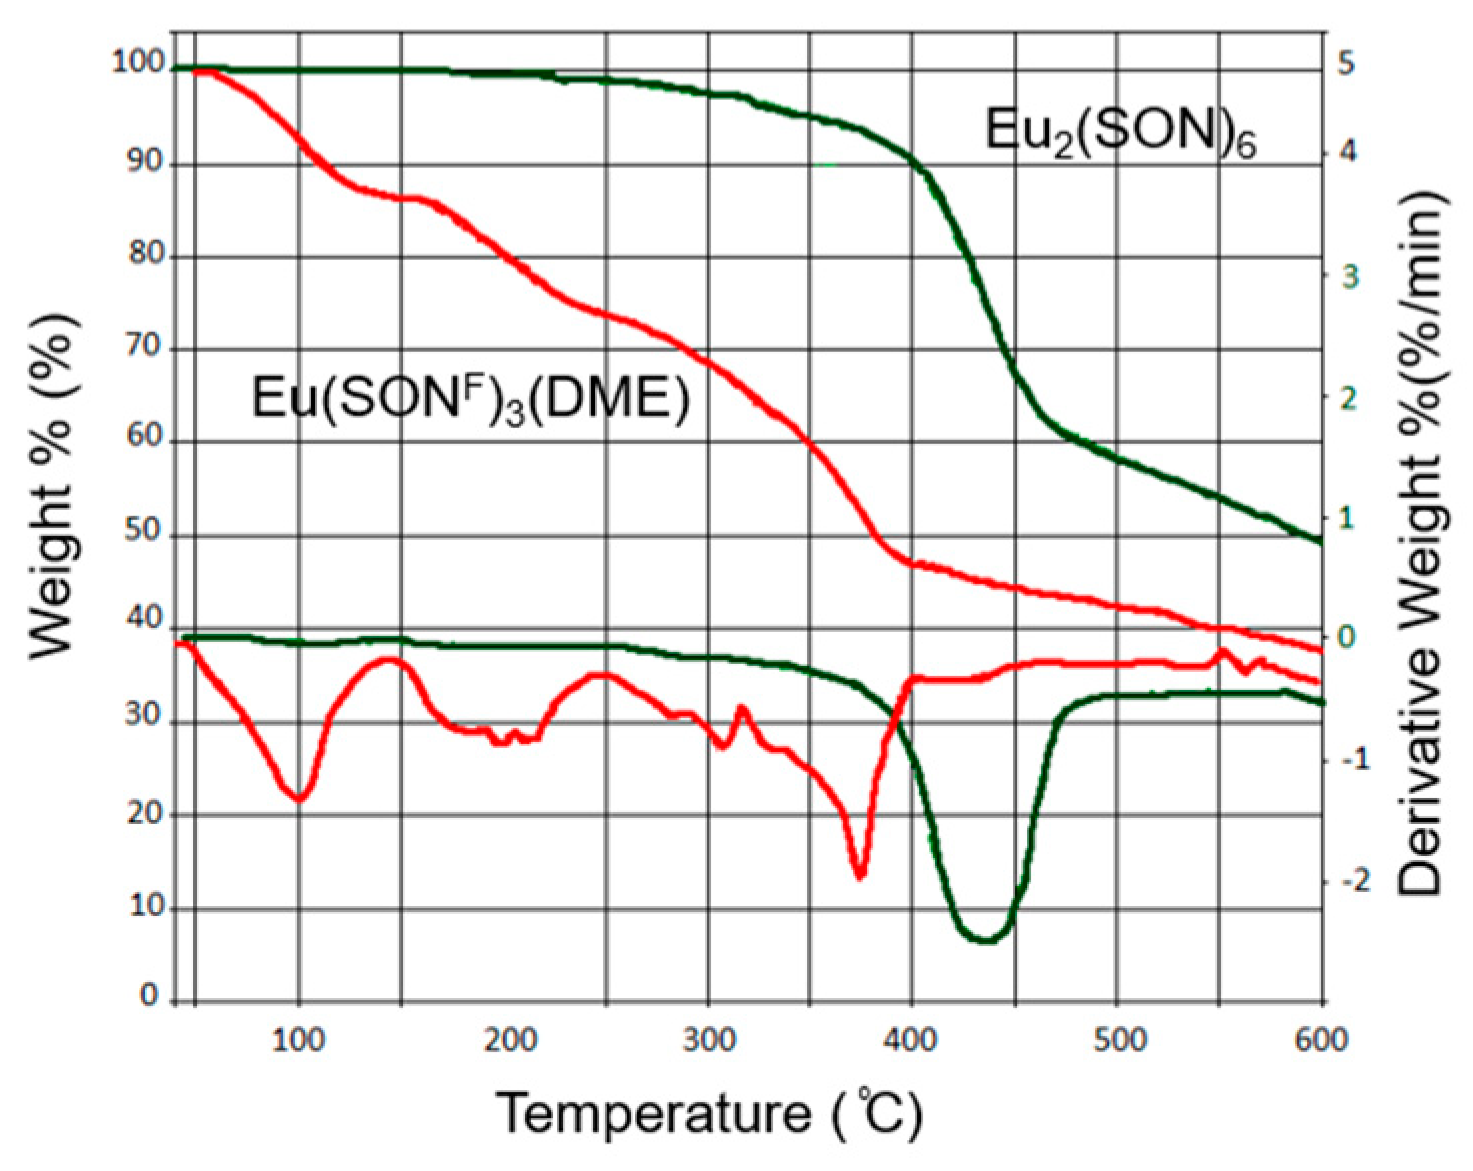
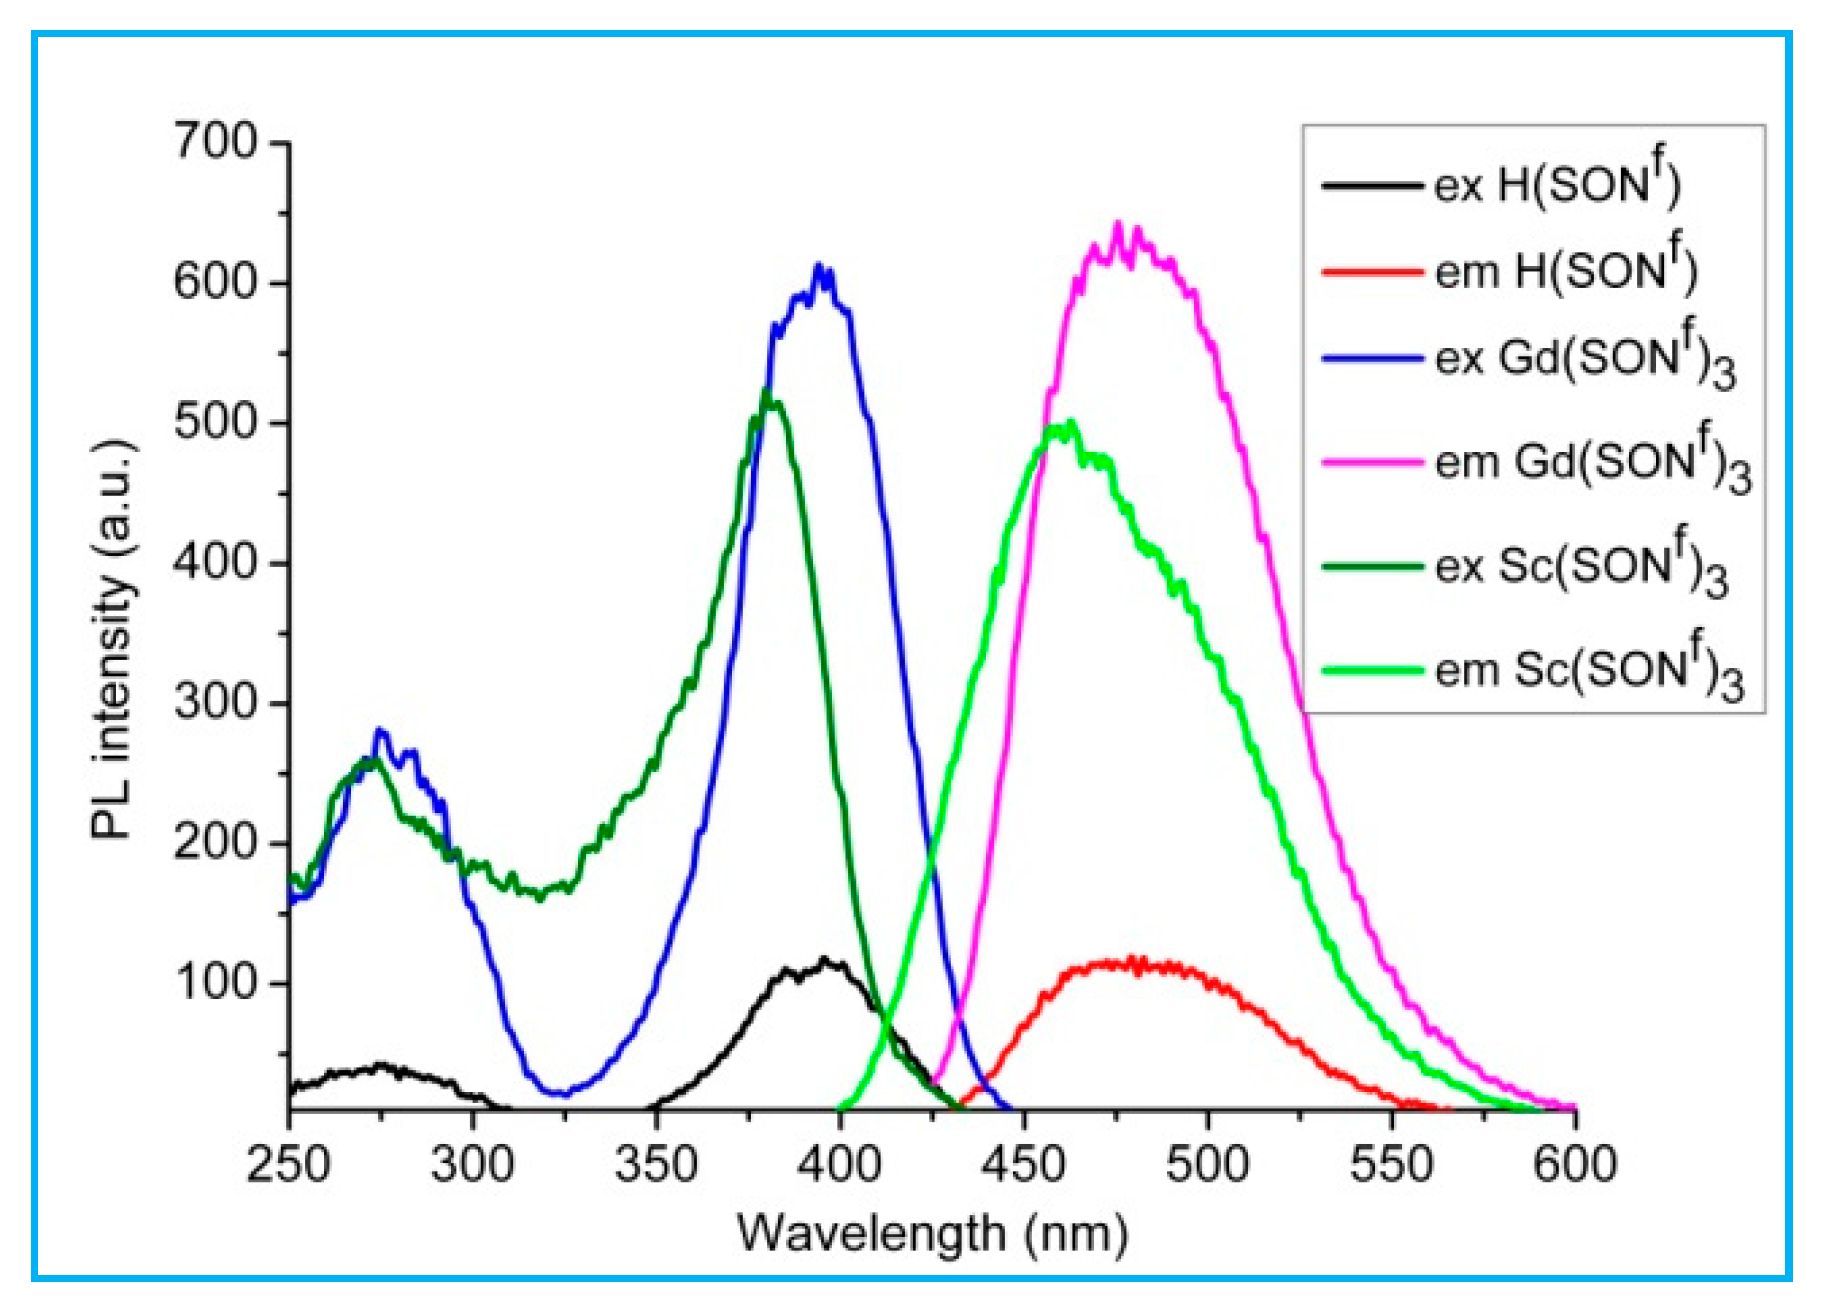
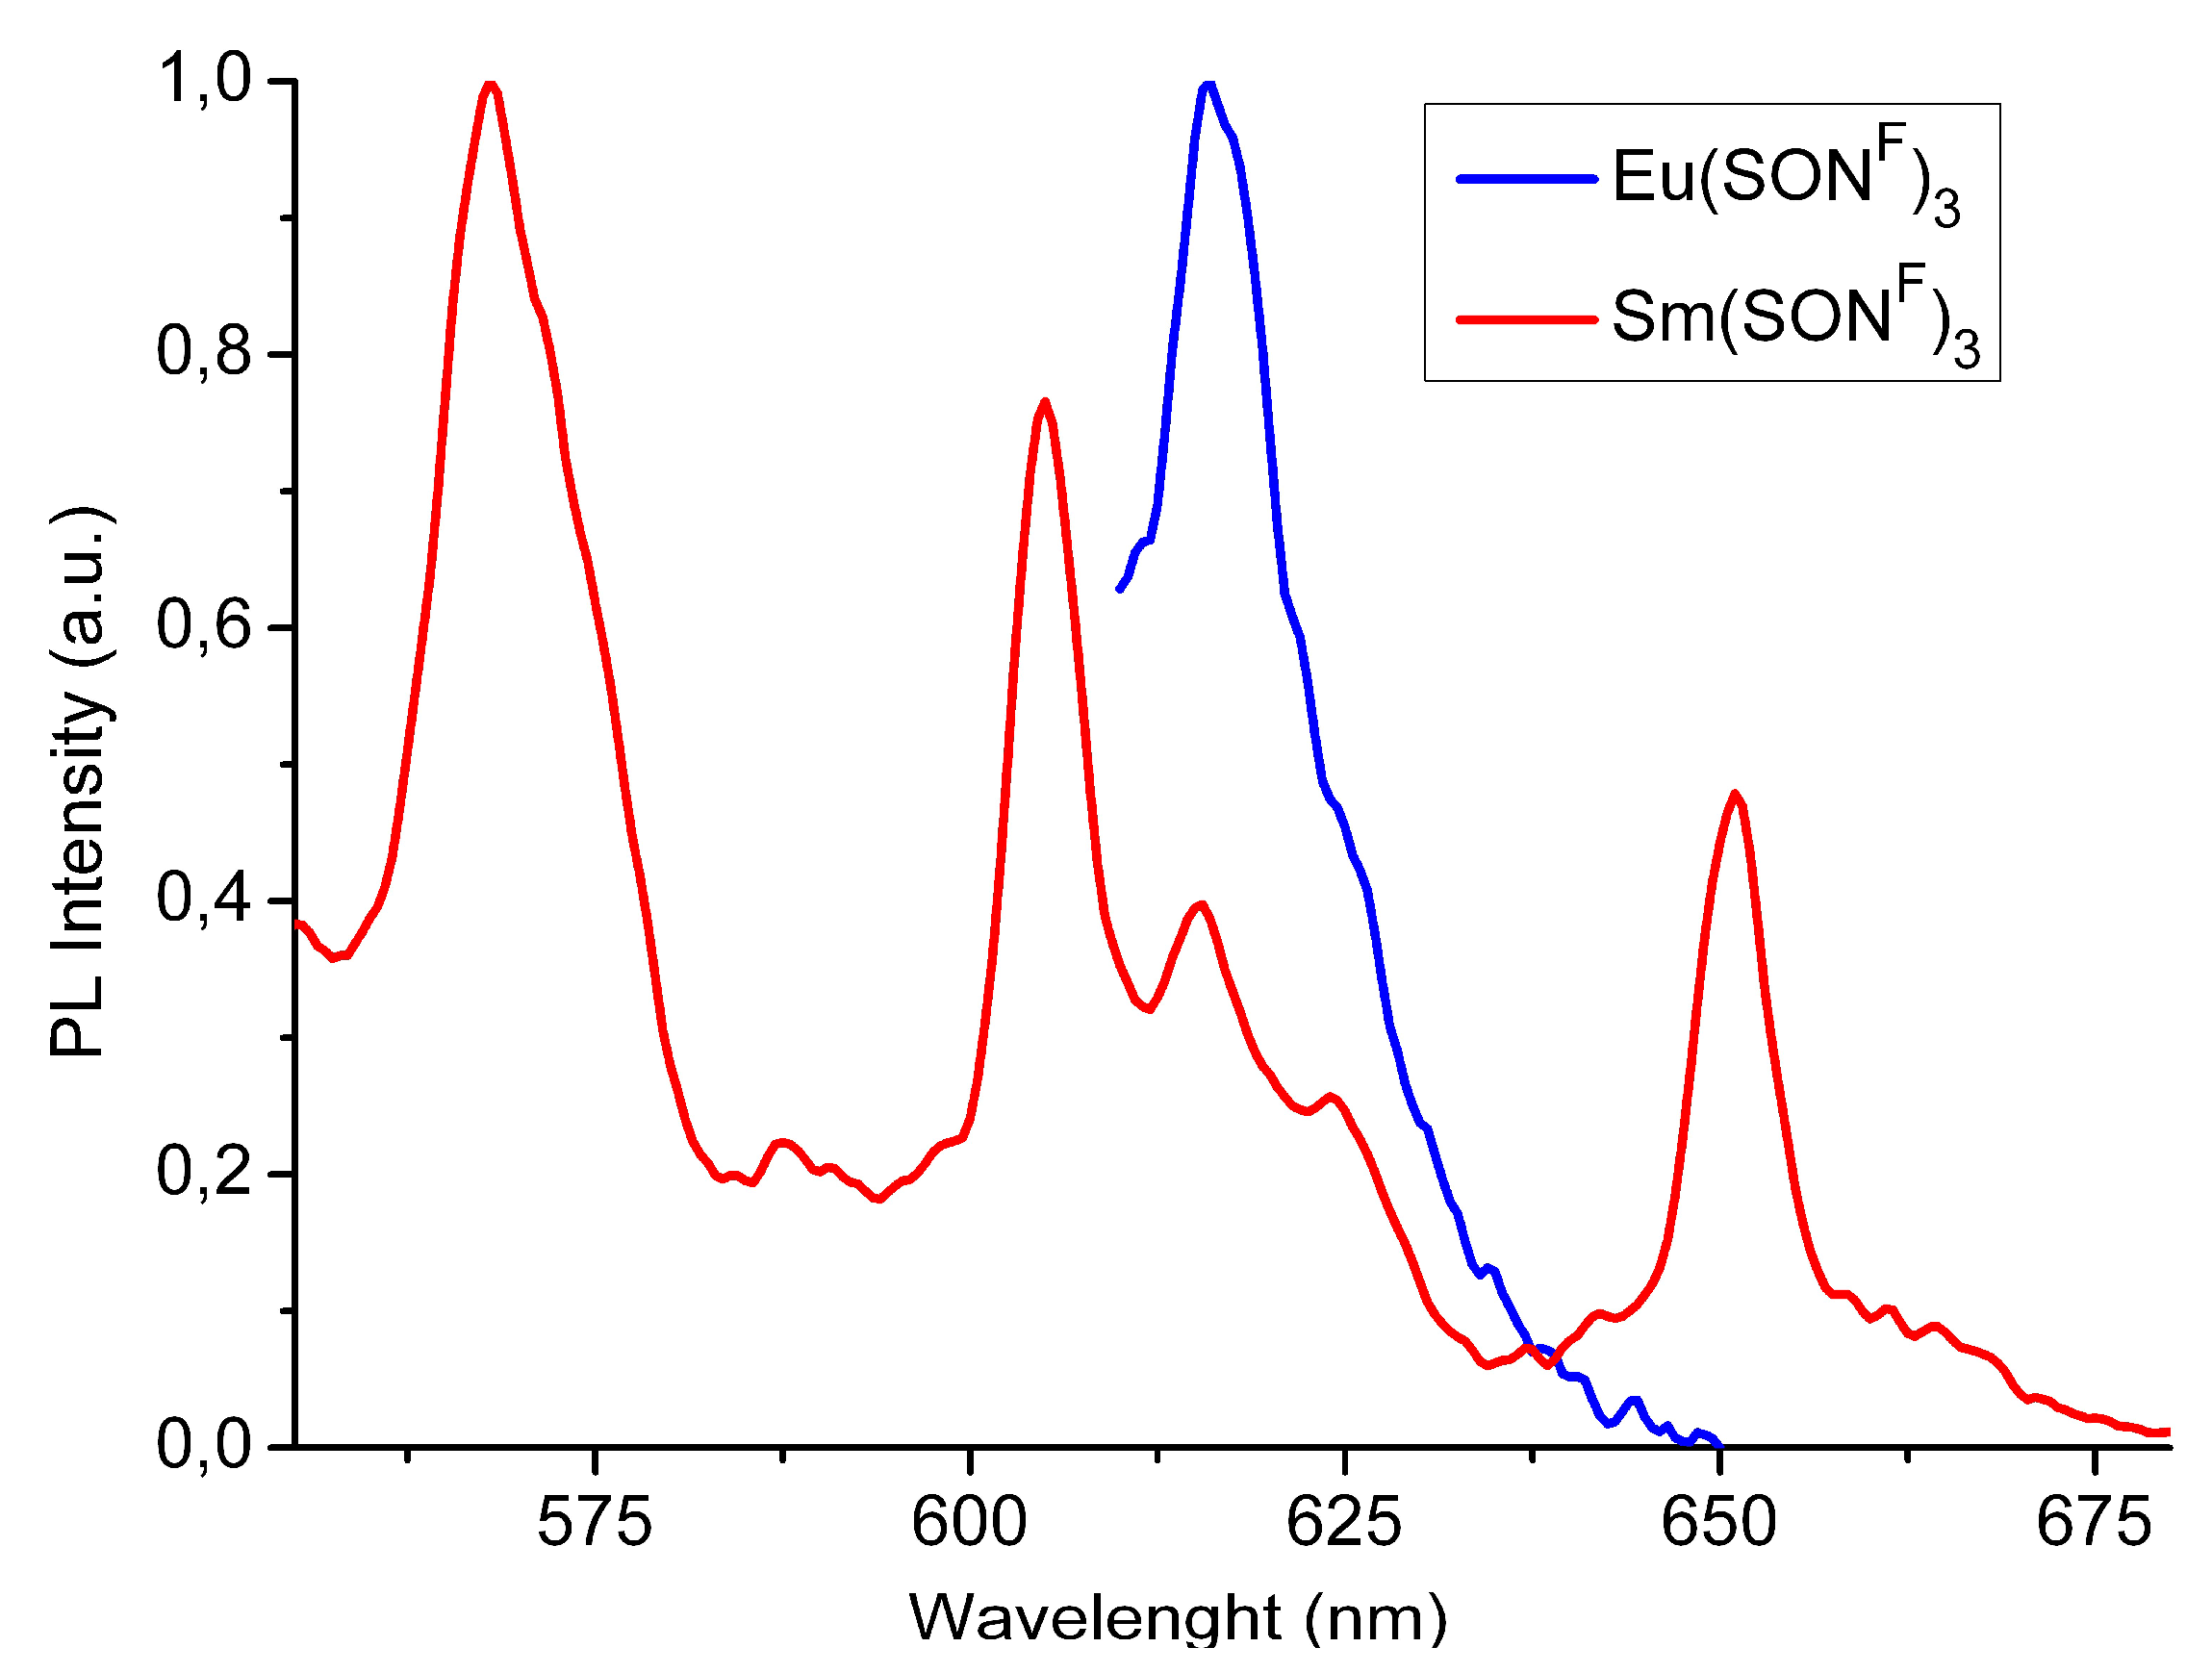
2.4. Luminescence
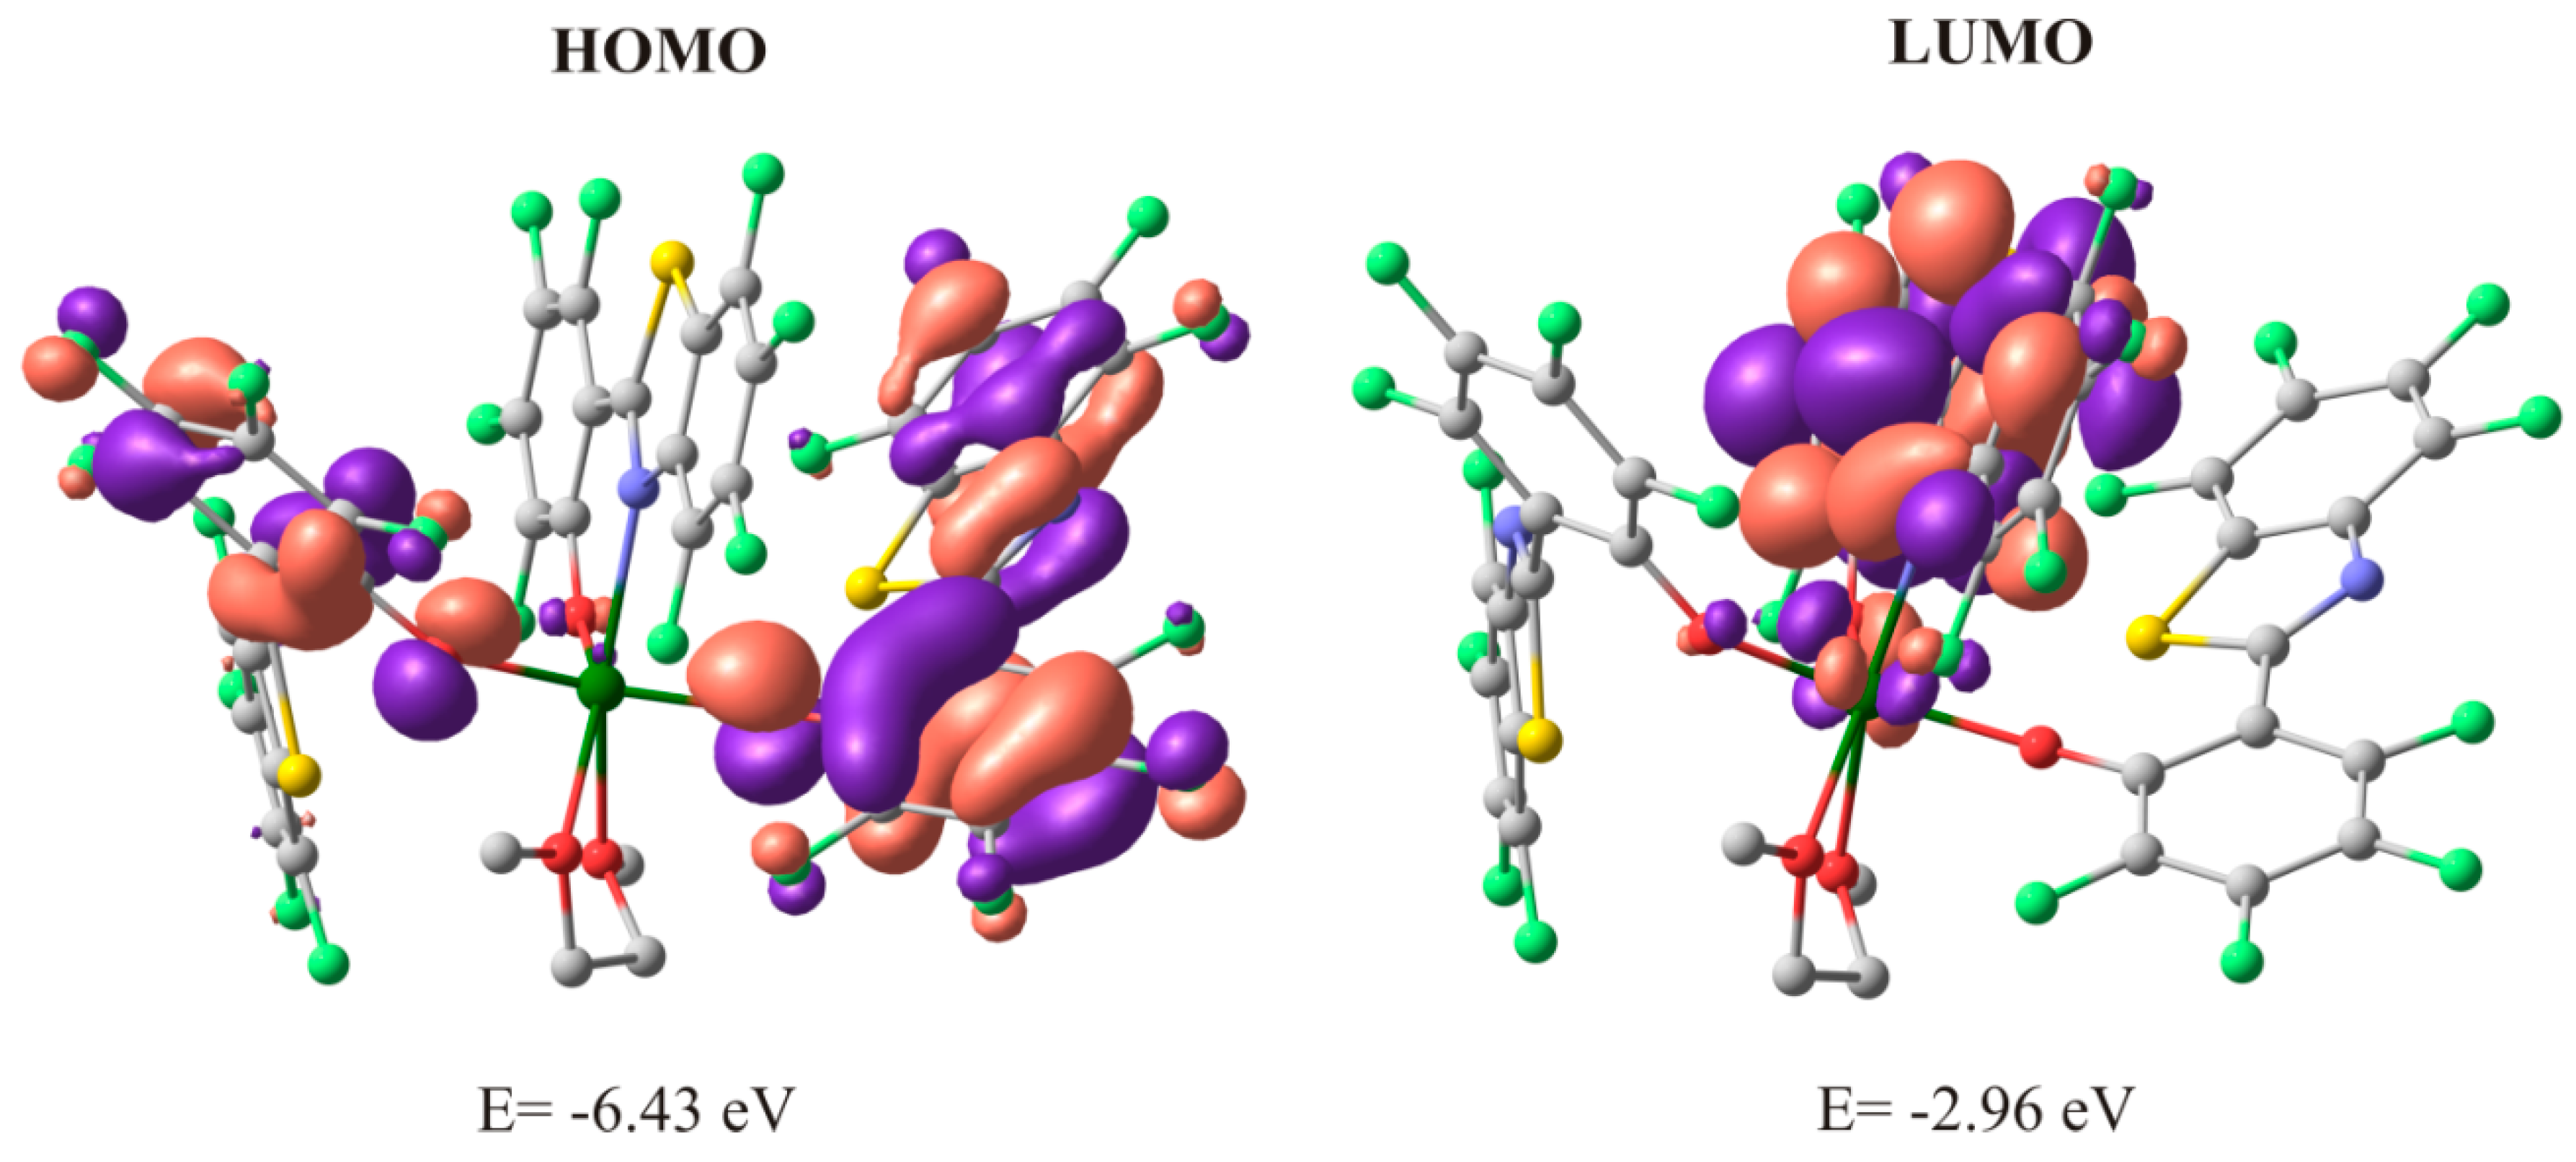
2.5. DFT Modeling
3. Materials and Methods
3.1. Characterization and Measurements
3.2. Synthesis Details
3.2.1. Synthesis of Gd(SONF)3(DME) (1)
3.2.2. Synthesis of Sc(SONF)3(DME) (2)
3.2.3. Synthesis of Nd(SONF)3(DME) (3)
3.2.4. Synthesis of Sm(SONF)3(DME) (4)
3.2.5. Synthesis of Eu(SONF)3(DME) (5)
3.2.6. Synthesis of Ho(SONF)3(DME) (6)
3.2.7. Synthesis of Er(SONF)3(DME) (7)
3.2.8. Synthesis of Yb(SONF)3(DME) (8)
3.3. X-Ray Single-Crystal Diffraction Analysis of H(SONF), 2, and 7
3.4. Computational Details
3.5. Time-Resolved Spectroscopy
4. Conclusions
Supplementary Materials
Author Contributions
Funding
Acknowledgments
Conflicts of Interest
References
- Kido, J.; Okamoto, Y. Organo Lanthanide Metal Complexes for Electroluminescent Materials. Chem. Rev. 2002, 102, 2357–2368. [Google Scholar] [CrossRef] [PubMed]
- de Bettencourt-Dias, A. Lanthanide-based emitting materials in light-emitting diodes. Dalton Trans. 2007, 22, 2229–2241. [Google Scholar] [CrossRef] [PubMed]
- Binnemans, K. Lanthanide-Based Luminescent Hybrid Materials. Chem. Rev. 2009, 109, 4283–4374. [Google Scholar] [CrossRef] [PubMed] [Green Version]
- Eliseeva, S.V.; Bünzli, J.-C.G. Lanthanide luminescence for functional materials and bio-sciences. Chem. Soc. Rev. 2010, 39, 189–227. [Google Scholar] [CrossRef] [PubMed]
- Bünzli, J.C.G.; Eliseeva, S.V. Lanthanide NIR luminescence for telecommunications, bioanalyses and solar energy conversion. J. Rare Earth. 2010, 28, 824–842. [Google Scholar] [CrossRef]
- Katkova, M.A.; Bochkarev, M.N. New trends in design of electroluminescent rare earth metallo-complexes for OLEDs. Dalton Trans. 2010, 39, 6599–6612. [Google Scholar] [CrossRef] [PubMed]
- Bochkarev, M.N.; Vitukhnovsky, A.G.; Katkova, M.A. Handbook of Organic Laight-emitting Diodes (OLED); Decom: Nyzhny, Novgorod, 2011; pp. 1–364. [Google Scholar]
- Tanner, P.A.; Duan, C.-K. Luminescent lanthanide complexes: selection rules and design. Coord. Chem. Rev. 2010, 254, 3026–3029. [Google Scholar] [CrossRef]
- Feng, J.; Zhang, H. Hybrid materials based on lanthanide organic complexes: a review. Chem. Soc. Rev. 2013, 42, 387–410. [Google Scholar] [CrossRef]
- Armelao, L.; Quici, S.; Barigelletti, F.; Accorsi, G.; Bottaro, G.; Cavazzini, M.; Tondello, E. Design of luminescent lanthanide complexes: From molecules to highly efficient photo-emitting materials. Coord. Chem. Rev. 2010, 254, 487–505. [Google Scholar] [CrossRef]
- Bünzli, J.-C.G.; Piguet, C. Taking Advantage of Luminescent Lanthanide Ions. Chem. Soc. Rev. 2005, 34, 1048–1077. [Google Scholar] [CrossRef]
- Wang, X.; Chang, H.; Xie, J.; Zhao, B.; Liu, B.; Xu, S.; Pei, W.; Ren, N.; Huang, L.; Huang, W. Recent developments in lanthanide-based luminescent probes. Coord. Chem. Rev. 2014, 273, 201–212. [Google Scholar] [CrossRef]
- Bünzli, J.-C.G. Benefiting from the Unique Properties of Lanthanide Ions. Acc. Chem. Res. 2006, 39, 53–61. [Google Scholar] [CrossRef] [PubMed]
- Reddy, M.L.P.; Sivakumar, S. Lanthanide benzoates: a versatile building block for the construction of efficient light emitting materials. Dalton Trans. 2013, 42, 2663–2678. [Google Scholar] [CrossRef] [PubMed]
- Moore, E.G.; Samuel, A.P.S.; Raymond, K.N. From Antenna to Assay: Lessons Learned in Lanthanide Luminescence. Acc. Chem. Res. 2009, 42, 542–552. [Google Scholar] [CrossRef] [PubMed] [Green Version]
- de Bettencourt-Dias, A.; Barber, P.S.; Viswanathan, S. Aromatic N-donor ligands as chelators and sensitizers of lanthanide ion emission. Coord. Chem. Rev. 2014, 273, 165–200. [Google Scholar] [CrossRef]
- Kazakov, D.V.; Safarov, F.E. A novel chemiluminescence from the reaction of singlet oxygen with β-diketonates of europium(III), neodymium(III) and ytterbium(III). Photochem. Photobiol. Sci. 2014, 13, 1646–1649. [Google Scholar] [CrossRef] [PubMed]
- Reddy, M.L.P.; Divya, V.; Pavithran, R. Visible-light sensitized luminescent europium(III)-β-diketonate complexes: bioprobes for cellular imaging. Dalton Trans. 2013, 42, 15249–15262. [Google Scholar] [CrossRef]
- Ma, Y.; Wang, Y. Recent advances in the sensitized luminescence of organic europium complexes. Coord. Chem. Rev. 2010, 254, 972–990. [Google Scholar] [CrossRef]
- Katkova, M.A.; Balashova, T.V.; Ilichev, V.A.; Konev, A.N.; Isachenkov, N.A.; Fukin, G.K.; Ketkov, S.Y.; Bochkarev, M.N. Synthesis, structures, and electroluminescent properties of scandium N,O-chelated complexes toward near-white Organic Light-Emitting Diodes. Inorg. Chem. 2010, 49, 5094–5100. [Google Scholar] [CrossRef]
- Katkova, M.A.; Pushkarev, A.P.; Balashova, T.V.; Konev, A.N.; Fukin, G.K.; Ketkov, S.Yu.; Bochkarev, M.N. Near-infrared electroluminescent lanthanide [Pr(III), Nd(III), Ho(III), Er(III), Tm(III), and Yb(III)] N,O-chelated complexes for organic light-emitting devices. J. Mater. Chem. 2011, 21, 16611–16620. [Google Scholar] [CrossRef]
- Comby, S.; Bünzli, J.-C.G. Lanthanide Near-Infrared Luminescence in Molecular Probes and Devices. In Handbook on the Physics and Chemistry of Rare Earths; Elsevier: Amsterdam, The Netherlands, 2007; Volume 37, pp. 217–470. [Google Scholar]
- Li, J.; Li, H.; Yan, P.; Chen, P.; Hou, G.; Li, G. Synthesis, crystal structure, and luminescent properties of 2-(2,2,2-Trifluoroethyl)-1-indone lanthanide complexes. Inorg. Chem. 2012, 51, 5050–5057. [Google Scholar] [CrossRef] [PubMed]
- Raj, D.B.A.; Biju, S.; Reddy, M.L.P. Highly luminescent europium(III) complexes containing organosilyl 4,4,5,5,5-pentafluoro-1-(naphthalen-2-yl)pentane-1,3-dionate ligands grafted on silica nanoparticles. J. Mater. Chem. 2009, 19, 7976–7983. [Google Scholar]
- Li, Z.; Dellali, A.; Malik, J.; Motevalli, M.; Nix, R.M.; Olukoya, T.; Peng, Y.; Ye, H.; Gillin, W.P.; Hernández, I.; et al. Luminescent Zinc(II) complexes of fluorinated benzothiazol-2-yl substituted phenoxide and enolate ligands. Inorg. Chem. 2013, 52, 1379–1387. [Google Scholar] [CrossRef] [PubMed]
- Stenson, P. The crystal structure of 2-(o-hydroxyphenyl) benzothiazole. Acta Chem. Scand. 1970, 24, 3729–3738. [Google Scholar] [CrossRef]
- Jia, A.-Q.; Jin, G.-X. Syntheses, characterization, and ethylene polymerization of titanium and zirconium complexes with [N, O] ligands. Dalton Trans. 2009, 8838–8845. [Google Scholar] [CrossRef] [PubMed]
- He, X.; Wu, Y.; Jin, W.; Wang, X.; Wu, C.; Shang, Y. Highly efficient AgNO3-catalyzed approach to 2-(benzo[d]azol-2-yl)phenols from salicylaldehydes with 2-aminothiophenol, 2-aminophenol and benzene-1,2-diamine. Appl. Organometal. Chem. 2018, 32, e4284. [Google Scholar] [CrossRef]
- Janiak, C. A critical account on π–π stacking in metal complexes with aromatic nitrogen-containing ligands. J. Chem. Soc 2000, 3885–3896. [Google Scholar] [CrossRef]
- Balashova, T.V.; Pushkarev, A.P.; Rumyantcev, R.V.; Fukin, G.K.; Grishin, I.D.; Bochkarev, M.N. Heteroleptic 3-(2-benzothiazol-2-yl)-2-naphtholates of rare earth metals: Features of synthesis and structure. J. Organomet. Chem. 2015, 777, 42–49. [Google Scholar] [CrossRef]
- Rumyantcev, R.V.; Fukin, G.K. Intramolecular C—F→Ln dative interactions in lanthanide complexes with fluorinated ligands. Russ. Chem. Bull. Int. Ed. 2017, 66, 1557–1562. [Google Scholar] [CrossRef]
- Blatov, V.A.; Shevchenko, A.P.; Proserpio, D.M. Applied Topological Analysis of Crystal Structures with the Program Package ToposProCryst. Growth Des. 2014, 14, 3576–3586. [Google Scholar] [CrossRef]
- Balashova, T.V.; Belova, N.A.; Burin, M.E.; Kuzyaev, D.M.; Rumyantcev, R.V.; Fukin, G.K.; Pushkarev, A.P.; Ilichev, V.A.; Shestakov, A.F.; Grishin, I.D.; et al. Substituted naphtholates of rare earth metals as emissive materials. RSC Advances. 2014, 4, 35505–35510. [Google Scholar] [CrossRef]
- Balashova, T.V.; Pushkarev, A.P.; Ilichev, V.A.; Lopatin, M.A.; Katkova, M.A.; Baranov, E.V.; Fukin, G.K.; Bochkarev, M.N. Lanthanide phenolates with heterocyclic substituents. Synthesis, structure and luminescent properties. Polyhedron 2013, 50, 112–120. [Google Scholar] [CrossRef]
- Burin, M.E.; Balashova, T.V.; Vorozhtsov, D.L.; Pushkarev, A.P.; Samsonov, M.A.; Fukin, G.K.; Bochkarev, M.N. Ate complexes of lanthanides with aryloxide ligands: Synthesis, structures, and luminescence properties. Russ. J. Coord. Chem. 2013, 39, 667–679. [Google Scholar] [CrossRef]
- Shannon, R.D. Revised effective ionic radii and systematic studies of interatomic distances in halides and chalcogenides. Acta Cryst. 1976, 32, 751–767. [Google Scholar] [CrossRef]
- Batsanov, S.S. Van der Waals Radii of Elements. Inorg. Mater. 2001, 37, 871–885. [Google Scholar] [CrossRef]
- Henary, M.M.; Fahrni, C.J. Excited State Intramolecular Proton Transfer and Metal Ion Complexation of 2-(2‘-Hydroxyphenyl)benzazoles in Aqueous Solution. J. Phys. Chem. A 2002, 106, 5210–5220. [Google Scholar] [CrossRef]
- Roh, S.-G.; Kim, Y.-H.; Seo, K.D.; Lee, D.H.; Kim, H.K.; Park, Y.-I.; Park, J.-W.; Lee, J.-H. Synthesis, Photophysical, and Electroluminescent Device Properties of Zn(II)-Chelated Complexes Based on Functionalized Benzothiazole Derivatives. Adv. Funct. Mater. 2009, 19, 1663–1671. [Google Scholar] [CrossRef]
- Pushkarev, A.P.; Yablonskiy, A.N.; Yunin, P.A.; Burin, M.E.; Andreev, B.A.; Bochkarev, M.N. Features of spectral properties of Sm3+ complexes with dithia-and diselenophosphinate ligands. Spectrochim. Acta Part A Mol. Diomol. Spectrosc. 2016, 163, 134–139. [Google Scholar] [CrossRef]
- Jayasankar, C.K.; Rukmini, E. Optical properties of Sm3+ ions in zinc and alkali zinc borosulphate glasses. Opt. Mater. 1997, 8, 193–205. [Google Scholar] [CrossRef]
- Jayasankar, C.K.; Babu, P. Optical properties of Sm3+ ions in lithium borate and lithium fluoroborate glasses. J. Alloy. Compd. 2000, 307, 82–95. [Google Scholar] [CrossRef]
- Walsh, B.M. Judd-Ofelt theory: principles and practices. In Advances in Spectroscopy for Lasers and Sensing; Di Bartolo, B., Forte, O., Eds.; Springer: Dordrecht, The Netherlands, 2006. [Google Scholar]
- Kalyakina, A.S.; Sokolova, E.Y.; Vaschenko, A.A.; Lepnev, L.S.; Utochnikova, V.V.; Kuzmina, N.P. High Efficiency Organic Light-Emitting Diode Based on UV Stable Terbium Aromatic Carboxylates. Proc. SID Mid-Eur. Chapter Spring Meet. 2013, 1, 19–20. [Google Scholar]
- Trivedi, E.R.; Eliseeva, S.V.; Jankolovits, J.; Olmstead, M.M.; Petoud, S.; Pecoraro, V.L. Highly emitting near-infrared lanthanide “encapsulated sandwich” metallacrown complexes with excitation shifted toward lower energy. J. Am. Chem. Soc. 2014, 136, 1526–1534. [Google Scholar] [CrossRef] [PubMed]
- Kumar, G.A.; Riman, R.E.; Diaz Torres, L.A.; Banerjee, S.; Romanelli, M.D.; Emge, T.J.; Brennan, J.G. Near-Infrared Optical Characteristics of Chalcogenide-Bound Nd3+ Molecules and Clusters. Chem. Mater. 2007, 19, 2937–2946. [Google Scholar] [CrossRef]
- Natrajan, L.S.; Timmins, P.L.; Lunn, M.; Heath, S.L. Luminescent Dinuclear Lanthanide Complexes of 5-Me-HXTA. Inorg. Chem. 2007, 46, 10877–10886. [Google Scholar] [CrossRef] [PubMed]
- Pushkarev, A.P.; Ilichev, V.A.; Balashova, T.V.; Vorozhtsov, D.L.; Burin, M.E.; Kuzyaev, D.M.; Fukin, G.K.; Andreev, B.A.; Kryzhkov, D.I.; Yablonskiy, A.N.; et al. Lanthanide complexes with substituted naphtholate ligands: extraordinary bright near infrared luminescence of ytterbium. Russ. Chem. Bull. Int. Ed. 2013, 62, 392–397. [Google Scholar] [CrossRef]
- Hernandez, I.; Gillin, W.P. Organic Chromophores-Based Sensitization of NIR-Emitting Lanthanides. In Handbook on the Physics and Chemistry of Rare Earths; Elsevier: Amsterdam, The Netherlands, 2015; Volume 47, pp. 1–100. [Google Scholar]
- Ilichev, V.A.; Silantieva, L.I.; Yablonskiy, A.N.; Andreev, B.A.; Rumyantcev, R.V.; Fukin, G.K.; Bochkarev, M.N. Synthesis, structure and long-lived NIR luminescence of lanthanide ate complexes with perfluorinated 2-mercaptobenzothiazole. Dalton Trans. 2019, 48, 1060–1066. [Google Scholar] [CrossRef] [PubMed]
- Winkless, L.; Tan, R.H.C.; Zheng, Y.; Motevalli, M.; Wyatt, P.B.; Gillinet, W.P. Quenching of Er(III) luminescence by ligand C-H vibrations: Implications for the use of erbium complexes in telecommunications. Appl. Phys. Lett. 2006, 89, 111115. [Google Scholar] [CrossRef]
- Shi, J.; Hou, Y.; Chu, W.; Shi, X.; Gu, H.; Wang, B.; Sun, Z. Crystal structure and highly luminescent properties studies of bis-β-diketonate lanthanide complexes. Inorg. Chem. 2013, 52, 5013–5022. [Google Scholar] [CrossRef]
- Bischof, C.; Wahsner, J.; Scholten, J.; Trosien, S.; Seitz, M. Quantification of C−H quenching in near-IR luminescent ytterbium and neodymium cryptates. J. Am. Chem. Soc. 2010, 132, 14334–14335. [Google Scholar] [CrossRef]
- Bradley, D.C.; Chotra, J.S.; Hart, F.A. Low co-ordination numbers in lanthanide and actinide compounds. Part I. The preparation and characterization of tris{bis(trimethylsilyl)-amido}lanthanides. J. Chem. Soc. Dalton Trans 1973, 1021–1023. [Google Scholar] [CrossRef]
- Magde, D.; Wong, R.; Seybold, P.G. Fluorescence quantum yields and their relation to lifetimes of rhodamine 6G and fluorescein in nine solvents: Improved absolute standards for quantum yields. Photochem. Photobiol. 2002, 75, 327–334. [Google Scholar] [CrossRef]
- Demas, J.N.; Crosby, G.A. Measurement of photoluminescence quantum yields. Review. J. Phys. Chem. 1971, 75, 991–1024. [Google Scholar]
- Data Collection, Reduction and Correction Program; CrysAlisPro – Software Package; Agilent Technologies: Santa Clara, CA, USA, 2012.
- SAINTPlus Data Reduction and Correction Program, version 6.45a; Bruker AXS: Madison, WI, USA, 2003.
- Sheldrick, G.M. Crystal structure refinement with SHELXL. Acta crystallogr, Sect. C Struct. Chem. 2015, 71, 3–8. [Google Scholar] [CrossRef] [PubMed]
- Sheldrick, G.M. SHELXT – Integrated space-group and crystal-structure determination. Acta crystallogr. Sect. A: Found. Adv. 2015, 71, 3–8. [Google Scholar] [CrossRef] [PubMed]
- SCALE3 ABSPACK: Empirical absorption correction; CrysAlisPro – Software Package; Agilent Technologies: Santa Clara, CA, USA, 2012.
- Krause, L.; Herbst-Irmer, R.; Sheldrick, G.M.; Stalke, D. Comparison of silver and molybdenum microfocus X-ray sources for single-crystal structure determination. J. Appl. Cryst. 2015, 48, 3–10. [Google Scholar] [CrossRef] [PubMed] [Green Version]
- Frisch, M.J.; Trucks, G.W.; Schlegel, H.B.; Scuseria, G.E.; Robb, M.A.; Cheeseman, J.R.; Scalmani, G.; Barone, V.; Mennucci, B.; Petersson, G.A.; et al. Gaussian 09, Revision E.01; Gaussian, Inc.: Wallingford, CT, USA, 2013. [Google Scholar]
- Chemcraft. Available online: http://www.chemcraftprog.com (accessed on 7 August 2015).
Sample Availability: Not available. |


| 4G5/2→2S+1LJ | λ (nm) | SED (×10−23 cm2) | AED (s−1) | SMD (×10−23 cm2) | AMD (s−1) | AΣ (s−1) | β (%) |
|---|---|---|---|---|---|---|---|
| 6F5/2 | 958 | 16.3 | 5.56 | 6.62 | 2.48 | 8.04 | 5.65 |
| 6F3/2 | 933 | 2.2 | 0.81 | 8.46 | 3.44 | 4.25 | 2.99 |
| 6H13/2 | 795 | 4.5 | 2.69 | 0 | 0 | 2.69 | 1.89 |
| 6H11/2 | 706 | 14.4 | 12.28 | 0 | 0 | 12.28 | 8.63 |
| 6H9/2 | 650 | 37.2 | 40.73 | 0 | 0 | 40.73 | 28.63 |
| 6H7/2 | 605 | 36.2 | 49.04 | 5.81 | 8.66 | 57.70 | 40.56 |
| 6H5/2 | 568 | 1.62 | 2.65 | 5.73 | 10.32 | 12.97 | 9.12 |
| Complex | H(SONF) | 2 | 7 |
|---|---|---|---|
| Empirical formula | C13HF8NOS | C43H10F24N3O5S3Sc | C43H16F24N3O7S3Er |
| Formula weight | 371.21 | 1245.68 | 1406.03 |
| T (K) | 100(2) | 100(2) | 100(2) |
| Crystal system | Monoclinic | Triclinic | Triclinic |
| Space group | Cc | P-1 | P-1 |
| Unit cell dimensions | |||
| a (Å) | 9.4594(3) | 11.1909(5) | 12.0137(7) |
| b (Å) | 12.5014(4) | 14.0354(6) | 12.1785(7) |
| c (Å) | 20.1166(6) | 15.0479(7) | 16.3474(9) |
| α (°) | 90 | 99.295(4) | 84.9199(15) |
| β (°) | 93.6280(10) | 109.580(4) | 88.0365(14) |
| γ (°) | 90 | 94.136(4) | 72.0830(13) |
| V (Å3) | 2374.14(13) | 2177.28(19) | 2266.8(2) |
| Z | 8 | 2 | 2 |
| Dcalc. (g⋅cm−3) | 2.077 | 1.900 | 2.060 |
| Absorption coefficient, μ (mm−1) | 0.386 | 0.470 | 2.146 |
| F (000) | 1456 | 1228 | 1366 |
| Crystal size (mm3) | 0.50 × 0.50 × 0.50 | 0.30 × 0.25 × 0.03 | 0.16 × 0.13 × 0.04 |
| Range for data collection, θ (°) | 2.029–32.000 | 2.931–25.000 | 2.502–30.034 |
| Limiting indices | −14 ≤ h ≤ 14 −18 ≤ k ≤ 18 −29 ≤ l ≤ 29 | −13 ≤ h ≤ 13 −16 ≤ k ≤ 16 −17 ≤ l ≤ 17 | −16 ≤ h ≤ 16 −17 ≤ k ≤ 17 −23 ≤ l ≤ 23 |
| Reflections collected/unique | 17441/8202 | 21419/7655 | 32615/13211 |
| R(int) | 0.0199 | 0.0497 | 0.0504 |
| Completeness (to θ) | 99.9% (25.242) | 99.6% (25.000) | 99.8% (25.242) |
| Data/restraints/parameters | 8202/184/591 | 7655/0/714 | 13211/13/750 |
| Goodness-of-fit (GOF) on F2 | 1.024 | 1.020 | 1.031 |
| Final R indices [I > 2σ(I)] | R1 = 0.0283 wR2 = 0.0755 | R1 = 0.0716 wR2 = 0.1652 | R1 = 0.0387 wR2 = 0.0708 |
| R indices (all data) | R1 = 0.0305 wR2 = 0.0767 | R1 = 0.1151 wR2 = 0.1827 | R1 = 0.0555 wR2 = 0.0750 |
| Largest diff. peak/hole (e Å−3) | 0.478/−0.349 | 1.109/−0.451 | 1.859/−1.262 |
© 2019 by the authors. Licensee MDPI, Basel, Switzerland. This article is an open access article distributed under the terms and conditions of the Creative Commons Attribution (CC BY) license (http://creativecommons.org/licenses/by/4.0/).
Share and Cite
Balashova, T.V.; Burin, M.E.; Ilichev, V.A.; Starikova, A.A.; Marugin, A.V.; Rumyantcev, R.V.; Fukin, G.K.; Yablonskiy, A.N.; Andreev, B.A.; Bochkarev, M.N. Features of the Molecular Structure and Luminescence of Rare-Earth Metal Complexes with Perfluorinated (Benzothiazolyl)phenolate Ligands. Molecules 2019, 24, 2376. https://doi.org/10.3390/molecules24132376
Balashova TV, Burin ME, Ilichev VA, Starikova AA, Marugin AV, Rumyantcev RV, Fukin GK, Yablonskiy AN, Andreev BA, Bochkarev MN. Features of the Molecular Structure and Luminescence of Rare-Earth Metal Complexes with Perfluorinated (Benzothiazolyl)phenolate Ligands. Molecules. 2019; 24(13):2376. https://doi.org/10.3390/molecules24132376
Chicago/Turabian StyleBalashova, Tatyana V., Mikhail E. Burin, Vasily A. Ilichev, Alyona A. Starikova, Alexey V. Marugin, Roman V. Rumyantcev, Georgy K. Fukin, Artem N. Yablonskiy, Boris A. Andreev, and Mikhail N. Bochkarev. 2019. "Features of the Molecular Structure and Luminescence of Rare-Earth Metal Complexes with Perfluorinated (Benzothiazolyl)phenolate Ligands" Molecules 24, no. 13: 2376. https://doi.org/10.3390/molecules24132376