1. Introduction
Ginsenosides are classified into two types according to their hydroxylation position on the core triterpene saponin structure: 20(
S)-protopanaxadiol (PPD) and 20(
S)-protopanaxatriol (PPT) [
1]. These ginsenosides are considered to be the major active pharmacological constituents of ginseng [
2,
3]. Several studies have described the immunological, antioxidant, anticoagulant, anti-neoplastic, neuroprotective, and hepatoprotective effects of ginseng and its associated ginsenosides [
3,
4,
5,
6,
7,
8]. The content and types of ginsenosides vary depending on the preparation method of ginseng product such as steaming times, temperature, and the extraction method [
9,
10]. For example, ginsenosides Rg1 and Re decreased, but ginsenosides Rb1, Rb2, Rc, Rd, and Rg3 increased after several hours of steaming and extraction. As results, the ratio of PPD-type to PPT-type ginsenoside of Korean red ginseng extract was higher than that of Korean ginseng [
10]. Ginsenosides generally have low intestinal permeability in Caco-2 cells and low oral bioavailability in rats [
1]. For example, the oral bioavailability of Rb1 and Rh2 is around 1.18–4.35 % and 4.0–6.4%, respectively. Other ginsenosides such as Rg1, Rd, Rh1, and Re have a low oral bioavailability, of less than 10% [
1]. Owing to the low oral bioavailability of these ginsenosides, their plasma concentration is also low. The maximum plasma concentration of Rb1, Rb2, Rc, and Rd, major ginsenosides found in rat plasma, was lower than 10 ng/mL in rats following oral administration of red ginseng extract at a dose of 1.5 g/kg [
8,
11]
Because of the low plasma concentration of ginsenosides, the analysis of ginsenosides in human plasma following oral administration of ginseng product has been limited to the selected ginsenoside. Moreover, analytical methods have also been limited to liquid chromatography–tandem mass spectrometry (LC-MS/MS) rather than high-performance liquid chromatography (HPLC) with UV or fluorescence detection [
12]. In human study, there are some reports on the analysis of ginsenosides but they used large volume of plasma or provided limited concentrations on ginsenosides because of the high lower limit of quantitation (LLOQ). For example, the plasma concentration of Rb1 and CK following single oral administration of 10 g of American ginseng powder was investigated. In this study, Rb1 and CK in 0.7 mL of plasma samples were extracted using a solid-phase extraction procedure and detected by time-of-flight mass spectrometry coupled with ultra-high pressure liquid chromatography [
13]. Another study developed a simultaneous analysis method for Rb1 and Rg1 in human plasma by LC-MS/MS. In this study, for the analysis of Rb1 and Rg1, 100 μL of human plasma was subjected to protein precipitation and analyzed with a calibration curve range of 10–1000 ng/mL [
14]. The ginsenoside Rb1 was detected but Rg1 was not detected. This could be attributed to the low plasma concentration of Rg1 after oral administration of the ginseng product (1.5 g/day) [
14].
Recently, more sensitive analytical methods have been developed. Choi et al. reported the plasma concentrations of Rb1 and CK in human plasma following single oral administration of 3 g of fermented red ginseng extract with a calibration curve range of 1–1000 ng/mL [
15]. In another study, ginsenoside PPD was analyzed after a single oral administration of a PPD 25 mg capsule with a calibration curve range of 0.1–100 ng/mL [
16]. Ginsenoside Re was analyzed after a single oral administration of a Re 200 mg tablet with a calibration curve range of 0.5–200 ng/mL. The metabolite peaks of Rg1, Rg2, F1, Rh1, and PPT in human plasma and urine were also monitored following oral administration of Re tablet (200 mg) without quantification [
12]. Our group simultaneously determined the plasma concentrations of the ginsenosides Rb1, Rb2, Rc, Rd, and CK in human subjects following single and 2-week repeated administration of three pouches of red ginseng product with a calibration curve range of 0.5–200 ng/mL [
17].
However, minor ginsenosides or metabolites of ginsenosides may also have beneficial pharmacological effects and, therefore, the pharmacokinetic properties of minor components and metabolites should also be measured. In rats, following single or repeated oral administration of high doses of ginseng extract (2–8 g/kg), various ginsenosides such as Ra3, Rb1, Rd, CK, Re, and Rg1 could be detected in the plasma of rats by LC-MS/MS with calibration curves ranging from 1.37 or 12.3 ng/mL to 3000 ng/mL [
18]. These results suggest that sensitive analytical methods could be useful for the detection of various ginsenosides in human plasma.
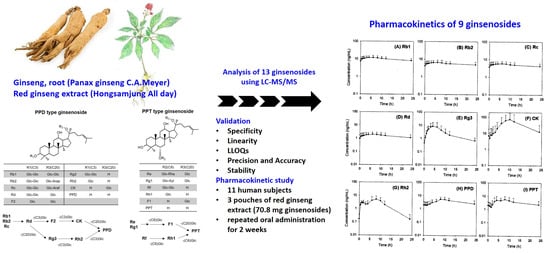
Therefore, the objective of this study was to develop an analytical method for the detection of various ginsenosides in human plasma and to apply this validated method to pharmacokinetic studies after multiple administration of red ginseng extract (three pouches/day for two weeks) in human subjects. We analyzed 13 ginsenosides (Rb1, Rb2, Rc, Rd, Re, Rf, Rg1, Rg3, Rh2, F1, CK, PPD, and PPT), which are ginsenosdies found in red ginseng extract and their biological metabolites that could be transformed by intestinal microbiota (
Figure 1).
3. Discussion
Despite the therapeutic benefits of various ginsenosides, which include anti-cancer, anti-diabetic, anti-oxidative, and immune-stimulating effects [
3,
4,
5,
6,
7,
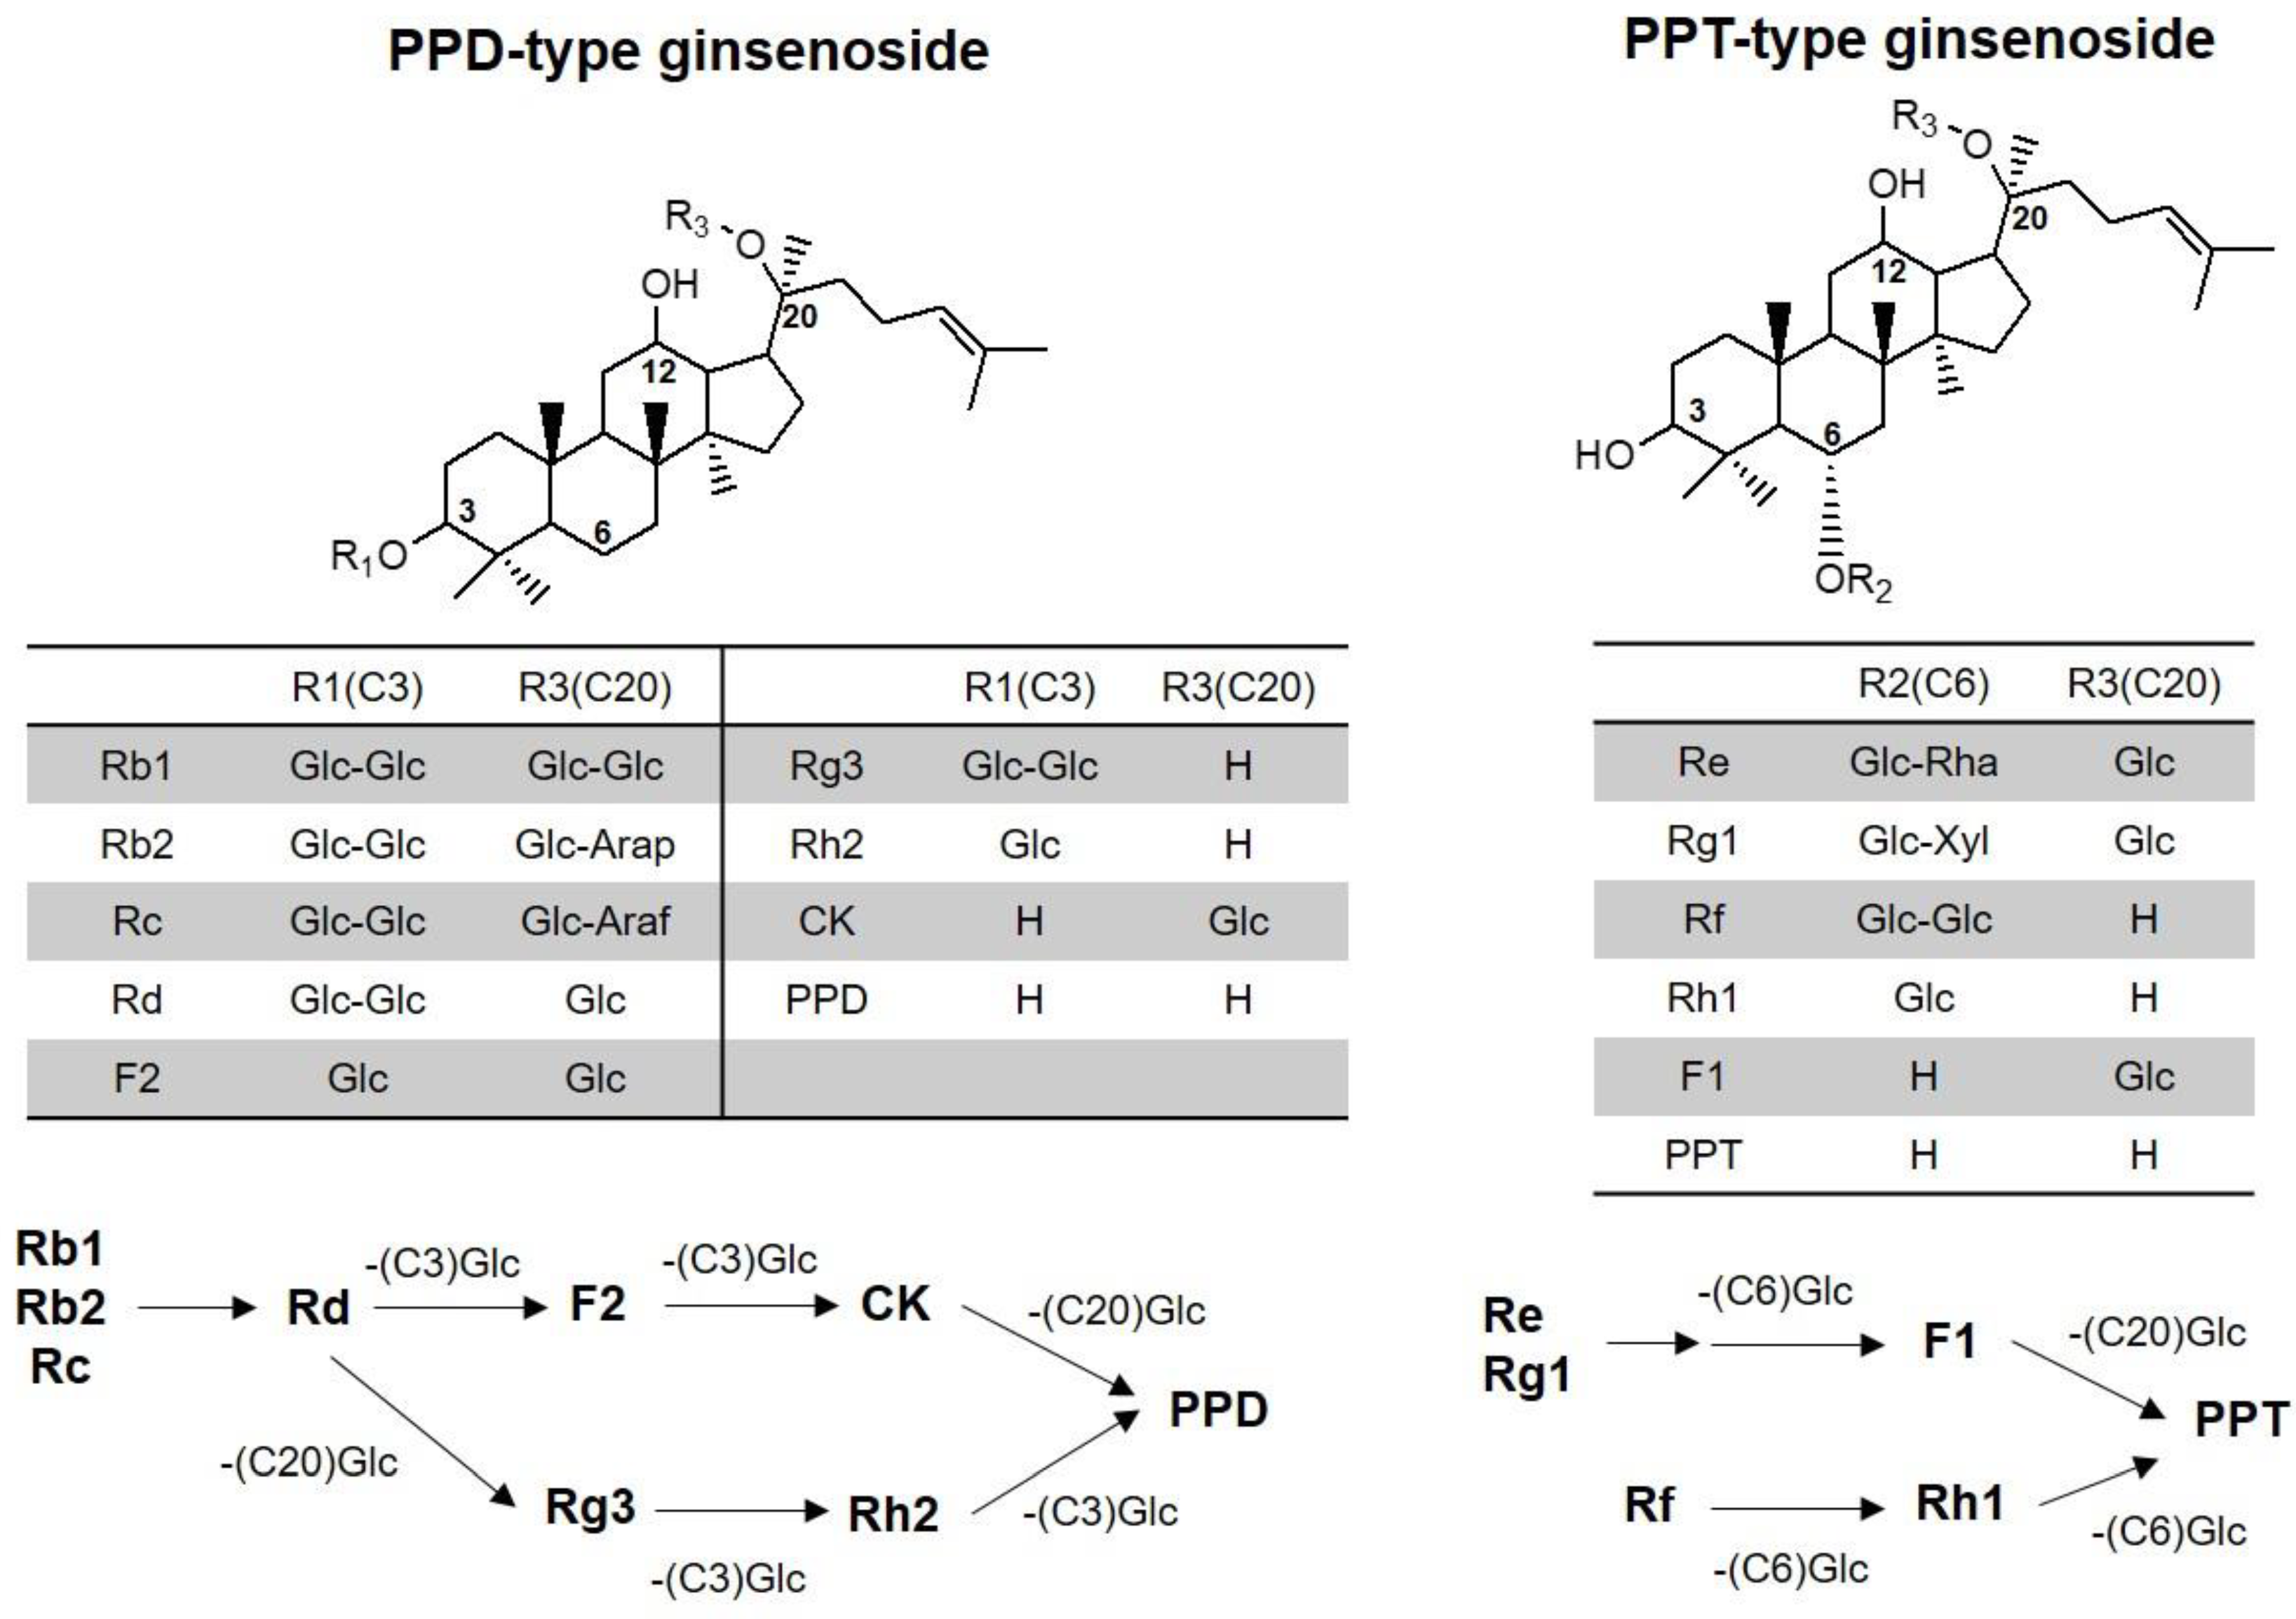
8], the plasma concentration of these ginsenosides and their pharmacokinetic-pharmacodynamic relationship need to be further investigated. As its first step, analytical methods for various ginsenosides and pharmacokinetic profile of these ginsenosides are critical. We developed an analytical method for 13 ginsenosides (Rb1, Rb2, Rc, Rd, Re, Rf, Rg1, Rg3, and F1, Rh2, CK, PPD, and PPT) using a LC-MS/MS system, which had high sensitivity (i.e., the LLOQ of all ginsenosides was 0.5 ng/mL) and required a small plasma sample volume (100 μL). The glycosylation number of the ginsenosides was different: tetraglycosylated ginsenosides for Rb1, Rb2, and Rc; triglycosylated ginsenosides for Rd, Re, and Rg1; diglycosylated ginsenosides for F2, Rg3, and Rf; monoglycosylated ginsenosides for Rh2, CK, Rh1, and F1; aglycones for PPD and PPT (
Figure 1). Because of different extraction efficiencies, di-, tri-, and tetraglycosylated ginsenosides were extracted by protein precipitation, and aglycones were extracted by LLE. Monoglycosylated ginsenosides could be extracted using both methods; however, CK and Rh2 were extracted by LLE, and F1 was extracted by protein precipitation based on the extraction recovery and matrix effect.
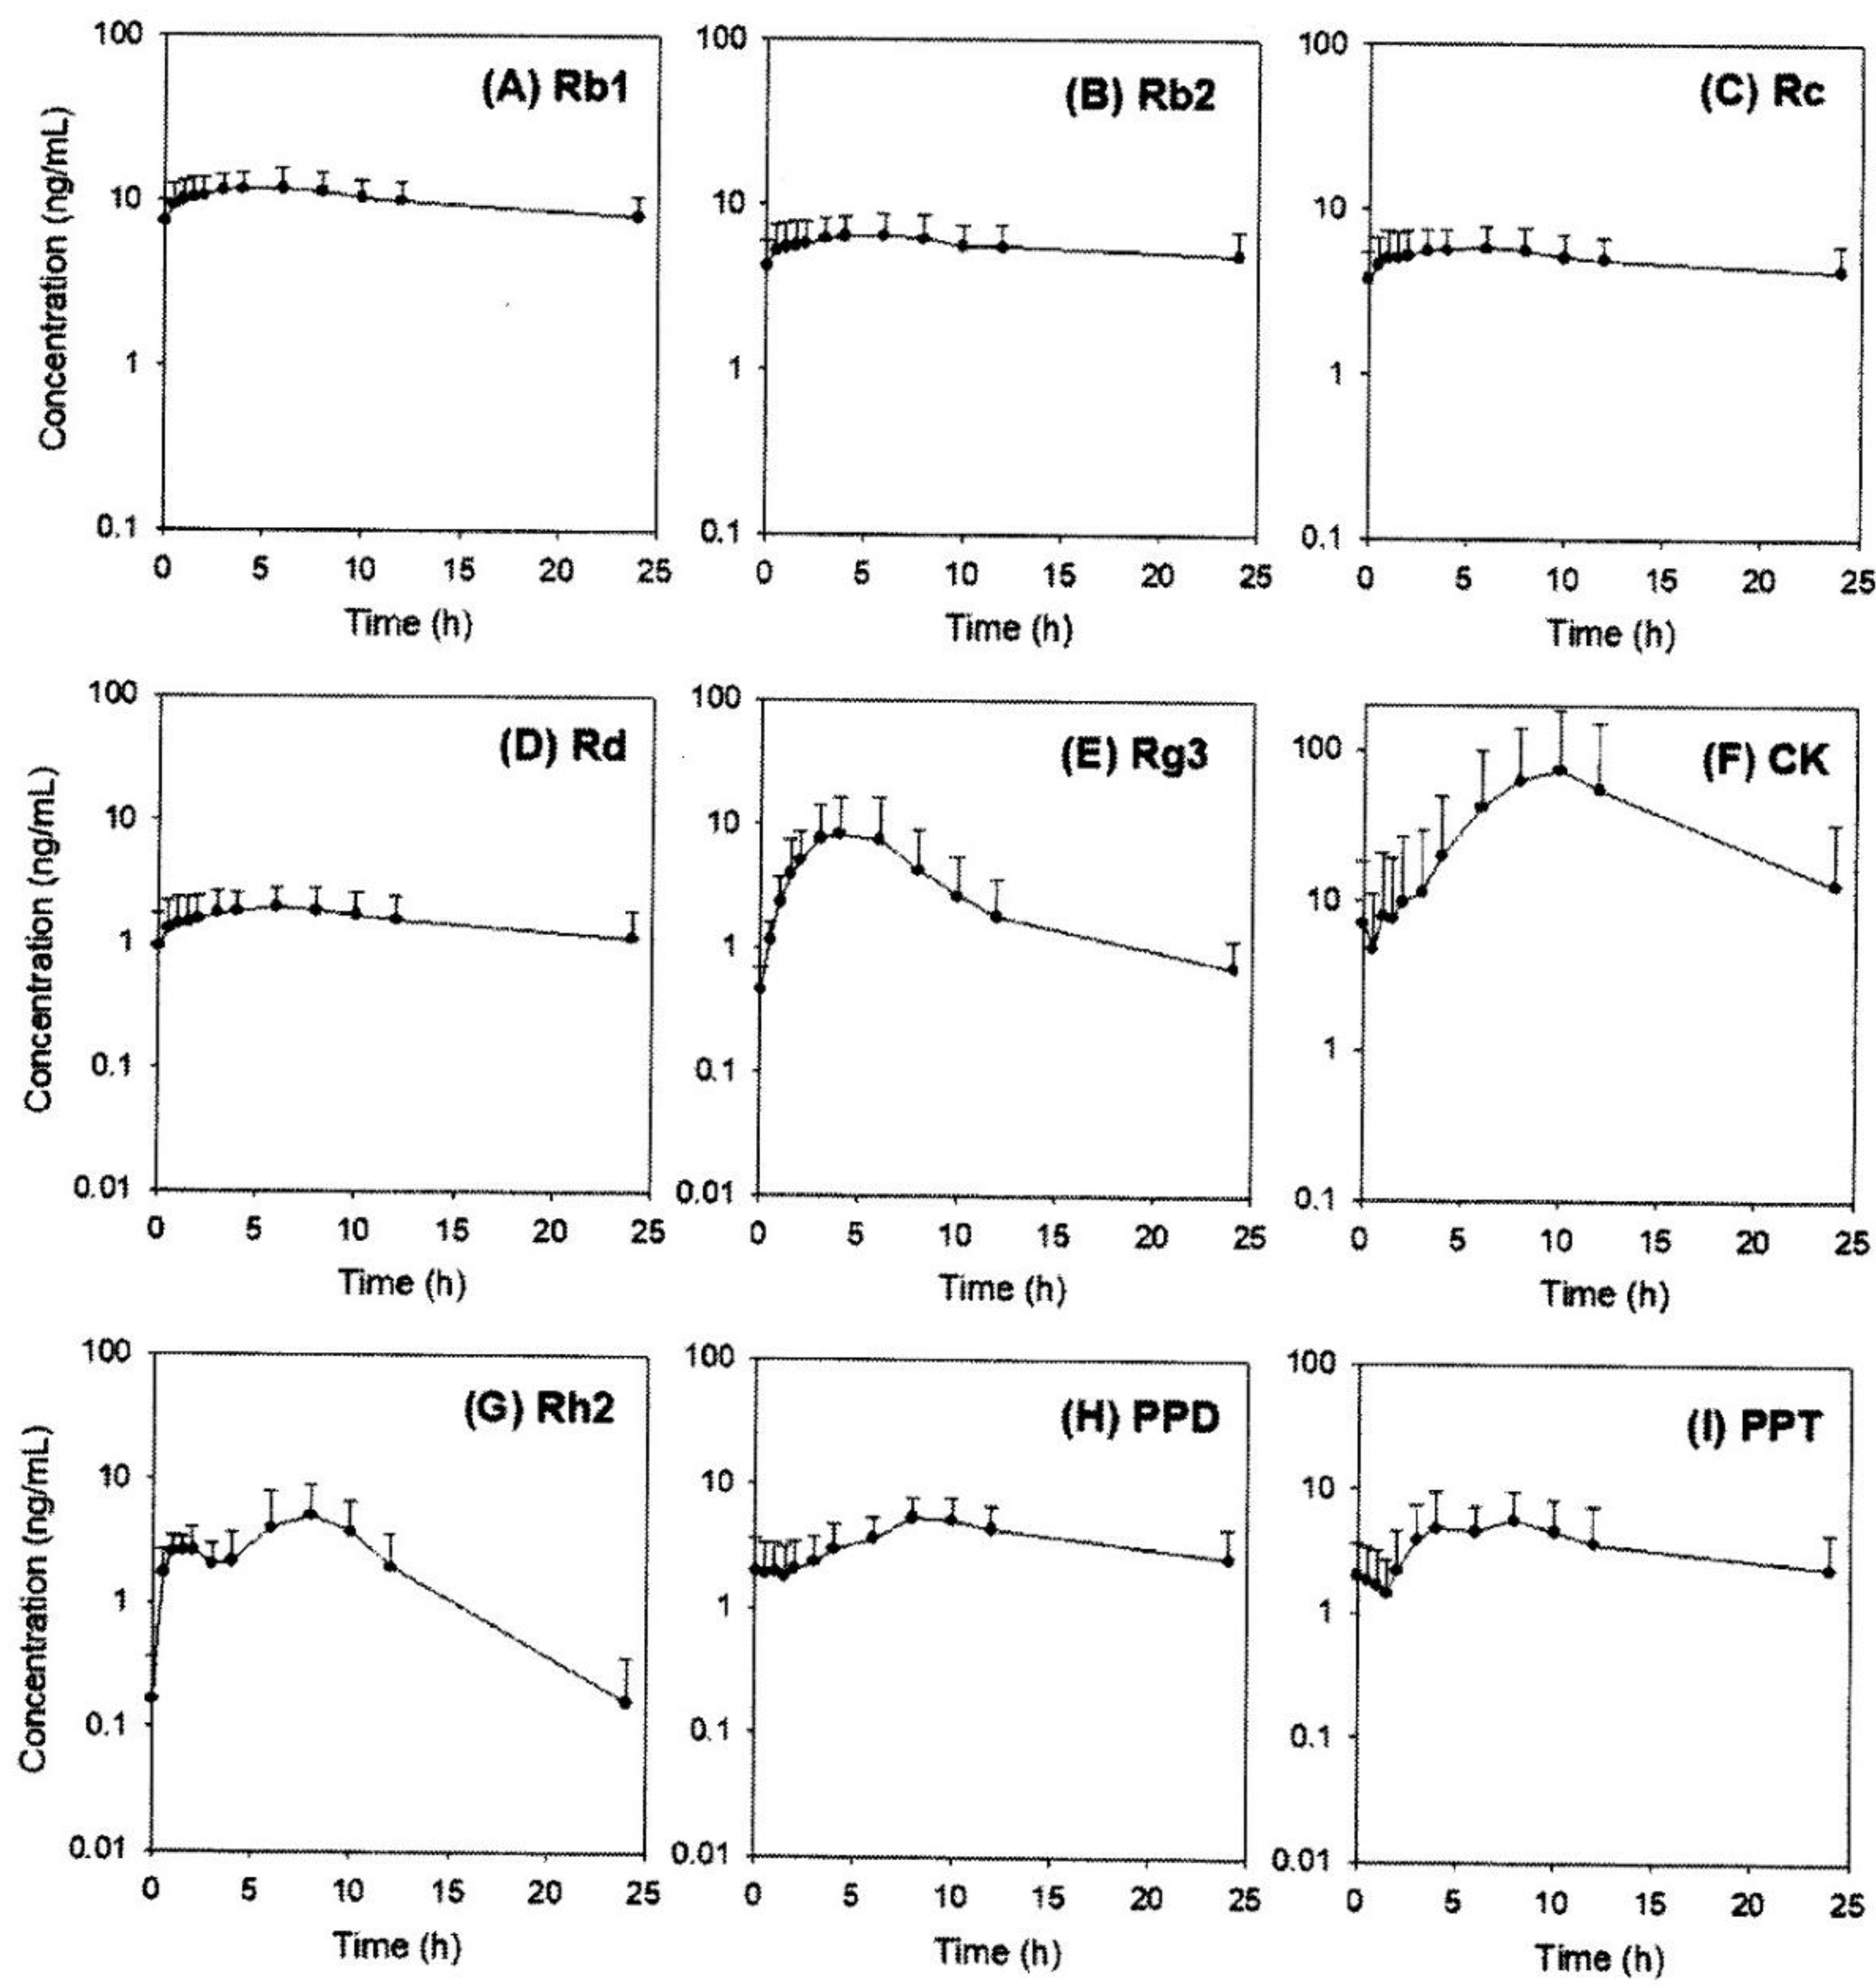
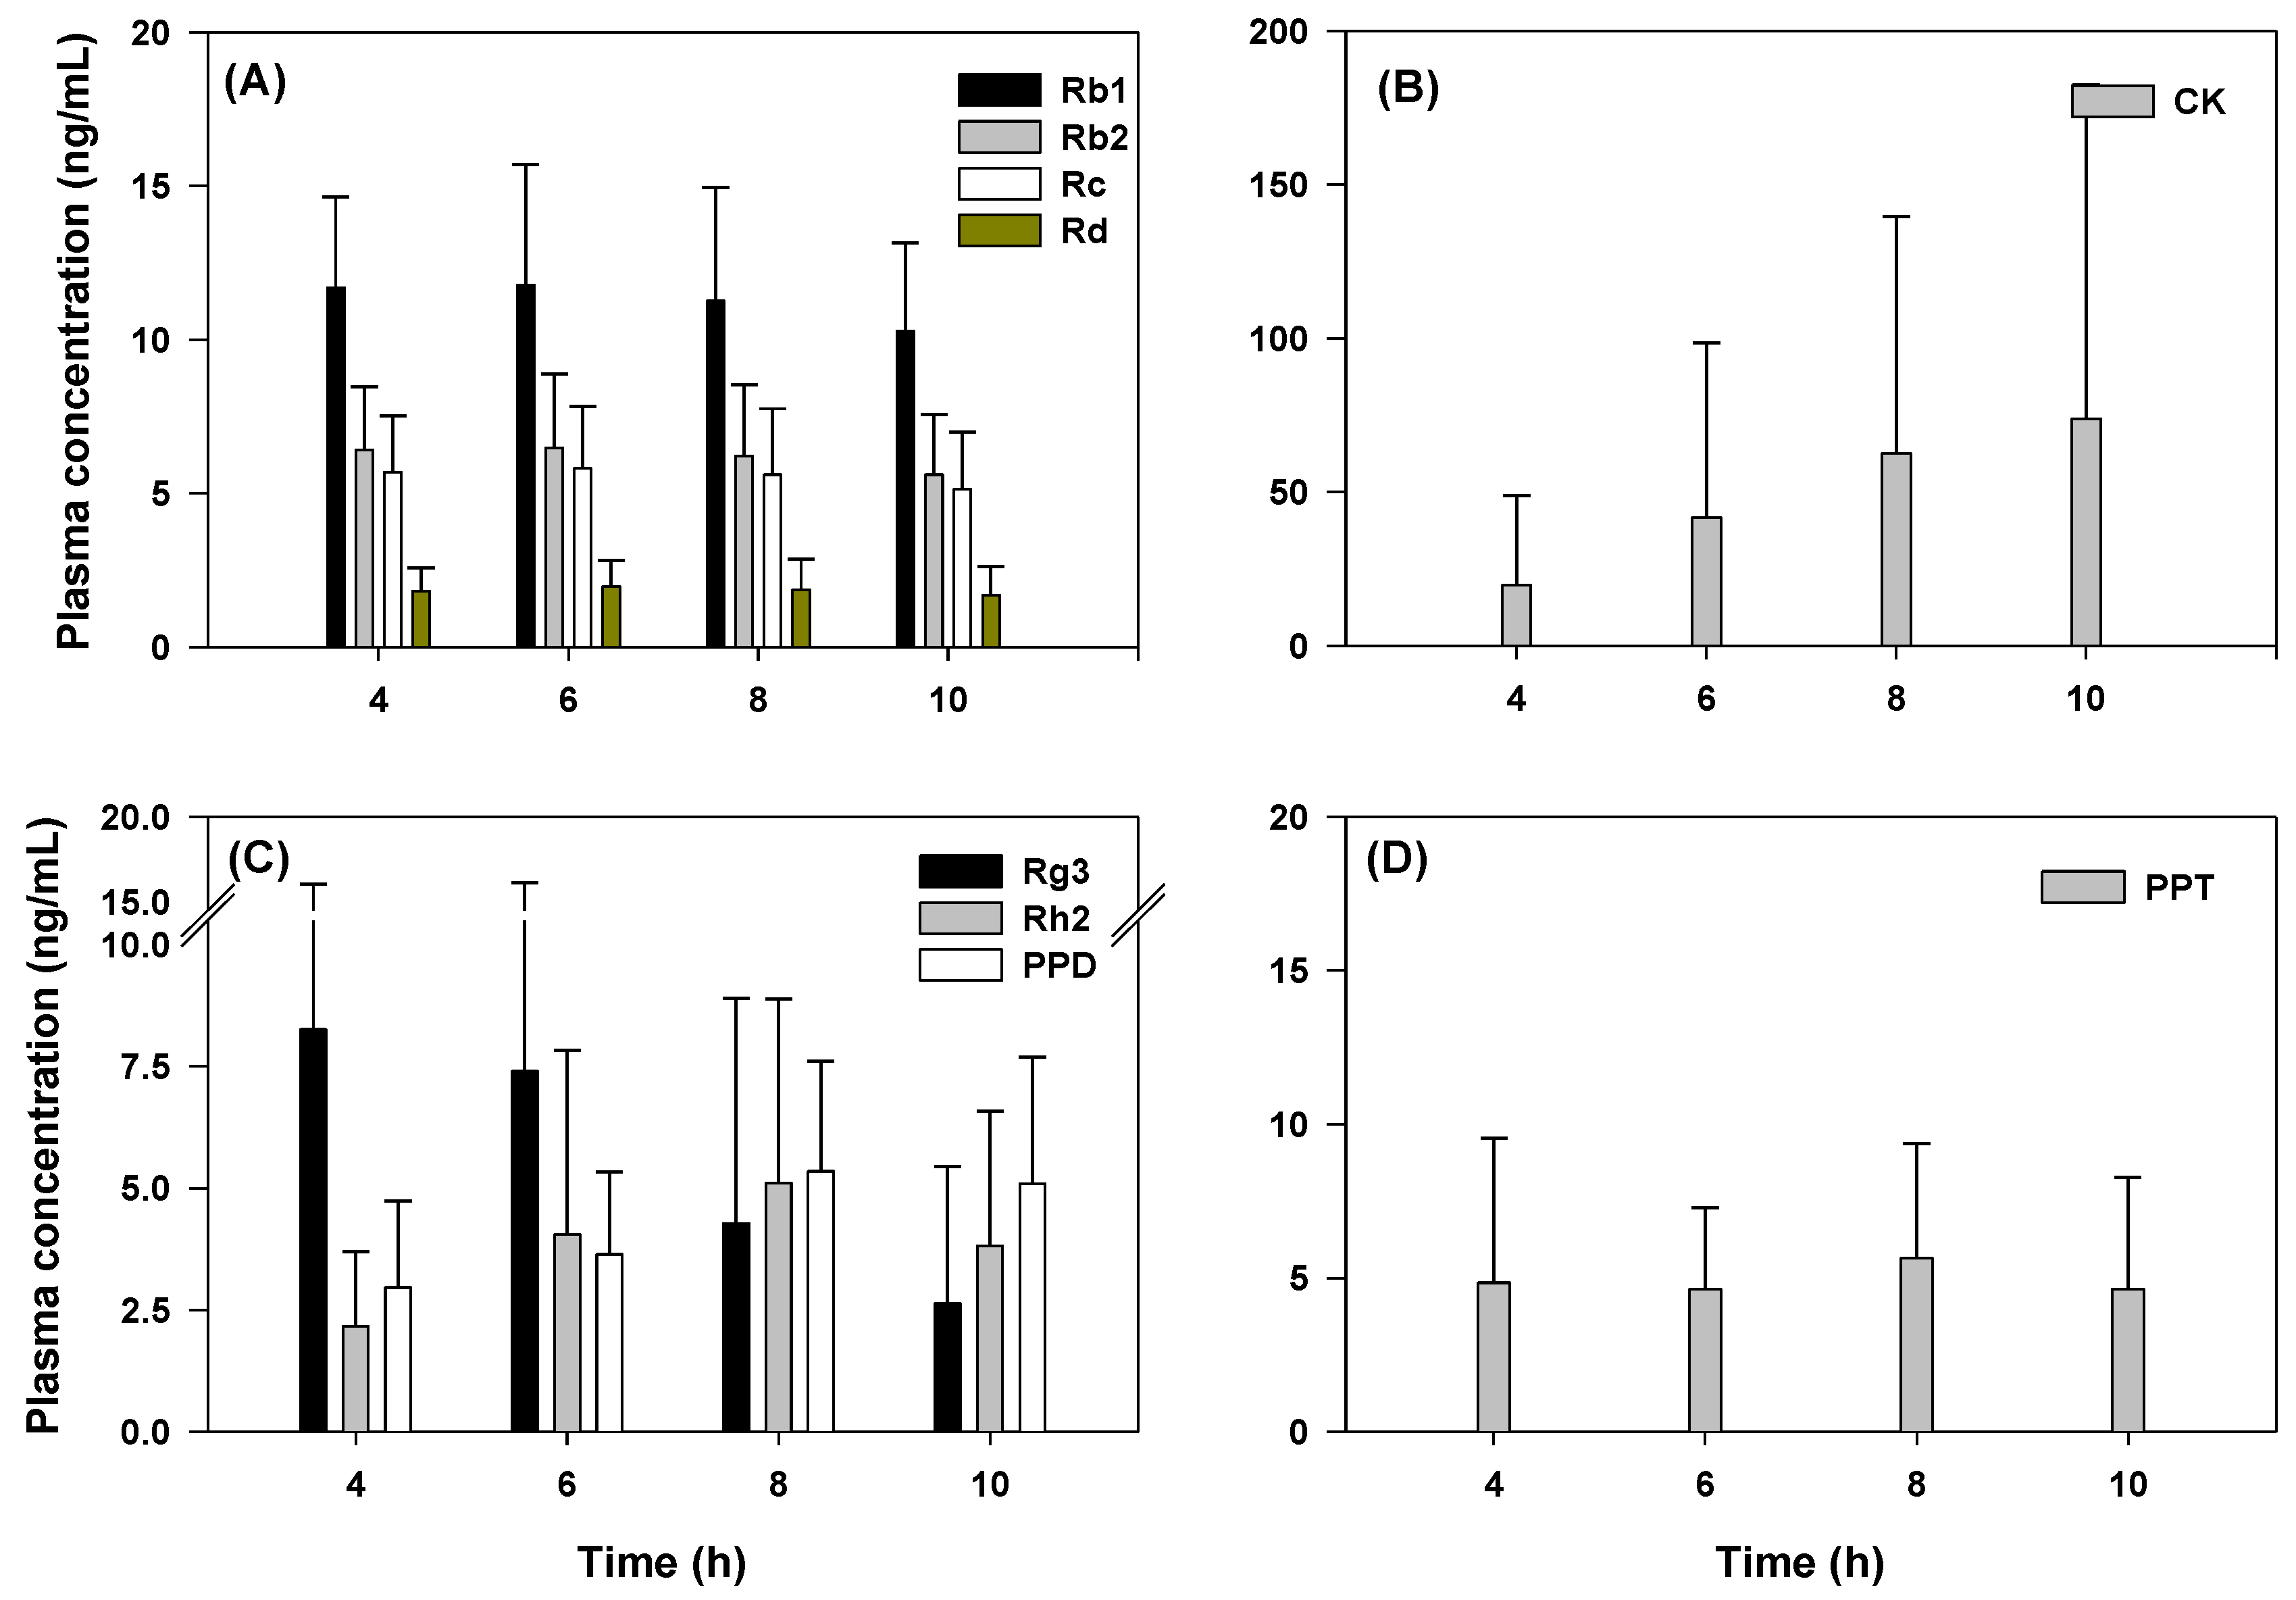
We further validated our sensitive analytical method by performing a pharmacokinetic study after the oral administration of red ginseng extract (three pouches of red ginseng extract), which has demonstrated tolerability for two weeks of repeated administration [
17]. We successfully measured the plasma concentration of Rb1, Rb2, Rc, Rd, Rg3, Rh2, CK, PPD, and PPT. Except for PPT, detectable ginsenosides were all PPD-type ginsenosides and their deglycosylated metabolites. Interestingly, the plasma AUC values of three glycosylated ginsenosides (Rb1, Rb2, and Rc) were correlated with the content of red ginseng extract and showed similar T
max values, suggesting the similar intestinal absorption kinetics of these ginsenosides despite of the different structures and glycosidation patterns, which is consistent with the previous report [
17]. The long terminal half-life suggested that the intestinal metabolism (to other PPD-type metabolites) and excretion of Rb1, Rb2, and Rc may be a slow process. The T
max values of Rd, Rh2, CK, and PPD were increased according to the deglycosylated status, suggesting that deglycosylation mediated by β-glucosidase in the intestinal microbiome could occur sequentially and steadily [
11,
23,
24], and Rh2, CK, and PPD could be detected in human plasma even though they are not present in red ginseng extract.
In the case of Rg3, its T
max was smaller compared with that of Rh2 and CK because of its high content in red ginseng extract. Re and Rg1 (PPT-type ginsenosides) were not detected even though they are present in red ginseng extract; however, PPT was detected. It is possible that Re and Rg1 are metabolized to PPT by intestinal microbiota before the absorption occur [
11,
23,
24] and biotransformation of PPT could be faster than the formation rate of PPD. However, we should note that the time-dependent gut metabolism of ginsenosides in human intestine has never been investigated, therefore we speculated time-dependent gut metabolism of ginsenoside from the plasma concentration and T
max of ginsenosides and their deglycosylated metabolites. Particularly, for CK concentration, large inter-subject variation was shown in
Figure 4B and previous publication [
17]. This variability could be attributed to inter-subject variable metabolism related to the intestinal microbiota [
25] and further studies should focus on the characterization of microorganisms that produce it and the potential beneficial effects of this metabolite.
4. Materials and Methods
4.1. Materials
Red ginseng extract (Hongsamjung All DayTM; lot no. 731902) was purchased from the Punggi Ginseng Cooperative Association (Youngjoo, Kyungpook, Republic of Korea). The ginsenosides Rb1, Rb2, Rc, Rd, Re, Rf, Rg1, Rg3, Rh1, Rh2, F1, F2, CK, PPD, and PPT were purchased from the Ambo Institute (Daejeon, Republic of Korea). Berberine and 13C-caffeine, used as internal standards (IS), were purchased from Sigma-Aldrich Chemical Co. (St. Louis, MO, USA). All other chemicals and solvents were of reagent or analytical grade.
4.2. LC-MS/MS Analysis
4.2.1. Instrument
The LC-MS/MS system consisted of an Agilent 1260 Infinity HPLC system (Agilent Technologies, Wilmington, DE, USA) and Agilent 6470 Triple Quadrupole MS system (Agilent Technologies, Wilmington, DE, USA). The system was operated using Mass Hunter Acquisition Software (Version B.08.00; Agilent Technologies, Wilmington, DE, USA). The pressure of drying gas was set at 35 psi and the gas temperature was kept at 300 °C. The ion spray voltage was set at 4000 V in the positive mode.
4.2.2. HPLC Condition
Chromatographic separation was performed using a Phenomenex Polar RP analytical column (150 × 2.0 mm i.d., 4.0 μm particle size) for protein precipitation samples and a Phenomenex Luna C18 analytical column (150 × 2.0 mm i.d., 3.0 μm particle size) for liquid–liquid extraction (LLE) samples. The HPLC mobile phase for protein precipitation samples consisted of 0.1% formic acid in water (phase A) and 0.1% formic acid in methanol (phase B), and the following gradient elution was used: 69% of phase B for 0–2.0 min, 69–85% of phase B for 2.0–4.0 min, 85–69% of phase B for 6.0–6.5 min. The flow rate was 0.27 mL/min, and the injection sample volume was 10 μL. The HPLC mobile phase for LLE samples was isocratic, consisting of 0.1% formic acid in water (8%) and 0.1% formic acid in methanol (92%) at a flow rate of 0.15 mL/min. The sample injection volume was 10 μL.
4.2.3. Preparation of Stock, Working, and Quality Control (QC) Solutions
Ginsenosides and their metabolites (Rb1, Rb2, Rc, Rd, Re, Rf, Rg1, Rg3, Rh2, F1, CK, PPD, and PPT) were accurately weighed and dissolved in methanol to obtain a concentration of 1000 μg/mL each.
The above stock solutions were divided and mixed according to the sample preparation method (i.e., protein precipitation and LLE). The ginsenosides for protein precipitation method (Rb1, Rb2, Rc, Rd, Re, Rf, Rg1, Rg3, and F1) were mixed and diluted with methanol to a concentration of 2000 ng/mL. The ginsenosides for LLE (Rh2, CK, PPD, and PPT) were mixed and diluted with methanol to a concentration of 2000 ng/mL. Working solutions were then serially diluted with methanol to obtain calibration working solutions of 5, 10, 20, 50, 200, 500, 1000, and 2000 ng/mL. Quality control (QC) working solutions were prepared at 15, 150, and 1500 ng/mL with each ginsenoside.
4.2.4. Preparation of Calibration Curve and QC Samples
Calibration curve samples were prepared by spiking 10 μL of working solution into 90 μL of human blank plasma at final concentrations of 0.5, 1, 2, 5, 20, 50, 100, and 200 ng/mL. QC samples were prepared by spiking 10 μL of QC working solution into 90 μL of human blank plasma at final concentrations of 1.5, 15, and 150 ng/mL of QC samples.
For protein precipitation, 600 μL of an IS (0.05 ng/mL berberine in methanol) was added to 100 μL of calibration curve samples and QC samples. Then, the mixture was vortexed for 15 min and centrifuged at 16,100× g for 5 min. After centrifugation, 500 μL of the supernatant was transferred to a clean tube and evaporated to dryness under a nitrogen stream at 40 °C. The residue was reconstituted with 150 μL of 70% methanol consisting of 0.1% formic acid.
For LLE, 50 μL of an IS (20 ng/mL 13C-caffeine in water) and 800 μL of MTBE was added to 100 μL of calibration curve samples and QC samples. The mixture was vortexed for 10 min and centrifuged at 16,100× g for 5 min. After centrifugation, the samples were frozen at −80 °C for 4 h. The upper layer was transferred to a clean tube and evaporated to dryness under a nitrogen stream. The residue was reconfigured with 150 μL of 80% methanol consisting of 0.1% formic acid.
4.3. Method Validation
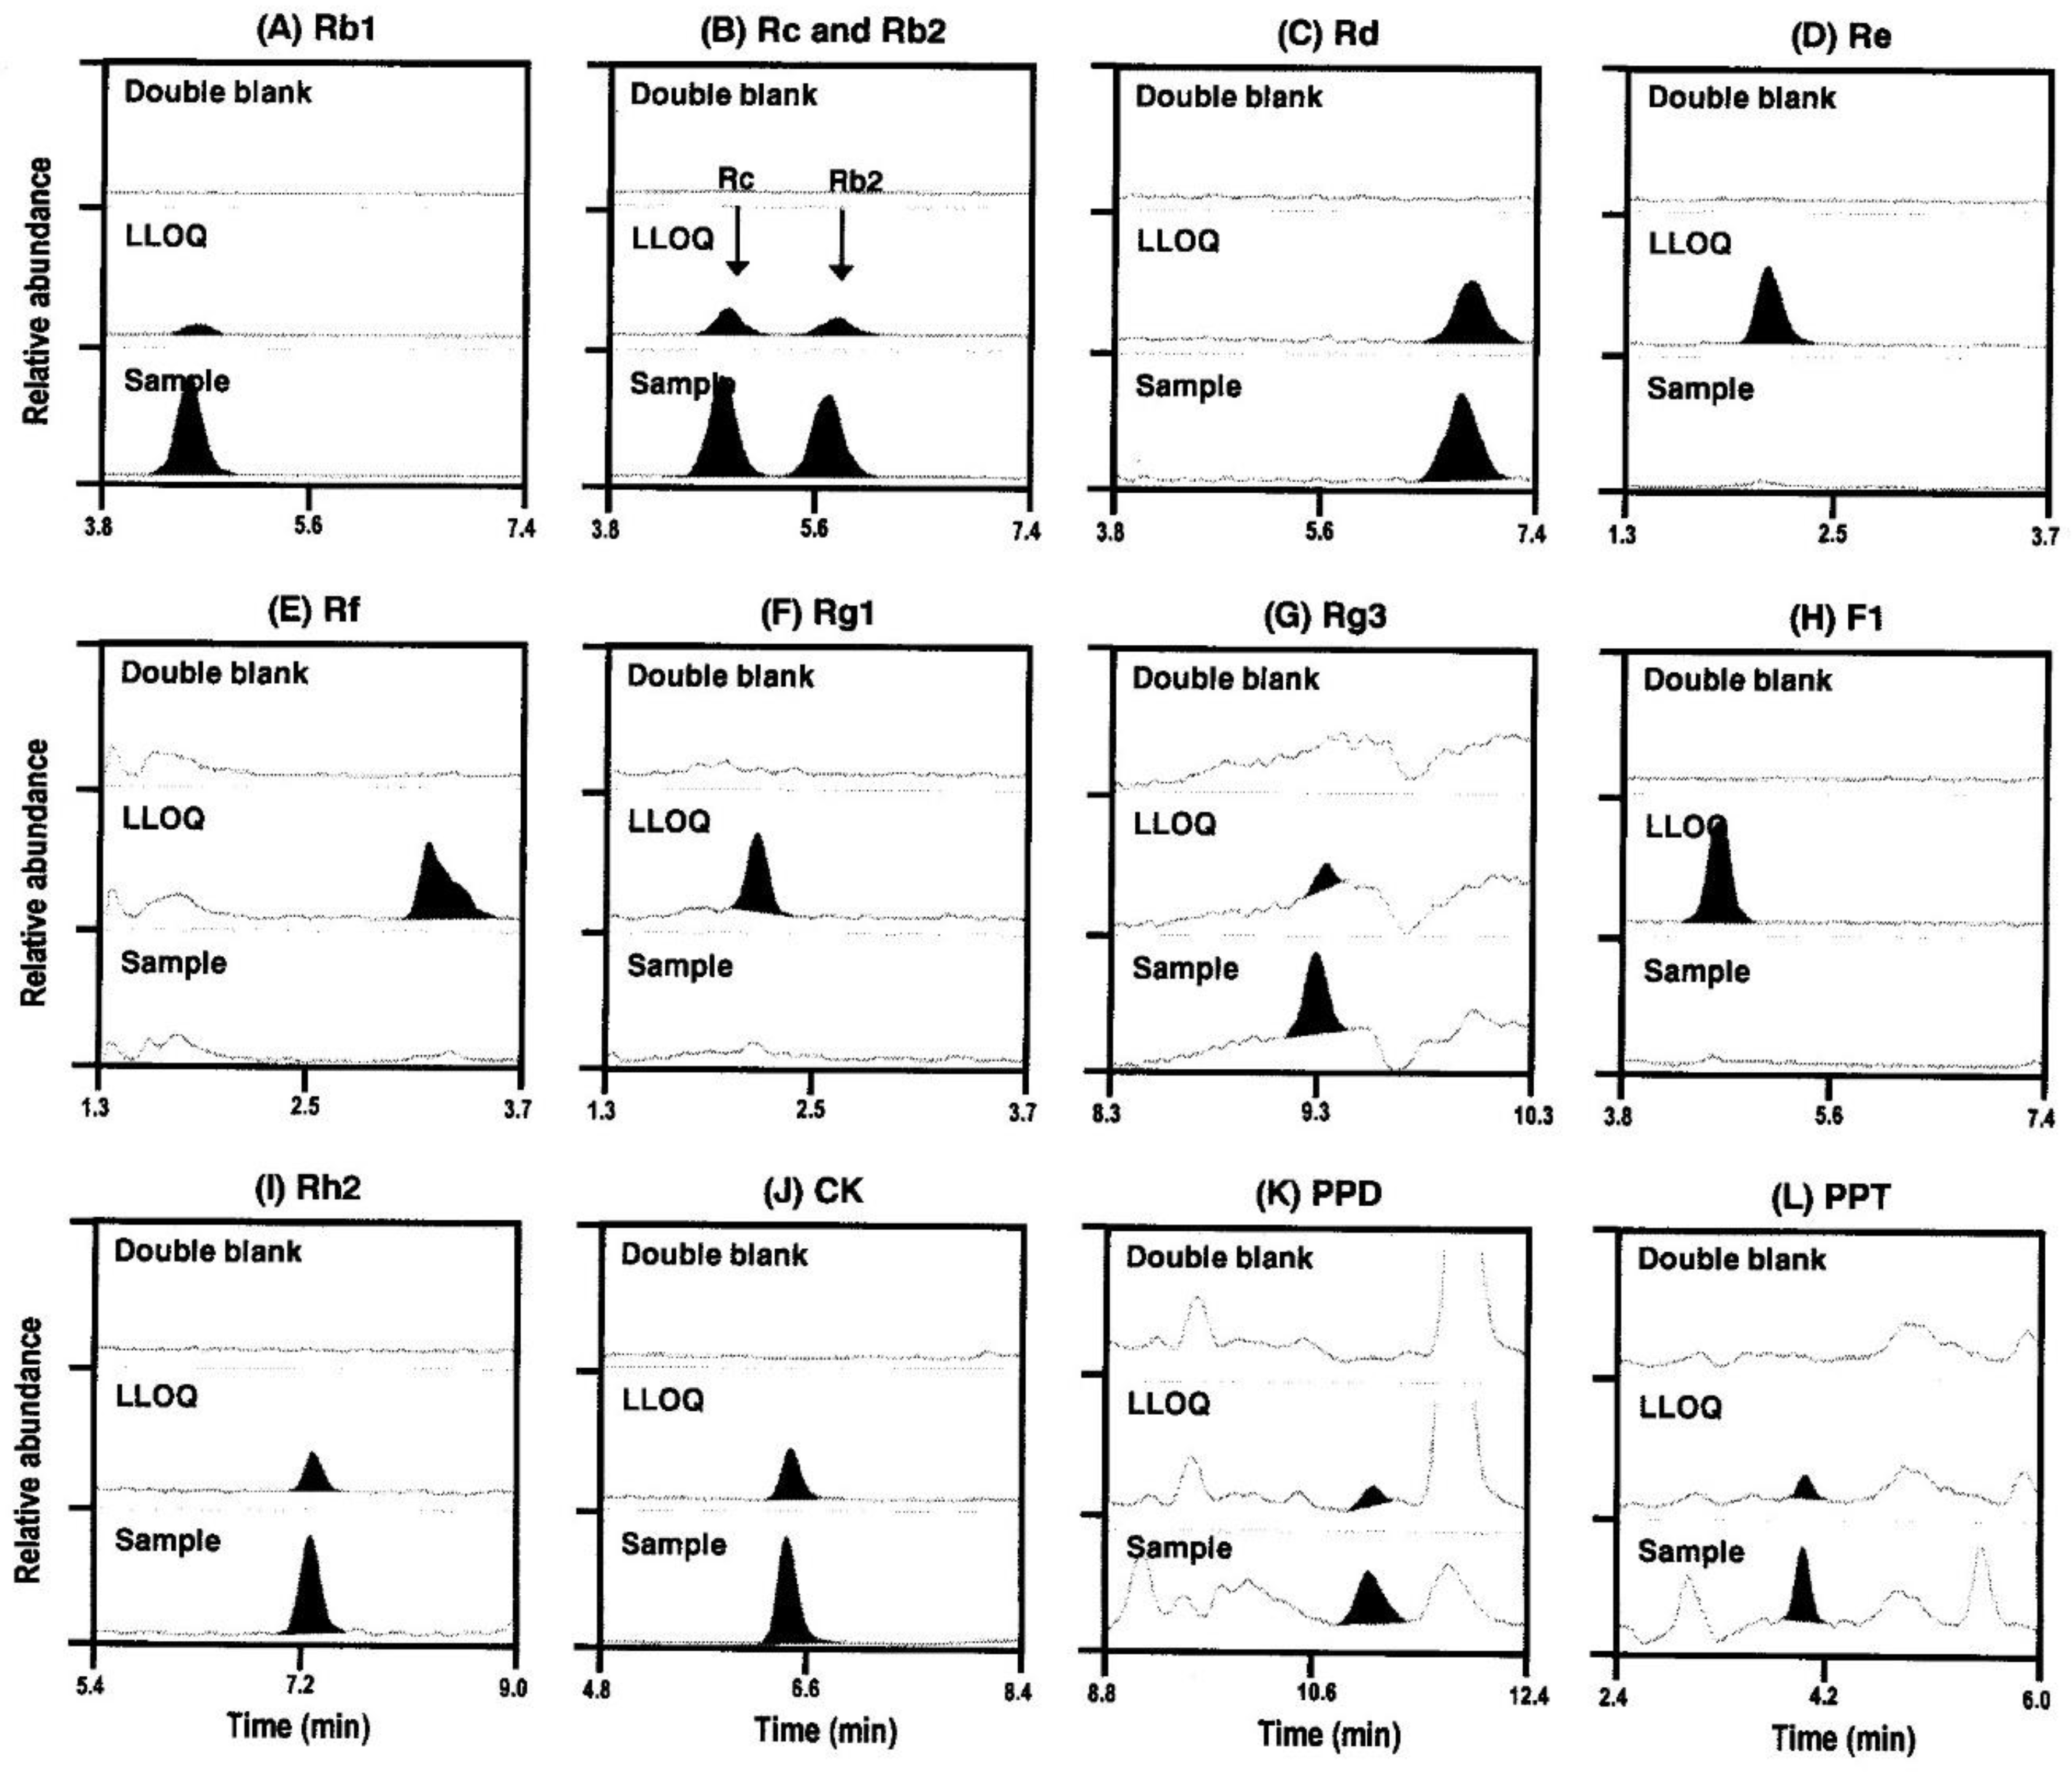
4.3.1. Specificity
The specificity of the method was assessed by comparing chromatogram responses of six lots of human blank plasma with lower limit of quantification (LLOQ) sample.
4.3.2. Linearity
The linearity of the method was assessed using six calibration curves analyzed on six different days. The calibration curve was obtained by plotting the peak area ratio against the concentration of each drug at eight-point levels with a weighting factor of 1/x2.
4.3.3. Precision and Accuracy
The intra-day (n = 5) and inter-day (n = 6) precision and accuracy were evaluated using three different QC samples for each analyte. The precision and accuracy at each concentration level were evaluated in terms of the coefficient of variance (CV, %) and relative error (RE, %).
4.3.4. Extraction Recovery and Matrix Effect
The extraction recovery and matrix effect were assessed for three different QC samples using six different blank plasma samples. The extraction recoveries were evaluated by comparing the peak areas of the extracted samples (spiked before extraction) with those of the unextracted samples (spiked after blank extraction) [
26]. The matrix factor for the analyte and IS was calculated in each lot by comparing the peak responses of the post-extraction samples (spiked after blank extraction) against neat solutions, which have the same amount of analyte as the extracted sample [
26].
4.3.5. Stability
Short-term stability was evaluated to determine whether the sample was stable during treatment. All analytes and IS of the spiked plasma samples were left for at least 6 h at 25 °C. The spiked plasma samples were also subjected to a freeze (−80 °C) and thaw cycle (25 °C and stand for 2 h) three times. After the samples were processed, it was confirmed that they were stable at 8 °C for 24 h. The stability test was conducted using three different concentrations of QC samples.
4.4. Pharmacokinetic Study
The study was approved by the Institutional Review Board of Kyungpook National University Hospital (KNUH, Daegu, Republic of Korea) and was conducted at the KNUH Clinical Trial Center in accordance with the applicable Good Clinical Practice guidelines (IRB approval no. KNUH 2018-04-028-002). All subjects provided written informed consent before study enrollment and underwent clinical evaluation including physical examination, serology tests, 12-lead electrocardiography, and clinical history assessment. A total of 11 healthy Korean male subjects aged ≥ 19 years and with a body weight of ≥ 50 kg were enrolled in this study.
The volunteers took 3 pouches of red ginseng extract per day at 9 AM for 2 weeks. On the 14th day, after taking the last dose of the red ginseng extract, blood samples (5 mL) were collected in a heparinized tube at 0.25, 0.5, 1, 2, 3, 4, 6, 8, 10, 12, and 24 h post-dose via a saline-locked angiocatheter. The plasma was collected by centrifugation for 10 min at 3000 × g and stored at −80 °C until analysis.
To analyze the ginsenosides Rb1, Rb2, Rc, Rd, Re, Rf, Rg1, Rg3, and F1, 600 μL of an IS (0.05 ng/mL berberine in methanol) was added to 100 μL of plasma samples. Then, the mixture was vortexed for 15 min and centrifuged at 16,100× g for 5 min. After centrifugation, 500 μL of the supernatant was transferred to a clean tube and evaporated to dryness under a nitrogen stream at 40 °C. The residue was reconstituted with 150 μL of 70% methanol consisting of 0.1% formic acid, and a 10 μL aliquot was injected into the LC-MS/MS system.
To analyze the ginsenosides Rh2, CK, PPD, and PPT, 50 μL of an IS (20 ng/mL 13C-caffeine in water) and 800 μL of MTBE were added to 100 μL of plasma samples. The mixture was vortexed for 10 min and centrifuged at 16,100× g for 5 min. After centrifugation, the samples were frozen at −80 °C for 4 h. The upper layer was transferred to a clean tube and evaporated to dryness under a nitrogen stream. The residue was reconfigured with 150 μL of 80% methanol consisting of 0.1% formic acid, and a 10 μL aliquot was injected into the LC-MS/MS system.
Similarly, the ginsenoside content in the red ginseng extract was quantified. The red ginseng extract (100 mg) was diluted 50-fold with methanol, and 100 μL of the diluted sample was prepared using the method described previously. Aliquots (10 μL) of the supernatant were directly injected into the LC-MS/MS system.
4.5. Data Analysis
Pharmacokinetic parameters were estimated using non-compartmental methods (WinNonlin version 2.0; Pharsight Co., Certara, NJ, USA). All pharmacokinetic parameters are presented as the mean ± standard deviation (SD).
5. Conclusions
A sensitive LC–MS/MS method for the detection of 13 ginsenosides (Rb1, Rb2, Rc, Rd, Re, Rf, Rg1, Rg3, and F1, Rh2, CK, PPD, and PPT) in human plasma with a LLOQ of 0.5 ng/mL was developed and validated. This method can be used in the bioanalysis and pharmacokinetic studies of ginseng products administered at multiple therapeutic doses. Following repeated oral administration of red ginseng extract for two weeks, the plasma concentrations of Rb1, Rb2, Rc, Rd, Rg3, Rh2, CK, PPD, and PPT were detected. The findings can provide valuable information on ginsenoside metabolism in the human body and contribute to in vivo pharmacokinetic-pharmacodynamic correlation studies.


 ,
, 


