A New Fluorescent Chemosensor for Cobalt(II) Ions in Living Cells Based on 1,8-Naphthalimide
 ,
, 
Abstract
:
1. Introduction
2. Results and Discussion
2.1. UV-Vis and Fluorescence Response of the L Probe Toward Various Metal Ions
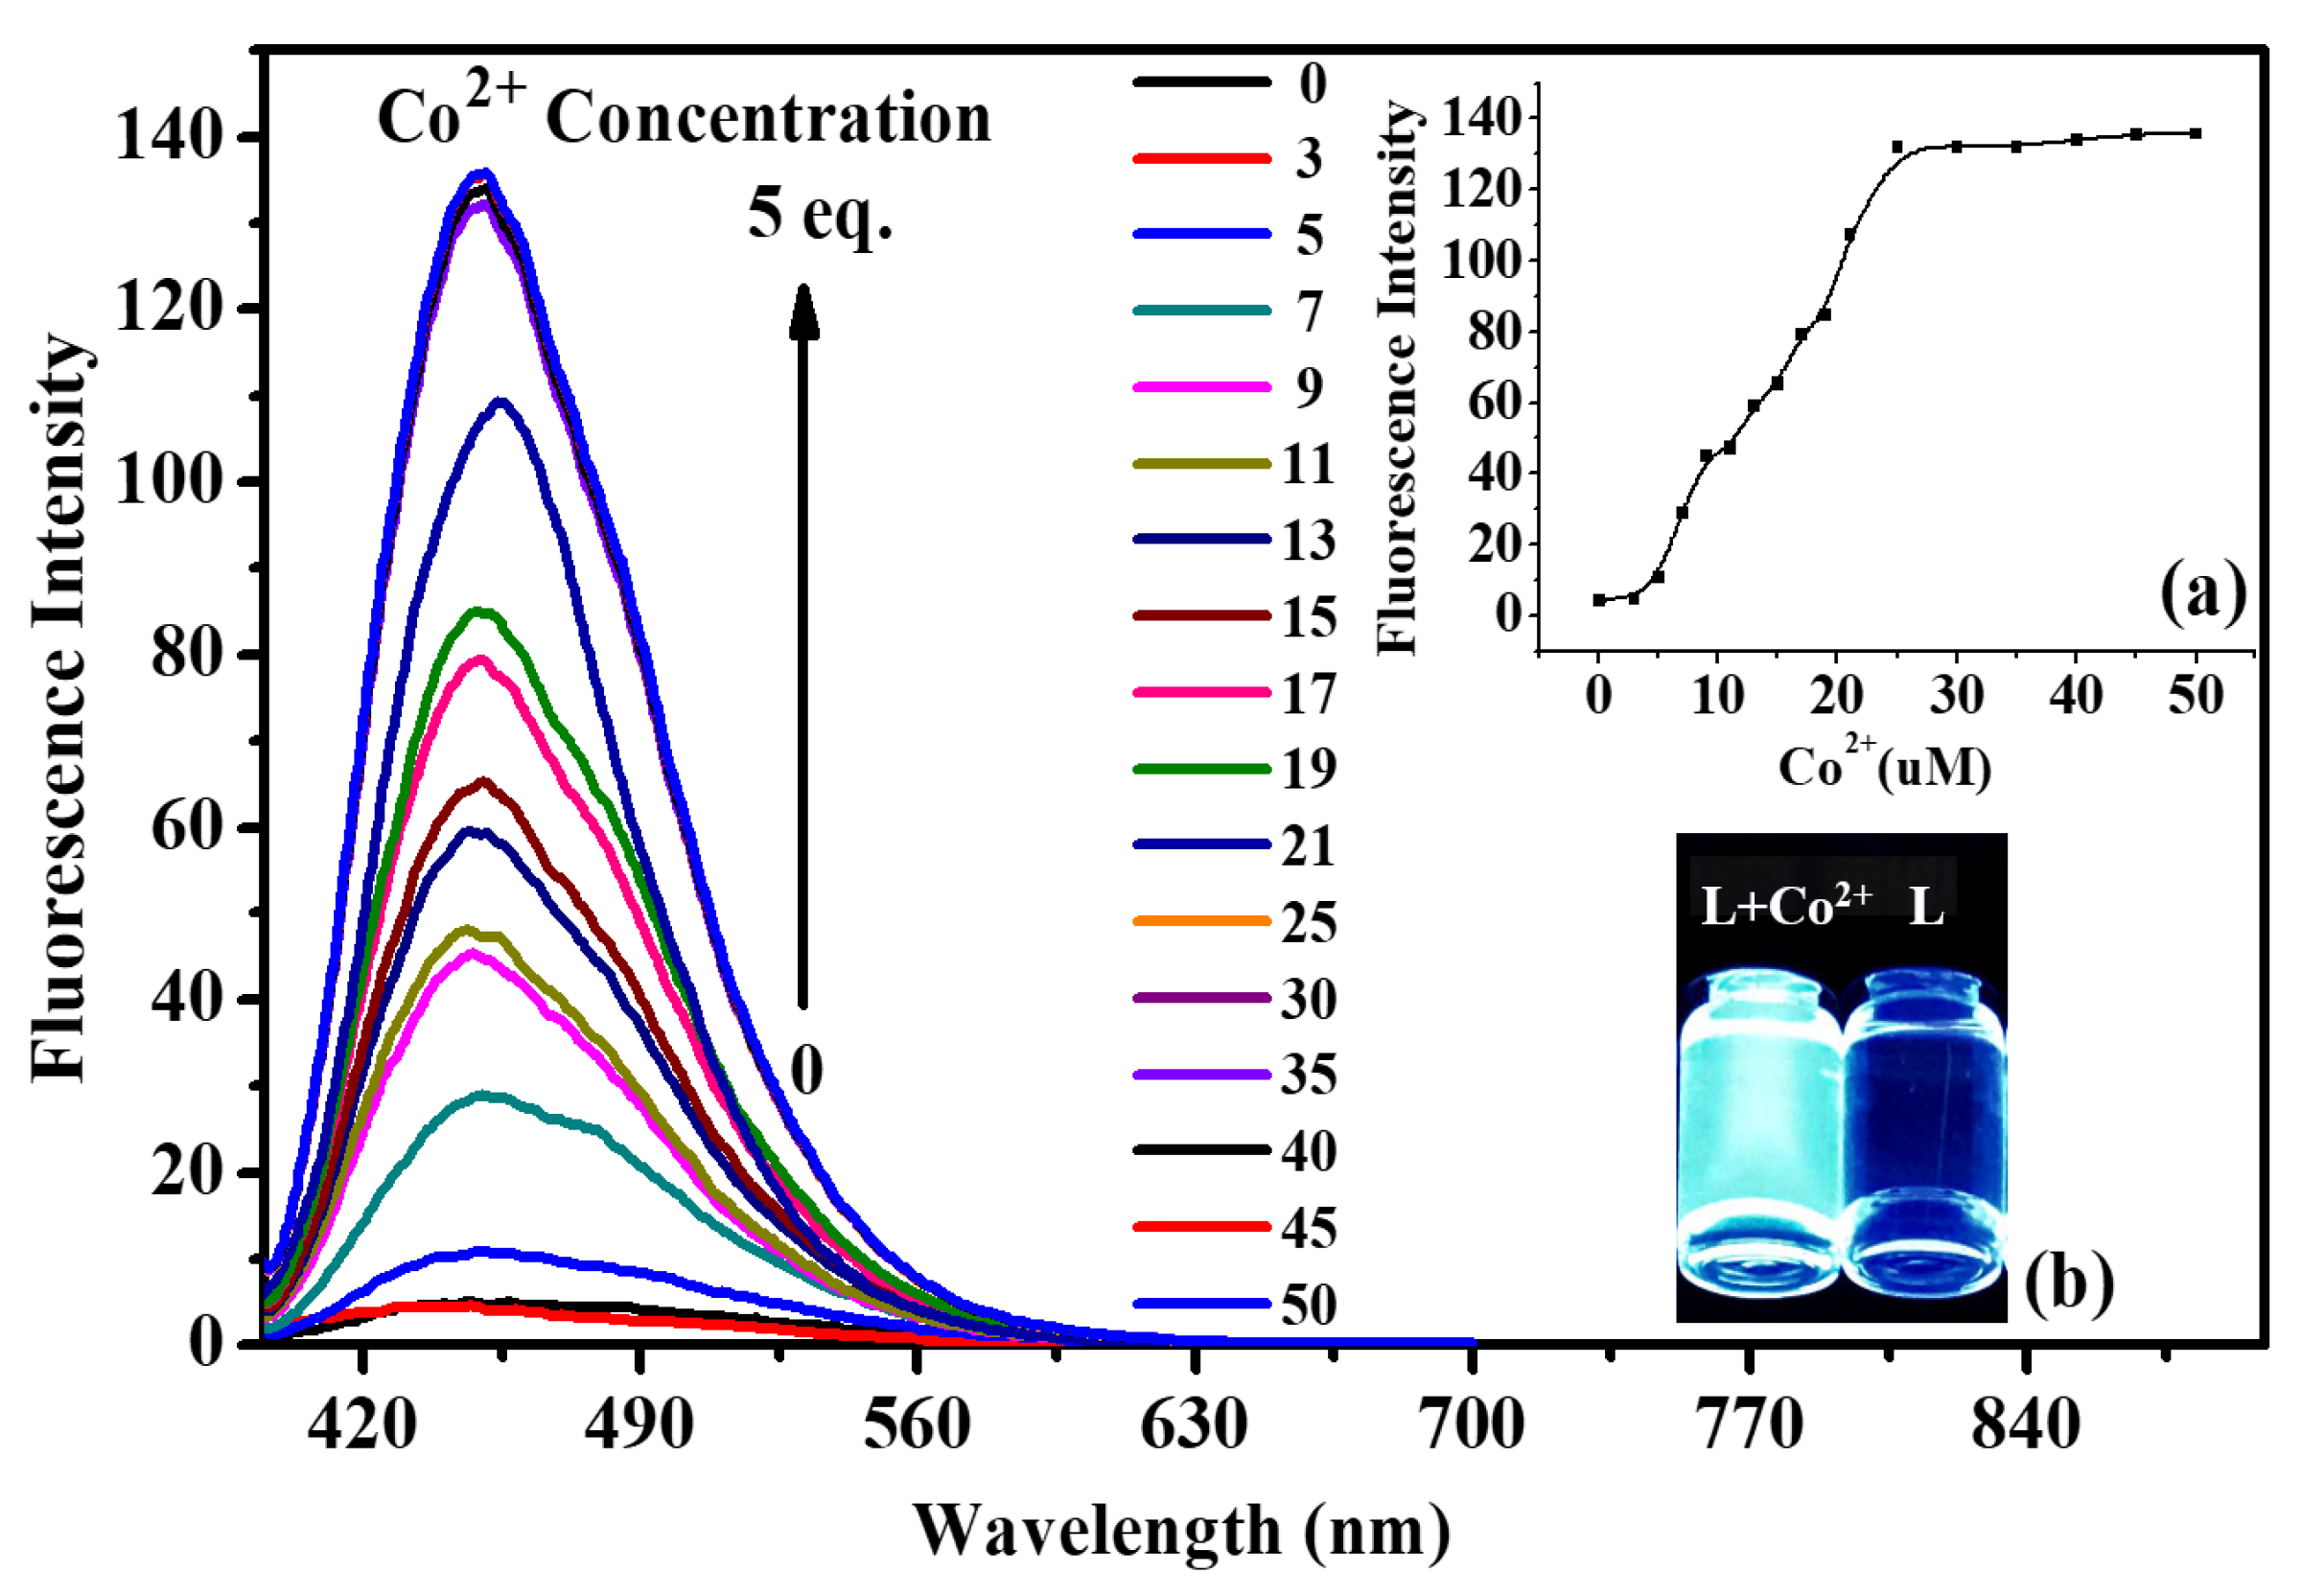
2.2. Fluorescence and UV-Vis Titration Experiments
2.3. Anti-Interference Test from Other Metal Ions
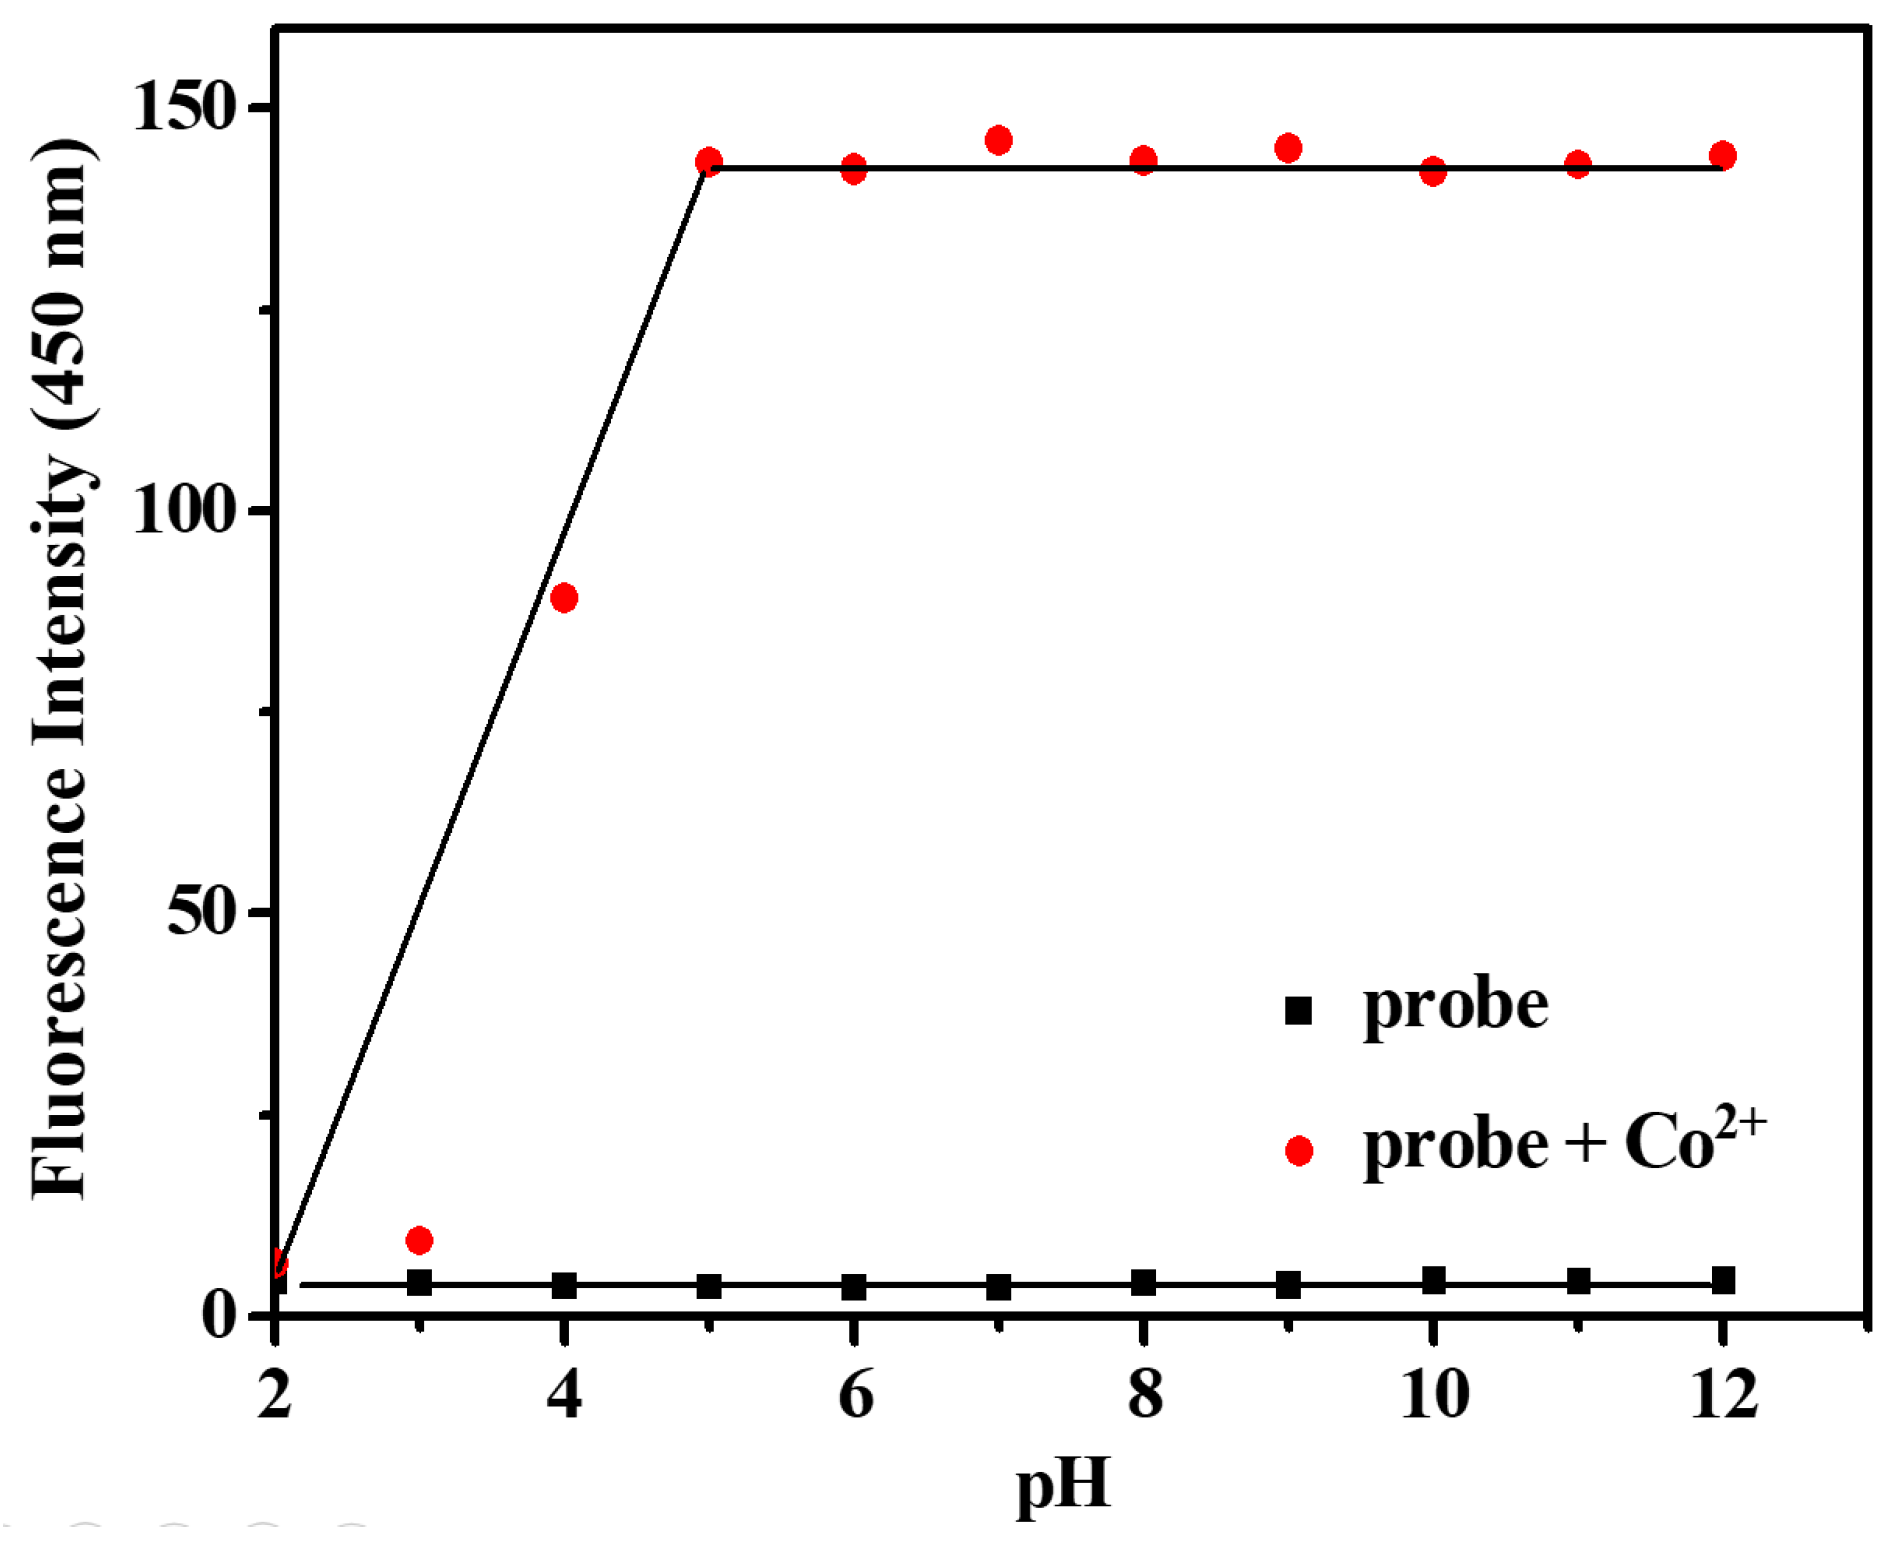
2.4. Effect of pH
2.5. Job’s Plot and Reversibility
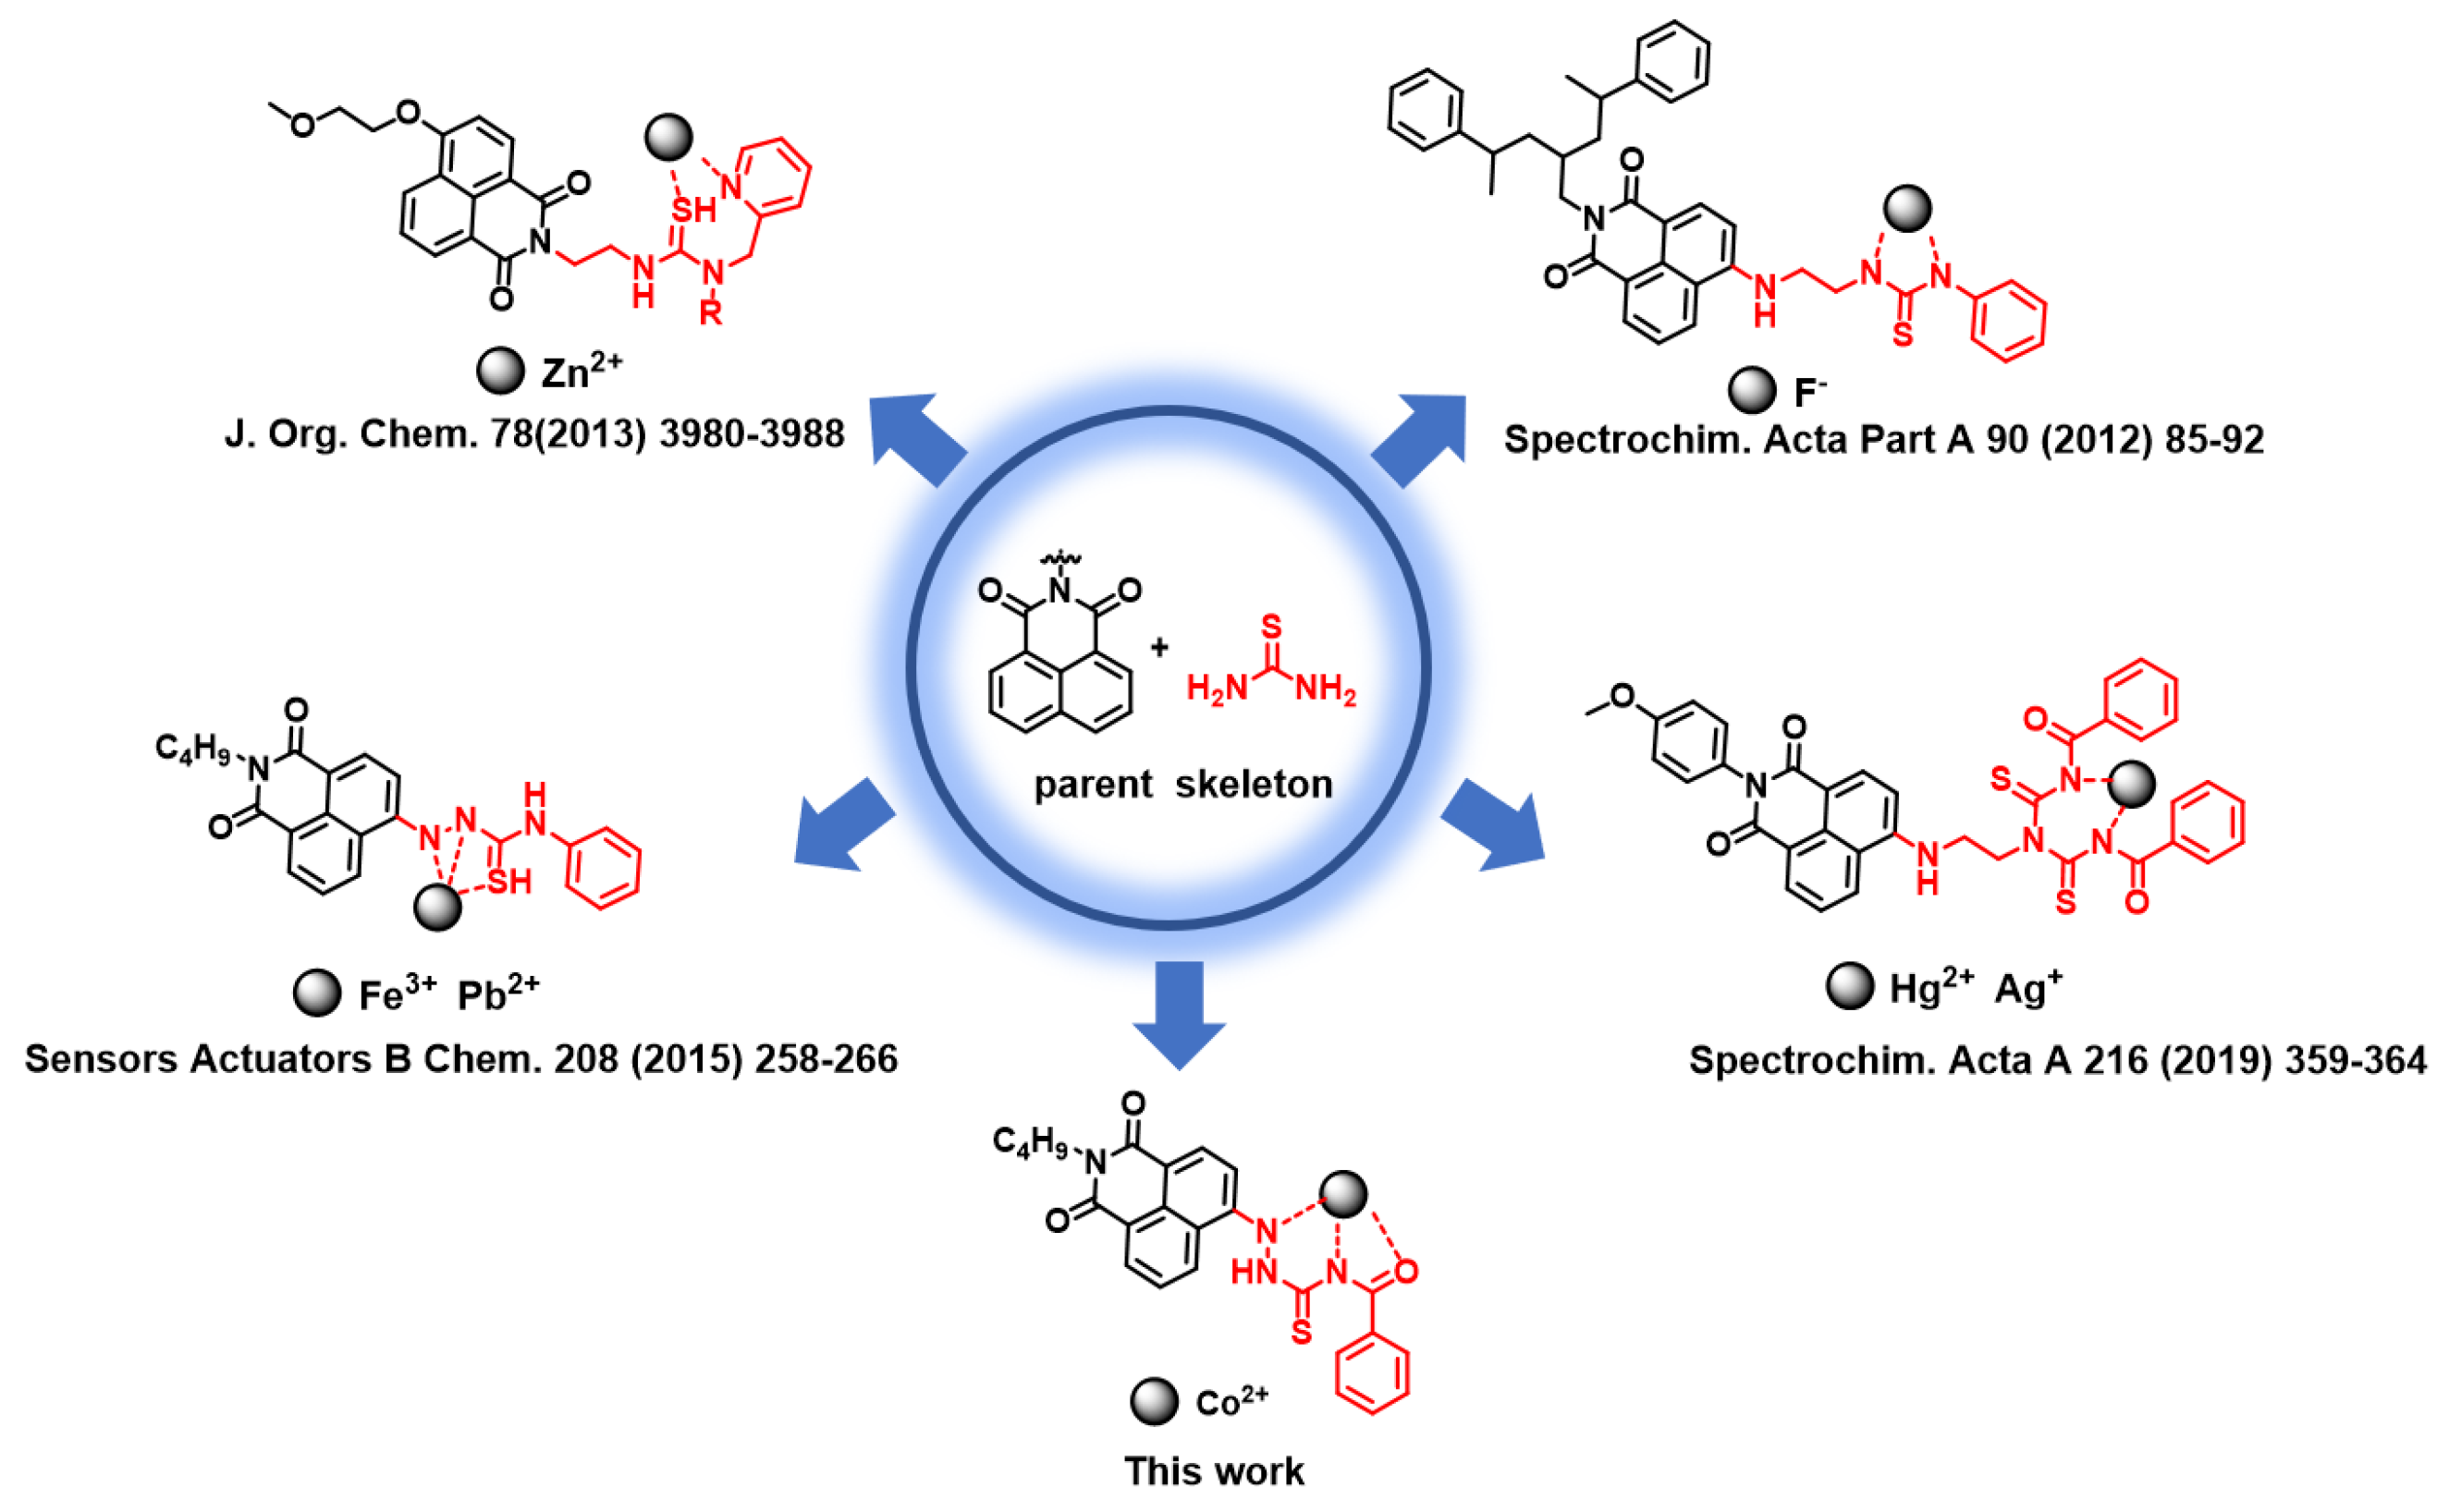
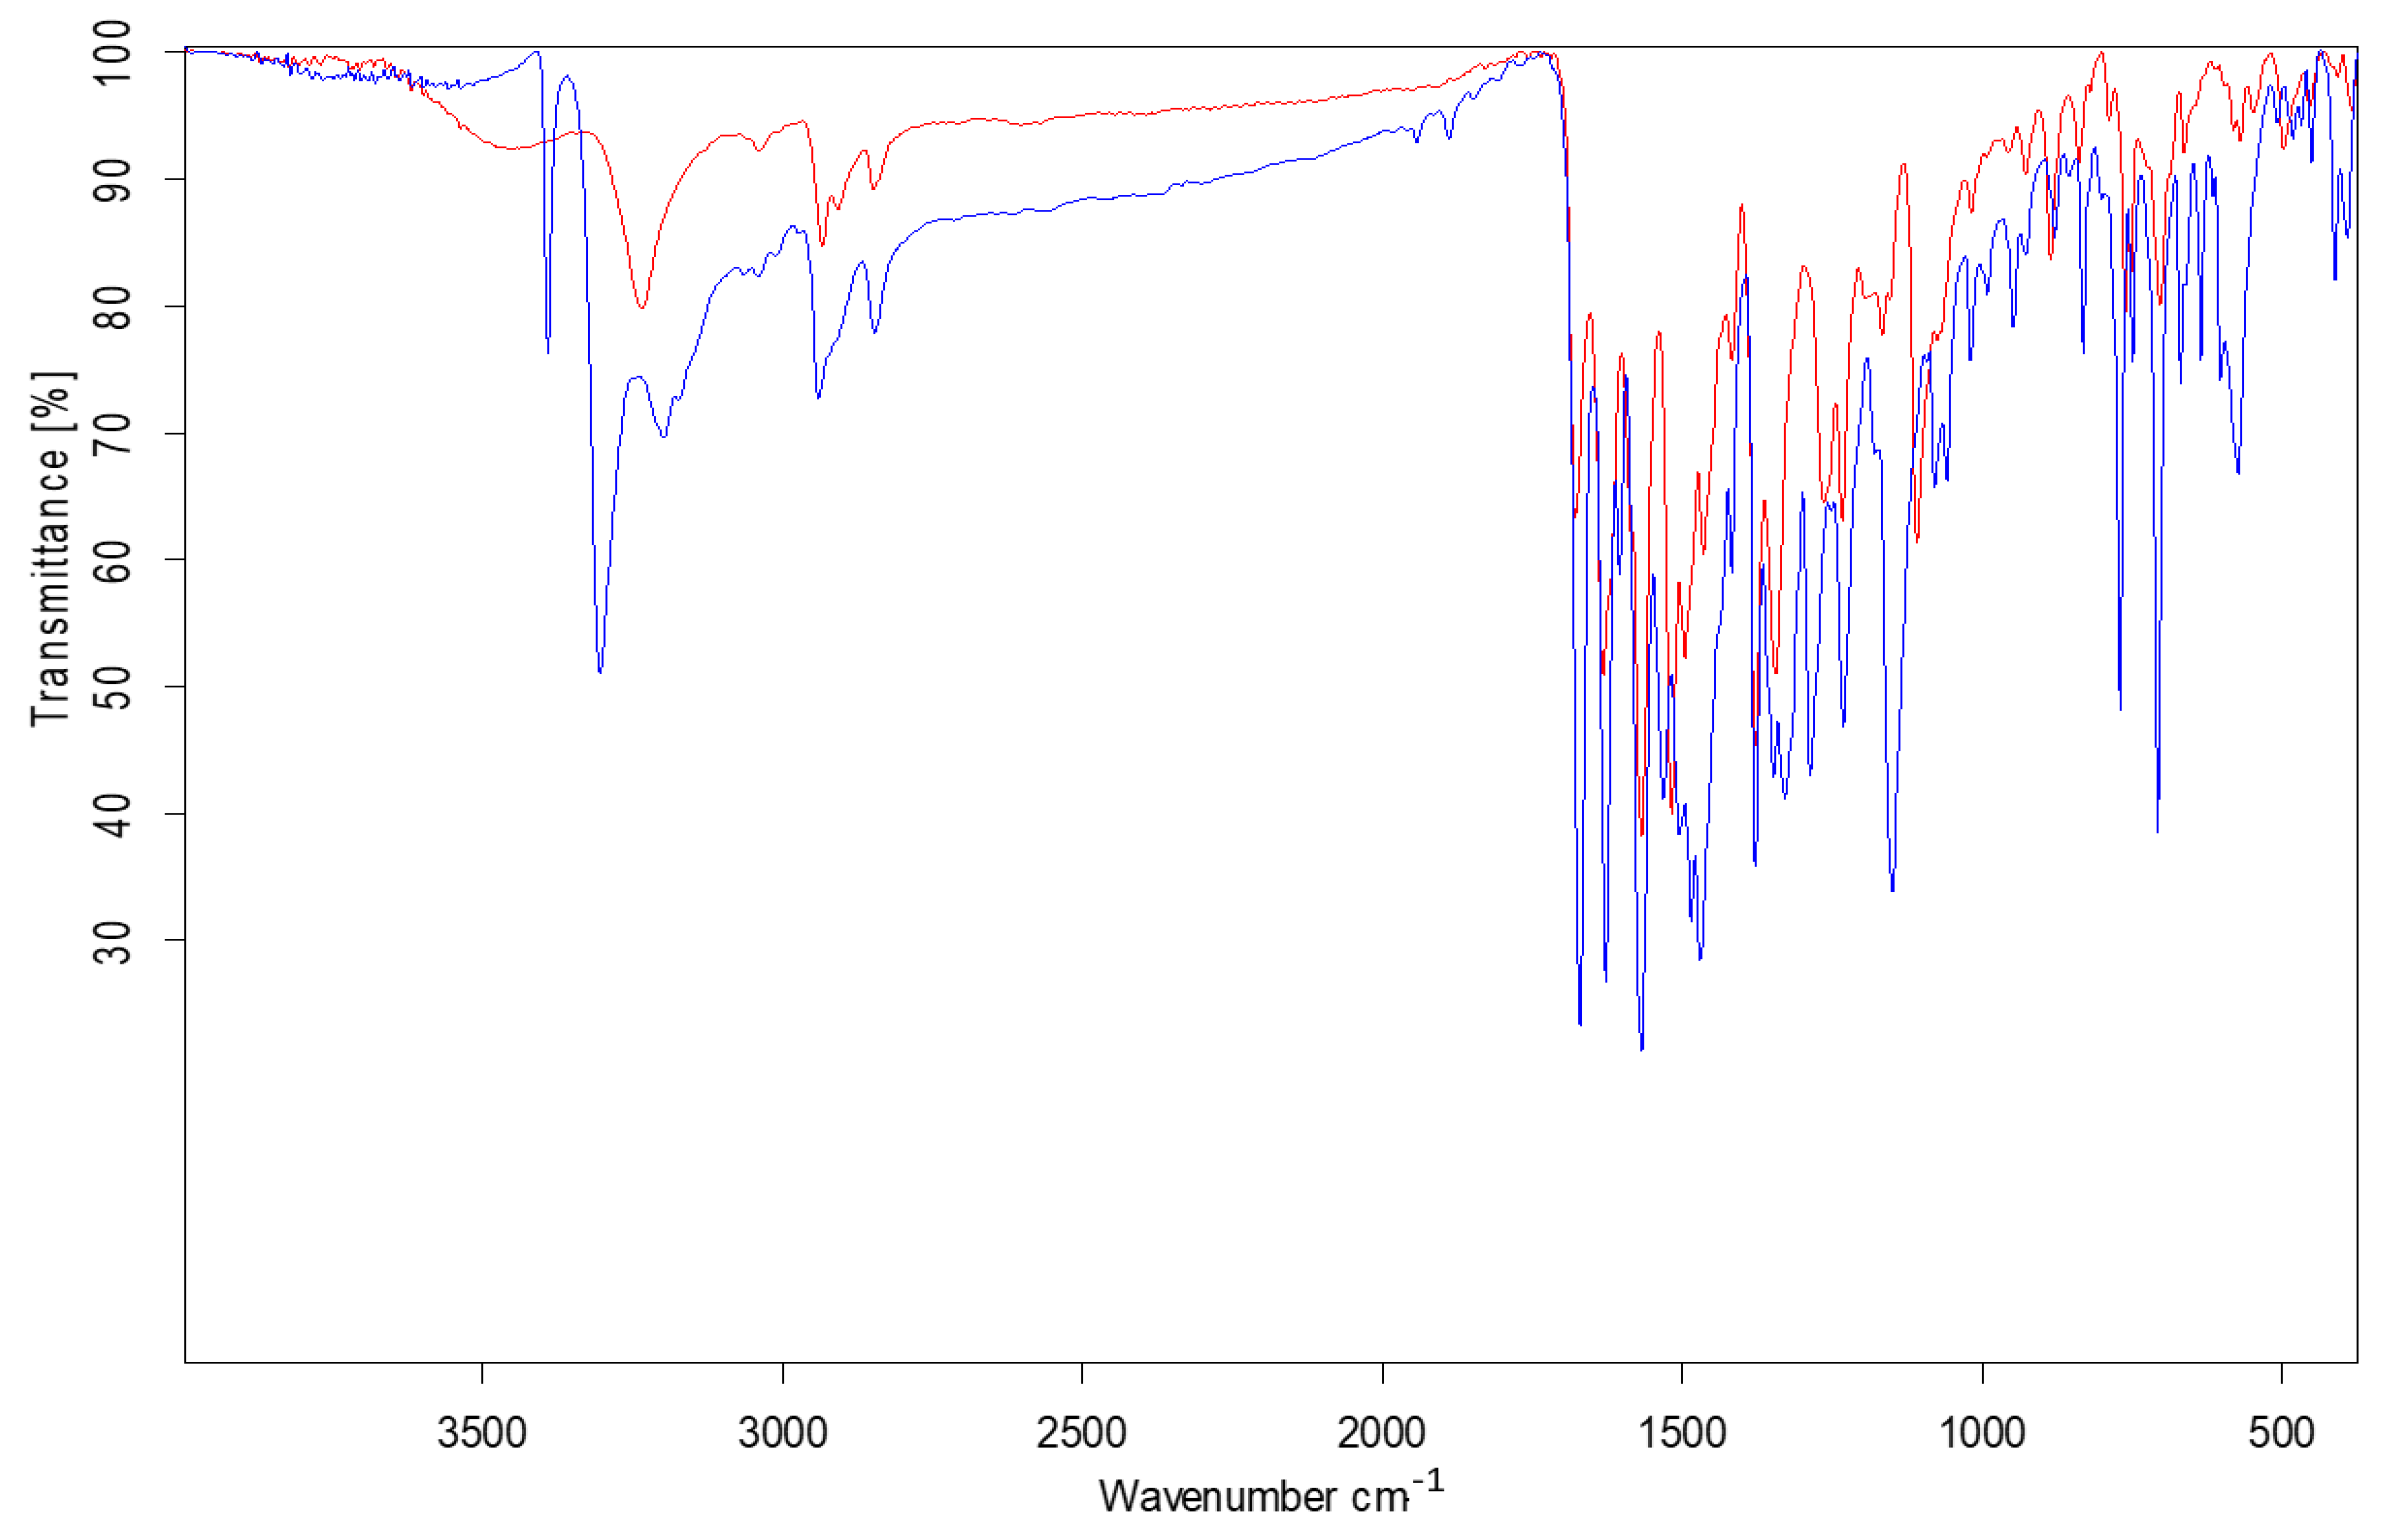
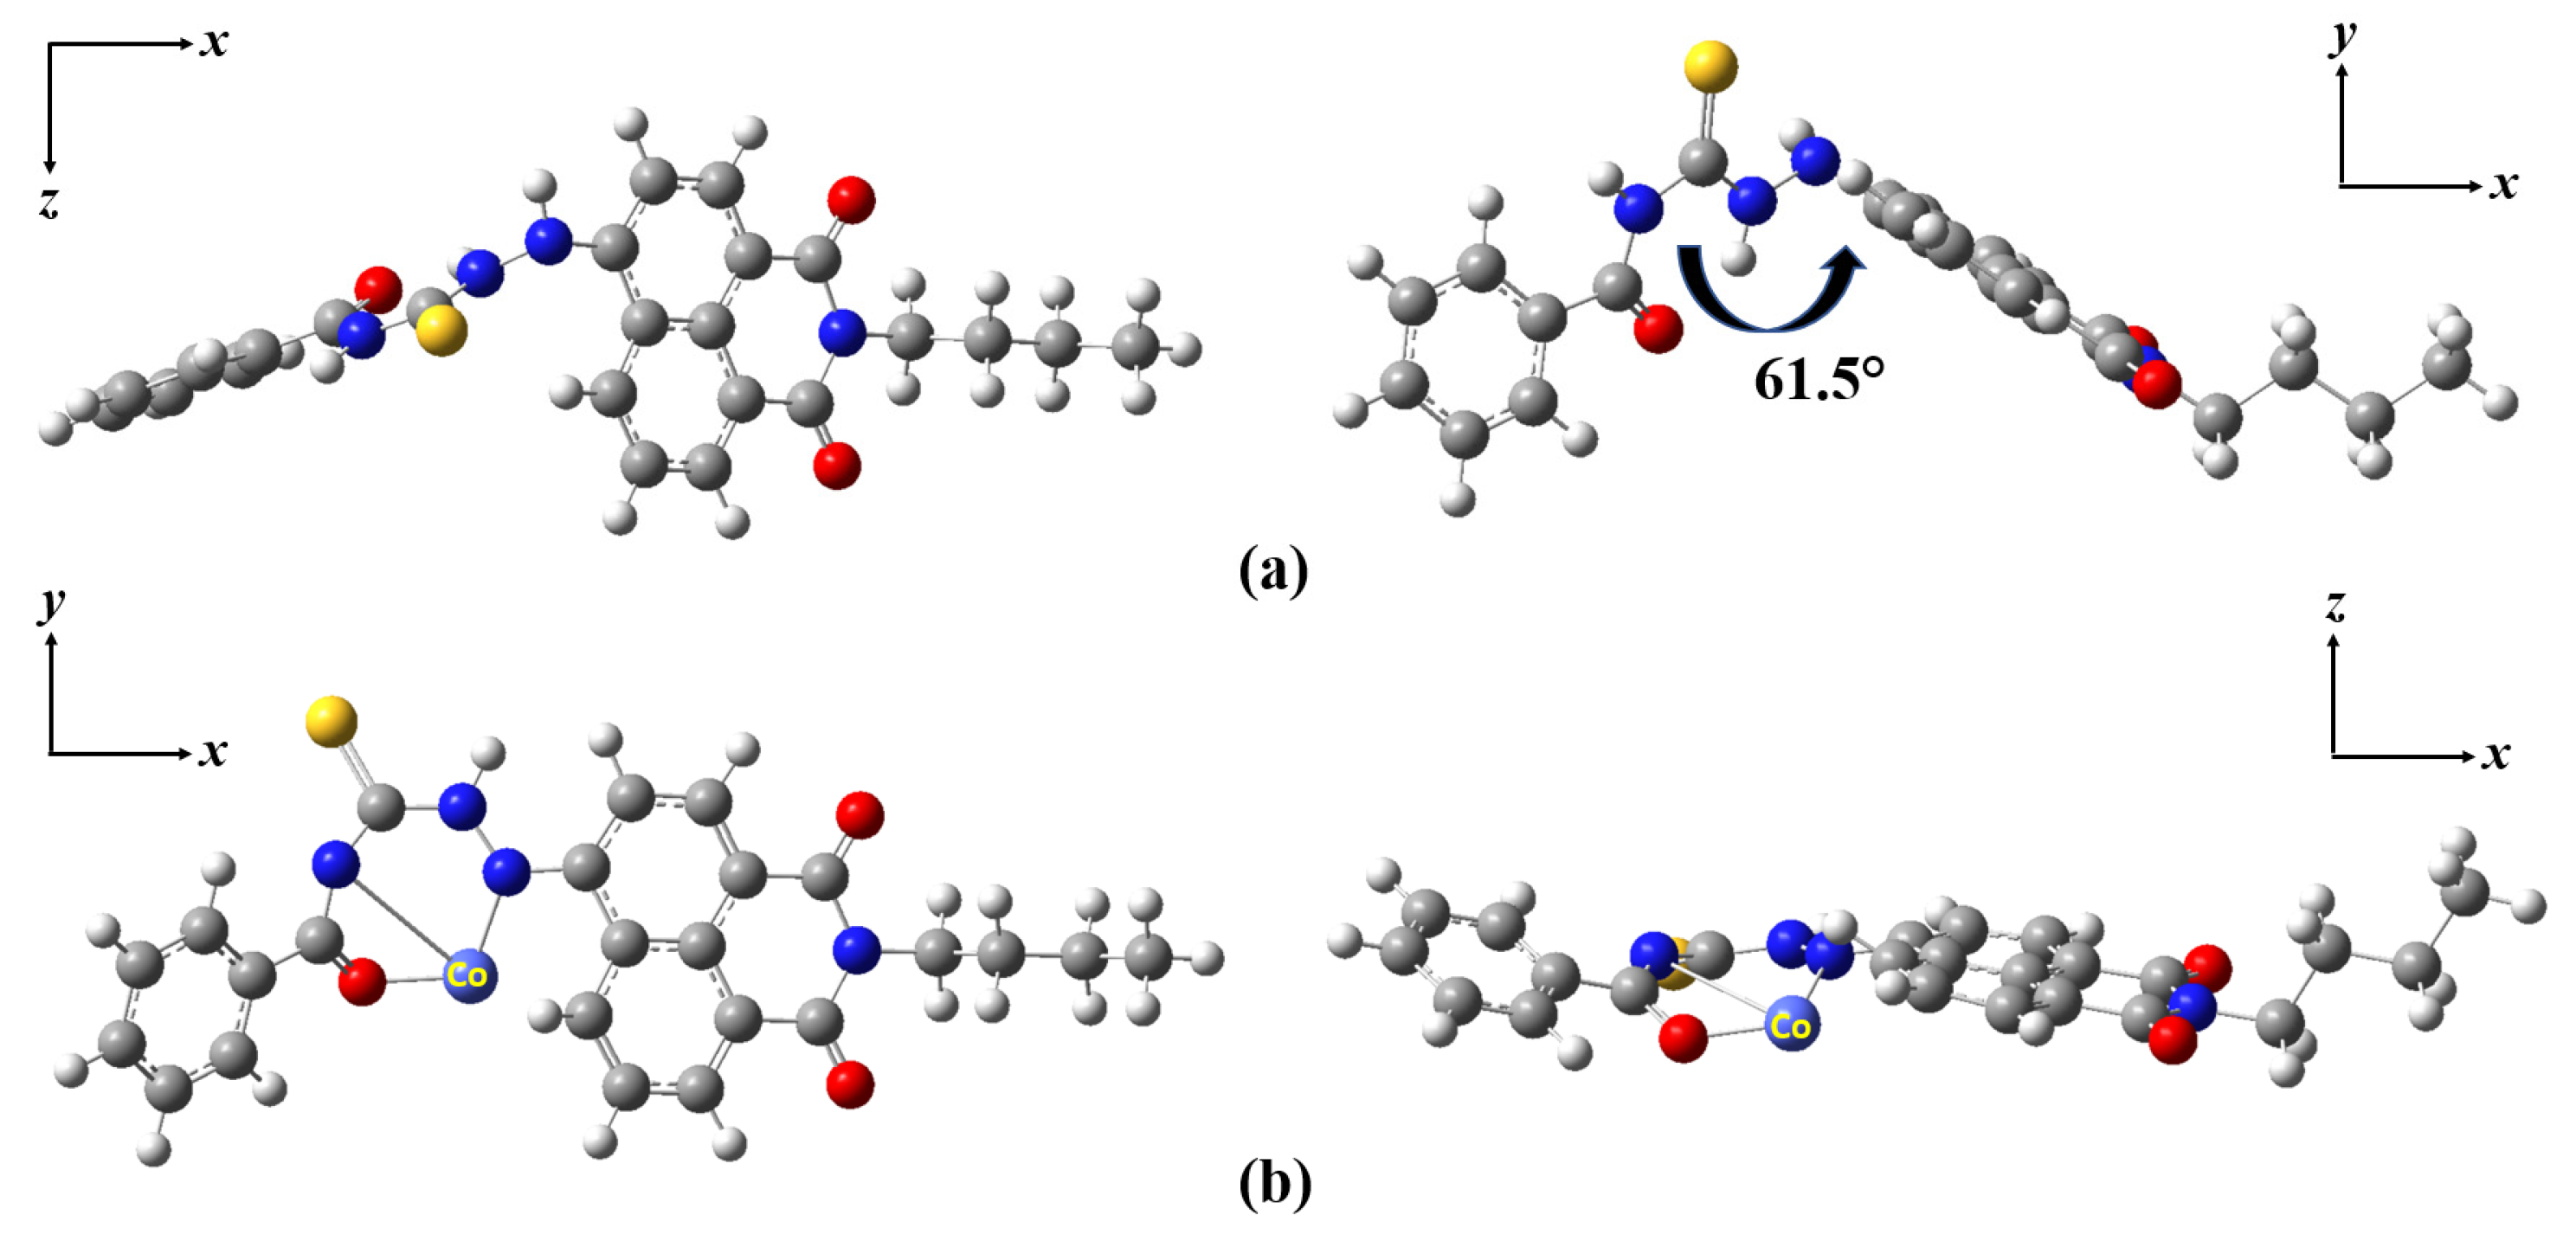
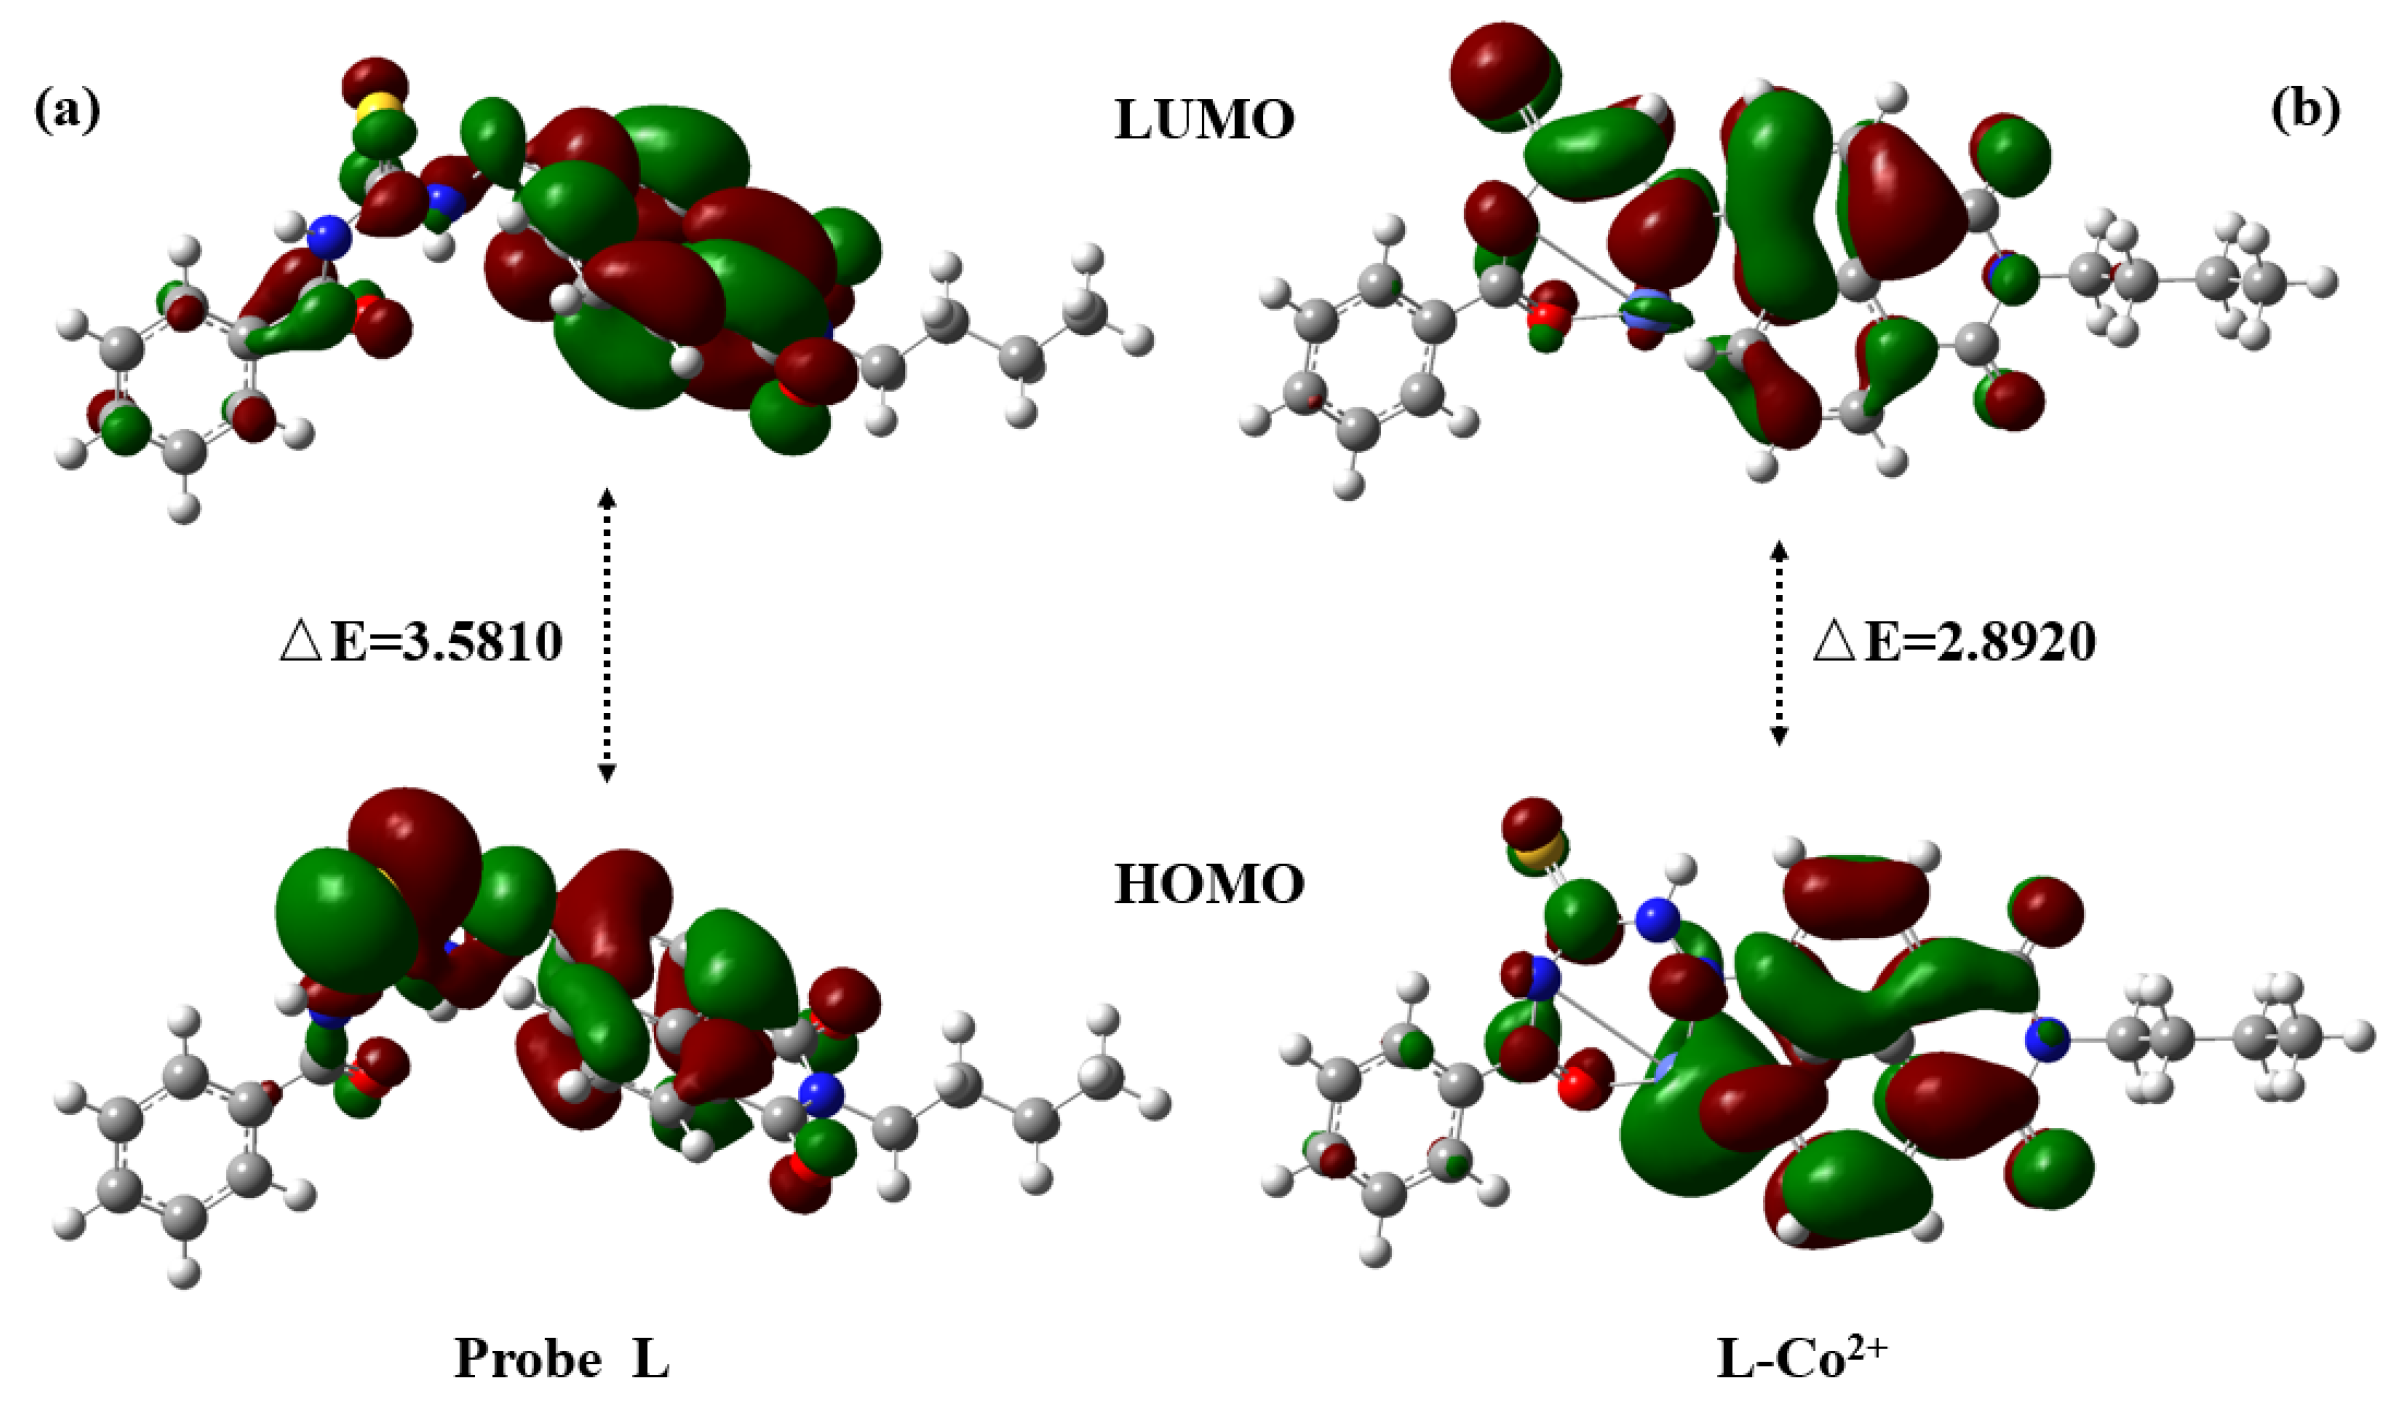
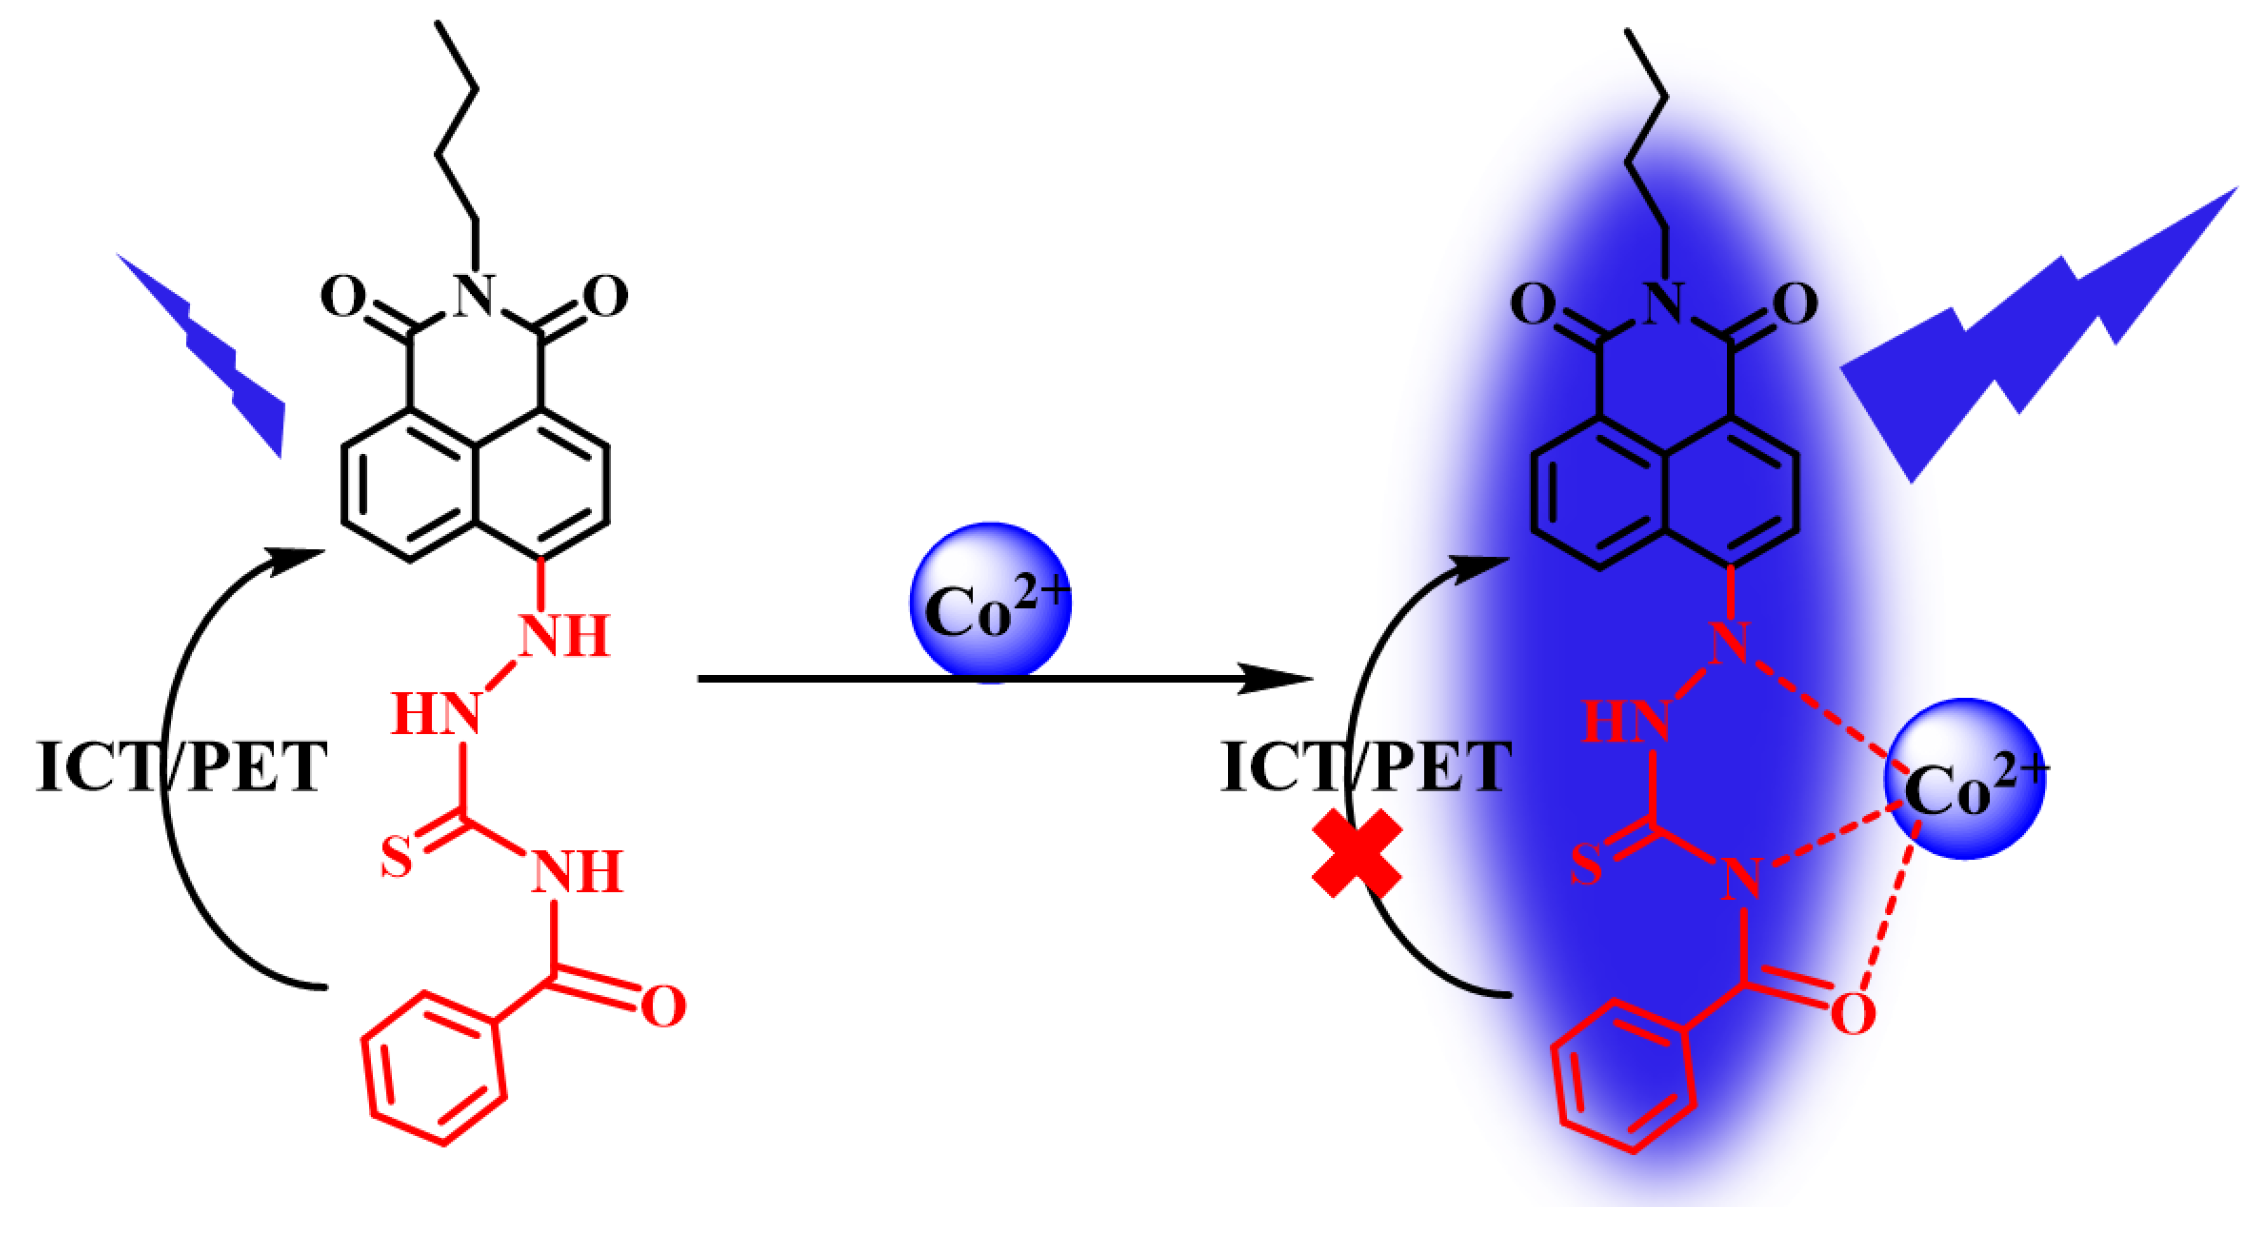
2.6. Sensing Mechanism
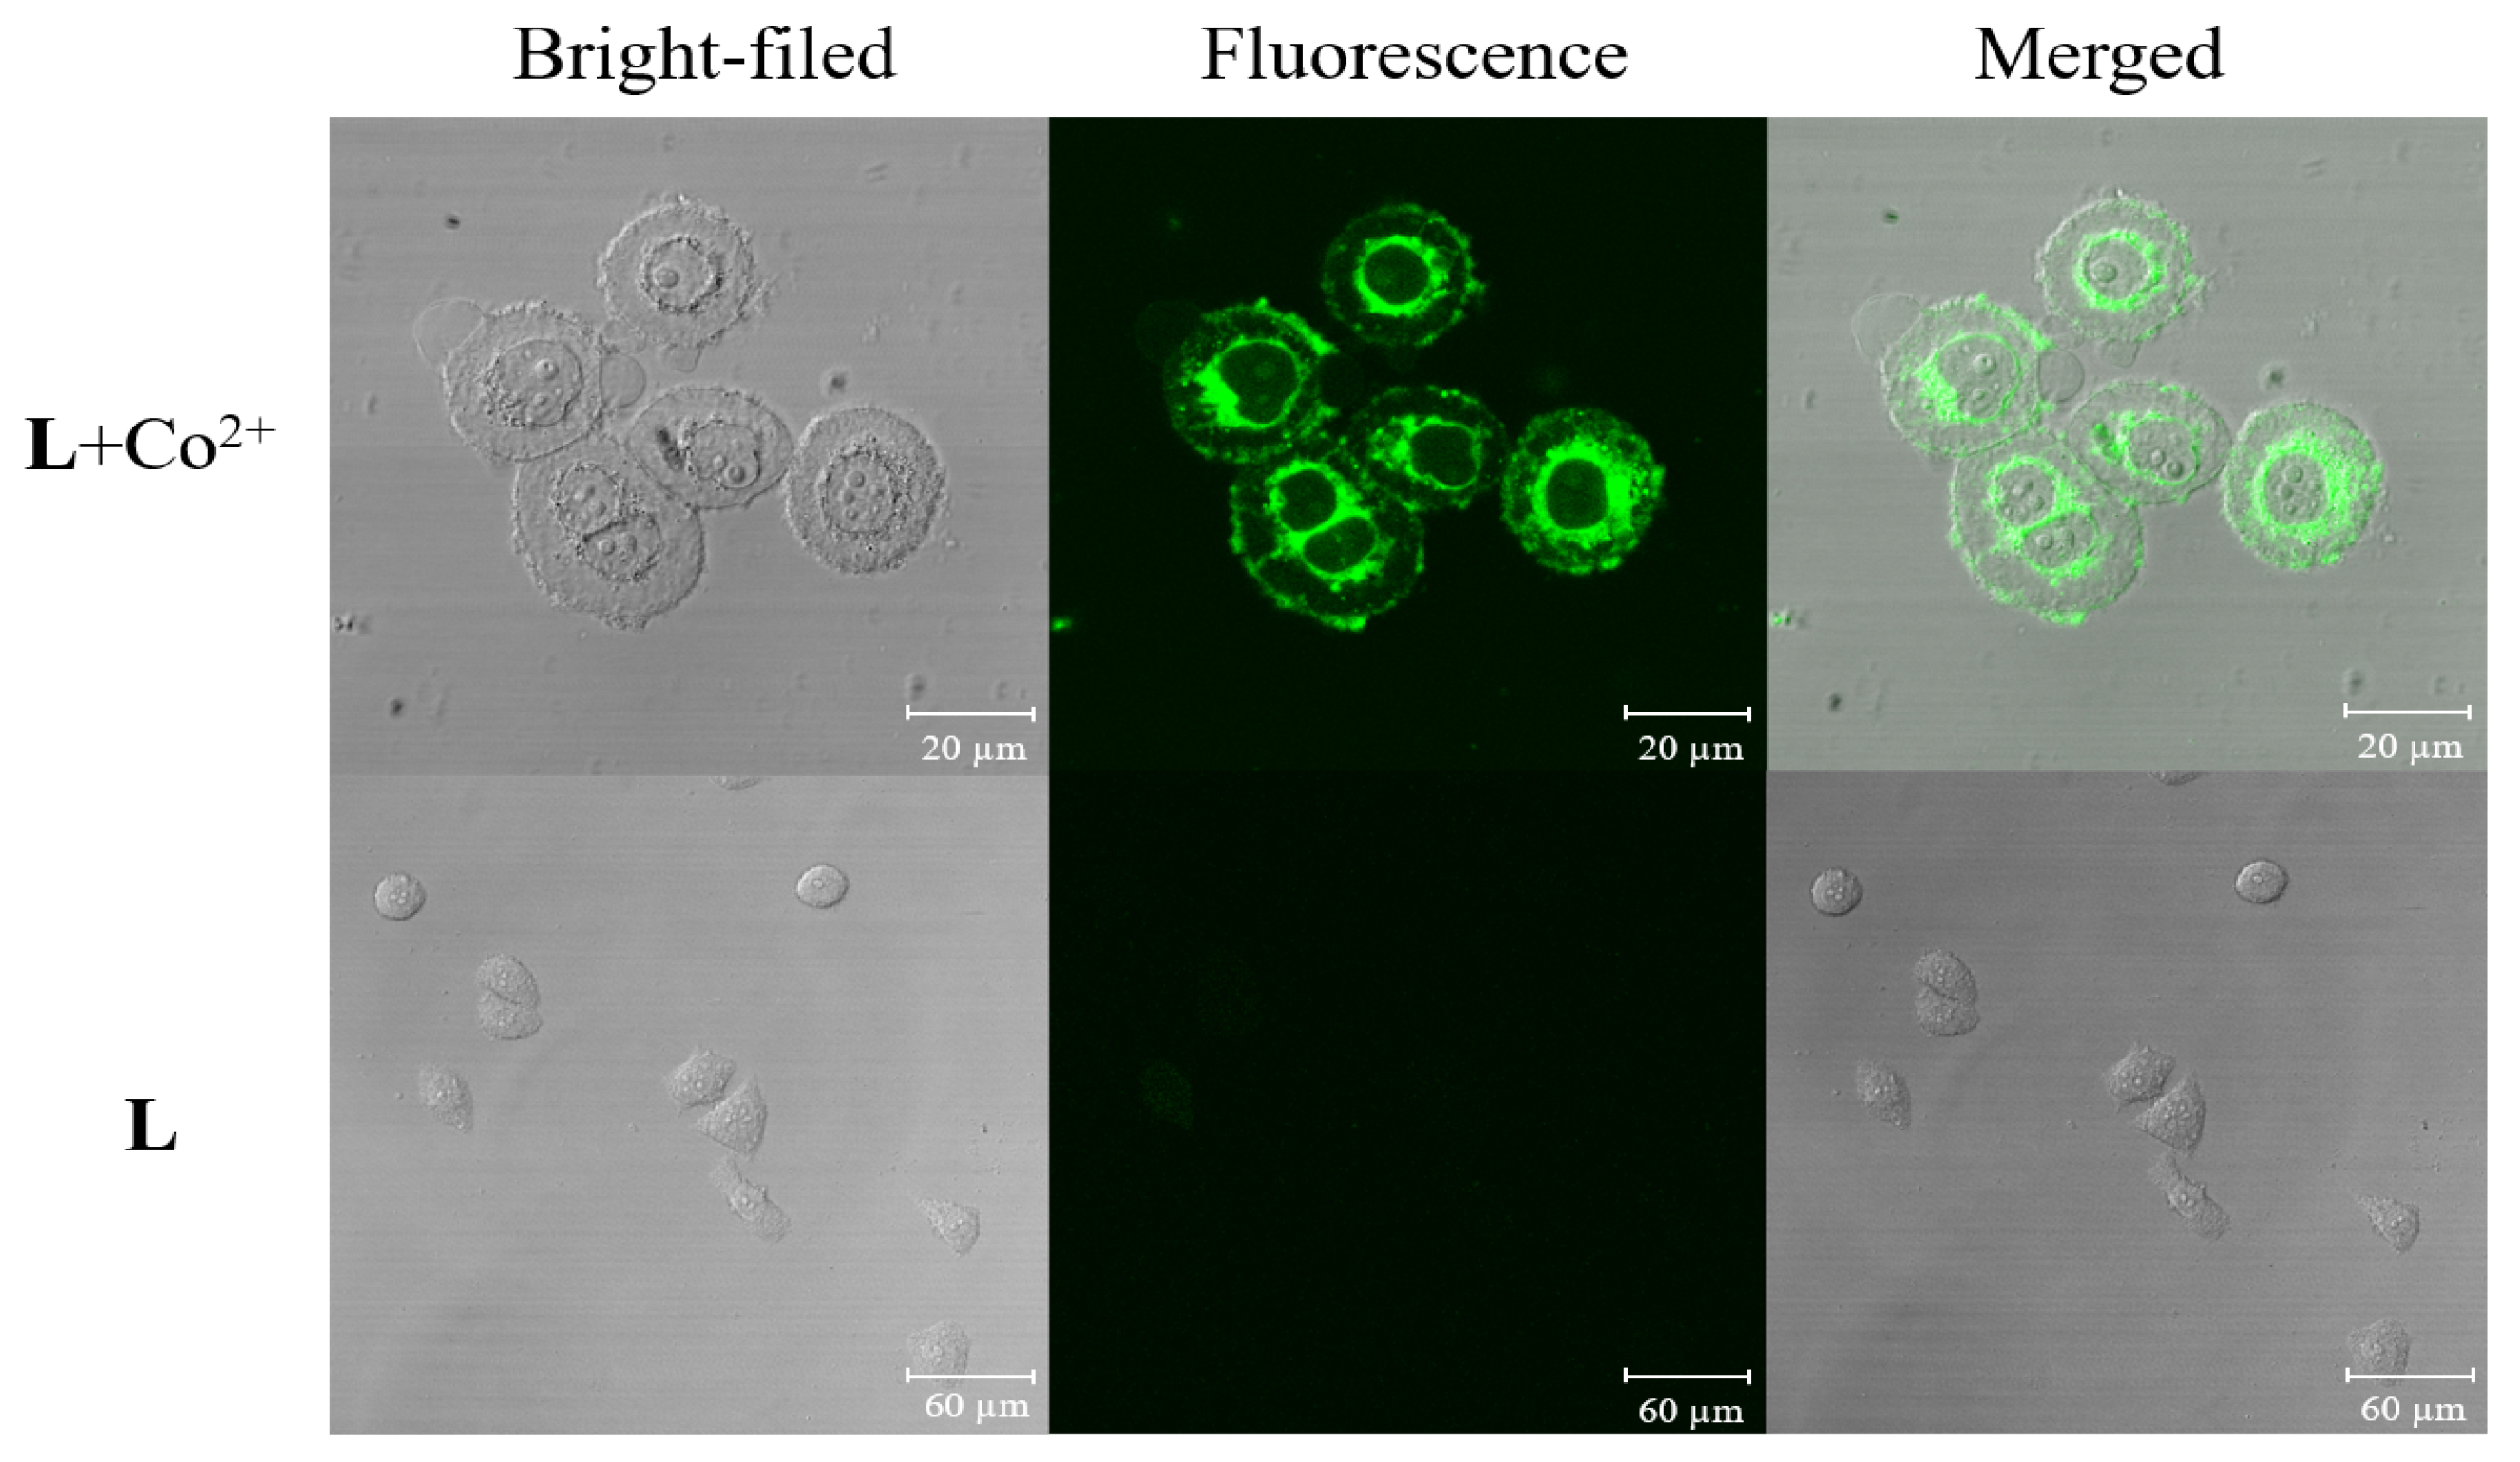
2.7. Cell Imaging
3. Experimental Section
3.1. Materials and Instrumentation
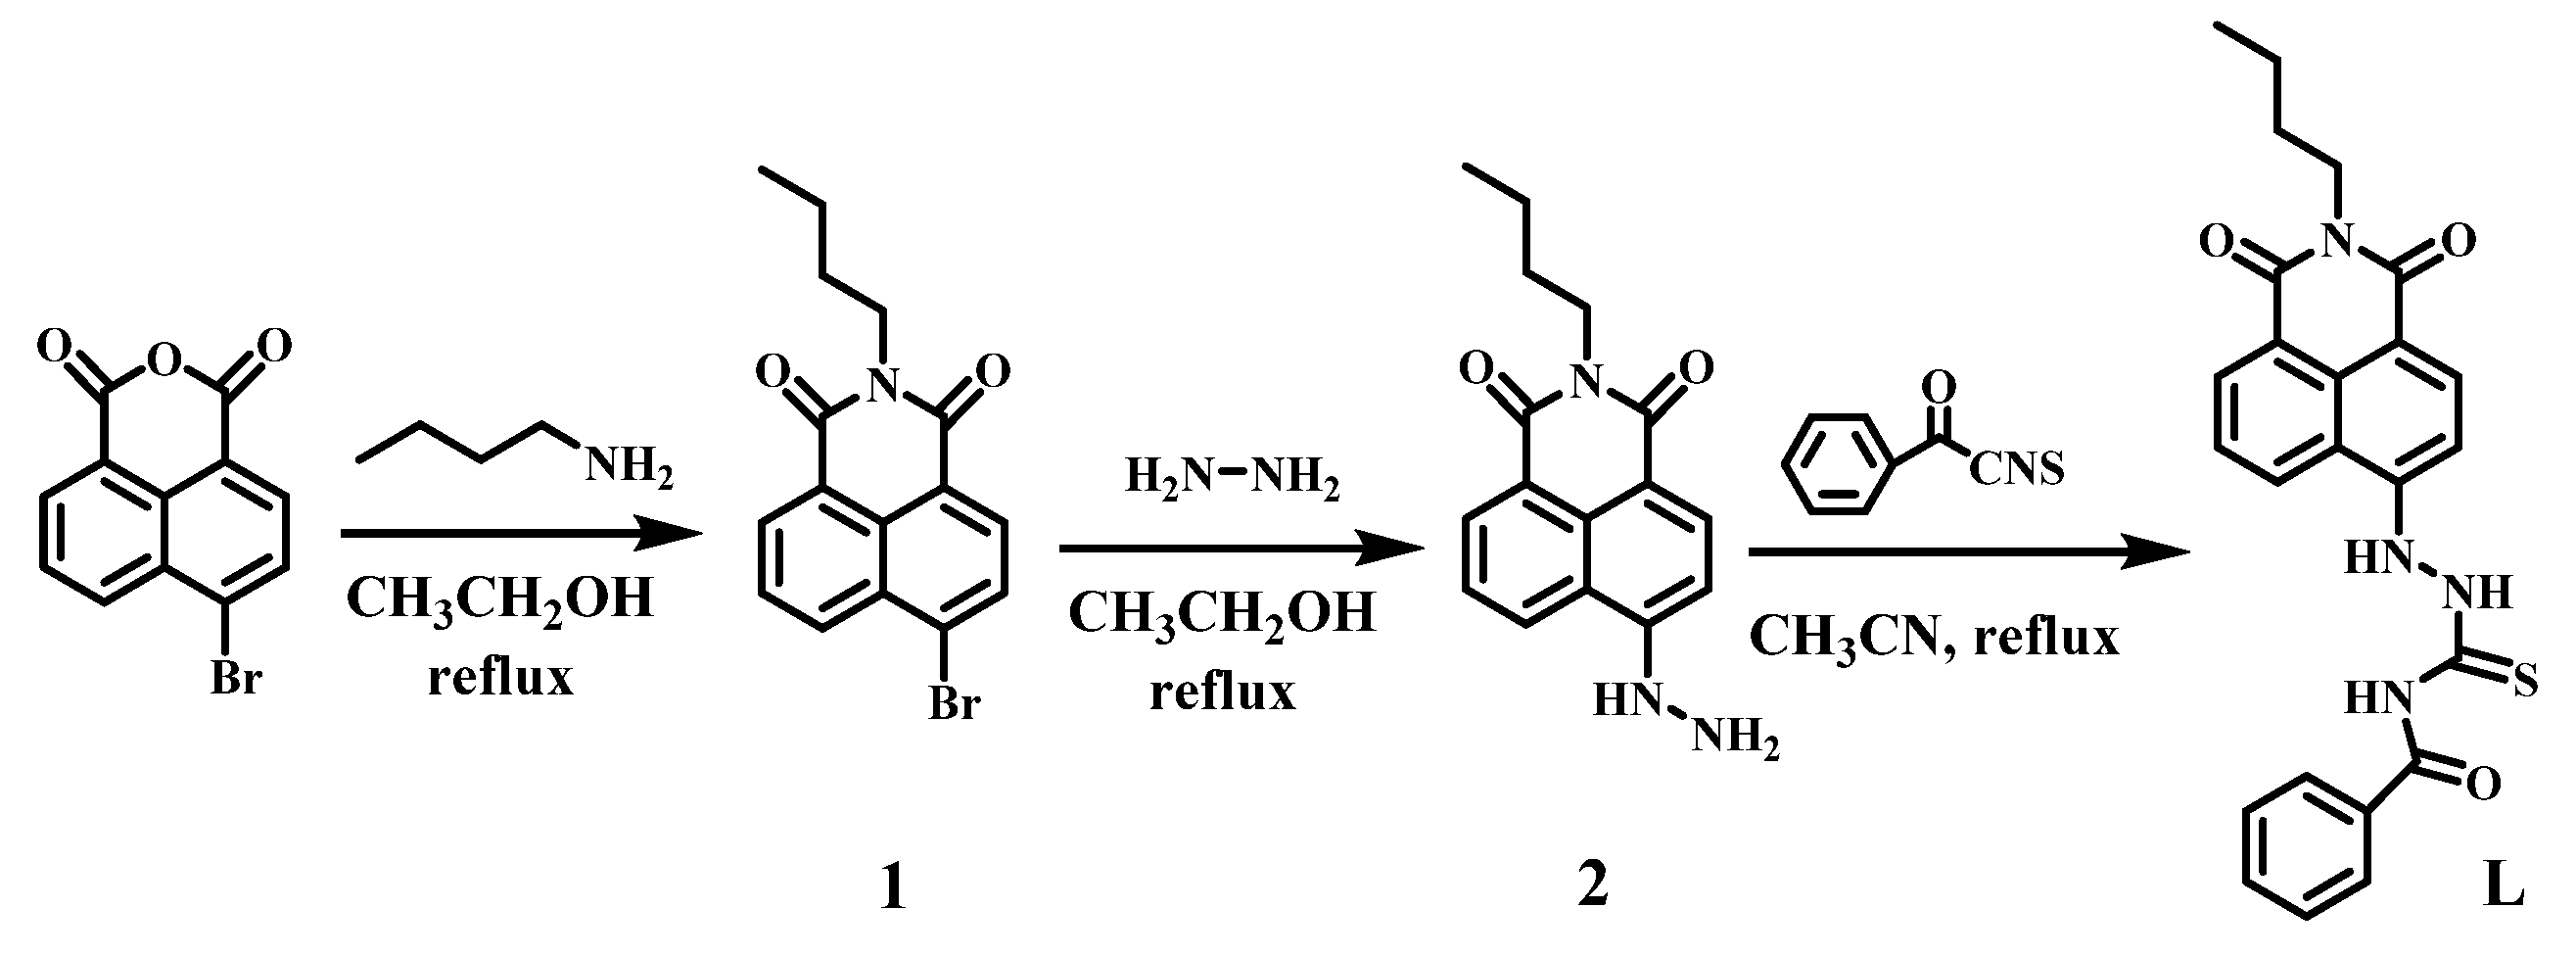
3.2. Synthesis of Compound L
3.3. Testing and Calculating Methods
3.4. Theoretical Calculations Methods
3.5. Cell Incubation and Cell Imaging
4. Conclusions
Supplementary Materials
Author Contributions
Funding
Conflicts of Interest
References
- Weller, D.; Brändle, H.; Gorman, G.; Lin, C.J.; Notarys, H. Magnetic and magneto-optical properties of cobalt-platinum alloys with perpendicular magnetic anisotropy. App. Phys. Lett. 1992, 61, 2726–2728. [Google Scholar] [CrossRef]
- Amatucci, G.G.; Tarascon, J.M.; Klein, L.C. Cobalt dissolution in LiCoO2-based non-aqueous rechargeable batteries. Solid State Ion. 1996, 83, 167–173. [Google Scholar] [CrossRef]
- Wakabayashi, K.; Yorimitsu, H.; Oshima, H. Cobalt-catalyzed tandem radical cyclization and cross-coupling reaction: Its application to benzyl-substituted heterocycles. J. Am. Chem. Soc. 2001, 123, 5374–5375. [Google Scholar] [CrossRef] [PubMed]
- Gray, H.B. Biological inorganic chemistry at the beginning of the 21st century. Proc. Natl. Acad. Sci. USA 2003, 100, 3563–3568. [Google Scholar] [CrossRef] [Green Version]
- Okamoto, S.; Eltis, L.D. The biological occurrence and trafficking of cobalt. Metallomics 2011, 3, 963–970. [Google Scholar] [CrossRef]
- Kim, B.E.; Nevitt, T.; Thiele, D.J. Mechanisms for copper acquisition, distribution and regulation. Nat. Chem. Biol. 2008, 4, 176–185. [Google Scholar] [CrossRef]
- Basketter, D.A.; Angelini, G.; Ingber, A.; Kern, P.S.; Menné, T. Nickel, chromium and cobalt in consumer products: Revisiting safe levels in the new millennium. Contact Dermat. 2003, 49, 1–7. [Google Scholar] [CrossRef]
- Shirakawa, T.; Fujimura, N.; Kato, M.; Morimoto, K. Occupational asthma from cobalt sensitivity in workers exposed to hard metal dust. Chest 1989, 95, 29–37. [Google Scholar] [CrossRef]
- Agency for Toxic Substances and Disease Registry (ATSDR). Toxicological Profile for Cobalt; Public Health Service, U.S. Department of Health and Human Services: Atlanta, GA, USA, 1992.
- Khorrami, A.R.; Fakhari, A.R.; Shamsipur, M.; Naeimi, H. Pre-concentration of ultra trace amounts of copper, zinc, cobalt and nickel in environmental water samples using modified C18 extraction disks and determination by inductively coupled plasma–optical emission spectrometry. Environ. Anal. Chem. 2009, 89, 319–329. [Google Scholar] [CrossRef]
- Shokou, N.; Shemirani, F.; Memarzadeh, F. Fiber optic-linear array detection spectrophotometry in combination with cloud point extraction for simultaneous preconcentration and determination of cobalt and nickel. Anal. Chim. Acta 2007, 601, 204–211. [Google Scholar] [CrossRef]
- Homola, J.; Yee, S.S.; Gauglitz, G. Surface plasmon resonance sensors: Review. Sens. Actuators B Chem. 1999, 54, 3–15. [Google Scholar] [CrossRef]
- Tsoutsi, D.; Guerrini, L.; Hermida-Ramon, J.M.; Giannini, V.; Liz-Marzan, L.M.; Wei, A.; Alvarez-Puebla, R.A. Simultaneous SERS detection of copper and cobalt at ultratrace levels. Nanoscale 2013, 5, 5841–5846. [Google Scholar] [CrossRef]
- Lok, K.S.; Lee, P.P.F.; Kwok, Y.C.; Nguyen, N.T. Rapid determination of vitamin B12 concentration with a chemiluminescence lab on a chip. Lab Chip 2012, 12, 2353–2361. [Google Scholar] [CrossRef]
- Mashraqui, S.H.; Chandiramani, M.; Betkar, R.; Poonia, K. A simple internal charge transfer probe offering dual optical detection of Co(II) via color and fluorescence modulations. Tetrahedron Lett. 2010, 51, 1306–1308. [Google Scholar] [CrossRef]
- Vashisht, D.; Kaur, K.; Jukaria, R.; Vashisht, A.; Sharma, S.; Mehta, S.K. Colorimetric chemosensor based on coumarin skeleton for selective naked eye detection of cobalt(II) ion in near aqueous medium. Sens. Actuators B Chem. 2019, 280, 219–226. [Google Scholar] [CrossRef]
- Lee, S.Y.; Kim, S.Y.; Kim, J.A.; Kim, C. A dual chemosensor: Colorimetric detection of Co2+ and fluorometric detection of Zn2+. J. Lumin. 2016, 179, 602–609. [Google Scholar] [CrossRef]
- Wang, L.; Gong, X.; Bing, Q.J. A new oxadiazole-based dual-mode chemosensor: Colorimetric detection of Co2+ and fluorometric detection of Cu2+ with high selectivity and sensitivity. Microchem. J. 2018, 142, 279–287. [Google Scholar] [CrossRef]
- Liu, Z.D.; Wang, W.L.; Xu, H.J.; Sheng, L.Q.; Chen, S.S.; Huang, D.Q.; Sun, F. A “naked eye” and ratiometric chemosensor for cobalt(II) based on coumarin platform in aqueous solution. Inorg. Chem. Commun. 2015, 62, 19–23. [Google Scholar] [CrossRef]
- Ryu, K.Y.; Lee, S.Y.; Park, D.Y.; Kim, S.Y.; Kim, C. A novel colorimetric chemosensor for detection of Co2+ and S2− in an aqueous environment. Sens. Actuators B Chem. 2016, 242, 792–800. [Google Scholar] [CrossRef]
- Sohrabi, M.; Amirnasr, M.; Meghdadi, S.; Lutz, M.; Torbati, M.B.; Farrokhpour, H. A highly selective fluorescence turn-on chemosensor for Zn2+, and its application in live cell imaging, and as a colorimetric sensor for Co2+: Experimental and TD-DFT calculations. New J. Chem. 2018, 42, 12595–12606. [Google Scholar] [CrossRef]
- Na, Y.J.; Choi, Y.W.; You, G.R.; Kim, C. A novel selective colorimetric chemosensor for cobalt ions in a near perfect aqueous solution. Sens. Actuators B Chem. 2016, 223, 234–240. [Google Scholar] [CrossRef]
- Jung, J.M.; Lee, S.Y.; Kim, C. A novel colorimetric chemosensor for multiple target metal ions Fe2+, Co2+, and Cu2+ in a near-perfect aqueous solution: Experimental and theoretical studies. Sens. Actuators B Chem. 2017, 251, 291–301. [Google Scholar] [CrossRef]
- Lee, S.Y.; Lee, J.J.; Bok, K.H.; Kim, S.Y.; Kim, C. Highly selective and sensitive colorimetric chemosensor for detection of Co2+ in a near-perfect aqueous solution. RSC Adv. 2016, 6, 28081–28088. [Google Scholar] [CrossRef]
- Liu, K.; Guo, P.; Liu, L.J.; Shi, X.F. Fluorescence enhancement of a novel pyrazine coupled rhodamine derivative for the paramagnetic Co2+ detection. Sens. Actuators B Chem. 2017, 250, 667–672. [Google Scholar] [CrossRef]
- Chen, H.; Yuan, F.; Xu, J.; Zhang, Y.; Wu, Y.; Wang, L. Simple and sensitive detection method for Cobalt(II) in water using CePO4:Tb3+ nanocrystals as fluorescent probes. Spectrochim. Acta Part A 2013, 107, 151–155. [Google Scholar] [CrossRef]
- Zi, L.; Huang, Y.; Yan, Z.; Liao, S. Thioglycolic acid-capped CuInS2/ZnS quantum dots as fluorescent probe for cobalt ion detection. J. Lumin. 2014, 148, 359–363. [Google Scholar] [CrossRef]
- Zhao, L.; Li, H.Y.; Liu, H.C.; Liu, M.T.; Huang, N.; He, Z.Y.; Li, Y.; Chen, Y.H.; Ding, L. Microwave-assisted facile synthesis of polymer dots as a fluorescent probe for detection of cobalt(II) and manganese(II). Anal. Bioanal. Chem. 2019, 411, 2373–2381. [Google Scholar] [CrossRef]
- Mohandoss, S.; Stalin, T. A new fluorescent PET sensor probe for Co2+ ion detection: Computational, logic device and living cell imaging applications. RSC Adv. 2017, 7, 16581–16593. [Google Scholar] [CrossRef]
- Fu, Y.L.; Fan, C.B.; Liu, G.; Pu, S.Z. A colorimetric and fluorescent sensor for Cu2+ and F− based on a diarylethene with a 1,8-naphthalimide Schiff base unit. Sens. Actuators B Chem. 2017, 239, 295–303. [Google Scholar] [CrossRef]
- Zhang, J.F.; Zhou, Y.; Yoon, J.; Kim, Y.; Kim, S.J.; Kim, J.S. Naphthalimide modified rhodamine derivative: Ratiometric and selective fluorescent sensor for Cu2+ based on two different approaches. Org. Lett. 2010, 12, 3852–3855. [Google Scholar] [CrossRef]
- Liu, T.Y.; Xu, Z.C.; Spring, D.R.; Cui, J.N. A lysosome-targetable fluorescent probe for imaging hydrogen sulfide in living cells. Org. Lett. 2013, 15, 2310–2313. [Google Scholar] [CrossRef]
- Karagöz, E.; Varol, S.F.; Sayin, S.; Merdan, Z. Electrical characterization of two analogous Schottky contacts produced from N-substituted 1,8-naphthalimide. Phys. Chem. Chem. Phys. 2018, 20, 30502–30513. [Google Scholar] [CrossRef]
- Ye, F.; Liang, X.M.; Wu, N.; Li, P.; Chai, Q.; Fu, Y. A new perylene-based fluorescent pH chemosensor for strongly acidic condition. Spectrochim. Acta A 2019, 216, 359–364. [Google Scholar] [CrossRef]
- Fu, Y.; Pang, X.X.; Wang, Z.Q.; Chai, Q.; Ye, F. A highly sensitive and selective fluorescent probe for determination of Cu(II) and application in live cell imaging. Spectrochim. Acta A 2019, 208, 198–205. [Google Scholar] [CrossRef]
- Ye, F.; Wu, N.; Li, P.; Liu, Y.L.; Li, S.J.; Fu, Y. A lysosome-targetable fluorescent probe for imaging trivalent cations Fe3+, Al3+ and Cr3+ in living cells. Spectrochim. Acta A 2019, 222, 117242. [Google Scholar] [CrossRef]
- Ye, F.; Liang, X.M.; Xu, K.X.; Pang, X.X.; Chai, Q.; Fu, Y. A novel dithiourea-appended naphthalimide “on-off” fluorescent probe for detecting Hg2+ and Ag+ and its application in cell imaging. Talanta 2019, 200, 494–502. [Google Scholar] [CrossRef]
- Zhang, Y.Z.; Lu, S.Z.; Sha, C.M.; Xu, D.M. A single thiourea-appended 1,8-naphthalimide chemosensor for three heavy metal ions: Fe3+, Pb2+, and Hg2+. Sens. Actuators B Chem. 2015, 208, 258–266. [Google Scholar] [CrossRef]
- Vonlanthen, M.; Finney, N.S. Thioureas as reporting elements for metal-responsive fluorescent chemosensors. J. Org. Chem. 2013, 78, 3980–3988. [Google Scholar] [CrossRef]
- Alaei, P.; Rouhani, S.; Gharanjig, K.; Ghasemi, J. A new polymerizable fluorescent PET chemosensor of fluoride (F−) based on naphthalimide-thiourea dye. Spectrochim. Acta A 2012, 90, 85–92. [Google Scholar] [CrossRef]
- Tang, Y.H.; Kong, X.Q.; Xu, A.; Dong, B.L.; Lin, W.Y. Development of a two-photon fluorescent probe for imaging of endogenous formaldehyde in living tissues. Angew. Chem. Int. Ed. 2016, 55, 3356–3359. [Google Scholar] [CrossRef]
- Grabowski, Z.R.; Rotkiewicz, K.; Rettig, W. Structural changes accompanying intramolecular electron transfer: Focus on twisted intramolecular charge-transfer states and structures. Chem. Rev. 2003, 103, 3899–4031. [Google Scholar] [CrossRef]
- Chen, Z.J.; Wang, L.M.; Zou, G.; Tang, J.; Cai, X.F.; Teng, M.S.; Chen, L. Highly selective fluorescence turn-on chemosensor based on naphthalimide derivatives for detection of copper(II) ions. Spectrochim. Acta Part A 2013, 105, 57–61. [Google Scholar] [CrossRef]
- Duke, R.M.; Veale, E.B.; Pfeffer, F.M.; Kruger, P.E.; Gunnlaugsson, T. Colorimetric and fluorescent anion sensors: An overview of recent developments in the use of 1,8-naphthalimide-based chemosensors. Chem. Soc. Rev. 2010, 39, 3936–3953. [Google Scholar] [CrossRef]
- Parthiban, C.; Ciattini, S.; Ciattinia, L.; Elango, K.P. Colorimetric sensing of anions by Cu(II), Co(II), Ni(II) and Zn(II) complexes of naphthoquinone-imidazole hybrid—Influence of complex formation on selectivity and sensing medium. Sens. Actuators B Chem. 2016, 231, 768–778. [Google Scholar] [CrossRef]
- Escudero, D. Revising intramolecular photoinduced electron transfer (PET) from first-principles. Acc. Chem. Res. 2016, 49, 1816–1824. [Google Scholar] [CrossRef]
- Inoue, K.; Aikawa, S.; Sakamaki, M.; Sakamaki, Y. Colorimetric Co2+ sensor based on an anionic pyridylazo dye and a cationic polyelectrolyte in aqueous solution. Polym. Int. 2018, 67, 1589–1594. [Google Scholar] [CrossRef]
- Lim, N.C.; Shuster, J.V.; Porto, M.C.; Tanudra, M.A.; Yao, L.; Freake, H.C.; Brückner, C. Coumarin-based chemosensors for Zinc(II): Toward the determination of the design algorithm for CHEF-type and ratiometric probes. Inorg. Chem. 2005, 45, 2018–2030. [Google Scholar] [CrossRef]
- Gorse, A.D.; Pesquer, M. Intramolecular charge transfer excited state relaxation processes in para-substituted N,N-Dimethylaniline: A theoretical study including solvent effects. J. Phys. Chem. 1995, 99, 4039–4049. [Google Scholar] [CrossRef]
- Balzani, V. (Ed.) Electron Transfer in Chemistry; Wiley-VCH: Weinheim, Germany, 2001. [Google Scholar]
- Natali, M.; Campagna, S.; Scandola, F. Photoinduced Electron Transfer across Molecular Bridges: Electron- and Hole-Transfer Superexchange Pathways. Chem. Soc. Rev. 2014, 43, 4005–4018. [Google Scholar] [CrossRef]
- Daly, B.; Ling, J.; de Silva, A.P. Current Developments in Fluorescent PET (Photoinduced Electron Transfer) Sensors and Switches. Chem. Soc. Rev. 2015, 44, 4203–4211. [Google Scholar] [CrossRef]
- Stennett, E.M.S.; Ciuba, M.A.; Levitus, M. Photophysical Processes in Single Molecule Organic Fluorescent Probes. Chem. Soc. Rev. 2014, 43, 1057–1075. [Google Scholar] [CrossRef]
- Sinha, S.; Mukherjee, T.; Mathew, J.; Mukhopadhyay, S.K.; Ghosh, S. Triazole-based Zn2+-specific molecular marker for fluorescence bioimaging. Anal. Chim. Acta 2014, 822, 60–68. [Google Scholar] [CrossRef]
- Nagarkar, S.S.; Joarder, B.; Chaudhari, A.K.; Mukherje, S.; Ghosh, S.K. Highly selective detection of nitro explosives by a luminescent metal-organic framework. Angew. Chem. Int. Ed. 2013, 52, 2881–2885. [Google Scholar] [CrossRef]
- Fu, Y.; Li, P.; Kang, J.X.; Liu, X.Y.; Li, G.Y.; Ye, F. A novel 1,8-naphthalimide derivative as an efficient silver(I) fluorescent sensor. J. Lumin. 2016, 178, 156–162. [Google Scholar] [CrossRef]
- Xu, L.; Xu, Y.F.; Zhu, W.P.; Yang, C.M.; Han, L.; Qian, X.H. A highly selective and sensitive fluorescence “turn-on” probe for Ag+ in aqueous solution and live cells. Dalton Trans. 2012, 41, 7212–7217. [Google Scholar] [CrossRef]
Sample Availability: Samples of the compounds are not available from the authors. |


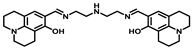
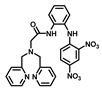
| Structure of Probes | Working Media | LOD (µM) | pH | Ref. |
|---|---|---|---|---|
 | CH3CN | 7.09 | 2–11 | [16] |
 | Bis-tris buffer | 0.34 | No statement | [17] |
 | CH3CN | 3.92 | No statement | [18] |
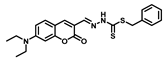 | H2O | 0.31 | 5.5–10.5 | [19] |
 | H2O | 0.99 | No statement | [20] |
 | CH3CN | 23.4 | No statement | [21] |
 | Bis-tris buffer | 1.80 | 6–10 | [22] |
 | Bis-tris buffer | 0.11 | 7 | [23] |
 | Bis-tris buffer | 0.65 | 7–11 | [24] |
 | THF/Tris-HCl buffer-solution (4/6, v/v) | 0.31 | 7.5 | [25] |
 | CH3CN/HEPES (4/1, v/v) | 0.26 | 4–12 | Present work |
© 2019 by the authors. Licensee MDPI, Basel, Switzerland. This article is an open access article distributed under the terms and conditions of the Creative Commons Attribution (CC BY) license (http://creativecommons.org/licenses/by/4.0/).
Share and Cite
Liu, Y.-L.; Yang, L.; Li, L.; Guo, Y.-Q.; Pang, X.-X.; Li, P.; Ye, F.; Fu, Y. A New Fluorescent Chemosensor for Cobalt(II) Ions in Living Cells Based on 1,8-Naphthalimide. Molecules 2019, 24, 3093. https://doi.org/10.3390/molecules24173093
Liu Y-L, Yang L, Li L, Guo Y-Q, Pang X-X, Li P, Ye F, Fu Y. A New Fluorescent Chemosensor for Cobalt(II) Ions in Living Cells Based on 1,8-Naphthalimide. Molecules. 2019; 24(17):3093. https://doi.org/10.3390/molecules24173093
Chicago/Turabian StyleLiu, Yu-Long, Liu Yang, Lu Li, You-Quan Guo, Xiao-Xiao Pang, Ping Li, Fei Ye, and Ying Fu. 2019. "A New Fluorescent Chemosensor for Cobalt(II) Ions in Living Cells Based on 1,8-Naphthalimide" Molecules 24, no. 17: 3093. https://doi.org/10.3390/molecules24173093