Article

Quality Evaluation of Mahonia bealei (Fort.) Carr. Using Supercritical Fluid Chromatography with Chemical Pattern Recognition

1
Shenzhen Institute for Drug Control, Shenzhen 518057, China
2
State Key Laboratory of Natural Medicines, Department of Pharmaceutics, China Pharmaceutical University, Nanjing 210009, China
3
Institute of Pharmaceutical Analysis, College of Pharmacy, Jinan University, Guangzhou 510632, China
4
Shenzhen Key Laboratory of Drug Quality Standard Research, Shenzhen 518057, China
*
Authors to whom correspondence should be addressed.
Molecules 2019, 24(20), 3684; https://doi.org/10.3390/molecules24203684
Submission received: 3 September 2019 / Revised: 10 October 2019 / Accepted: 12 October 2019 / Published: 13 October 2019
(This article belongs to the Section Analytical Chemistry)

Abstract

:
Mahonia bealei (Fort.) Carr. (M. bealei) plays an important role in the treatment of many diseases. In the present study, a comprehensive method combining supercritical fluid chromatography (SFC) fingerprints and chemical pattern recognition (CPR) for quality evaluation of M. bealei was developed. Similarity analysis, hierarchical cluster analysis (HCA), principal component analysis (PCA) were applied to classify and evaluate the samples of wild M. bealei, cultivated M. bealei and its substitutes according to the peak area of 11 components but an accurate classification could not be achieved. PLS-DA was then adopted to select the characteristic variables based on variable importance in projection (VIP) values that responsible for accurate classification. Six characteristics peaks with higher VIP values (≥1) were selected for building the CPR model. Based on the six variables, three types of samples were accurately classified into three related clusters. The model was further validated by a testing set samples and predication set samples. The results indicated the model was successfully established and predictive ability was also verified satisfactory. The established model demonstrated that the developed SFC coupled with PLS-DA method showed a great potential application for quality assessment of M. bealei.

1. Introduction

Mahonia bealei (Fort.) Carr. (M. bealei) is a well-known traditional Chinese medicine (TCM) and has been used for the treatment of acute dysentery, icteric hepatitis conjunctivitis, etc. [1]. Nowadays, over 50 species of Mahonia plant grow in China. Several Mahonia plants such as Mahonia breviracema Y. S. Wang et Hsiao (M. breviracema Y. S. Wang et Hsiao), Mahonia duclouxiana Gagnep (M. duclouxiana Gagnep), Mahonia bodinieri Gagnep (M. bodinieri Gagnep), and Mahonia fordii Schneid (M. fordii Schneid) were utilized as substitutes of M. bealei in Chinese folk medicine [2,3]. In addition, with increasing medicinal use demand, the wild M. bealei has been overexploited. Therefore, cultivated M. bealei has become the main source to satisfy the market demand. To our knowledge, the cultivation environment might affect the chemical content compared to the wild growing environment, resulting in quality differences [4]. As far as we know, little attention has been paid to the quality differences between wild and cultivated M. bealei. The current Chinese Pharmacopoeia describes several alkaloids, including columbamine, jatrorrhizine, palmatine, and berberine, as the main bioactive compounds in M. bealei. These compounds could be considered as chemical markers for the quality control of M. bealei [1]. However, it was revealed that many common components (i.e. berberine, jateorhizine, palmatine) [5] have been reported in Mahonia species. Owing to the complex composition of Mahonia species, it is insufficient to perform quality assessment using only several chemical markers. Therefore, a method for comprehensive and effective evaluation of M. bealei is necessary based on their integral components.
Due to the typical complexity in composition of TCMs, fingerprint analysis have been accepted as an effective tool for evaluating the quality of TCMs without sacrificing reference standards that are usually highly expensive and far from need, such as high performance liquid chromatography (HPLC) [6,7], gas chromatography (GC) [8], near infrared spectroscopy (NIR) [9], high performance thin layer chromatography (HPTLC) [10], nuclear magnetic resonance (NMR) [11]. It also can offer the possibility of evaluating the quality of TCMs following the overall principle [12,13]. Among these techniques, HPLC has been the most widely used for fingerprint analysis. However, long analysis times were usually required in TCMs analysis in order to obtain a holistic chemical profile for HPLC fingerprints.
Supercritical fluid chromatography (SFC) using supercritical carbon dioxide as the major mobile phase has been applied in TCM analysis as a green technique. SFC displays several advantageous properties such as fast separation and high efficiency, as well as low consumption of organic solvents [14,15]. These features are highly beneficial from a chromatographic point of view to obtain a fast analysis and a good resolution, which can not only avoid the use of great amounts of organic solvents that are both toxic and expensive, but also provide more useful chemical information for SFC fingerprint analysis. However, SFC fingerprints of TCMs often contain highly complex multivariate data that make their interpretation difficult. Therefore, chemical pattern recognition (CPR) methods, such as hierarchical cluster analysis (HCA), principal component analysis (PCA) and partial least squares discriminant analysis (PLS-DA) could be considered as reasonable methods to simplify the complex data [8]. To our knowledge, there are no reports yet on the quality evaluation of M. bealei using SFC fingerprints with CPR.
The main aim of this study was to establish a reliable method using SFC fingerprints and CPR methods for the quality evaluation of M. bealei. For this purpose, wild M. bealei, cultivated M. bealei and four other M. bealei substitutes were chosen as study objects (Figure 1). Unsupervised (HCA and PCA) and supervised (PLS-DA) pattern recognition methods were both applied to analyze the obtained data in order to establish an accurate classification model. Thereafter, the established model was further validated by testing set samples. The predictive ability of the model was also evaluated by the statistical parameters of a prediction set. Interestingly, the method could not just provide an effective and comprehensive way to evaluate the quality of M. bealei, but could also allow their differentiation at the chemistry level.

2. Results and Discussion

2.1. Optimization of the Chromatographic Conditions

Four stationary phases, namely NH2, XAmide, Pyridine, and PFP were compared in order to obtain adequate selectivity using appropriate gradient elution (Table S1). As can be seen in Figure S1, the best selectivity was observed for the NH2 column. Thereafter, the detection wavelength was also optimized to obtain as much chemical information as possible. In terms of the number of peaks and peak intensity, 230 nm was selected as the optimal wavelength (Figure S2).
M. bealei was reported as rich being in alkaloids [16]. Considering the properties of alkaloids, different concentrations of diethylamine (0–0.8%, v/v) were added to improve the peak shape and selectivity. Finally, the best separation performance, with a resolution (Rs) of 1.64 for the critical pair (peaks 6 and 7, Figure S3) was obtained using 0.4% (v/v) diethylamine. In order to improve the retention of analytes, the use of a second additive (water) was investigated. It was found that retention was decreased when the amount of this additive was increased from 0 to 8% (v/v) water, the Rs value for peak 6 and 7 was increased from 1.31 to 2.55. However, the baseline drifted when a concentration of 8% (v/v) water was used (Figure S4), therefore, 5% (v/v) water was considered as the best compromise for the separation of analytes.
Backpressure (100–160 bar) and temperature (20–40 °C) were also investigated in order to further enhance the separation performance. It was found that the best Rs of the peaks 6 and 7 were obtained when the temperature and backpressure were set at 28 °C and 140 bar (Figures S5 and S6), respectively. Finally, these optimal conditions were applied to the analysis of extracts of wild M. bealei, cultivated M. bealei and its substitutes.

2.2. Repeatability and Stability Evaluation

The developed SFC fingerprint method was validated for repeatability, and stability. For the evaluation of repeatability six independent samples were prepared in parallel, according to Section 3.3. The relative standard deviations (RSDs) of peak area and retention time (RT) of 11 common peaks were less than 2.3% and 0.24%. The stability was assessed by repeatedly analyzing the same solution after being placed at room temperature for 0, 2, 4, 8, 12, and 24 h. The RSDs of peak area and RT of 11 common peaks were below 2.56% and 0.25%, respectively. These results indicated that the established SFC fingerprint method of M. bealei was stable and reliable.

2.3. SFC Fingerprint Analysis and Similarity Evaluation

Thirty seven SFC fingerprints of M. bealei (wild and cultivated) and its substitutes from the training set were established under the optimized conditions and then imported into the similarity evaluation system. Sample fingerprints were compared with fingerprint R to generate the similarity values. As a result, 11 common peaks were observed in SFC fingerprints (Figure 2). The similarity values between the generated fingerprint R and analyzed samples were in the range of 0.830 to 0.982 (Table 1). These results indicated that no significant difference was observed between these various samples. However, the contents of 11 common peaks were quite different, that might result in quality differences. Furthermore, CPR methods were employed to assess the variation in quality.

2.4. CPR Analysis

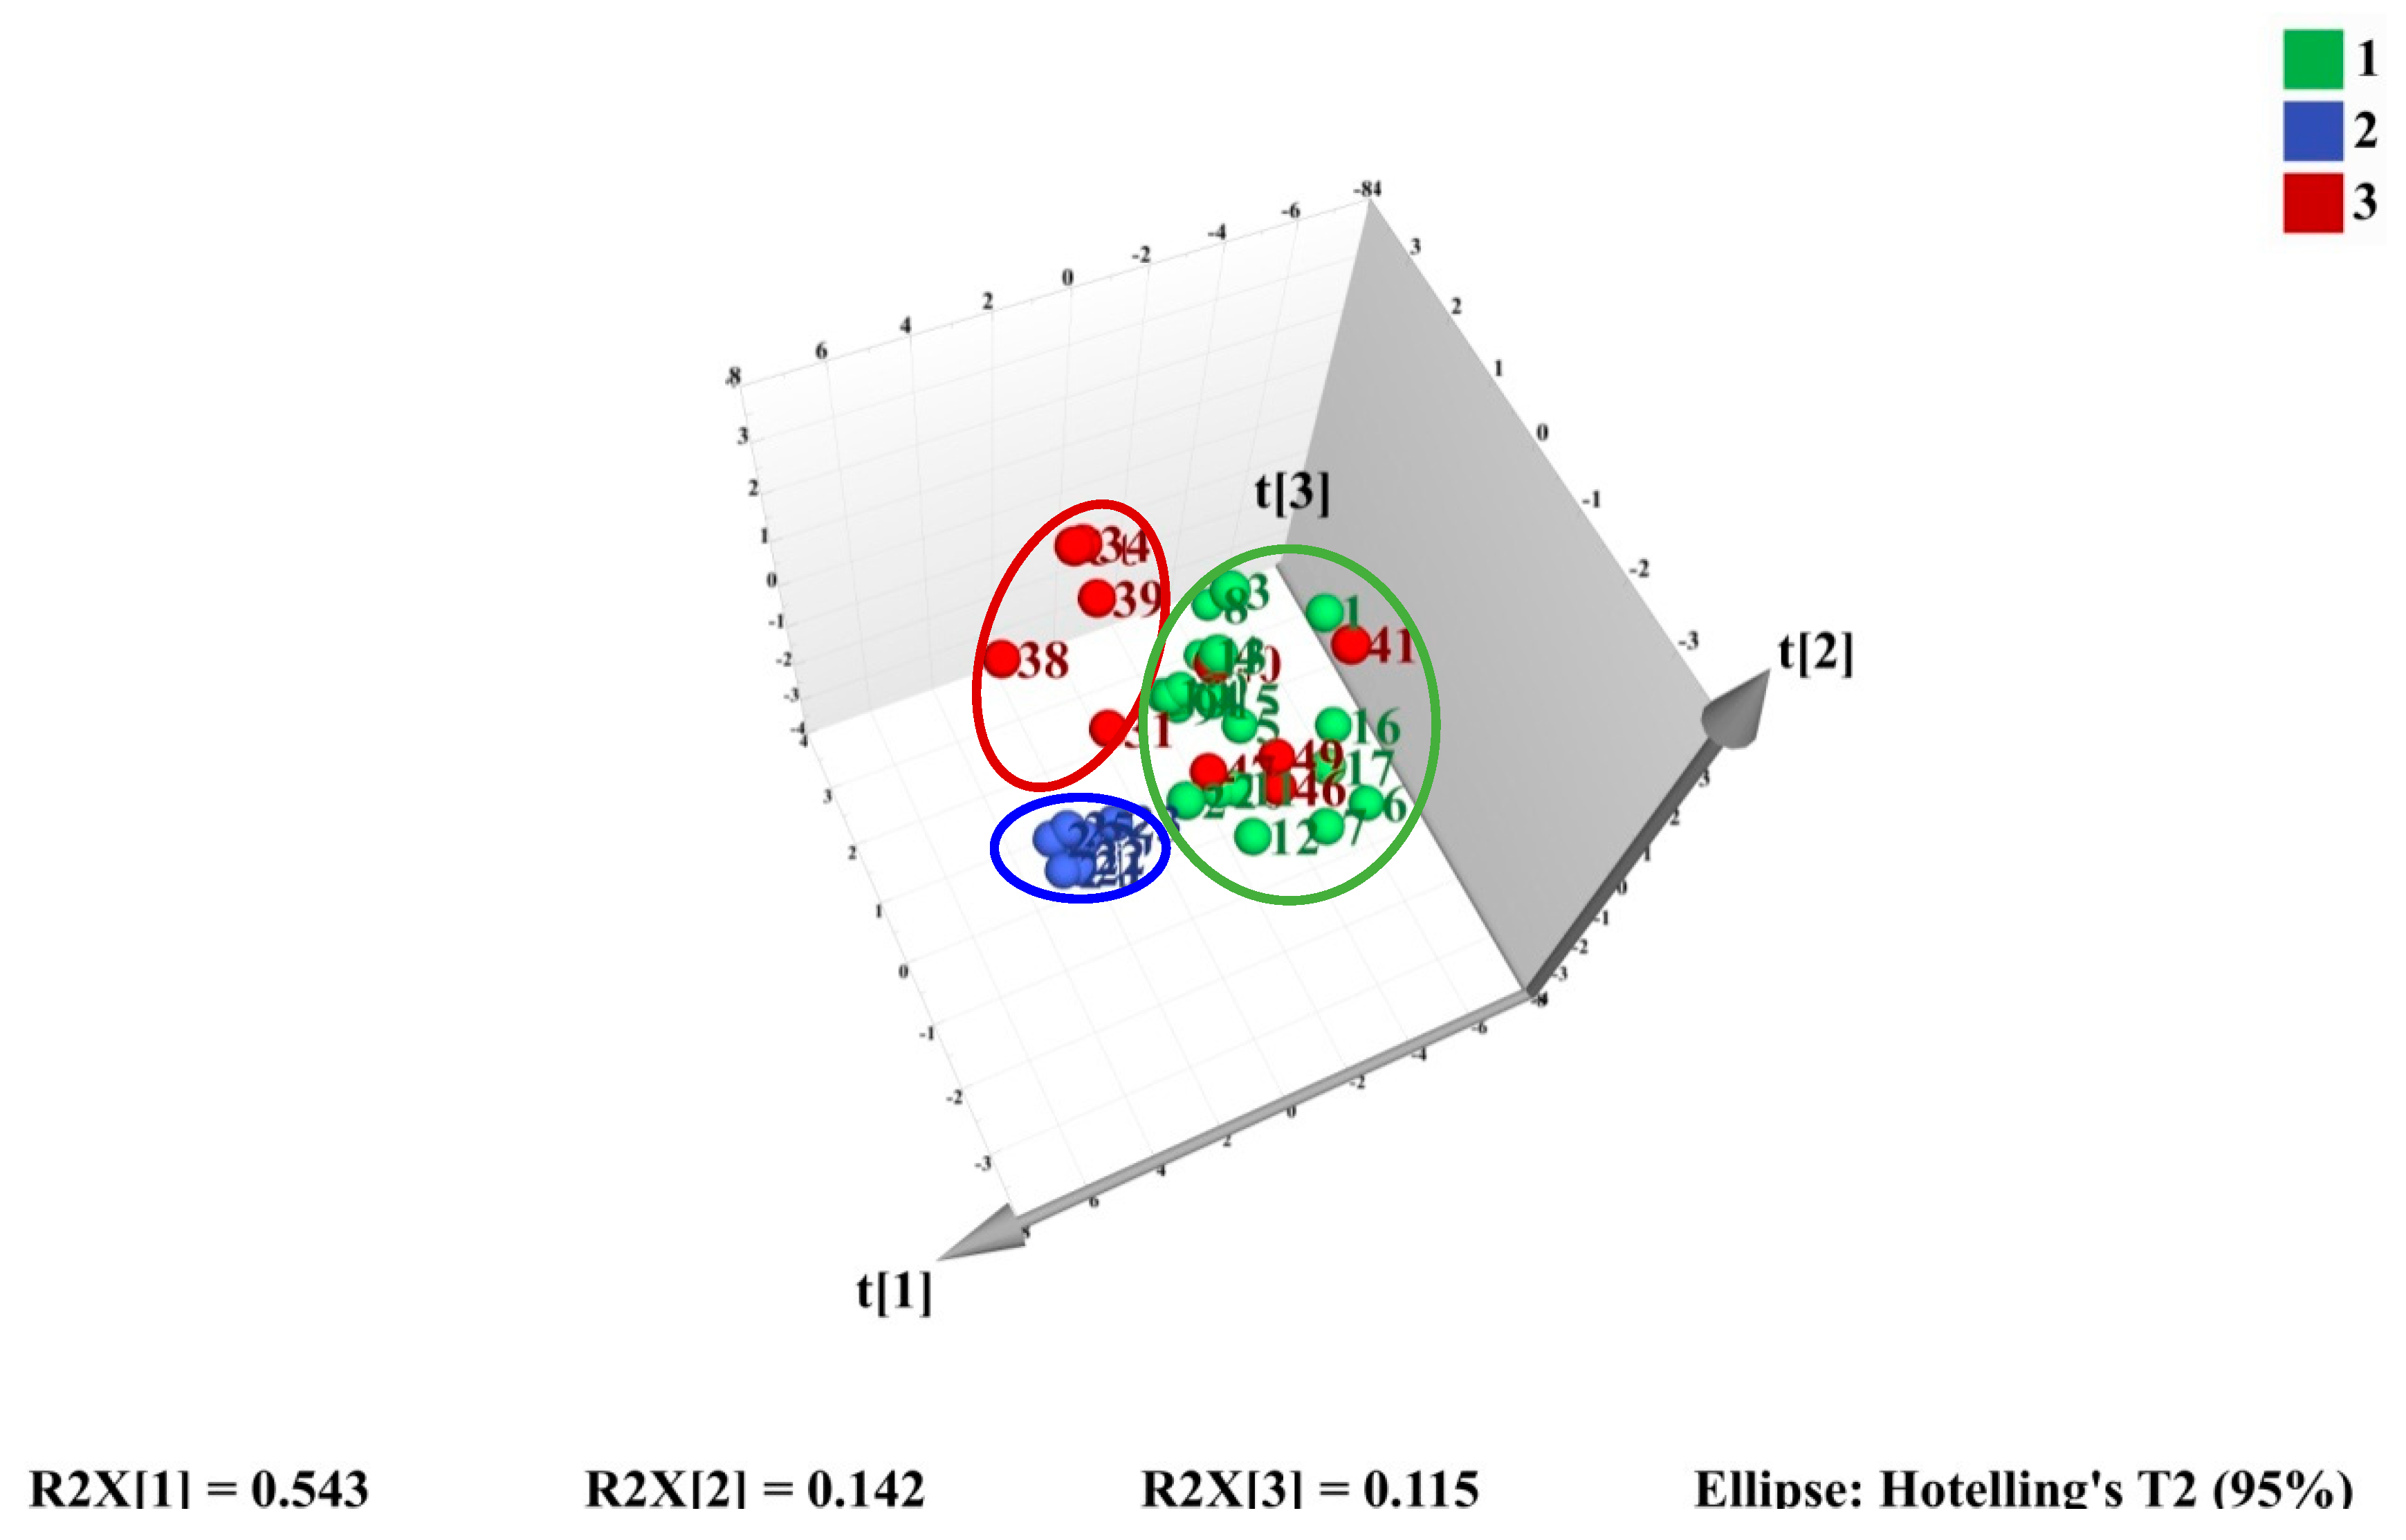
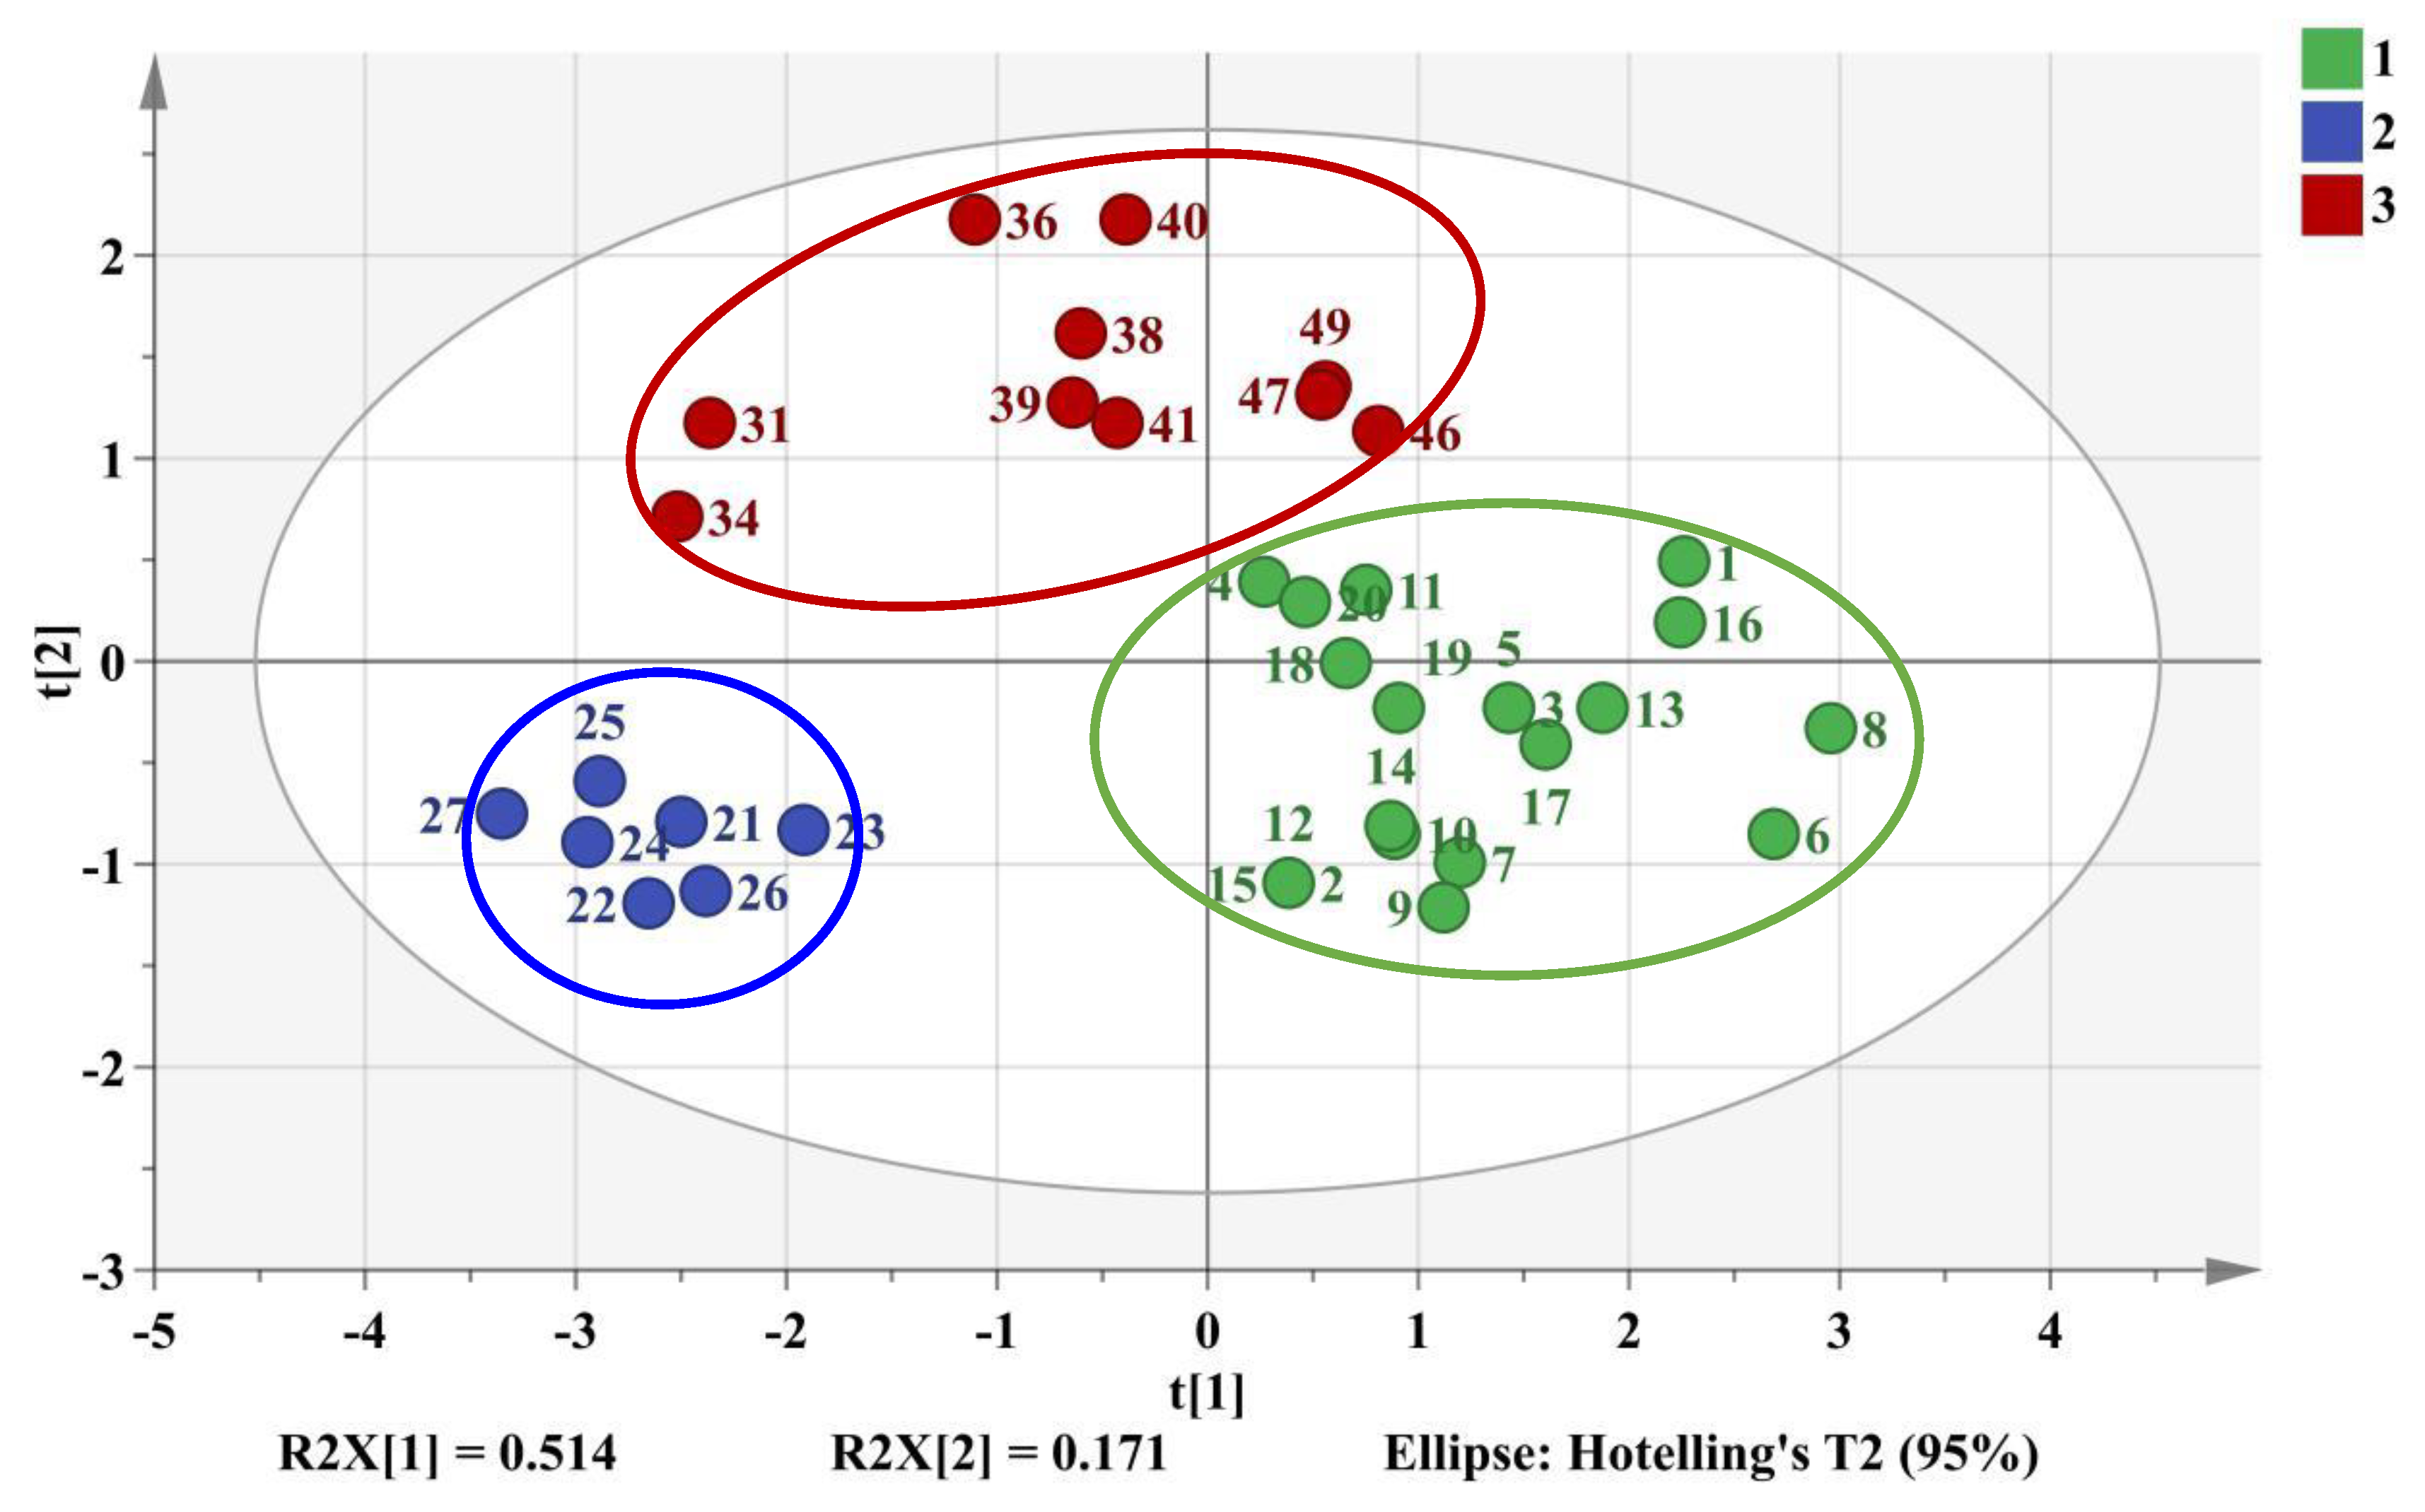
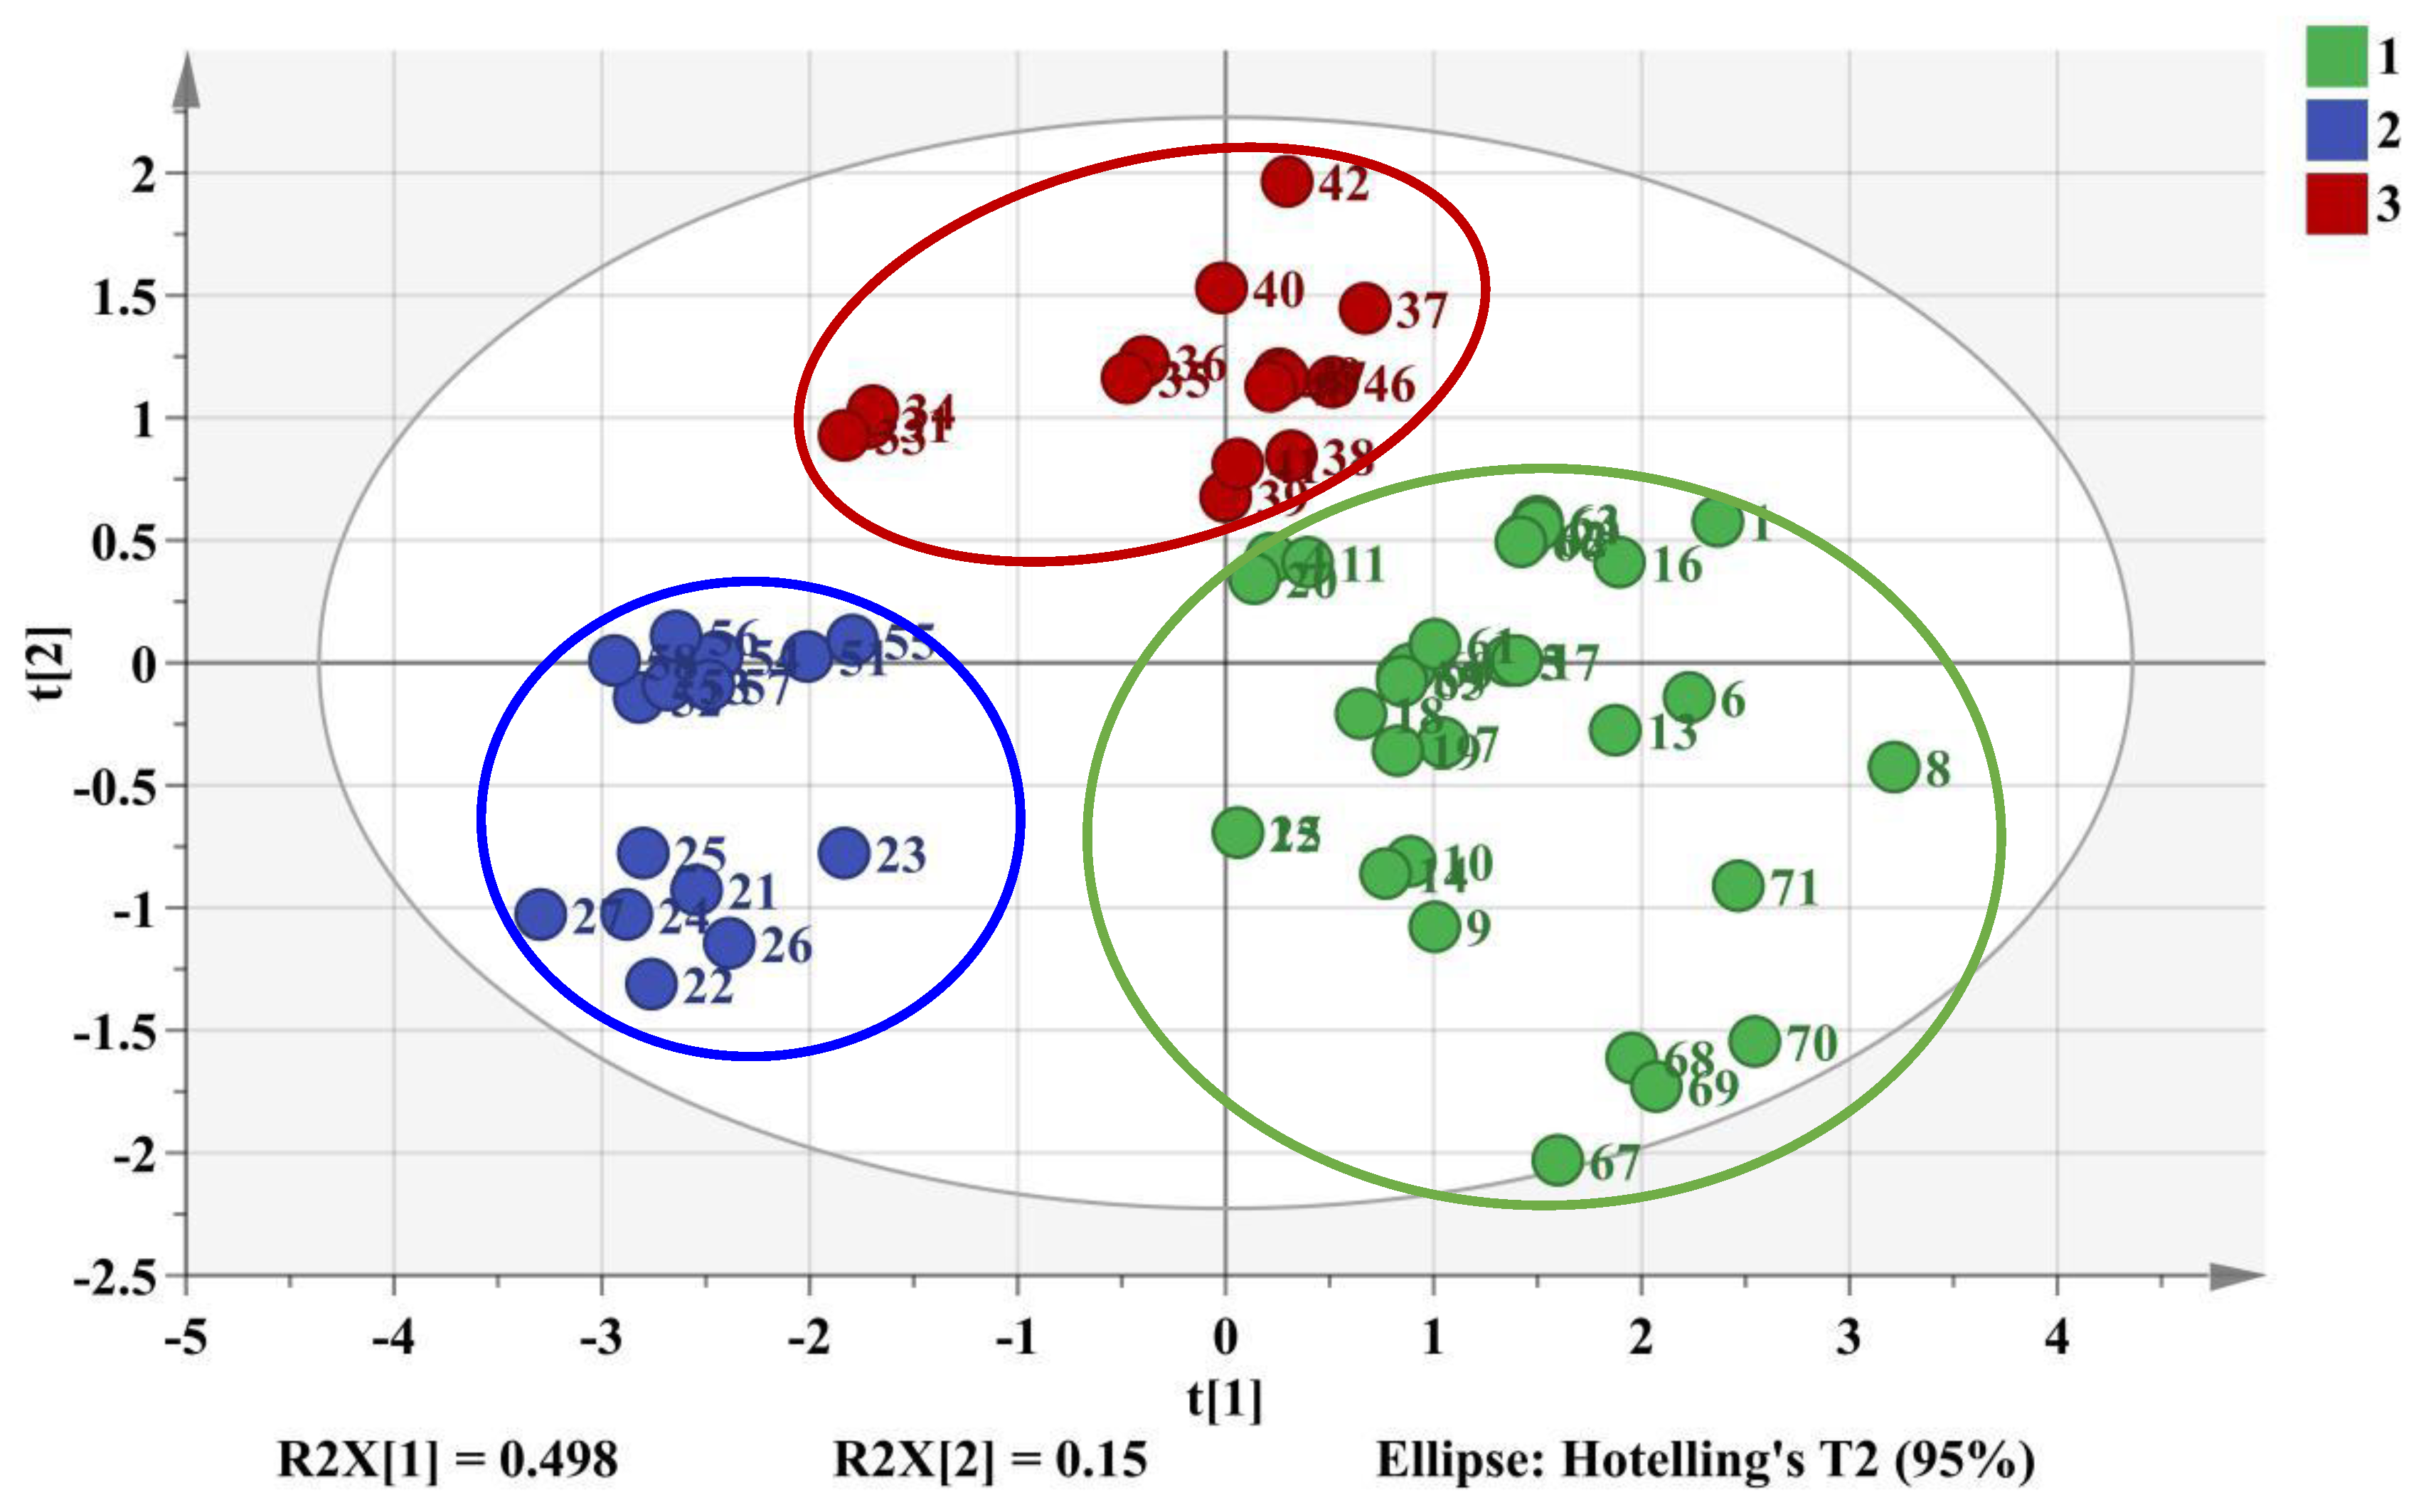
2.4.1. HCA and PCA Analysis

To evaluate the difference of the components in wild M. bealei, cultivated M. bealei and its three types of substitutes, unsupervised HCA and PCA were performed. Thirty seven samples were selected as observations while the peak areas of 11 compounds were selected as variables forming a 37 × 11 data matrix. The corresponding HCA dendrogram and PCA score plot are shown in Figure 3 and Figure 4, where it can be seen that these samples were sorted into three clusters reflecting the quality differences of the three types of samples. Among them, samples 31 and 34 were misclassified into the wild M. bealei group, whereas samples 4, 11, 18, 19, and 20 were misclassified into the substitutes. This demonstrated that the 11 characteristic peaks were unable to accurately classify the three clusters.
Subsequently, PCA was employed to investigate if the three types of sample could be differentiated. The 3D score PCA plot is shown in Figure 4.
The first three principal components (PCs) were extracted and explained 54.3%, 14.2%, and 11.5% of the total variability, respectively. All three PCs could accumulate 80.0% of the data variance. However, appropriate visualization and differentiation could not be observed especially for cultivated M. bealei and the substitutes. The results of HCA and PCA indicated that the 11 characteristic peaks were not representative and not specific for satisfactory classification. Consequently, a supervised method is needed to find out the specific variation to classify the three clusters accurately.

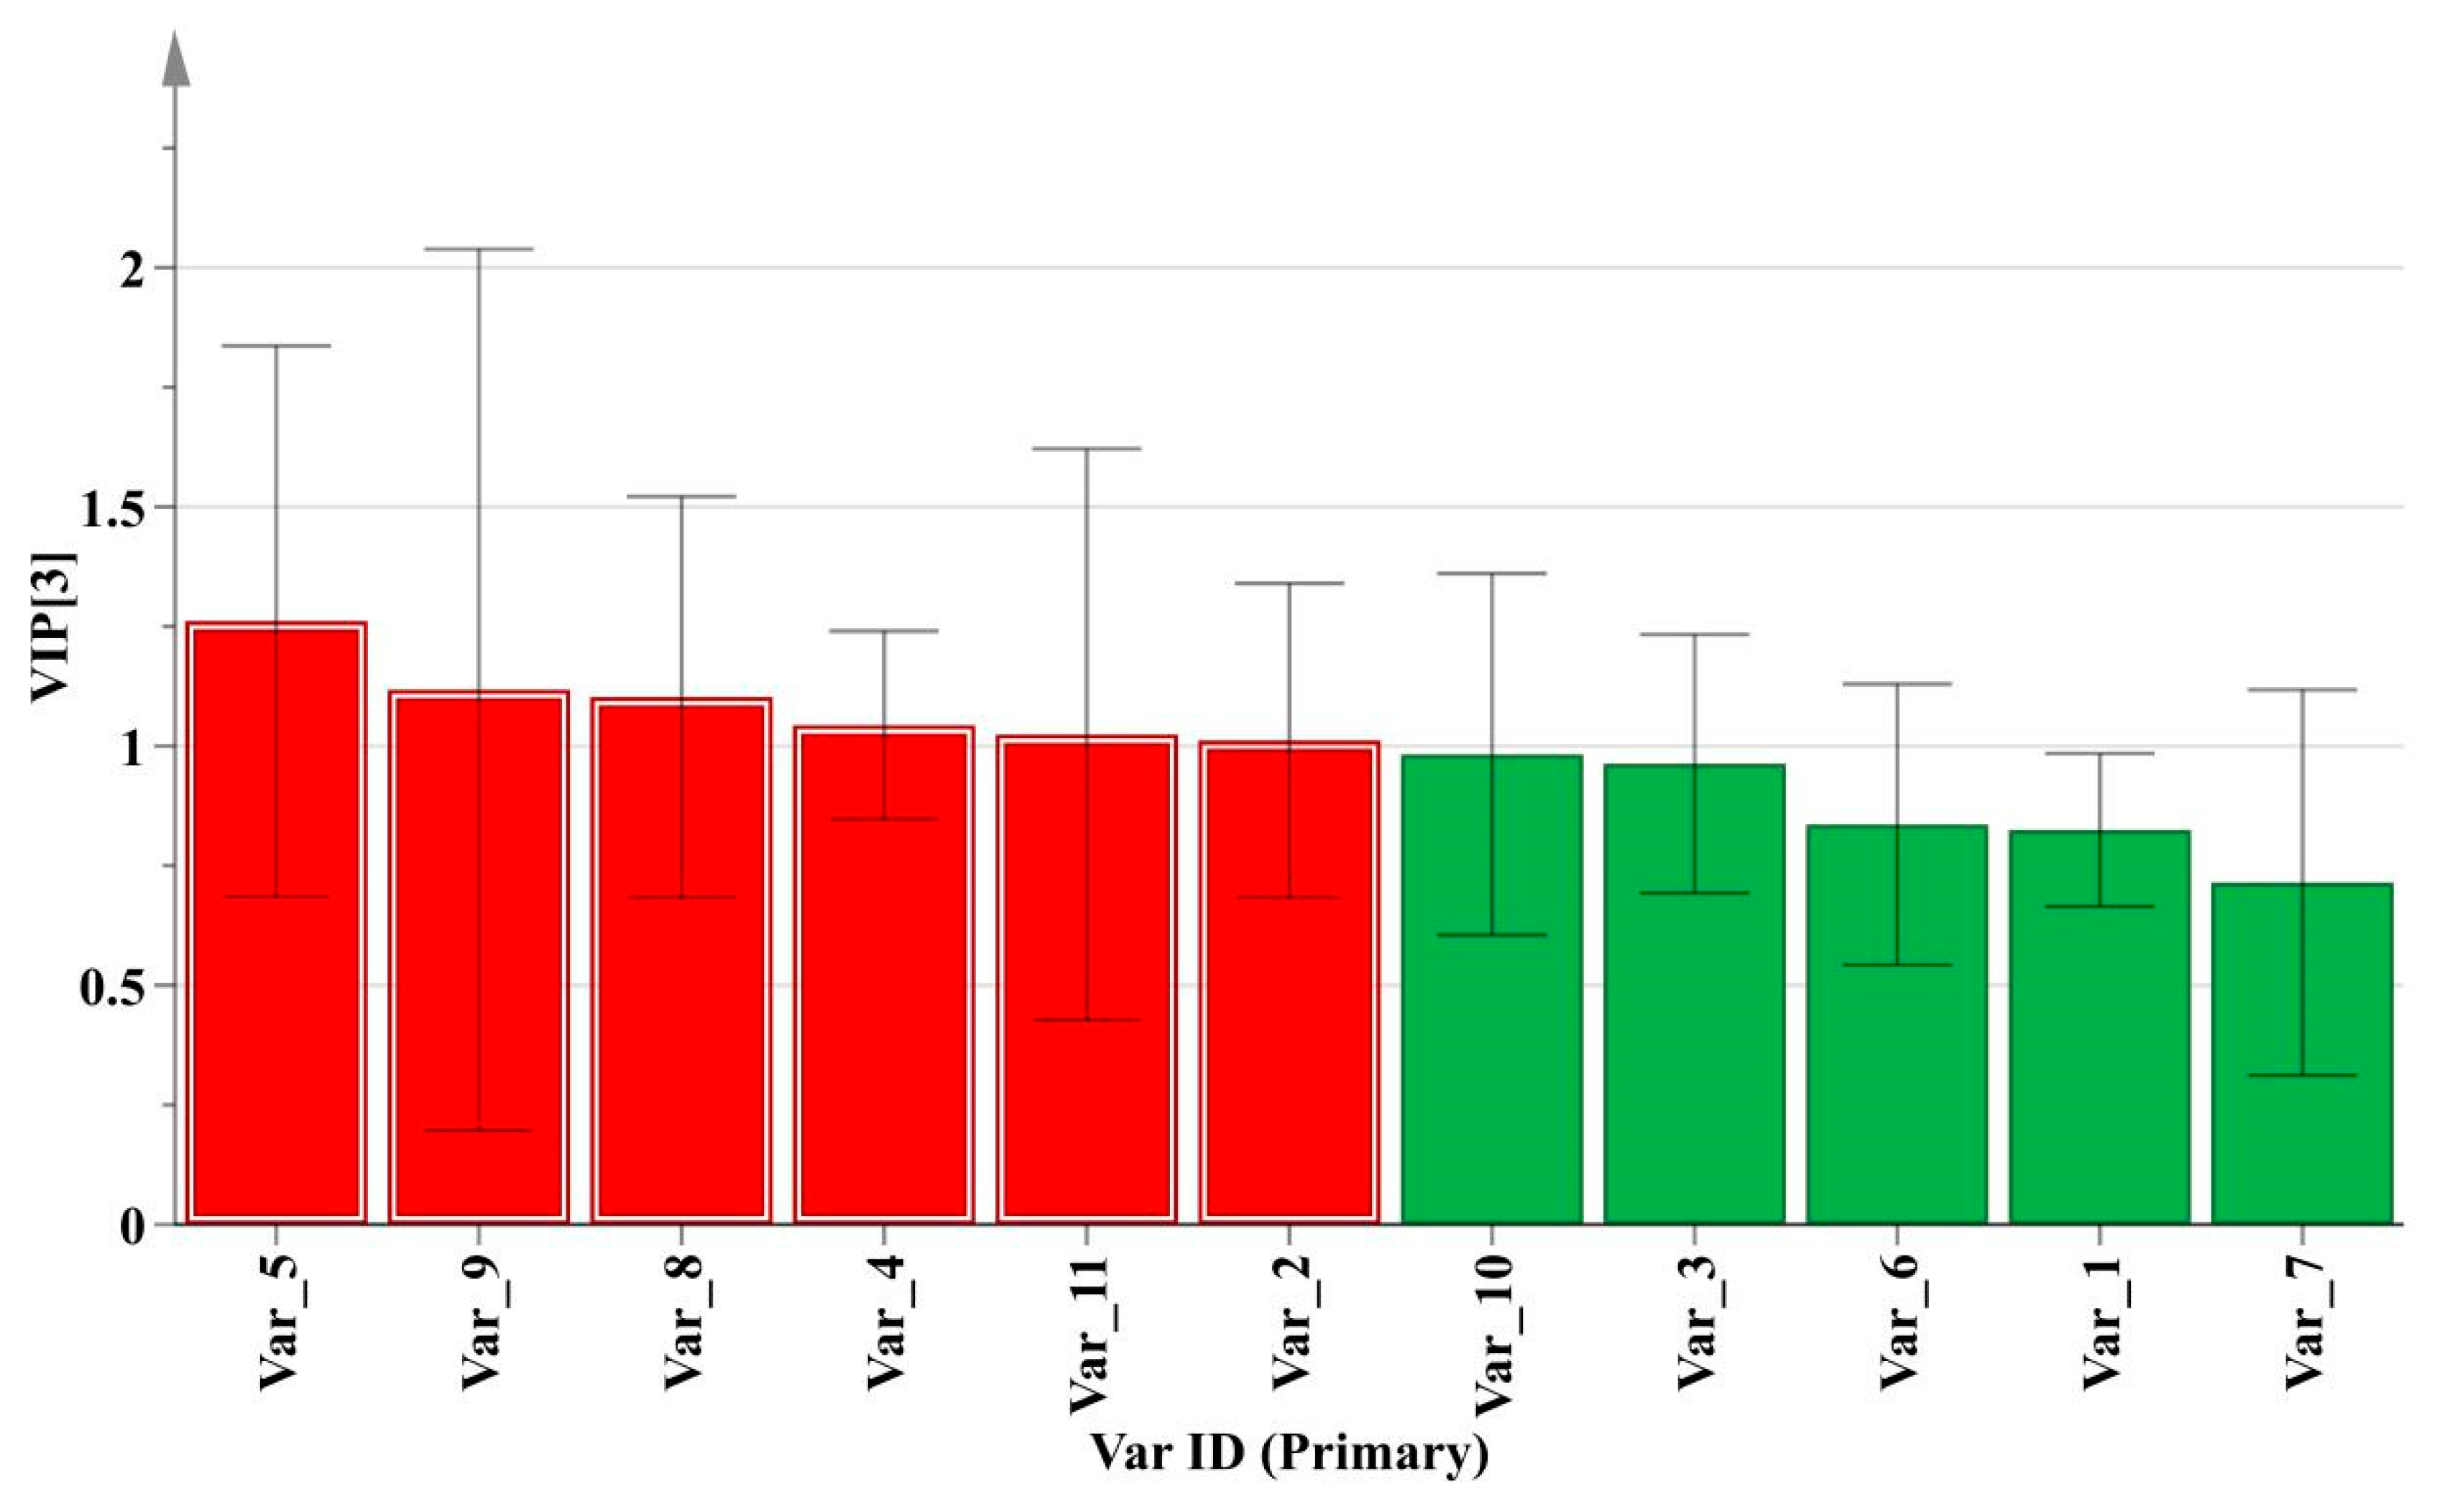
2.4.2. PLS-DA Analysis

As a supervised recognition pattern, PLS-DA can maximize the difference among the groups and screen out key markers responsible for sample variation [7]. The profile of variable importance in projection (VIP) could usually reflect the contribution levels of some key markers for categories differentiation. The variables with VIP values greater than 1 were considered to be more relevant for sample classification [17]. As shown in Figure 5, the VIP plot was constructed to measure the important variables on sample discrimination. After T-tests for these important variables using SPSS 16.0 software, six significantly correlated chemical markers (red histogram) including peak 5, peak 9, peak 8, peak 4, peak 11, and peak 2 were screened out for classification.
Among them, peaks 5, 9, 11 were successfully identified by reference standards as tetrandrine, columbamine, and berbamine with comparison of the RT (Figure S7) and DAD spectrum (data not shown) while the others were unknown compounds from M. bealei. The selected optimal chemical markers were further evaluated by a PLS-DA model. A new data of 37 × 6 matrix was formed to reconstruct the classification model. The 2D PLS-DA score plot was shown in Figure 6, the values of R2X, R2Y, and Q2 were 0.685, 0.776, and 0.746 at a confidence level of 95%, respectively. The results indicated that the established model showed a good fitting and predictive ability. The training set samples were accurately sorted into three related clusters: cluster 1 (cultivated M. bealei), cluster 2 (wild M. bealei) and cluster 3 (substitutes), demonstrating a remarkable difference among the three types. To validate the accuracy of the PLS-DA model, 200 permutation tests were carried out and the vertical intercept values of R2 and Q2 were 0.0103 and −0.271 (Figure S8), respectively, indicating that the established model avoided an over-fitting problem and showed a good prediction [18].
Moreover, 26 batches of samples chosen as testing set containing all these three categories were validated. As shown in Figure 7, the values of R2X, R2Y, and Q2 were 0.648, 0.692, and 0.655 at a confidence level of 95%. The testing set samples were also accurately separated into the three related clusters that further verified the success of PLS-DA model. Eventually, PLS-DA model could successfully provide a distinct classification of samples on the basis of the six characteristic peaks compared to HCA and PCA.
In order to prove the predictive ability of PLS-DA model, 26 samples containing 18 cultivated M. bealei, two wild M. bealei and six substitutes were selected as investigation. As shown in Table 2, the results of the entire data set indicated that the three types of samples were successfully classified with a Fisher’s probability test of 5.6 × 10⁻⁶. It showed that the prediction results were accurate and the established PLS-DA model could be effectively applied for quality evaluation of M. bealei as well as its quality prediction.

3. Materials and Methods

3.1. Chemicals and Materials

HPLC-grade methanol (MeOH) was purchased from Merck (Darmstadt, Germany). Diethylamine and hydrochloric acid (HCl) were obtained from Guangzhou Chemical Reagent Factory (Guangzhou, China). Three reference standards (tetrandrine, columbamine, berbamine) and reference extract of M. bealei were supplied by National Institutes for Food and Drug Control (Beijing, China). Purified water was from a Milli-Q water purification device (Millipore, Billerica, MA, USA). The detailed sample information is listed in Table 3.
All cultivated M. bealei samples were authenticated by TCM testing department (Shenzhen Institute for Drug Control, Guangdong, China) and wild M. bealei were authenticated by Prof. Weixian Deng (Shaoguan University, Guangdong, China). All the samples were randomly divided into training set, validation set and predication set. As a result, the training set consisted of 37 samples including S1–S27, S31, S34, S36, S39–S42, S46–S47 and S49 to establish a classification model. 26 samples including S33, S35, S37–S38, S48, S51–S71 were used as testing set for model validation while another 26 samples including S28–S30, S32, S43–S45, S50, S72–S89 were applied as prediction set to verify the prediction ability.

3.2. Instrumentation

SFC experiments were performed on an 1260 Infinity Hybrid SFC/UHPLC Analytical System consisting of a SFC binary pump, a modified 1260 Infinity LC system, a degasser, a SFC autosampler with 5 μL loop, a SFC FusionTM A5 module, a thermostatted column compartment and a diode array detector (DAD) with a high pressure SFC flow cell (Agilent Technologies, Santa Clara, CA, USA). Instrument and data collection were performed on Agilent OpenLab ChemStation Edition C.01.05 software. The following columns were applied in this research: Unitary XAmide (150 mm × 4.6 mm, 5 μm) was obtained from Acchrom Technologies (Beijing, China); Sepax SFC-Pyridine column (250 mm × 4.6 mm, 5 μm) was purchased from Sepax Technologies Inc (Delaware, DE, USA); Platisil NH2 column (250 mm × 4.6 mm, 5 μm) and Inspire PFP column (250 mm × 4.6 mm, 5 μm) were from Dikma Technologies Inc. (Guangzhou, China). A pulverizer (Fenghang, Shanghai, China) and an ultrasonic water bath (Kun Shan, Jiangsu, China) were used for the extraction process.

3.3. Preparation of Sample Solutions

The sample preparation method was carried out following the Chinese Pharmacopoeia protocol (2015 edition) [1]. Dry raw material of M. bealei was firstly grounded into powder and then filtered by 30 mesh sieves. All M. bealei (0.25 g per each) were then transferred to a 150 mL conical flask with stopper, and 50 mL MeOH/HCl (100/1, v/v) was added. After ultrasonication at room temperature for 45 min, MeOH/HCl (100/1, v/v) was added to compensate the weight loss during extraction. All the solutions were filtered through a 0.22 μm membrane and then stored at 4 °C prior to analysis.

3.4. Chromatographic Conditions

The final SFC experiment was performed on Platisil NH2 (4.6 mm × 250 mm, 5 μm) at a flow rate of 3 mL/min. The mobile phase consisted of supercritical carbon dioxide (sCO2, component A) and MeOH containing 0.4% (v/v) diethylamine and 8% (v/v) water (component B). The gradient elution was as follows: 0–15 min/18%–25% B, 15–20 min/25%–35% B. 20.1–25 min/18% B. The column temperature and backpressure were set at 28 °C and 140 bar, respectively. The injection volume was 5 μL while the detection wavelength was set at 230 nm.

3.5. Data Analysis

3.5.1. Similarity Analysis (SA)

The raw SFC chromatographic data of the 37 tested samples were integrated automatically and exported as *.AIA format file. SA was performed using the software “Similarity Evaluation System for Chromatographic Fingerprint of Traditional Chinese Medicine” (Version 2004 A, Chinese Pharmacopoeia Committee) with these exported files. The reference extract of M. bealei as control (fingerprint R) was generated and the similarity values of these samples were then calculated.

3.5.2. CPR Analysis

Before performing CPR analysis, the data were normalized using Z-score transformation method (SPSS 16.0 software, IBM Inc., Chicago, IL, USA). Afterwards, CPR analysis was performed using HCA, PCA, and PLS-DA, which were carried out by SIMCA-P 14.0 software (Umetrics AB, Umea, Sweden). In HCA, a dendrogram was obtained to characterize the classification result of the samples by Ward’s linkage as cluster method. The sample variation could be assessed by PCA while PLS-DA was used to screen out the main markers that were responsible for discrimination. The parameters of the modeling (R2 and Q2 values) explain the quality of the fitting model. R2 estimates the fitness of the model while Q2 estimates the ability of prediction. Large R2 and Q2 (>0.5) indicate a model with satisfying fitness and predictivity [19]. When PLS-DA is used as a CPR method, the samples are usually divided into a training set, testing set and prediction set [20]. The classification model is obtained by training set and the model is validated by testing set and prediction set.

4. Conclusions

A comprehensive method was developed combining SFC fingerprints and CPR to evaluate the quality of M. bealei. The fingerprints were established and 11 common peaks were obtained among 37 samples. Three types of sample (wild, cultivated and substitutes) presented quite similar chemical composition through SA study which made their classification difficult. Therefore, CPR methods (HCA, PCA and PLS-DA) were applied to evaluate the quality based on the 11 chemical compounds. Results revealed that HCA and PCA were not able to provide an accurate classification for the three selected types of sample which indicated that the 11 compounds were not representative and specific for accurate classification. PLS-DA was then applied for feature extraction from 11 compounds in order to find some important variables that are responsible for the accurate classification. Six characteristic peaks (5, 9, 8, 4, 11, 2) with VIP values greater than 1 were screened. Among them, peaks 5, 9 and 11 were successfully identified as tetrandrine, columbamine, and berbamine. Moreover, the three types of sample were accurately divided into three categories representing wild M. bealei, cultivated M. bealei and its substitutes. The established model was then successfully validated by testing set samples and predication set samples. The results indicated that the accurate discrimination of the three types of samples could be obtained using PLS-DA model. In conclusion, the developed SFC fingerprint method coupled with PLS-DA can be considered as a promising approach for the quality evaluation of M. bealei.

Supplementary Materials

The supplementary materials are available online.

Author Contributions

J.T. and T.W. conceived and designed the experiments; J.W. and G.Y. collected the leaf samples; Y.H. and K.J. performed the experiments, analyzed the data and wrote the manuscript. Z.J. revised the manuscript.

Funding

This research was funded by China Postdoctoral Science Foundation, grant number 2018M643205 and Shenzhen Municipal Science and Technology Innovation Committee, grant number JCYJ20170817141403781 and JCYJ20170817141236095.

Acknowledgments

We gratefully appreciate the financial support from China Postdoctoral Science Foundation (2018M643205) and Shenzhen Municipal Science and Technology Innovation Committee (JCYJ20170817141403781 and JCYJ20170817141236095).

Conflicts of Interest

The authors have declared no conflict of interest.

References

  1. Chinese Pharmacopoeia Commission. Pharmacopoeia of People’s Republic of China; Chinese Pharmacopoeia Commission: Beijing, China, 2015; Volume I, pp. 85–86. [Google Scholar]
  2. Guizhou Provincial Health Department. Quality Standard of National Chinese Herbal Medicines in Guizhou Province; DB52/YC005-2003; Guizhou Provincial Health Department: Guizhou, China, 2003; p. 7.
  3. Guangxi Medical Products Administration. Quality Standard of Zhuang Medicine in Guangxi Zhuang Autonomous Region; DYB45-GXZYC0047-2011; Guangxi Medical Products Administration: Guangxi, China, 2011; Volume 2, pp. 75–76.
  4. Abu-Qaoud, H.; Shawarb, N.; Hussen, F.; Jaradat, N.; Shtaya, M. Comparison of qualitative, quantitative analysis and antioxidant potential between wild and cultivated Borago officinalis leaves from palestine. Pak. J. Pharm. Sci. 2018, 31, 953–959. [Google Scholar] [PubMed]
  5. He, J.M.; Mu, Q. The medicinal uses of the genus Mahonia in traditional Chinese medicine: An ethnopharmacological, phytochemical and pharmacological review. J. Ethnopharmacol. 2015, 175, 668–683. [Google Scholar] [CrossRef] [PubMed]
  6. Wang, L.; Wang, X.; Kong, L. Automatic authentication and distinction of Epimedium koreanum and Epimedium wushanense with HPLC fi ngerprint analysis assisted by pattern recognition techniques. Biochem. Syst. Ecol. 2012, 40, 138–145. [Google Scholar] [CrossRef]
  7. Wang, C.; Zhang, C.; Shao, C.; Li, C.; Liu, S. Chemical Fingerprint Analysis for the Quality Evaluation of Deepure Instant Pu-erh Tea by HPLC Combined with Chemometrics. Food Anal. Methods 2016, 9, 3298–3309. [Google Scholar] [CrossRef]
  8. Esteki, M.; Farajmand, B.; Amanifar, S.; Barkhordari, R.; Ahadiyan, Z.; Dashtaki, E.; Mohammadlou, M.; Vander Heyden, Y. Classification and authentication of Iranian walnuts according to their geographical origin based on gas chromatographic fatty acid fingerprint analysis using pattern recognition methods. Chemom. Intell. Lab. Syst. 2017, 171, 251–258. [Google Scholar] [CrossRef]
  9. Wang, L.; Hui, Y.; Jiang, K.; Yin, G.; Wang, J.; Yan, Y.; Wang, Y.; Li, J.; Wang, P.; Bi, K.; et al. Potential of near infrared spectroscopy and pattern recognition for rapid discrimination and quantification of Gleditsia sinensis thorn powder with adulterants. J. Pharm. Biomed. Anal. 2018, 160, 64–72. [Google Scholar] [CrossRef] [PubMed]
  10. Pedan, V.; Weber, C.; Do, T.; Fischer, N.; Reich, E.; Rohn, S. HPTLC fingerprint profile analysis of cocoa proanthocyanidins depending on origin and genotype. Food Chem. 2018, 267, 277–287. [Google Scholar] [CrossRef] [PubMed]
  11. Qiu, W.; Chen, Y.; Wei, Z.; Yang, J. A method based on covariance and pattern recognition for improving resolutions of spatially encoded NMR spectra. Magn. Reson. Chem. 2015, 53, 945–951. [Google Scholar] [CrossRef] [PubMed]
  12. Liu, X.; Jiang, W.; Su, M.; Sun, Y.; Liu, H.; Nie, L.; Zang, H. Quality evaluation of traditional Chinese medicines based on fingerprinting. J. Sep. Sci. 2019. [Google Scholar] [CrossRef] [PubMed]
  13. Liang, Y.; Xie, P.; Chau, F. Chromatographic fingerprinting and related chemometric techniques for quality control of traditional Chinese medicines. J. Sep. Sci. 2010, 33, 410–421. [Google Scholar] [CrossRef] [PubMed]
  14. Huang, Y.; Tang, G.; Zhang, T.; Fillet, M.; Crommen, J.; Jiang, Z. Supercritical fluid chromatography in traditional Chinese medicine analysis. J. Pharm. Biomed. Anal. 2018, 147, 65–80. [Google Scholar] [CrossRef] [PubMed]
  15. Huang, Y.; Zhang, T.; Zhou, H.; Feng, Y.; Fan, C.; Chen, W.; Crommen, J.; Jiang, Z. Fast separation of triterpenoid saponins using supercritical fluid chromatography coupled with single quadrupole mass spectrometry. J. Pharm. Biomed. Anal. 2016, 121, 22–29. [Google Scholar] [CrossRef] [PubMed]
  16. Kaufmann, D.; Dogra, A.K.; Tahrani, A.; Herrmann, F.; Wink, M. Extracts from traditional Chinese medicinal plants inhibit acetylcholinesterase, a known Alzheimer’s Disease target. Molecules 2016, 21, 1161. [Google Scholar] [CrossRef] [PubMed]
  17. Cao, X.; Sun, L.; Li, D.; You, G.; Wang, M.; Ren, X. Quality Evaluation of Phellodendri Chinensis Cortex by Fingerprint–Chemical Pattern Recognition. Molecules 2018, 23, 2307. [Google Scholar] [CrossRef] [PubMed]
  18. Chen, F.; Qi, H.; Shi, Y. Fingerprint Analysis of Codonopsis Radix by HPLC Coupled with Chemometrics Analysis. Chin. Herb. Med. 2013, 5, 307–312. [Google Scholar] [CrossRef]
  19. Zhang, X.; Wu, H.; Yu, X.; Luo, H.; Lu, Y.; Yang, H.; Li, X.; Li, Z.; Tang, L.; Wang, Z. Determination of Bitterness of Andrographis Herba Based on Electronic Tongue Technology and Discovery of the Key Compounds of Bitter Substances. Molecules 2018, 23, 3362. [Google Scholar] [CrossRef] [PubMed]
  20. Beale, D.J.; Morrison, P.D.; Karpe, A.V.; Dunn, M.S. Chemometric analysis of lavender essential oils using targeted and untargeted GC-MS acquired data for the rapid identification and characterization of oil quality. Molecules 2017, 22, 1339. [Google Scholar] [CrossRef] [PubMed]
Sample Availability: Samples of the compounds are not available from the authors.
Figure 1. Appearance characters of M. bealei samples and its substitutes. A: cultivated M. bealei; B: wild M. bealei; C: M. breviracema Y. S. Wang et Hsiao; D: M. duclouxiana Gagnep; E: M. bodinieri Gagnep; F: M. fordii Schneid.
Molecules 24 03684 g001
Figure 2. SFC fingerprints of different M. bealei samples and its substitutes. Experimental condition: NH2 (4.6 mm × 250 mm, 5 μm); mobile phase: (A) sCO2; (B) MeOH containing 0.4% (v/v) diethylamine and 8% (v/v) water; gradient: 015 min/18%–25% B, 15–20 min/25%–35% B. 20.1–25 min/18% B; injection volume: 5 μL; flow rate: 3.0 mL/min; column temperature: 28 °C; backpressure: 140 bar; detection wavelength: 230 nm; samples: S1–S27, S31, S34, S36, S39–S41, S46–S47, S49.
Molecules 24 03684 g002
Figure 3. HCA dendrogram of different M. bealei samples and its substitutes.
Molecules 24 03684 g003
Figure 4. 3D score plot of PCA on the first three PCs for training set samples.
Molecules 24 03684 g004
Figure 5. VIP plot for training set samples based on PLS-DA method.
Molecules 24 03684 g005
Figure 6. 2D PLS-DA score plot of training set samples. Cluster 1 (green color): cultivated M. bealei; Cluster 2 (Blue color): wild M. bealei; Cluster 3 (red color): substitutes.
Molecules 24 03684 g006
Figure 7. 2D PLS-DA score plot of training set samples and testing set samples. Cluster 1 (green color): cultivated M. bealei; Cluster 2 (Blue color): wild M. bealei; Cluster 3 (red color): substitutes.
Molecules 24 03684 g007
Table 1. SA results of 37 batches of M. bealei samples and its substitutes.
SampleSimilaritySampleSimilarity
S10.942S200.936
S20.942S210.870
S30.955S220.871
S40.952S230.898
S50.957S240.861
S60.964S250.862
S70.976S260.875
S80.862S270.850
S90.909S310.912
S100.910S340.913
S110.941S360.841
S120.968S380.912
S130.830S390.896
S140.913S400.952
S150.956S410.980
S160.973S460.954
S170.982S470.973
S180.928S490.955
S190.929
Table 2. Prediction results for 26 batches of samples.
MembersCorrectCultivated M. bealeiWild M. bealeiSubstitutes
Cultivated
M. bealei
18100%1800
Wild
M. bealei
2100%020
Substitutes6100%006
No class0/000
Total26100%1826
Fisher’s probability5.6 × 10−6
Table 3. Detailed information of samples.
Sample No.SpeciesOriginSpecification
1–12M. bealei (Fort.) Carr.GuangxiCrude drugs (cultivated)
13M. bealei (Fort.) Carr.YunnanCrude drugs (cultivated)
14M. bealei (Fort.) Carr.AnhuiCrude drugs (cultivated)
15M. bealei (Fort.) Carr.ZhejiangCrude drugs (cultivated)
16M. bealei (Fort.) Carr.JiangxiCrude drugs (cultivated)
17M. bealei (Fort.) Carr.SichuanCrude drugs (cultivated)
18–20M. bealei (Fort.) Carr.GuizhouCrude drugs (cultivated)
21–29M. bealei (Fort.) Carr.GuangxiCrude drugs (wild)
30–34M. breviracema Y. S. Wang et HsiaoGuangxiCrude drugs (wild)
35–39M. duclouxiana GagnepGuangxiCrude drugs (wild)
40–45M. bodinieri GagnepGuangxiCrude drugs (wild)
46–50M. fordii SchneidGuangxiCrude drugs (wild)
51–58M. bealei (Fort.) Carr.GuangdongCrude drugs (wild)
59–65M. bealei (Fort.) Carr.AnhuiCrude drugs (cultivated)
66–72, 74–75, 79M. bealei (Fort.) Carr.JiangxiCrude drugs (cultivated)
73M. bealei (Fort.) Carr.AnhuiCrude drugs (cultivated)
76–78, 80–83M. bealei (Fort.) Carr.GuangdongCrude drugs (cultivated)
84M. bealei (Fort.) Carr.JiangxiCrude drugs (cultivated)
85–86M. bealei (Fort.) Carr.AnhuiCrude drugs (cultivated)
87–89M. bealei (Fort.) Carr.GuangxiCrude drugs (cultivated)

