2.1. The Characterization of Silica Aerogel and Trans-Resveratrol (RSV)-Loaded Silica Aerogel (RLSA)
Figure 1a shows the appearance of silica aerogel and RLSA after freeze drying. The mass of both is 200 mg. We can see that the volume of the RLSA is larger than silica aerogel, and the color becomes more opaque. A transmission electron microscope (TEM) image of silica aerogel shows that it is a dense structure formed by the accumulation of spherical particles, which is consistent with a scanning electron microscope (SEM) image. Compared with the silica aerogel after supercritical drying, its skeleton structure is denser and the density is larger. However, the pore size is smaller and most of it consists of micropores [
16]. The structure of RSV has a long rod shape with the size on the order of micrometers shown in
Figure 1e. It can be seen from
Figure 1c,f that the recrystallized RSV with a micron-sized long rod shape is integrated with the dense silica network skeleton. This is may be due to the RSV dissolving into small molecules in an ethanol solution, which can diffuse into the pores of silica alcogel. However, RSV precipitates due to minimal solubility in water during solvent replacement. After freeze drying, the solvent evaporates and the RSV recrystallizes.
Figure 2a,b shows the N
2 adsorption–desorption isotherms and the pore size distributions of silica aerogel and RLSA, respectively.
Figure 2a presents an I-type curve and most microporous materials belong to this category. The pore structure of the H4-type is a wedge-shaped hole piled up in the skeleton, but more pores are concentrated in the microporous area [
17]. We can see that the pore size of silica aerogel is concentrated in micropores with an average value of 1.51 nm. The specific surface area is 702 m
2/g. This is consistent with the dense structure exhibited by the SEM and TEM images.
Figure 2b presents an IV-type curve illustrating that RLSA contains mesoporous elements. H1-type hysteresis loop indicates that there are a large number of spherical pores stacked in succession [
18]. The average pore size of RLSA is 3.24 nm and most pores are distributed in the region of the micropores or small mesopores. Its specific surface area is 411 m
2/g. Therefore, it is presumed that the small drug molecules are not left in the silica aerogel in a pore-filling manner. If so, the pore size of the RLSA should be smaller.
In order to understand the drug loading mode of silica aerogel after freeze drying, small-angle X-ray scattering (SAXS) of the two samples were characterized. As shown, both the silica aerogel and the RLSA have no surface fractals. The mass fractal dimensions D
1 of two samples are between 1–2 in
Table 1 and
Figure 3, indicating that the internal character is a chain structure formed by primary particles and clusters. The fractal dimension D
2 of the silica aerogel is 2.79, which indicates that the primary structure is relatively dense. The larger the value, the denser the system, which may be related to the volume shrinkage during freeze drying. In the RLSA system, the mass fractal dimension D
2 is 2.37. The smaller value shows that the mass contained in the unit volume of the fractal structure is reduced, and the system is looser. However, the size of the primary particles “a” is larger than that of silica aerogel. This may be due to the adhesion of small drug molecules to the silica particles, enhancing their network backbone structure. This will make the primary and secondary particles larger in the RLSA system. Also, the reinforcement of the skeleton inhibits shrinkage during freeze drying, making the volume and the pore size of the RLSA larger. The smaller mass fractal dimension of the RLSA than the silica aerogel also indicates that the system is not uniform.
A thermogravimeter (TG) is used to measure the drug loading content in silica aerogel.
Figure 4a shows that the RSV starts to decompose from 280 °C and reaches the extreme value of the weight drop rate at 315 °C and 550 °C. It completely decomposes until 610 °C [
19]. From
Figure 4b, the aerogel has a weight loss of 2.6% in the RSV decomposition temperature range. This is mainly attributed to the liberation of surface-adsorbed water [
20,
21].
Figure 4c shows that the RLSA has a weight loss of 28.5% in the same range. This value represents the amount of surface-adsorbed water and the RSV. Therefore, the RSV loading content was 26.7%. The volume of silica alcogel is 25 mL and it becomes powdery after drying with the weight of 1.6 g. The soaking concentration is 13.3 g/L so the expected drug loading content is 0.025 L × 13.3 g/L = 0.33 g. However, the actual drug loading measured by the TG is 1.6 g × 26.7% = 0.43 g. This may be because the RSV-EtOH concentration used in the fitted diffusion coefficient experiment (as described below) is much lower than RLSA (40 g/L). After the concentration of the solution was increased, the effect of adsorption was enhanced, which caused more drug are adsorbed on the skeleton network. Therefore, the adsorption and diffusion work together to make the actual drug-loading content greater than in theory.
2.2. Inward Diffusion Coefficient
The cuvette alcogel of the experimental group was immersed into a certain concentration of RSV-EtOH solution. The volume of the RSV-EtOH solution is larger compared to the alcogel, so we approximate that the concentration of this solution is constant. Since the concentration of RSV in the alcogel varies with time and position, Fick’s second law was used to fit it. The diffusion differential equation of Fick’s second law is:
The variable
c, a function of position
x and time
t, is the concentration of RSV in alcogel. The top of cuvette was defined as position origin. Constant L and
n0 are the length of alcogel in cuvette and the concentration of RSV solution, respectively. The initial condition is:
The boundary conditions are:
We can derive series solution after detaching variables:
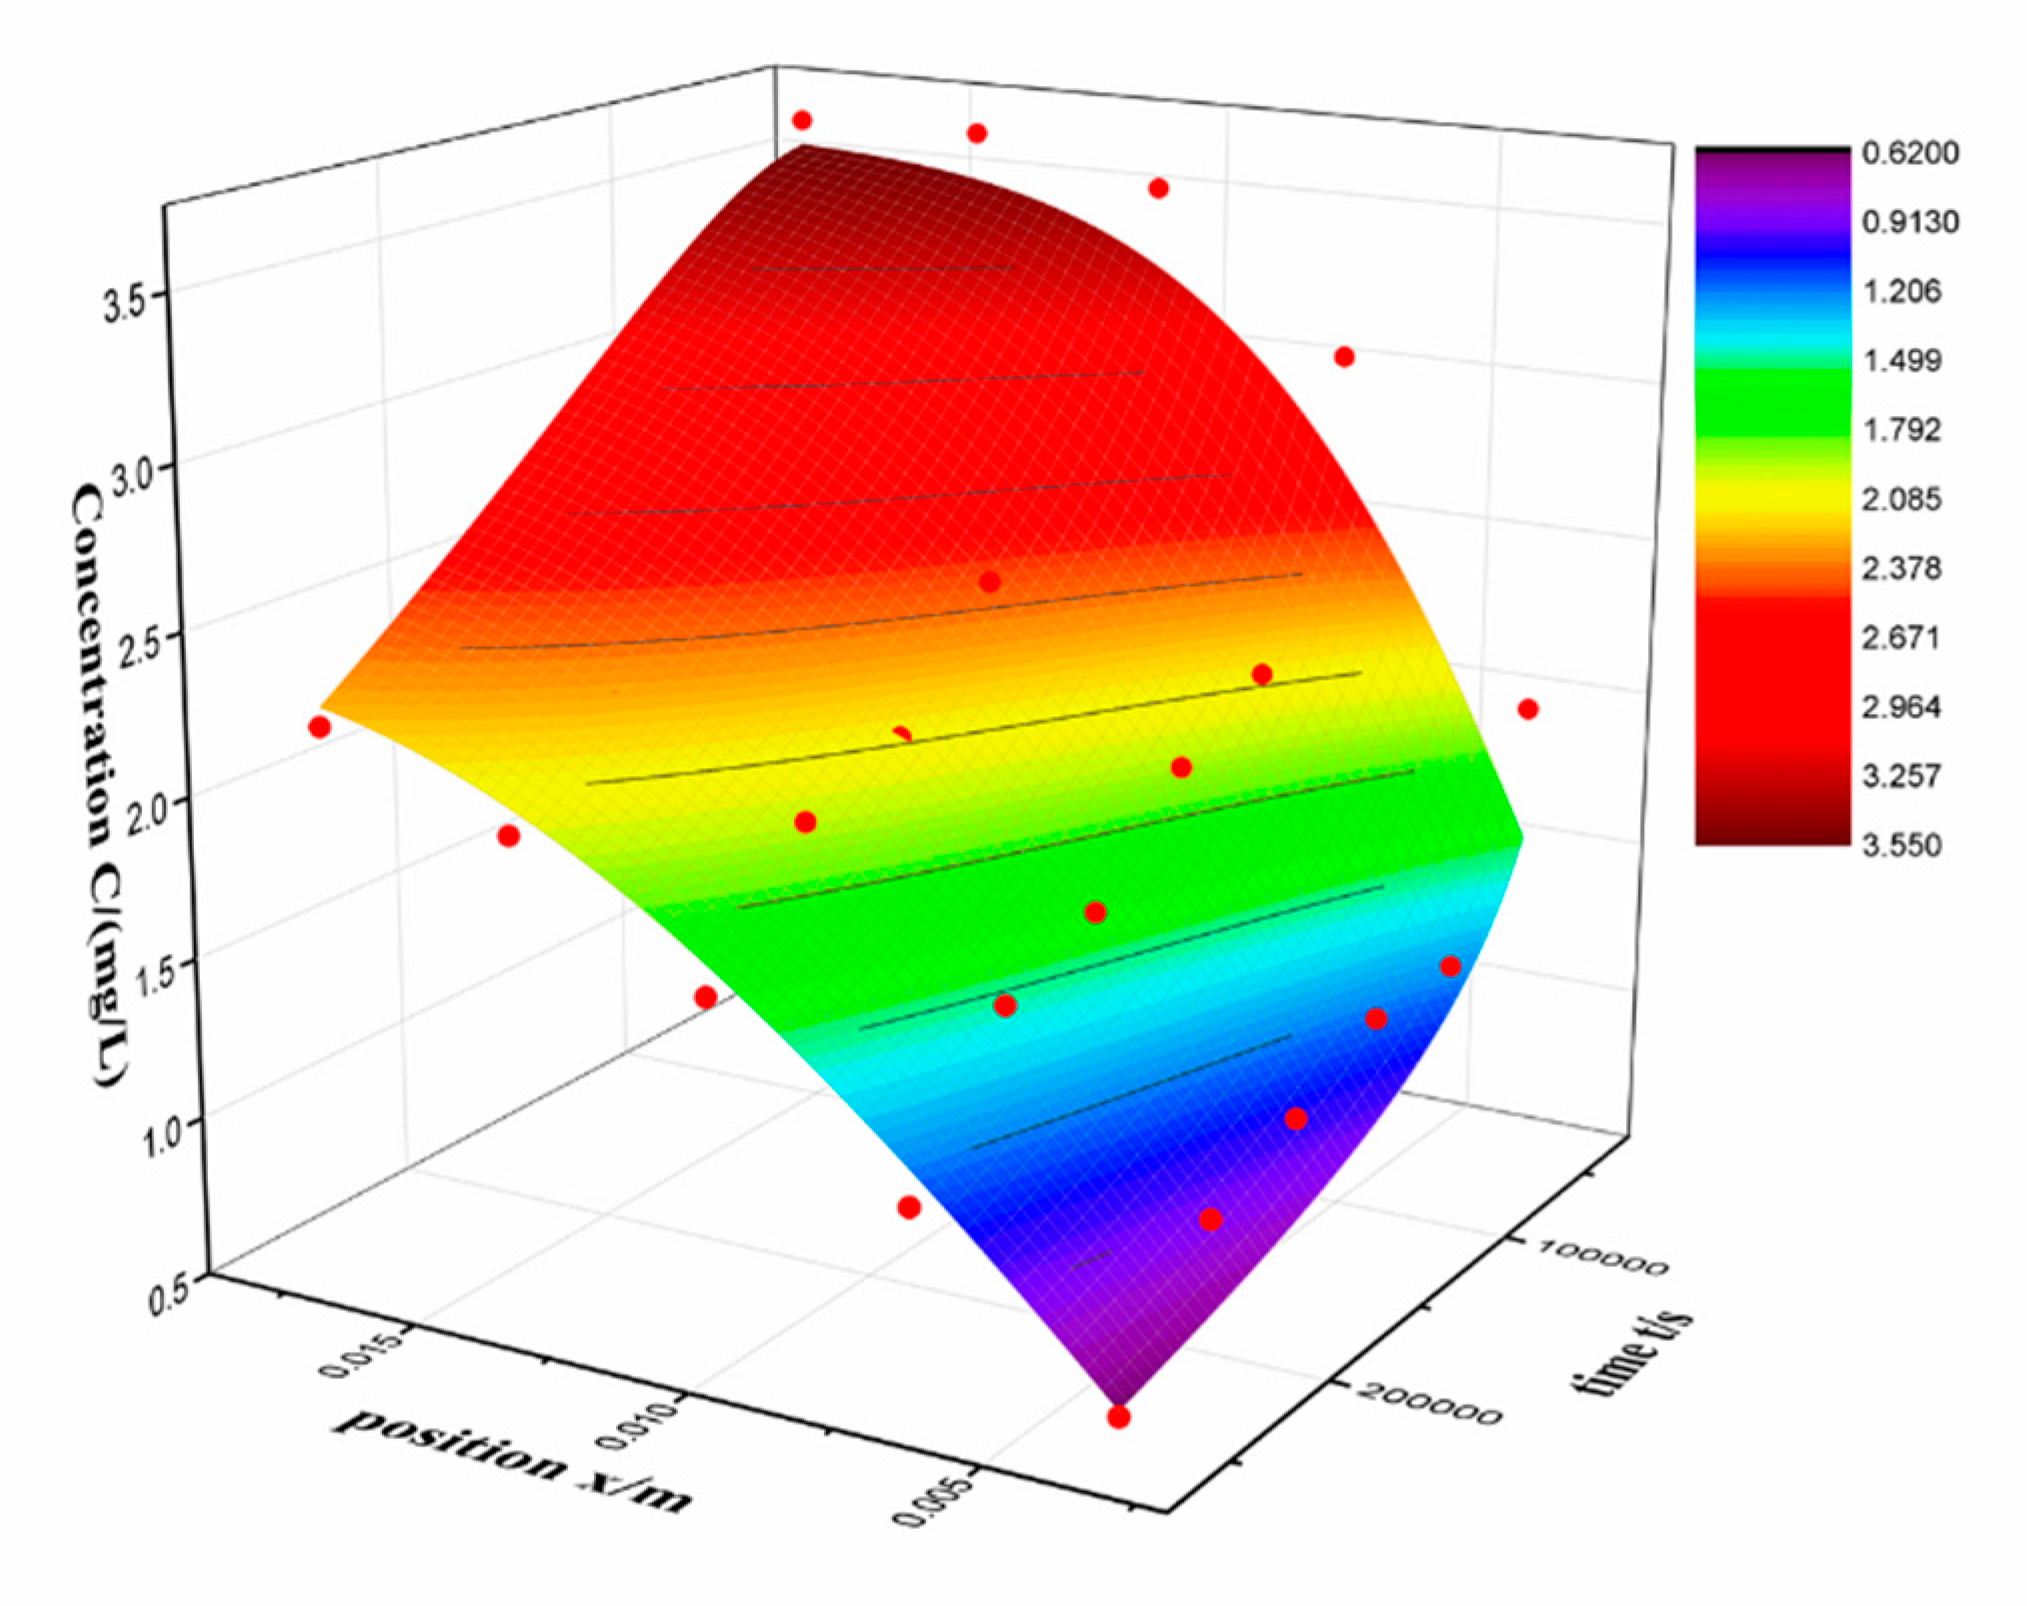
The measurement data is fitted using a loop statement fitting program. The value of
n ranges from 0 to 500. The results are shown in
Table 2 and
Figure 5.
The value of D and R
2 is 2.928 × 10
−10 m
2/s and 0.98, respectively. The result fits well with Fick’s law, indicates that the diffusion is main process of RSV entering to the silica alcogel. The value of diffusion coefficient that Fe
2+ enter the silica gels is 3.52 × 10
−7 m
2/s in our previous work [
17], which is far larger than RSV. This is consistent with our expectations, ions are easier to diffuse than organic molecules because of smaller volume. It can be seen in the fitted graph that the measured data (red dot) is above the fitted surface at low concentration and below the fitted surface at high concentration. Actually, it is found that the residual is far larger in low concentration.
Table 3 shows the concentrations and residuals at third day and the percentage represents the ratio of the two. The residual is maximal at
x = 17.5 mm. In order to minimize the error, the experiment was repeated several times. So, the residual indicates that the inward loading process is not only a diffusion process but an adsorption process. Under the same measurement conditions, the larger the residual, the stronger the diffusion and adsorption coupling. Thus, the inward diffusion coefficient can describe the diffusion process of adsorption coupling. And the residual can represent the coupling strength.
In view of the above results, different ranges of the concentrations in the same experiment were selected to fit the diffusion process. All concentration data of position A, B and D, E are considered as high C and low C, respectively. This result shows that the diffusion coefficient we measured is an apparent value that affected by adsorption, rather than the true diffusion coefficient. The concentration of RSV that used to fit the diffusion coefficient consists of two parts. One is the RSV adsorbed on alcogel skeleton, the other is in the solvent inside pores. These two parts correspond to the adsorption and diffusion processes, respectively. The diffusion coefficient is the result of the superposition of the two, reflecting the coupling relationship between adsorption and diffusion [
22]. From this we speculate that at lower concentrations, it is caused by both adsorption and diffusion. Therefore, under the interference of adsorption, the correlation coefficient R
2 is also low as in
Table 4. However, at high concentrations, the adsorption reaches saturation and only diffusion occurs, which making the diffusion rate lower, but the correlation coefficient R
2 is higher. However, in general, the adsorption is very weak compared to diffusion. The correlation coefficient R
2 in
Table 1 is as high as 0.98, indicating that the process is dominated by diffusion [
23,
24].
2.3. Outword Diffusion Coefficient
An outward diffusion model was built which is similar to inward diffusion. The inward diffusion model reaches a diffusion equilibrium after a long period of time. Diffusion equilibrium, that is, the concentration of RSV is equal throughout the alcogel. The difference between inward diffusion and outward diffusion lies in the direction. Fick’s second law is as follows:
The initial condition is:
The boundary conditions are:
We can derive series solution after detaching variables:
This is similar to formula (4). What we need to focus on is that the initial conditions and boundary conditions are different from those in 2.2. The fitting results are shown in
Table 5 and
Figure 6.
It can be seen that the outward diffusion coefficient was larger than the inward coefficient. We speculate that there may be an interfacial effect that hinders the inward diffusion of the drug. Since there is a hindering influence, it is suspected that the concentration of RSV near the alcogel interface may be lower than the solution. Therefore, the boundary condition
n0 is taken as a parameter, and the inward diffusion experimental data was fitted again. The fitting results are shown in
Table 6.
The value of n0 is approximately a constant in 2.2, but the fitted n0 is lower than the constant. This result shows a decrease in the RSV concentration at the alcogel interface of the inward diffusion process. The same idea is applied to the outward diffusion process, but this process is to take the initial condition C0 as a parameter. The fitted C0 is basically consistent with the controlled initial condition. Therefore, the interface may only hinder inward diffusion, and outward diffusion is almost unaffected. In other words, the difference of the diffusion coefficient may be induced by the interface effect. The diffusion from a non-dense medium (alcohol) to a dense medium (alcogel) is probably relatively difficult, leading to a lower diffusion coefficient. In practical applications, the apparent outward diffusion D can reflect the effect of sustained release. In the case of the same particle size, the smaller the D value, the longer the release time. According to Fick’s law, we can also get drug release curve by calculation.
2.4. Internal Diffusion Coefficient
It takes a long time for RSV to be uniformly distributed in the alcogel. If the diffusion coefficient is known, a drug-loading method can be designed. First, alcogel was soaking in a high-concentration drug solution. After
t1 time, the average concentration in the alcogel can be calculated using Equation (9).
This step is inward diffusion. The
c1(x, t) and
c0 is the concentration of inward diffusion solution and designed concentration, respectively. After
t1, the total mass of drug that has reached designed mass
L*c0, the inward diffusion process should be stopped. The total mass can also be calculated by integration of concentration toward position
x. Second, the alcogel is separated and start the internal diffusion process until the drug is evenly distributed. In theory, uniform diffusion takes an infinite amount of time. Yet, the difference between maximum and minimum concentration at different positions could describe the non-uniformity. If this difference could be ignored, the distribution could be considered to be uniform. So, internal diffusion time
t2 was derived by Equation (10):
The c2(x, t) is the concentration after internal diffusion, whose initial condition is c1(x, t1). eps is the fitting accuracy requirements for uniformity.
Internal diffusion occurs inside the alcogel which has a concentration gradient. The alcogel doesn’t contact with external. Correspondingly, the Neumann boundary conditions are 0 at both ends. The diffusion differential equation is:
The initial condition is:
The boundary conditions are:
F(x) is the initial concentration distribution in alcogel. Then we done the interpolation and solved the differential equation by finite element method with computer [
25,
26]. A numerical solution was used to fitted internal diffusion coefficient (
Table 7 and
Figure 7).
The internal diffusion process is the transition of drug from a higher concentration position to a lower. Desorption occurs at higher concentration and adsorption occurs at lower concentration. Therefore, the value of internal diffusion D is between outward diffusion and inward diffusion. At the same time, the drug does not pass through the interface during this process and there is no need to consider the interface effect.
In practical applications, the following constants are known: the size of the alcohol gel, the drug concentration C of the soaking solution, the desired eps and the inward diffusion coefficient D (D can be measured toward a special combination of drug and alcogels). The soaking time t1 and the internal diffusion time t2 (parameters t1 and t2 are computer calculation results) can be calculated. Thereby, the concentration of the drug in the alcogel is relatively quantitatively controlled.


