Article

Rapid Characterization and Discovery of Chemical Markers for Discrimination of Xanthii Fructus by Gas Chromatography Coupled to Mass Spectrometry

Western Seoul Center, Korea Basic Science Institute, University-industry Cooperation Building, 150 Bugahyeon-ro, Seodaemun-gu, Seoul 03759, Korea
*
Author to whom correspondence should be addressed.
Molecules 2019, 24(22), 4079; https://doi.org/10.3390/molecules24224079
Submission received: 8 October 2019 / Revised: 31 October 2019 / Accepted: 5 November 2019 / Published: 11 November 2019
(This article belongs to the Special Issue Recent Advances in Food and Natural Product Analysis)

Abstract

:
Xanthii Fructus (XF) is known as a medicinal plant. It has been used as a traditional medicine because of its high biological efficacy. However, there have been few comprehensive studies on the specific chemical composition of the plant and consequently, the information is lacking for the mechanism of the natural product metabolites in humans. In this study, an efficient analytical method to characterize and discriminate two species of Xanthii Fructus (Xanthium canadense Mill. and Xanthium sibiricum Patrin ex Widder) was established. Volatile organic compounds (VOCs), polar metabolites, and fatty acids were classified by integrated sample preparation, which allowed a broad range for the detection of metabolites simultaneously. Gas chromatography-mass spectrometry (GC-MS) followed by a multivariate statistical analysis was employed to characterize the chemical compositions and subsequently to discriminate between the two species. The results demonstrate that the two species possess obviously diverse chemical characteristics of three different classifications, and discriminant analysis was successfully applied to a number of chemical markers that could be used for the discrimination of the two species. Additional quantitative results for the selected chemical markers consistently showed significant differences between the two species.

Graphical Abstract
Academic Editors: Robert Shellie and Francesco Cacciola

1. Introduction

Xanthii Fructus is derived from the fruit of Xanthium strumarium (Family Compositae), which is widely distributed in waste places, roadsides, and along river banks. While the plant is one of the most common plants, Xanthii Fructus has been used as a medical herb for the treatment of a variety of diseases in Europe, China, Indochina, Malaysia, and the United States. It is believed to have phytopharmacological properties including antibacterial, antitumor, antitussive, antifungal, anti-inflammatory, antinociceptive, hypoglycemic, antimitotic, antioxidant, antitrypanosomal, and diuretic effects, and infusions and decoctions of this plant have been used in the treatment of fever, leukoderma, scrofula, herpes, cancer, allergic rhinitis, sinusitis, urticaria, catarrh, rheumatism, rheumatoid arthritis, constipation, diarrhea, lumbago, leprosy, and pruritis. Recently herbal medicines of this type have become more popular around the world as people often assume that they are inherently safe because they are natural products [1,2,3]. There are many components to and much research on Xanthium roots and leaves, but few studies of its fruit [4,5,6,7,8]. Moreover, these traditional herbal medicines (THMs) have not been approved officially for commercial release globally because of insufficient research and a lack of scientific evidence for their medicinal efficacy. A thorough understanding of their chemical constituents is essential for producing commercial products based on quality, safety, and efficacy data. Generally, herbal materials and their extracts are very complex. In previous chemical studies on Xanthium genus plants, atractyloside, carboxyatractyloside (xanthostrumarium), 4’-desulphate-atractyloside, xanthiside, xanthatin, xanthinin, xanthinol, isoxanthanol, hydroquinone, xanthanol, xanthinosin, xanthanolides, thiazinedione, xanthumin, 8-epi-xanthatin, and caffeoylquinic acid were mentioned; however, these constituents vary depending on the botanical species and the anatomical part of the plant such as seed, flower, root, and leaf [9,10,11,12,13,14]. In all such cases, analysis was performed on the basis of a particular type of analyte in a sample related to the physicochemical properties such as solubility, volatility, and polarity. However, a distinctive chemical fingerprint as a set of characteristic chromatographic signals enables confirmation of the sample identity, thereby obtaining more comprehensive information on the complex sample.
Fingerprint techniques for herb plants have been widely used to date in combination with liquid chromatography (LC) or gas chromatography (GC) with mass spectrometry (MS) [15,16]. Especially, GC-MS is quite useful owing to its high sensitivity and an accessible mass spectral library search to assist with compound identification. Prior to instrumental analysis, sample preparation was often a bottleneck for chemical analysis in exploring the diversity of compounds. Solid phase microextraction (SPME) has brought significant progress in the sample preparation area by means of integrating steps such as sampling, extraction, and concentration into a single solvent free step for volatile fingerprinting of challenging matrices [17,18,19]. So far, Xanthium species have been known as a kind of THM, and analysis of their parts has been carried out in a variety of countries because the chemical composition should naturally be different depending on storage conditions, amount of sun, humidity, type of ground, time of harvest, and geographical area of cultivation. Especially, fruits with the Chinese name “Cang-Er-Zi” are distinct from others in the genus Xanthium, which includes 25 species [3,20]. Xanthium canadense Mill. (X. canadense M) and Xanthium sibiricum Patrin ex Widder (X. sibiricum PW) are distributed in Korea; therefore, a systematic approach to species discrimination is necessary because the use of a different species may have a significant effect on the therapeutic values. The aim of this study is to explore an effective and rapid method for the simultaneous broad range detection of compounds and to apply it to samples of Xanthii Fructus. Integrated sample preparation combined with gas chromatography time-of-flight mass spectrometry (GC-TOF MS) and followed by a multivariate statistical analysis was established for application to Xanthii Fructus, and this had not been addressed previously. Species discrimination is the first crucial step in selecting herbal medicines, and the use of these platforms will be helpful for ensuring the quality, safety, and efficacy of natural products.

2. Results and Discussion

2.1. Analysis of VOCs by HS-SPME/GC-TOF MS

2.1.1. Chemical Profiling of Volatile Organic Compounds (VOCs)

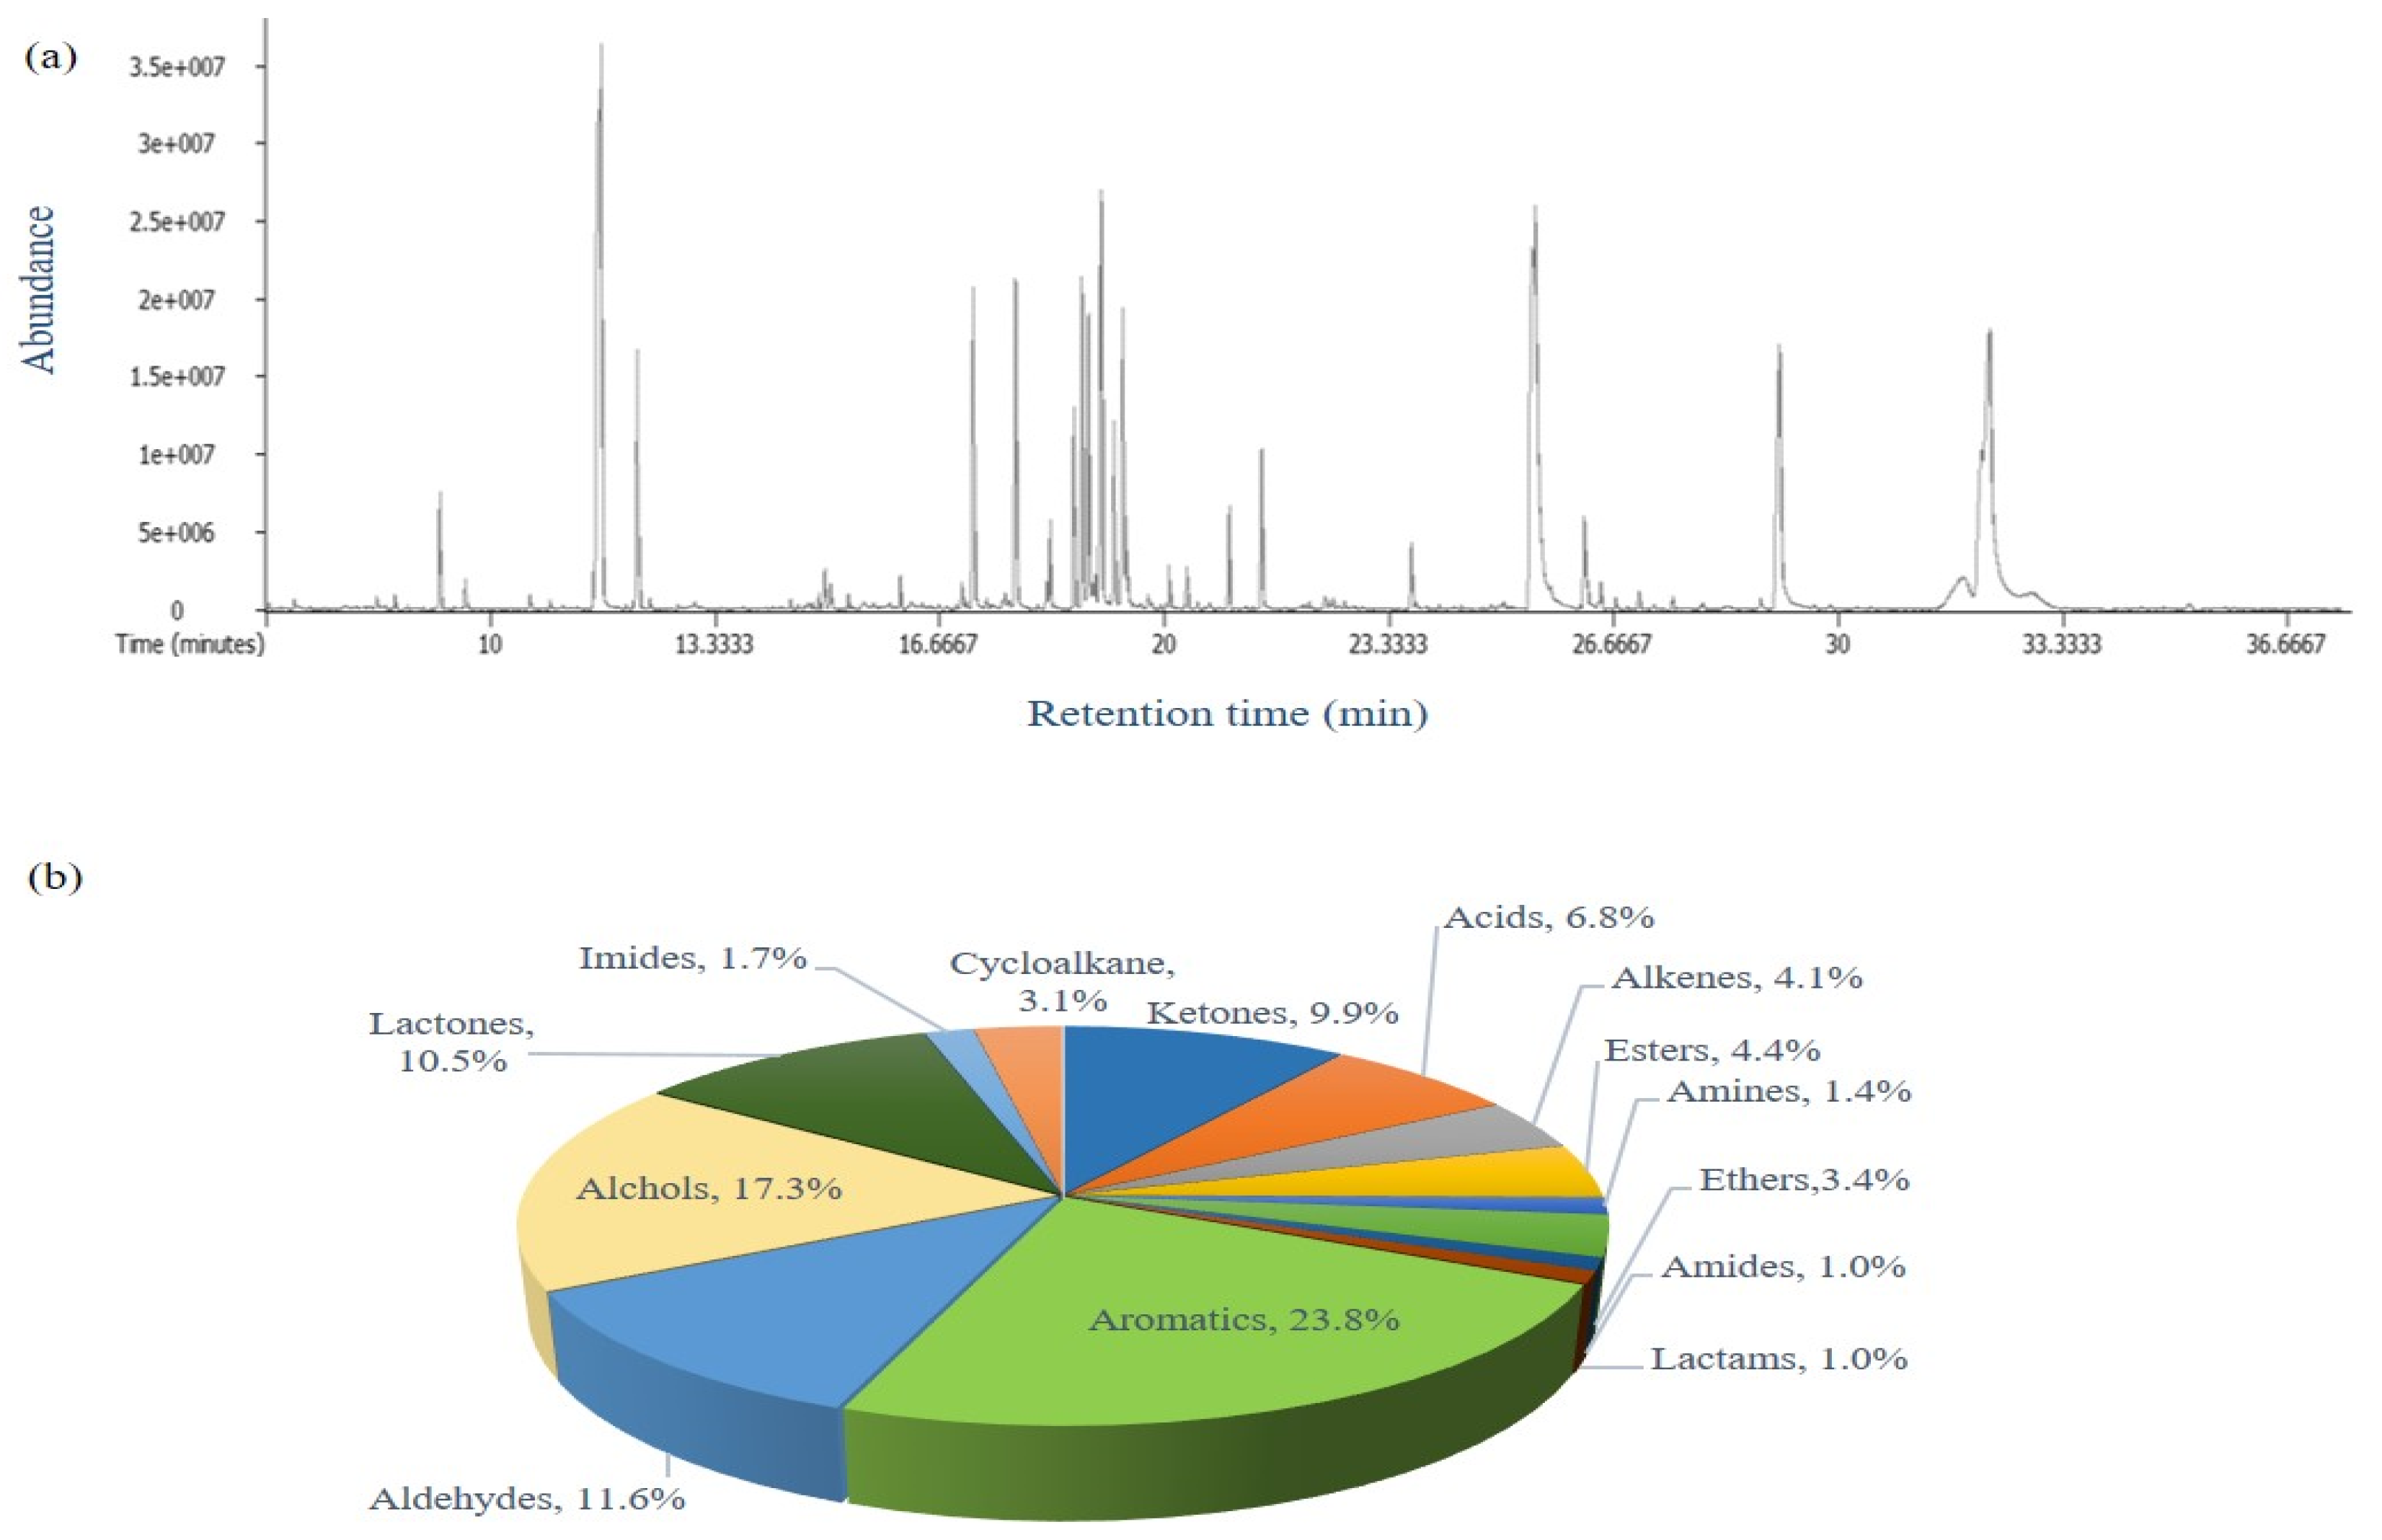
The application of headspace solid-phase microextraction (HS-SPME) has been increasing in food analysis because this method allows the provision of more realistic knowledge of the volatile fraction of a particular food and its contribution to aroma [21,22]. Here, HS-SPME combined with GC TOF-MS, which offers very fast spectral acquisition rates and allows the separation of a substantial number of compounds, was applied for the determination of the characteristic volatile profiles of Xanthii Fructus because flavor could be an important phenotype. A typical total ion chromatogram of a Xanthii Fructus sample obtained by the HS-SPME method is shown in Figure 1a. A total of 191 compounds were detected, and they were classified (Figure 1b) as aromatics (23.8%), alcohols (17.3%), aldehydes (11.6%), lactones (10.5%), ketones (9.9%), acids (6.8%), esters (4.4%), alkenes (4.1%), ethers (3.4%), cycloalkanes (3.1%), imides (1.7%), amines (1.4%), amides (1.0%), and lactams (1.0%).

2.1.2. Statistical Analysis of VOC Profiles

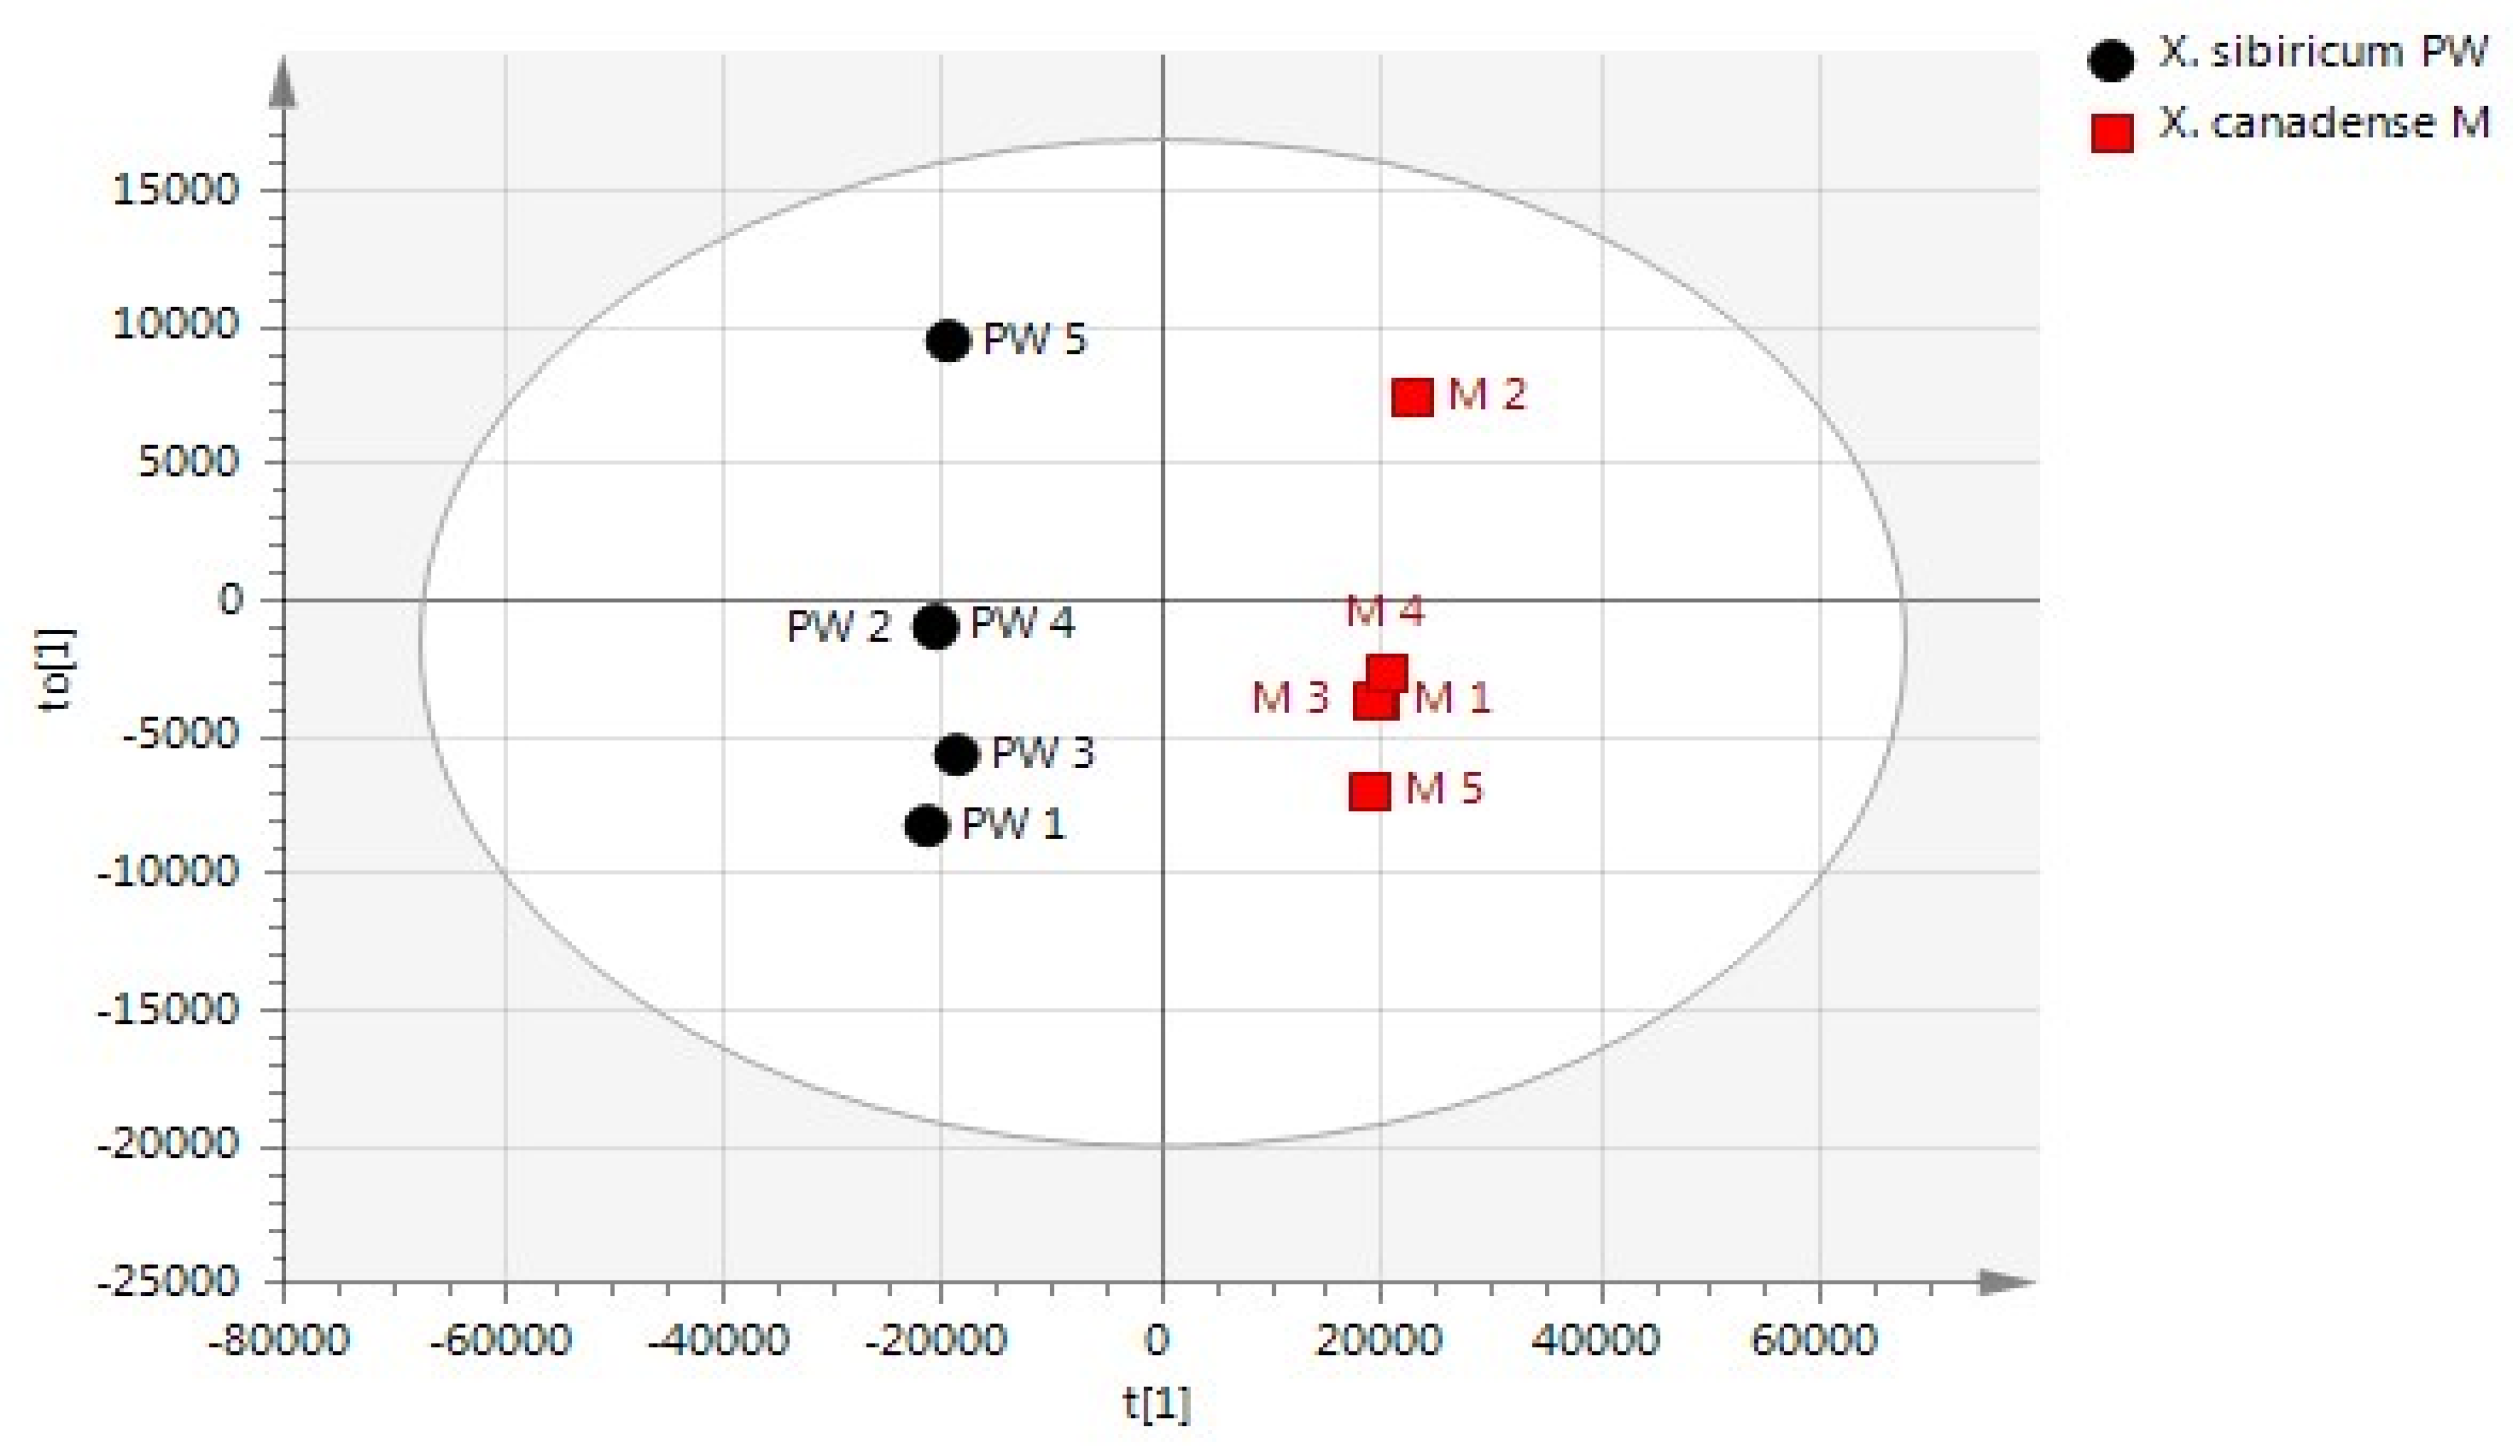
All peaks obtained from the two groups of Xanthii Fructus were aligned by mass spectral and retention time matching, and the data were normalized by an internal standard (methyloctanoate) in the VOCs for the semi-quantitative analysis. An OPLS-DA score plot that illustrates a tendency for separation of the Xanthium samples in accordance with the two species is shown in Figure 2. Additionally, all the observations fell within the Hotelling T2 (0.95) ellipse, where the model fit parameters were 0.997 of R2Y (cum) and 0.993 of Q2Y (cum), indicating that the OPLS-DA model established in this study has good fitness and prediction.
In order to find potential chemical markers contributing to the differences between X. canadense M and X. sibiricum PW, the criteria of the p-values from the student’s t-test and variable importance in the projection (VIP) values in the OPLS-DA were applied. Because OPLS-DA often produces the most optimistic results possible, for the prediction, an external validation process that excluded sets of measurements from the model was conducted to determine the accuracy [23,24]. Predictive plots by external validation showed good discriminatory performance, such as a R2X cum of 0.921, R2Y cum of 0.996, and Q2 cum of 0.989. The external validated prediction results exhibits our discrimination method by OPLS-DA. This prediction plot also shows the root mean square error of prediction (RMSEP) of 0.03294, indicating the standard deviation (errors) of the predicted residuals. By overlapping the differentially expressed features of the t-test (p-value < 0.01) and VIP score (>1) of the OPLS-DA, 27 VOCs were picked out as potential candidates for discrimination of the two species (Supplementary Material, Table S1), and further analysis of quantification was performed for 9 VOCs that have available commercial authentic standards.

2.2. Analysis of Polar Metabolites by GC-TOF MS

2.2.1. Chemical Profiling of Polar Metabolites

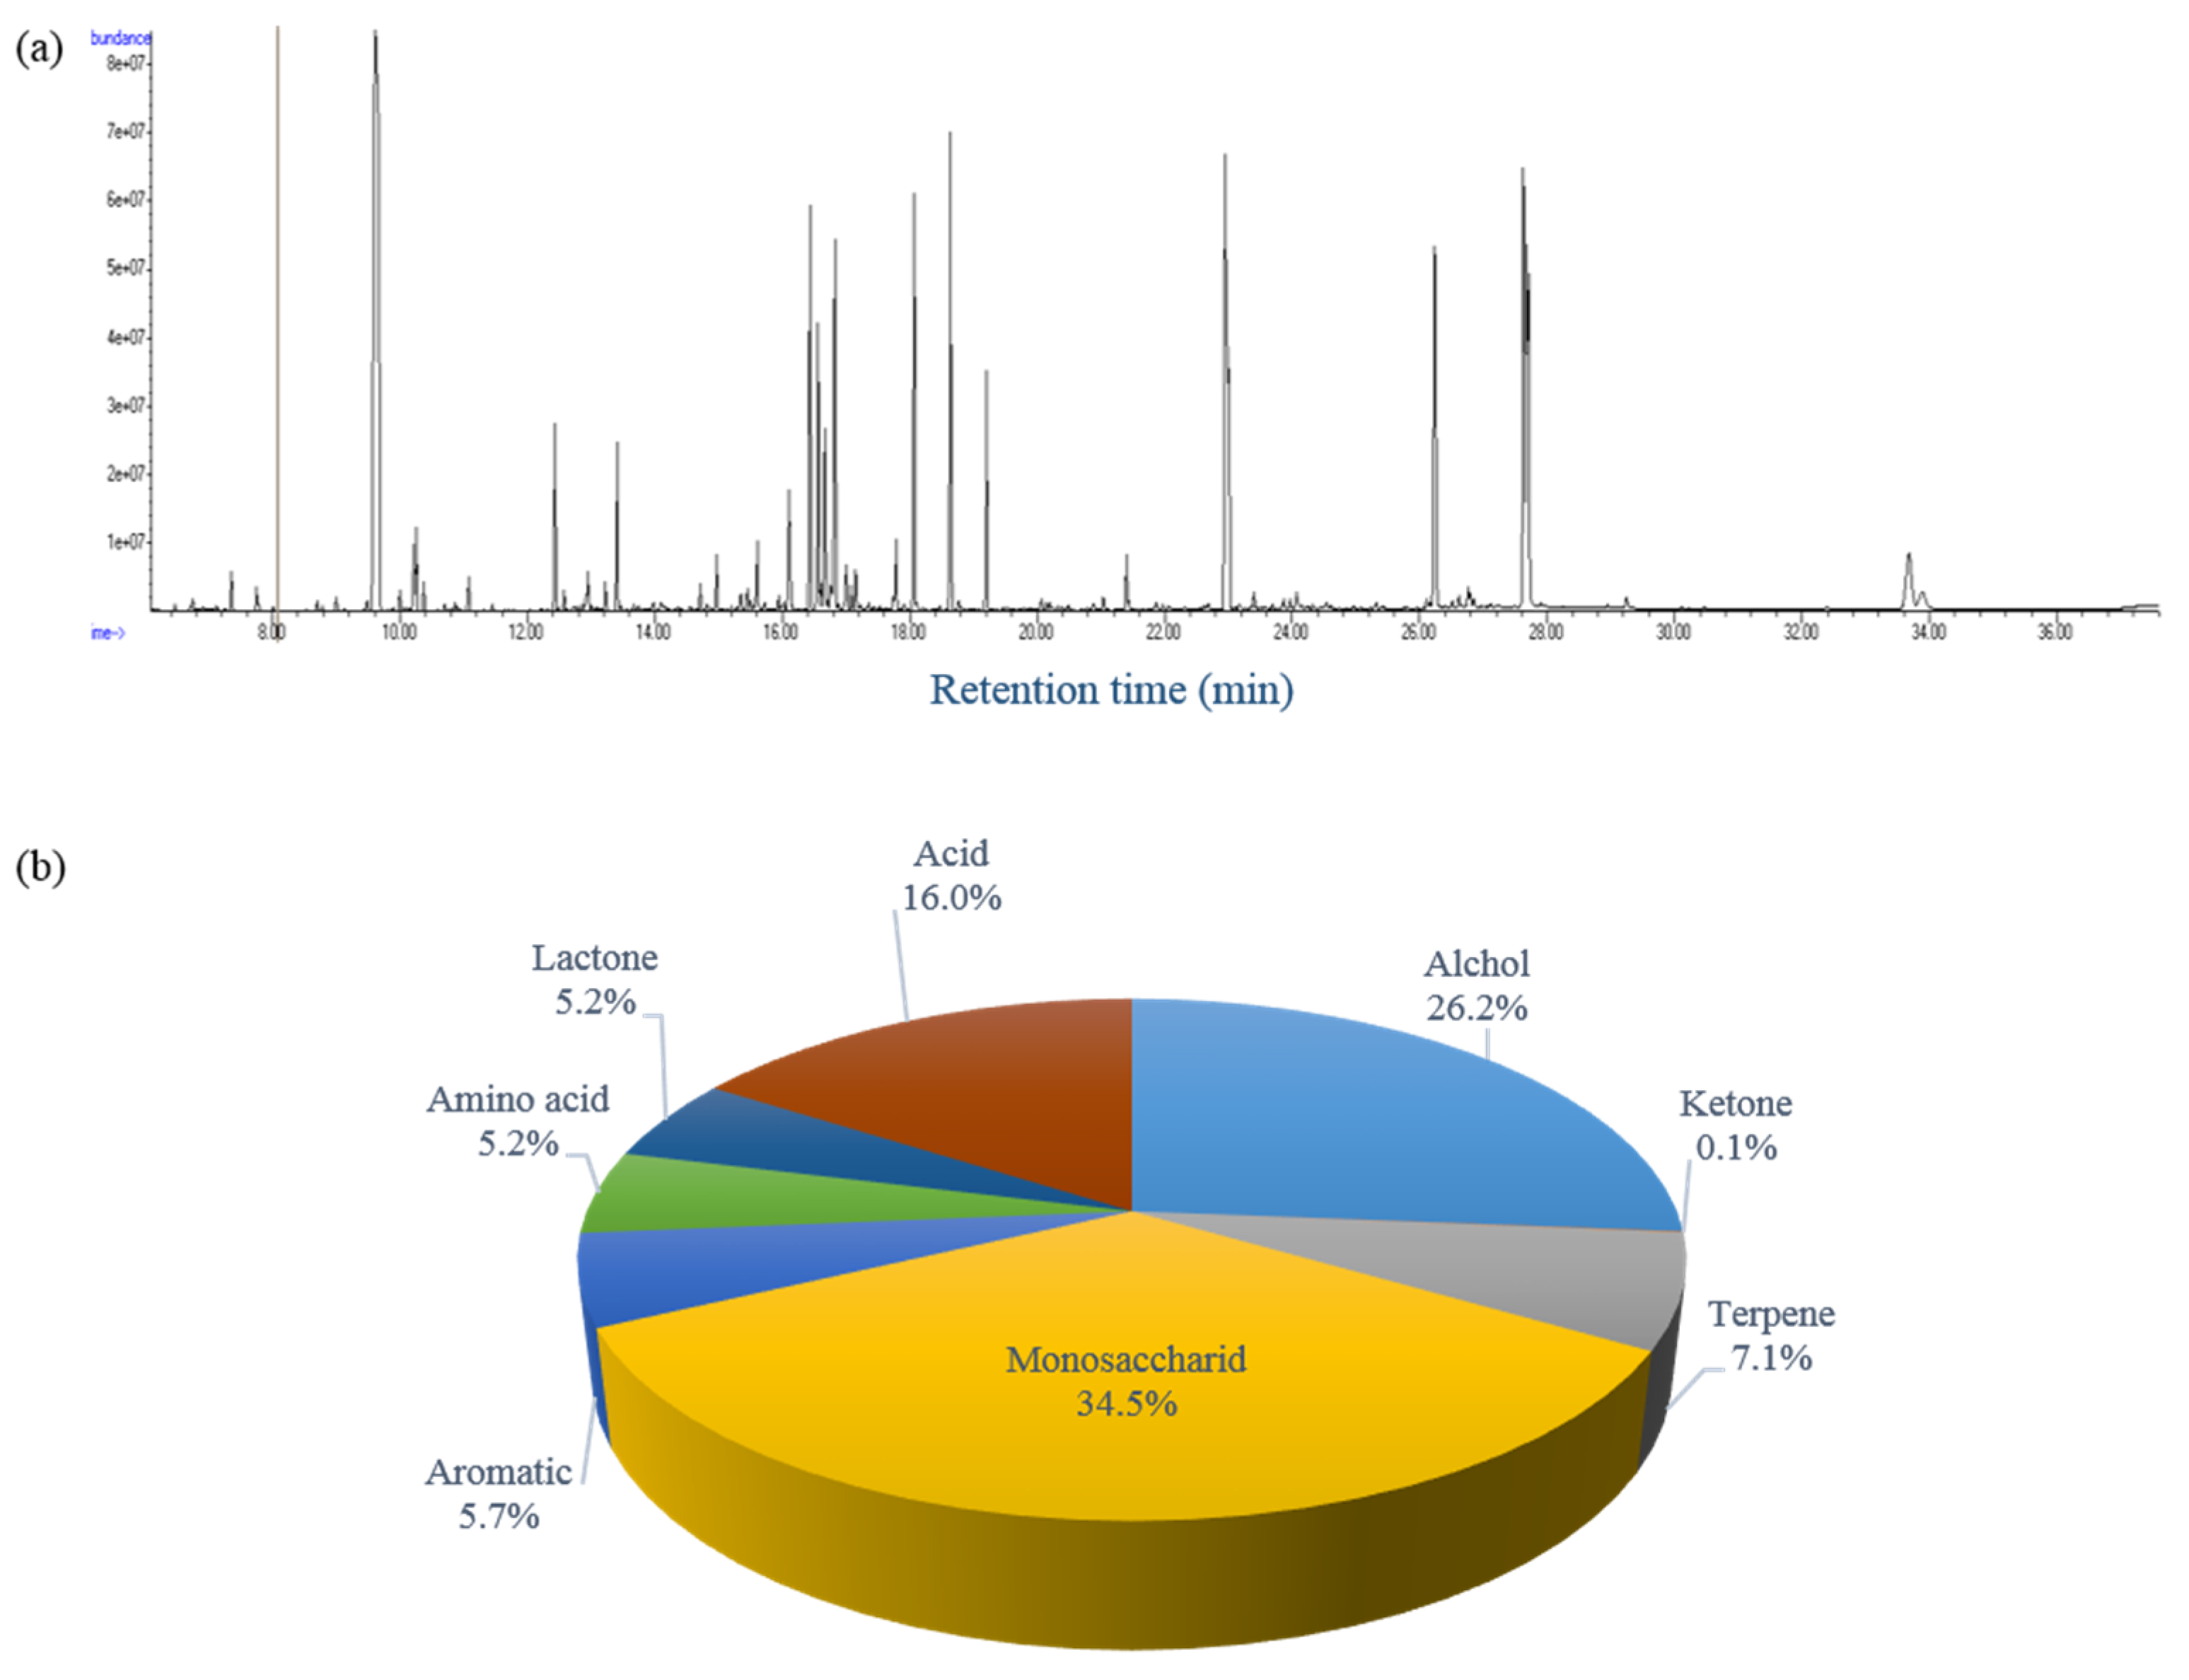
A simultaneous extraction of both polar and non-polar metabolites from the same sample is beneficial for a comprehensive understanding of the chemical compositions of Xanthii Fructus. Also, such an extraction will avoid much of the variation that can occur when trying to combine both types of metabolite information from separate samples [25]. To date, there has been no attempt to obtain both polar and fatty acid metabolites simultaneously for Xanthii Fructus. In this study, both polar and fatty acid fractions were simultaneously obtained as described in the section of materials and methods. The polar fraction in the upper phase was collected and derivatized with Methoximination (MeOX) and trimethylsilyl (TMS) reagents. A total ion chromatogram and the chemical classes of the polar fraction of a Xanthii Fructus sample obtained by GC-TOF MS are shown in Figure 3a. The results reveal that the observed chemical classification and the major compounds are clearly different depending on the sample preparation. While the HS-SPME method was favorable for the classes of aromatics and alcohols, monosaccharides and organic acids were the principal classes in order of the relative contents (%) obtained by the polar fraction from solvent extraction (Figure 3b).

2.2.2. Statistical Analysis of Polar Metabolites

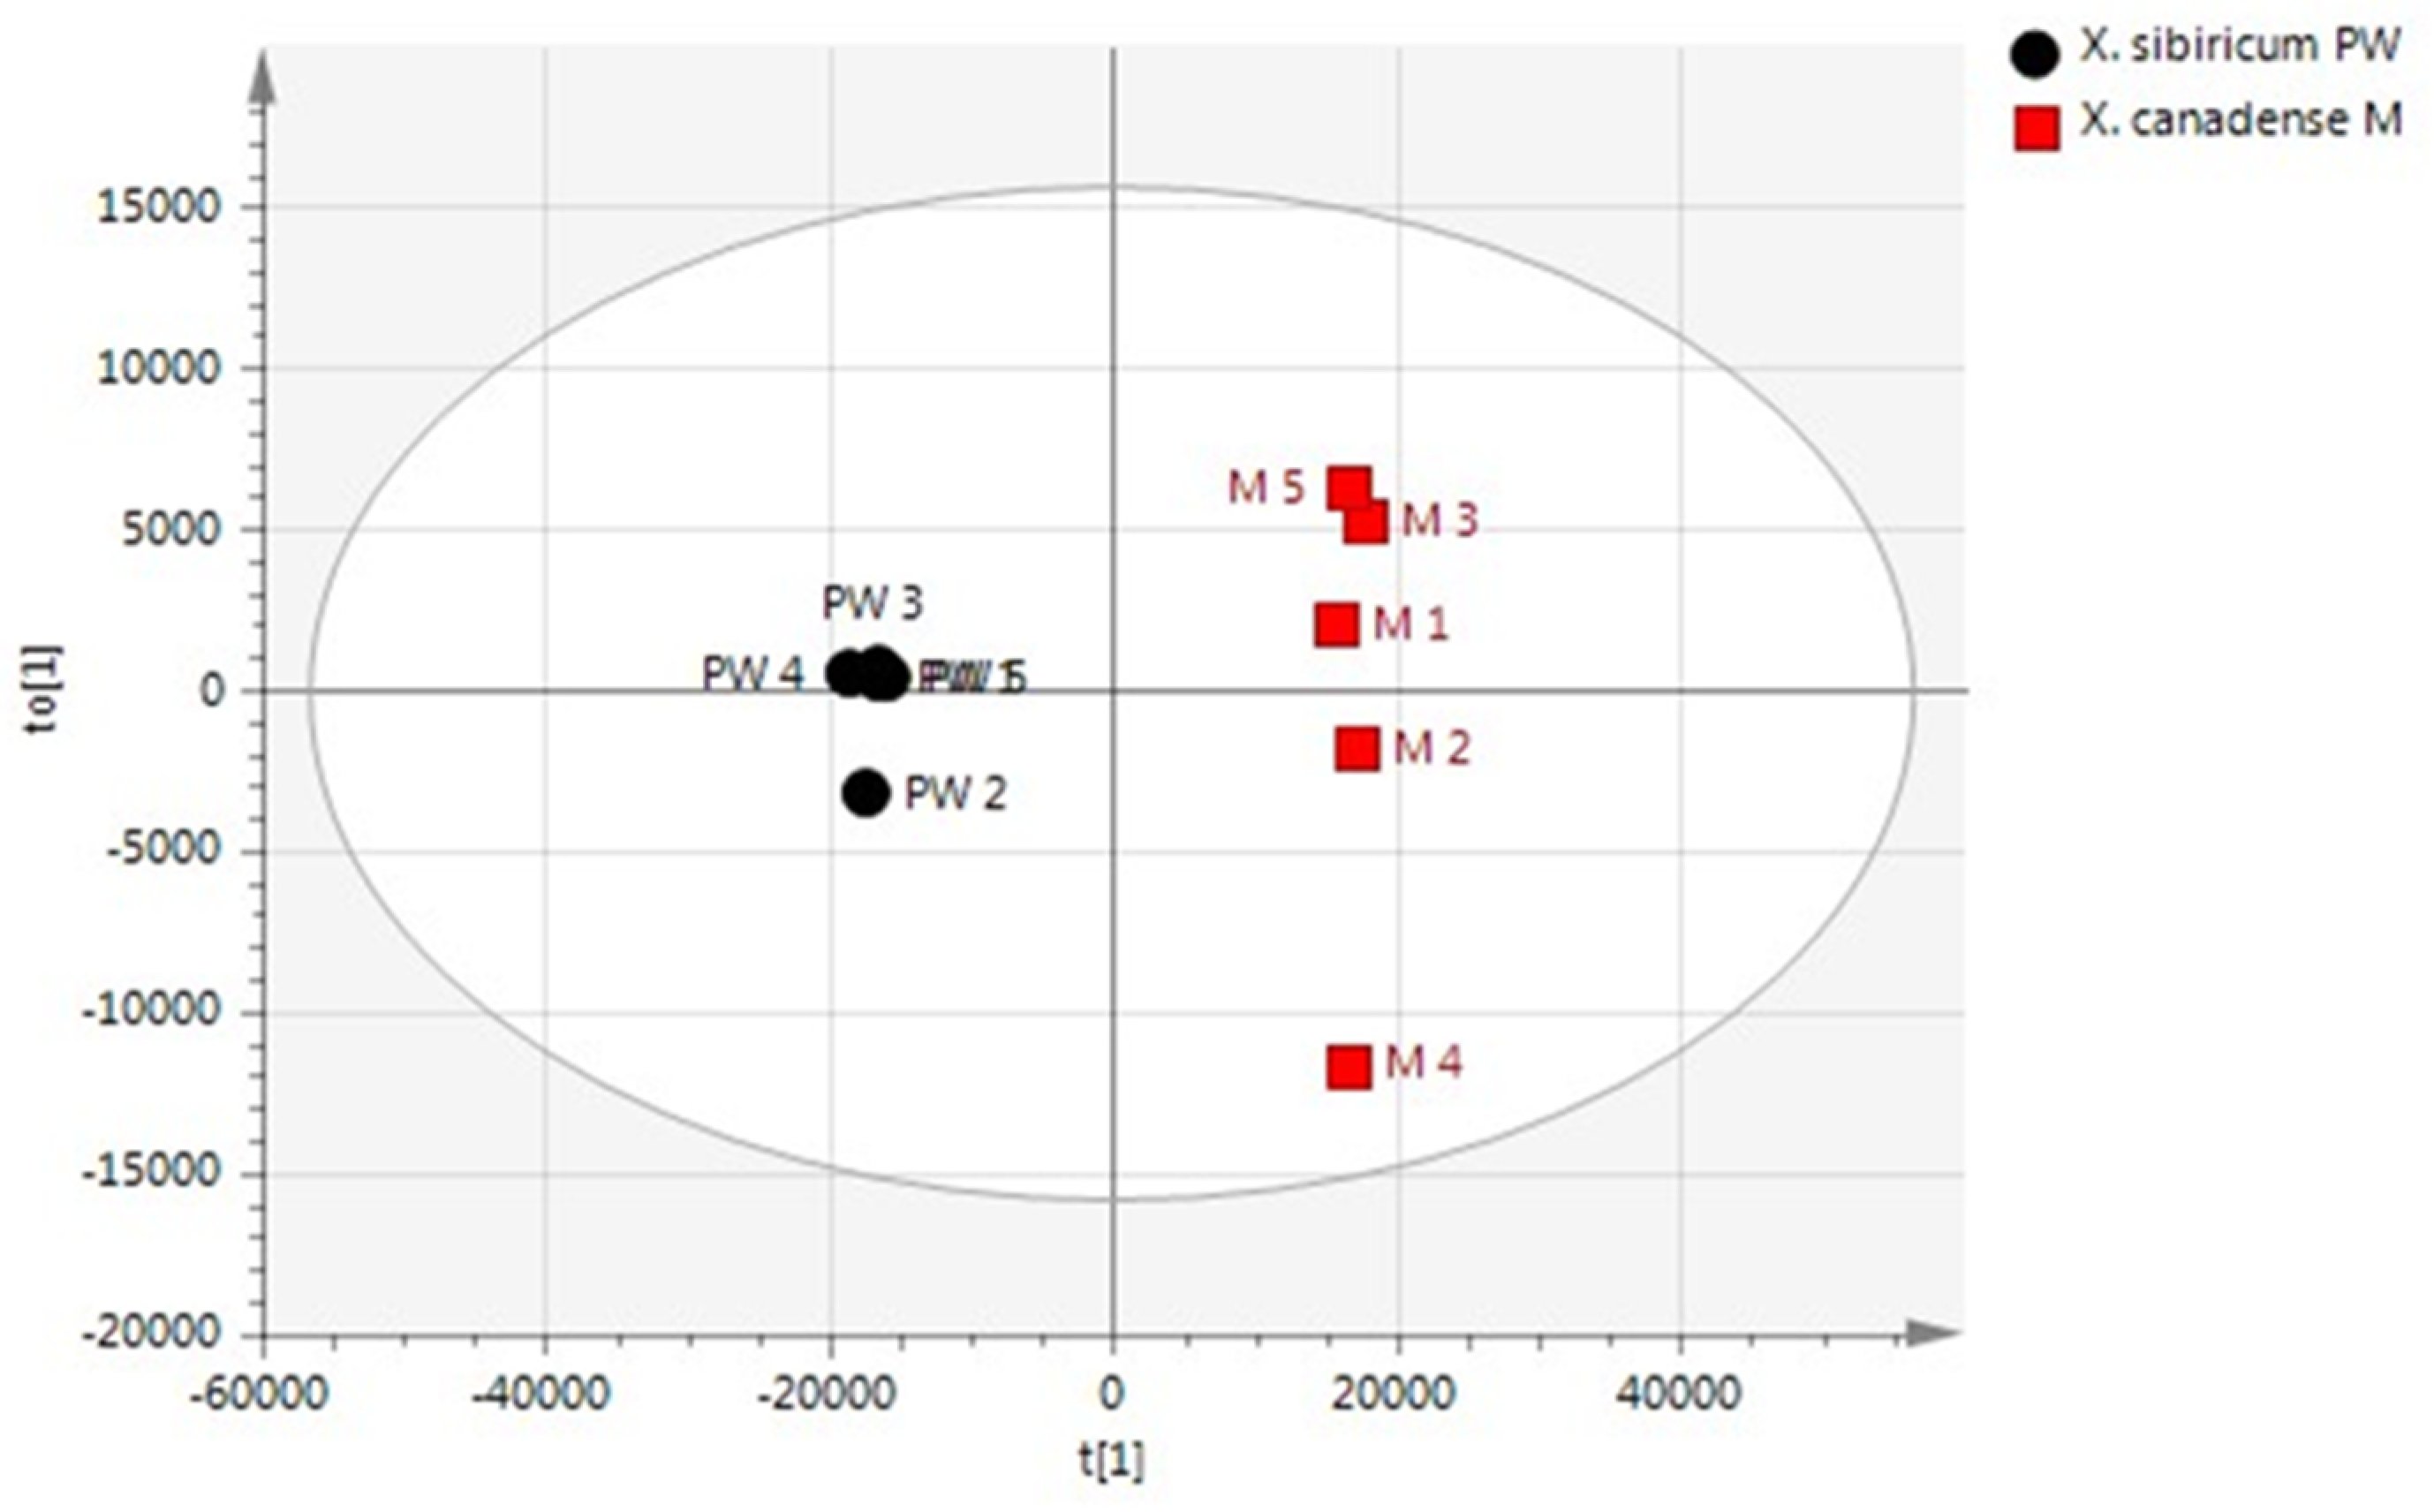
A total of 270 compounds were detected using GC-TOF MS and their response was normalized to that of succinic acid-d4 in the polar fraction for the semi-quantitative analysis. The OPLS-DA model revealed clear metabolic differentiation between the two species of X. canadense M and X. sibiricum PW (Figure 4). In the same way as for the findings for the VOC markers, the features that had relative standard deviations (RSDs) greater than 30% were removed to restrict the number of candidates with uncertainty. To find potential chemical markers contributing to the differences between X. canadense M and X. sibiricum PW, the criteria of p-values from the t-test and variable importance in the projection (VIP) values in the OPLS-DA were applied. Additionally, all the observations fell within the Hotelling T2 (0.95) ellipse, where the model fit parameters were R2X(cum) of 0.846, 0.998 of R2Y(cum), and 0.995 of Q2(cum), indicating that the OPLS-DA model established in this study has good fitness and prediction. The external validation process of OPLS-DA showed good discriminatory performance, such as R2X(cum) of 0.84, R2Y(cum) of 0.998, and Q2(cum) of 0.995. This prediction plot also shows the RMSEP of 0.0298, indicating the standard deviation (errors) of the predicted residuals.
By overlapping the differentially expressed features of the t-test (p-value < 0.01) and VIP score (>1) of the OPLS-DA, 19 polar metabolite compounds were picked out as potential candidates for discrimination of the two species (Supplementary Material, Table S2). The native metabolites were identified by the subtraction of the TMS groups from the derivatized molecules [26]. Among them, 11 compounds in the samples that have available commercial authentic standards were quantified and compared.

2.3. Quantitative Determination of the Chemical Markers

Based on the statistical analysis, a quantitative analysis of chemical markers was performed using their corresponding authentic standards to confirm the differences between two species of Xanthii Fructus. Nine target VOCs and 11 polar metabolites were selected and analyzed. The calibration curves of the 20 target markers were fitted with correlation coefficients of determination greater than 0.99. The linear ranges of calibration curves were set as 0.005~25 ng/mg for the VOCs, and diverse ranges were used to include the concentrations of target markers in the samples for polar metabolites. The average concentrations and relative standard deviation (RSD%) in the triplicate analysis of chemical markers identified in each sample of Xanthii Fructus based on their respective calibration curves are listed in Table 1. The concentrations below the calibration curves were not determined (n.d.). The concentrations of benzeneethanol, benzaldehyde, 1H-pyrrole-2-carboxaldehyde, 3-octen-2-one, butyrolactone, γ-caprolactone, δ-hexalactone, pantolactone, and γ-octalactone in the sample of X. canadense M were higher than those in X. sibiricum PW. In the case of polar metabolites, the concentrations of ethylene glycol, scyllo-inositol, succinic acid, d-glyceric acid, fumaric acid, malic acid, azelaic acid, and gluconic acid in the sample of X. canadense M were higher than those in X. sibiricum PW. On the other hand, the concentrations of l-(−)-arabitol, d-mannitol, and d-psicofuranose in the sample of X. sibiricum PW were higher than those in X. canadense M.

2.4. Fatty Acid Compositions of Xanthii Fructus by GC-MS Analysis

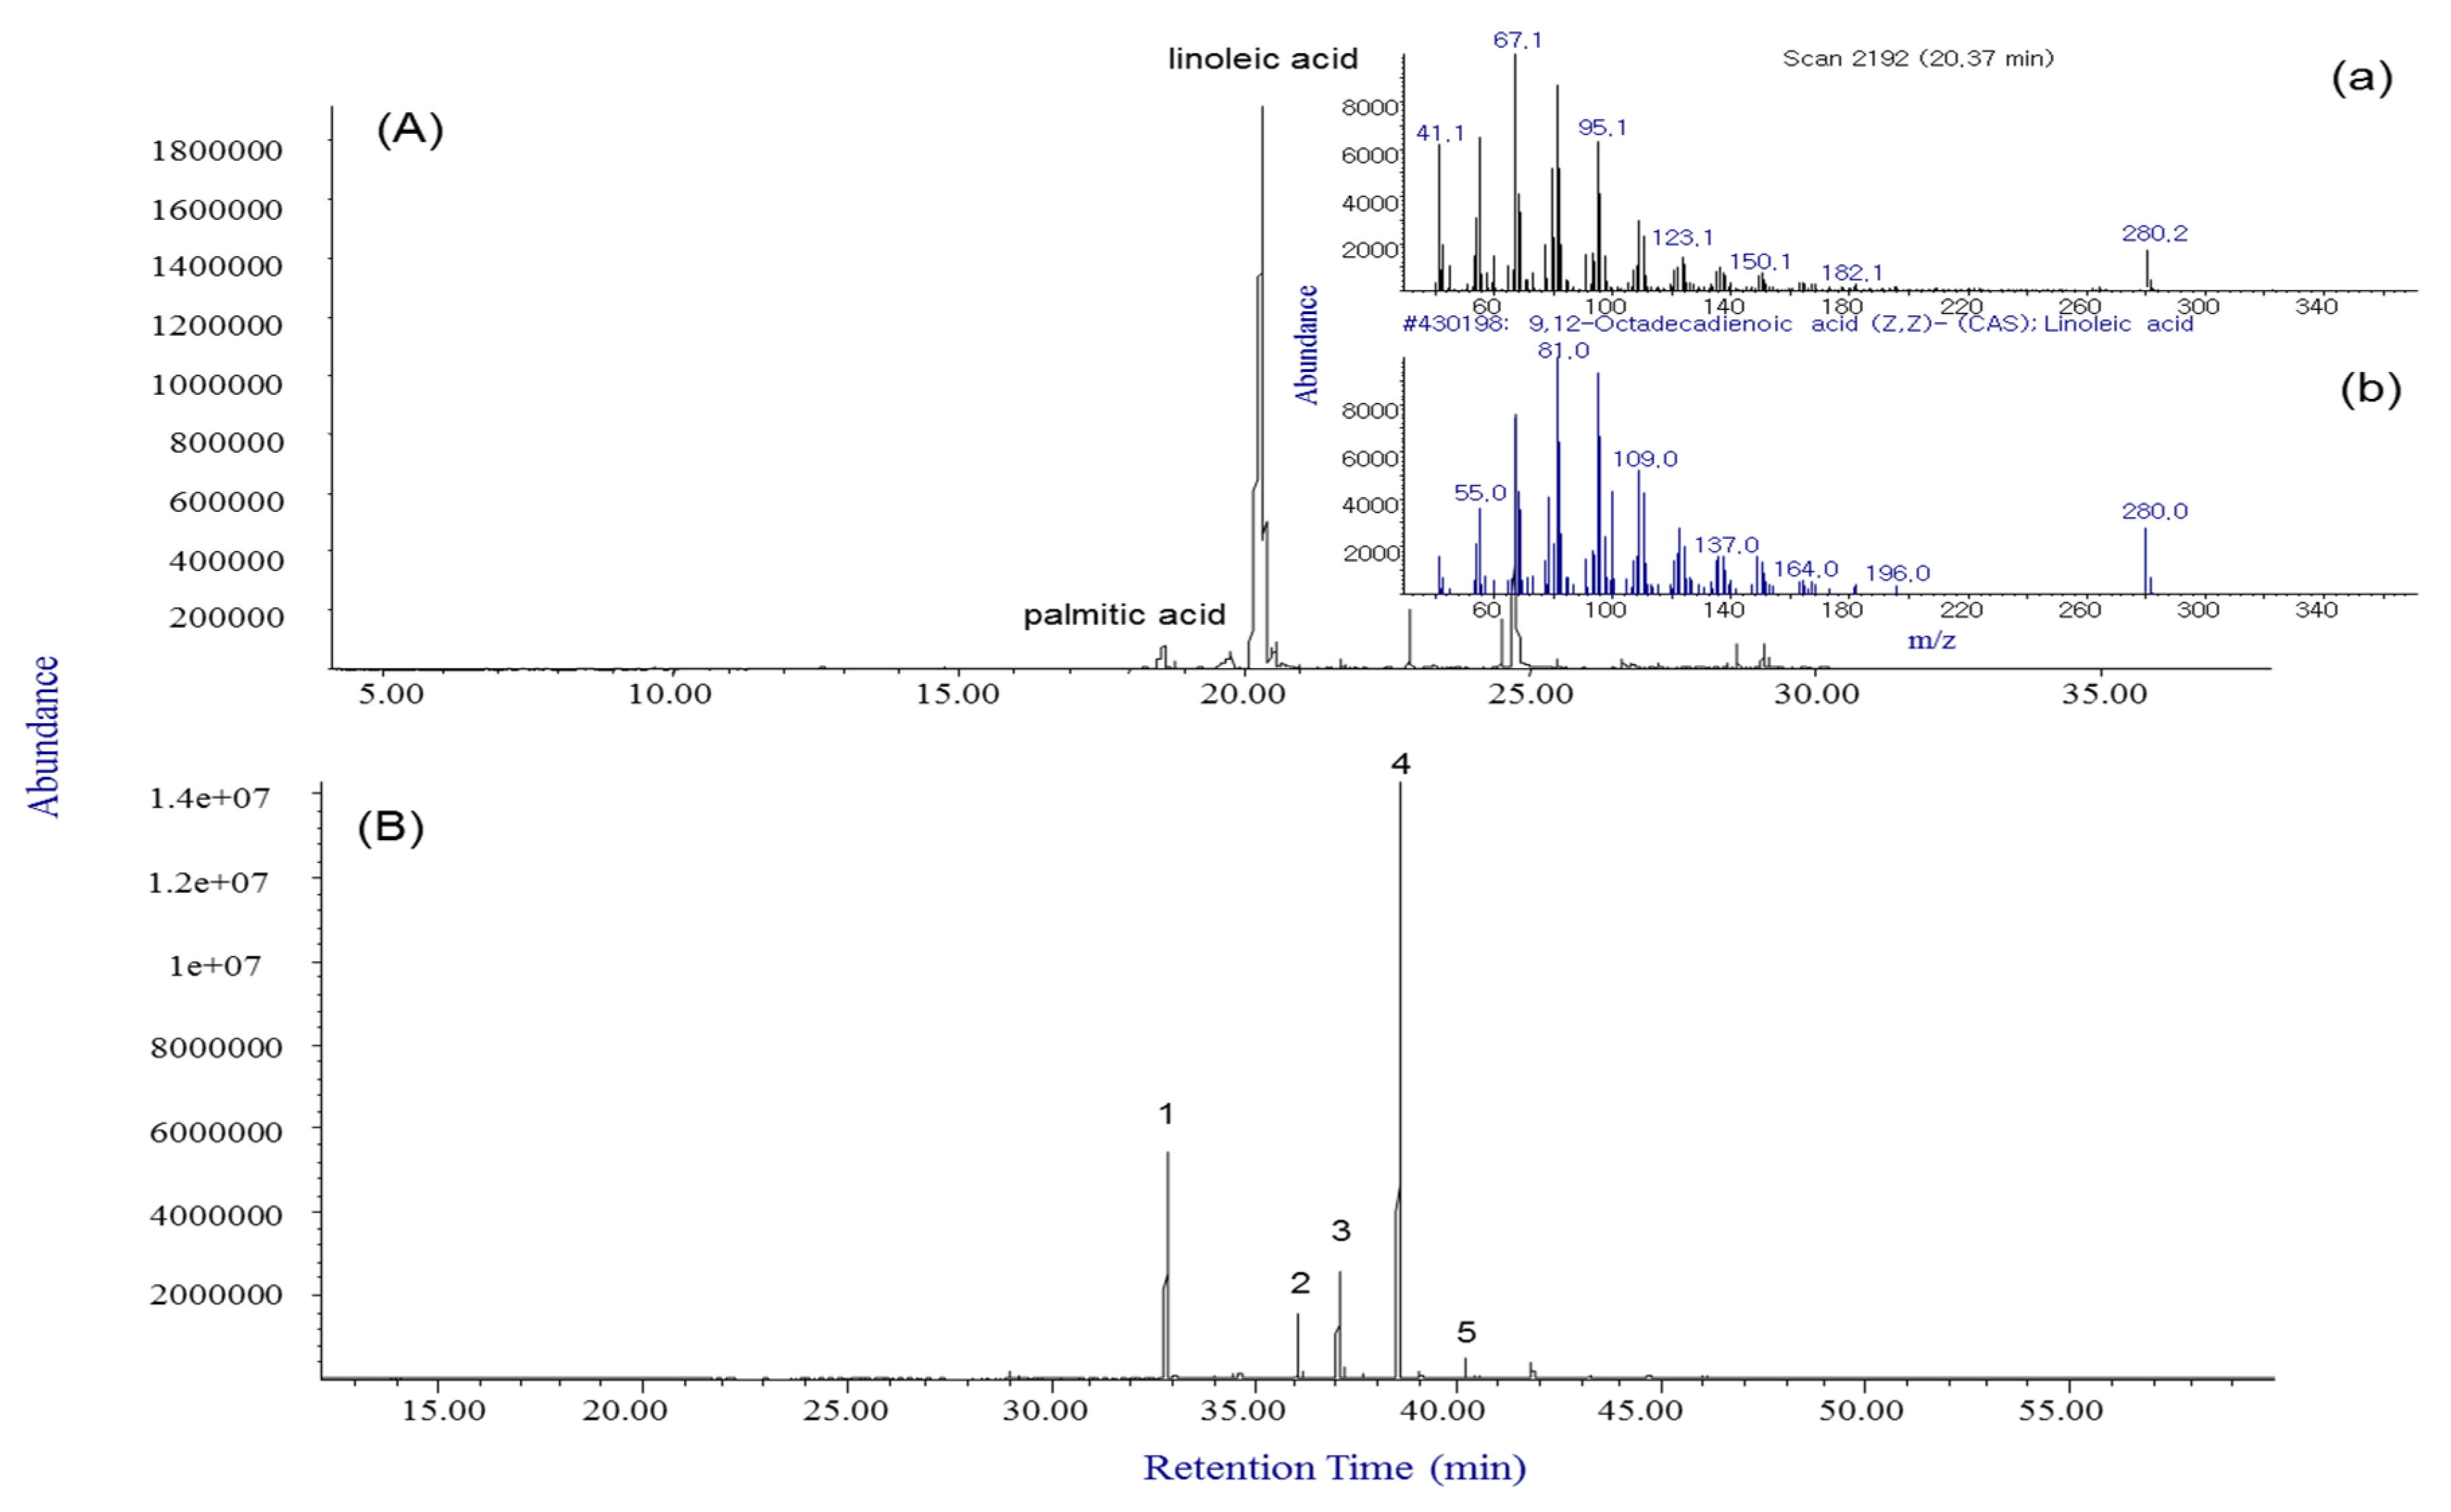
Fatty acids are classified based on the number of double bonds between carbon atoms, and there are saturated fatty acids (SFAs), monounsaturated fatty acids (MUFAs), and polyunsaturated fatty acids (PUFAs). Their profiles play an important role in human health, and PUFAs in foods are especially of interest because they are not synthesized in the human body [27,28]. In addition, fatty acid profiling has been used as a sensitive and reproducible biomarker and signature for characterizing microbial communities, such as bacteria and fungi [28,29]. In this study, the relative contents in accordance with the classification between X. canadense M and X. sibiricum PW were observed for the target 37 fatty acids. The esterification of fatty acids to fatty acid methyl esters (FAMEs) was performed with a 100 m length of a highly polar biscyanopropyl column to separate the saturated and unsaturated fatty acids. The peak shapes of all fatty acids under the esterification procedure improved significantly and were resolved entirely as their methyl esters on SP-2560 columns. The typical GC chromatograms obtained from the lipid phase of Xanthium fruit samples are shown in Figure 5 without esterification (A) and with the procedure (B).
Without the esterification procedure, linoleic acid was identified as a major component by consultation with the Wiley7n EI mass spectral library. However, this case did not separate the geometric and positional isomers such as γ-linolenic acid, α-linolenic acid, linolelaidic acid, and linoleic acid because individual EI mass spectra of the fatty acids were unclear owing to the presence of similar isomer series including unsaturated fatty acids with multiple double bonds. The above four fatty acid methyl ester forms were able to be separated with linolenic acid methyl ester on the SP-2560 column and identified by their individual mass spectra. These results show that a major fatty acid in the Xanthii Fructus samples was linolelaidic acid, which is a trans isomer of linoleic acid. To confirm the results more clearly, a standard mixture of 37 fatty acid methyl esters was used and assigned by comparison of their retention time, equivalent chain length [30], and mass spectra with those of standard FAMEs. The fatty acids and their relative contents in the two species of Xanthii Fructus are summarized in Table 2.
Fatty acids in the two species of Xanthii Fructus mostly exist as either MUFAs or PUFAs. Among the two species of Xanthii Fructus, linolelaidic acid (C18:2n6t) was detected as a major compound, although higher levels were detected in X. canadense M. Meanwhile, elaidic acid (C18:1n9t) was detected at higher levels in X. sibiricum PW than in X. canadense M. Several attempts were made to discriminate medicinal plants in accordance with species by determining the fatty acid profile [31], and the results of this study reveal that differences in the profiles of saturated, monounsaturated, and polyunsaturated fatty acids can be a criterion for distinguishing between the two species of Xanthii Fructus. A comparison of the results of relative contents among the two species showed that the amount of SFAs was similar, the detected amount of MUFAs was greater in X. sibiricum PW, and the detected amount of PUFAs was greater in X. canadense M.

3. Discussion

An efficient method was developed for the simultaneous broad range detection of compounds and applied to samples of Xanthium fruits. In accordance with physicochemical properties, three different fractions were obtained by the integrated sample preparation: VOCs, polar metabolites, and fatty acids. These were classified and each chemical marker in the three fractions was investigated to discriminate the two species of Xanthii Fructus. The OPLS-DA model results showed that the respective ratios of VOCs and polar metabolites have significant differences between X. canadense M and X. sibiricum PW. For characterizing between the two species, 27 VOCs and 19 polar metabolites were shown as potential markers. A quantitative analysis of 9 VOCs and 11 target polar metabolites was performed to confirm their differences. The concentrations of all target VOCs in the sample of X. canadense M were higher than those in X. sibiricum PW, and most of them belonged to a class of lactone. Previous studies have shown that these lactones play a role in antioxidant effects and the feasibility of pharmacological efficacy [32,33,34,35,36,37,38,39,40,41]. In the case of polar metabolites, the markers of the class of sugar alcohol such as l-(−)-arabitol and D-mannitol in the sample of X. sibiricum PW were at higher concentrations than those in X. canadense M. Also, selected organic acids as markers were present in greater concentrations in the sample of X. canadense M than in X. sibiricum PW. It is difficult to detect many polar phytochemicals such as polyphenols, which present at the lower concentrations compared to the primary metabolites in plants. The disadvantage of using GC-MS for them is that multiple derivatized peaks for the same metabolite with several functional groups might be detected; hence, the comprehensive identification and confirmation process is required. [42] Accordingly, the use of an LC-MS system that can provide information about the molecular mass and structural features of compounds has been on the rise [43]. Xanthii Fructus has higher contents of MUFAs and PUFAs than SFAs. MUFAs and PUFAs are well-known as healthy fat. Eating MUFAs can lower cholesterol levels and reduce the risk of heart disease and stroke. Consumption of moderate PUFAs can lower cholesterol levels and reduce the risk of heart disease [44]. These results could provide a foundation for further pharmacological activity studies.

4. Materials and Methods

4.1. Chemicals and Reagents

All solvents were high purity high-performance liquid chromatography (HPLC) grade purchased from J.T. Baker (Philipsburg, NJ, USA). Distilled water was filtered using a Milli-Q Reagent Water System (Millipore, Billerica, MA, USA). Methyloctanoate, succinic acid-d4, methoxyamine hydrochloride, pyridine, sodium sulfate, and boron trifluoride-methanol were purchased from Sigma-Aldrich (St. Louis, MO, USA). The certified reference material (CRM), a 37 fatty acid methyl ester mixture, and N-methyl-N-(trimethylsilyl)trifluoroacetamide with trimethylchlorosilane as a silylation reagent were purchased from Sigma-Aldrich (St. Louis, MO, USA). The standards of benzeneethanol, benzaldehyde, 1H-pyrrole-2-carboxaldehyde, γ-butyrolactone, γ-caprolactone, δ-hexalactone, γ-octalactone, ethylene glycol, l-(−)-arabitol, d-mannitol, scyllo-inositol, d-glyceric acid sodium salt, fumaric acid, d-psicofuranose, d-gluconic acid solution, and succinic acid were purchased from Sigma-Aldrich (St. Louis, MO, USA). 3-Octen-2-one, pantolactone, malic acid, and azelaic acid were obtained from Supelco (Bellefonte, PA, USA).

4.2. Preparation of Samples

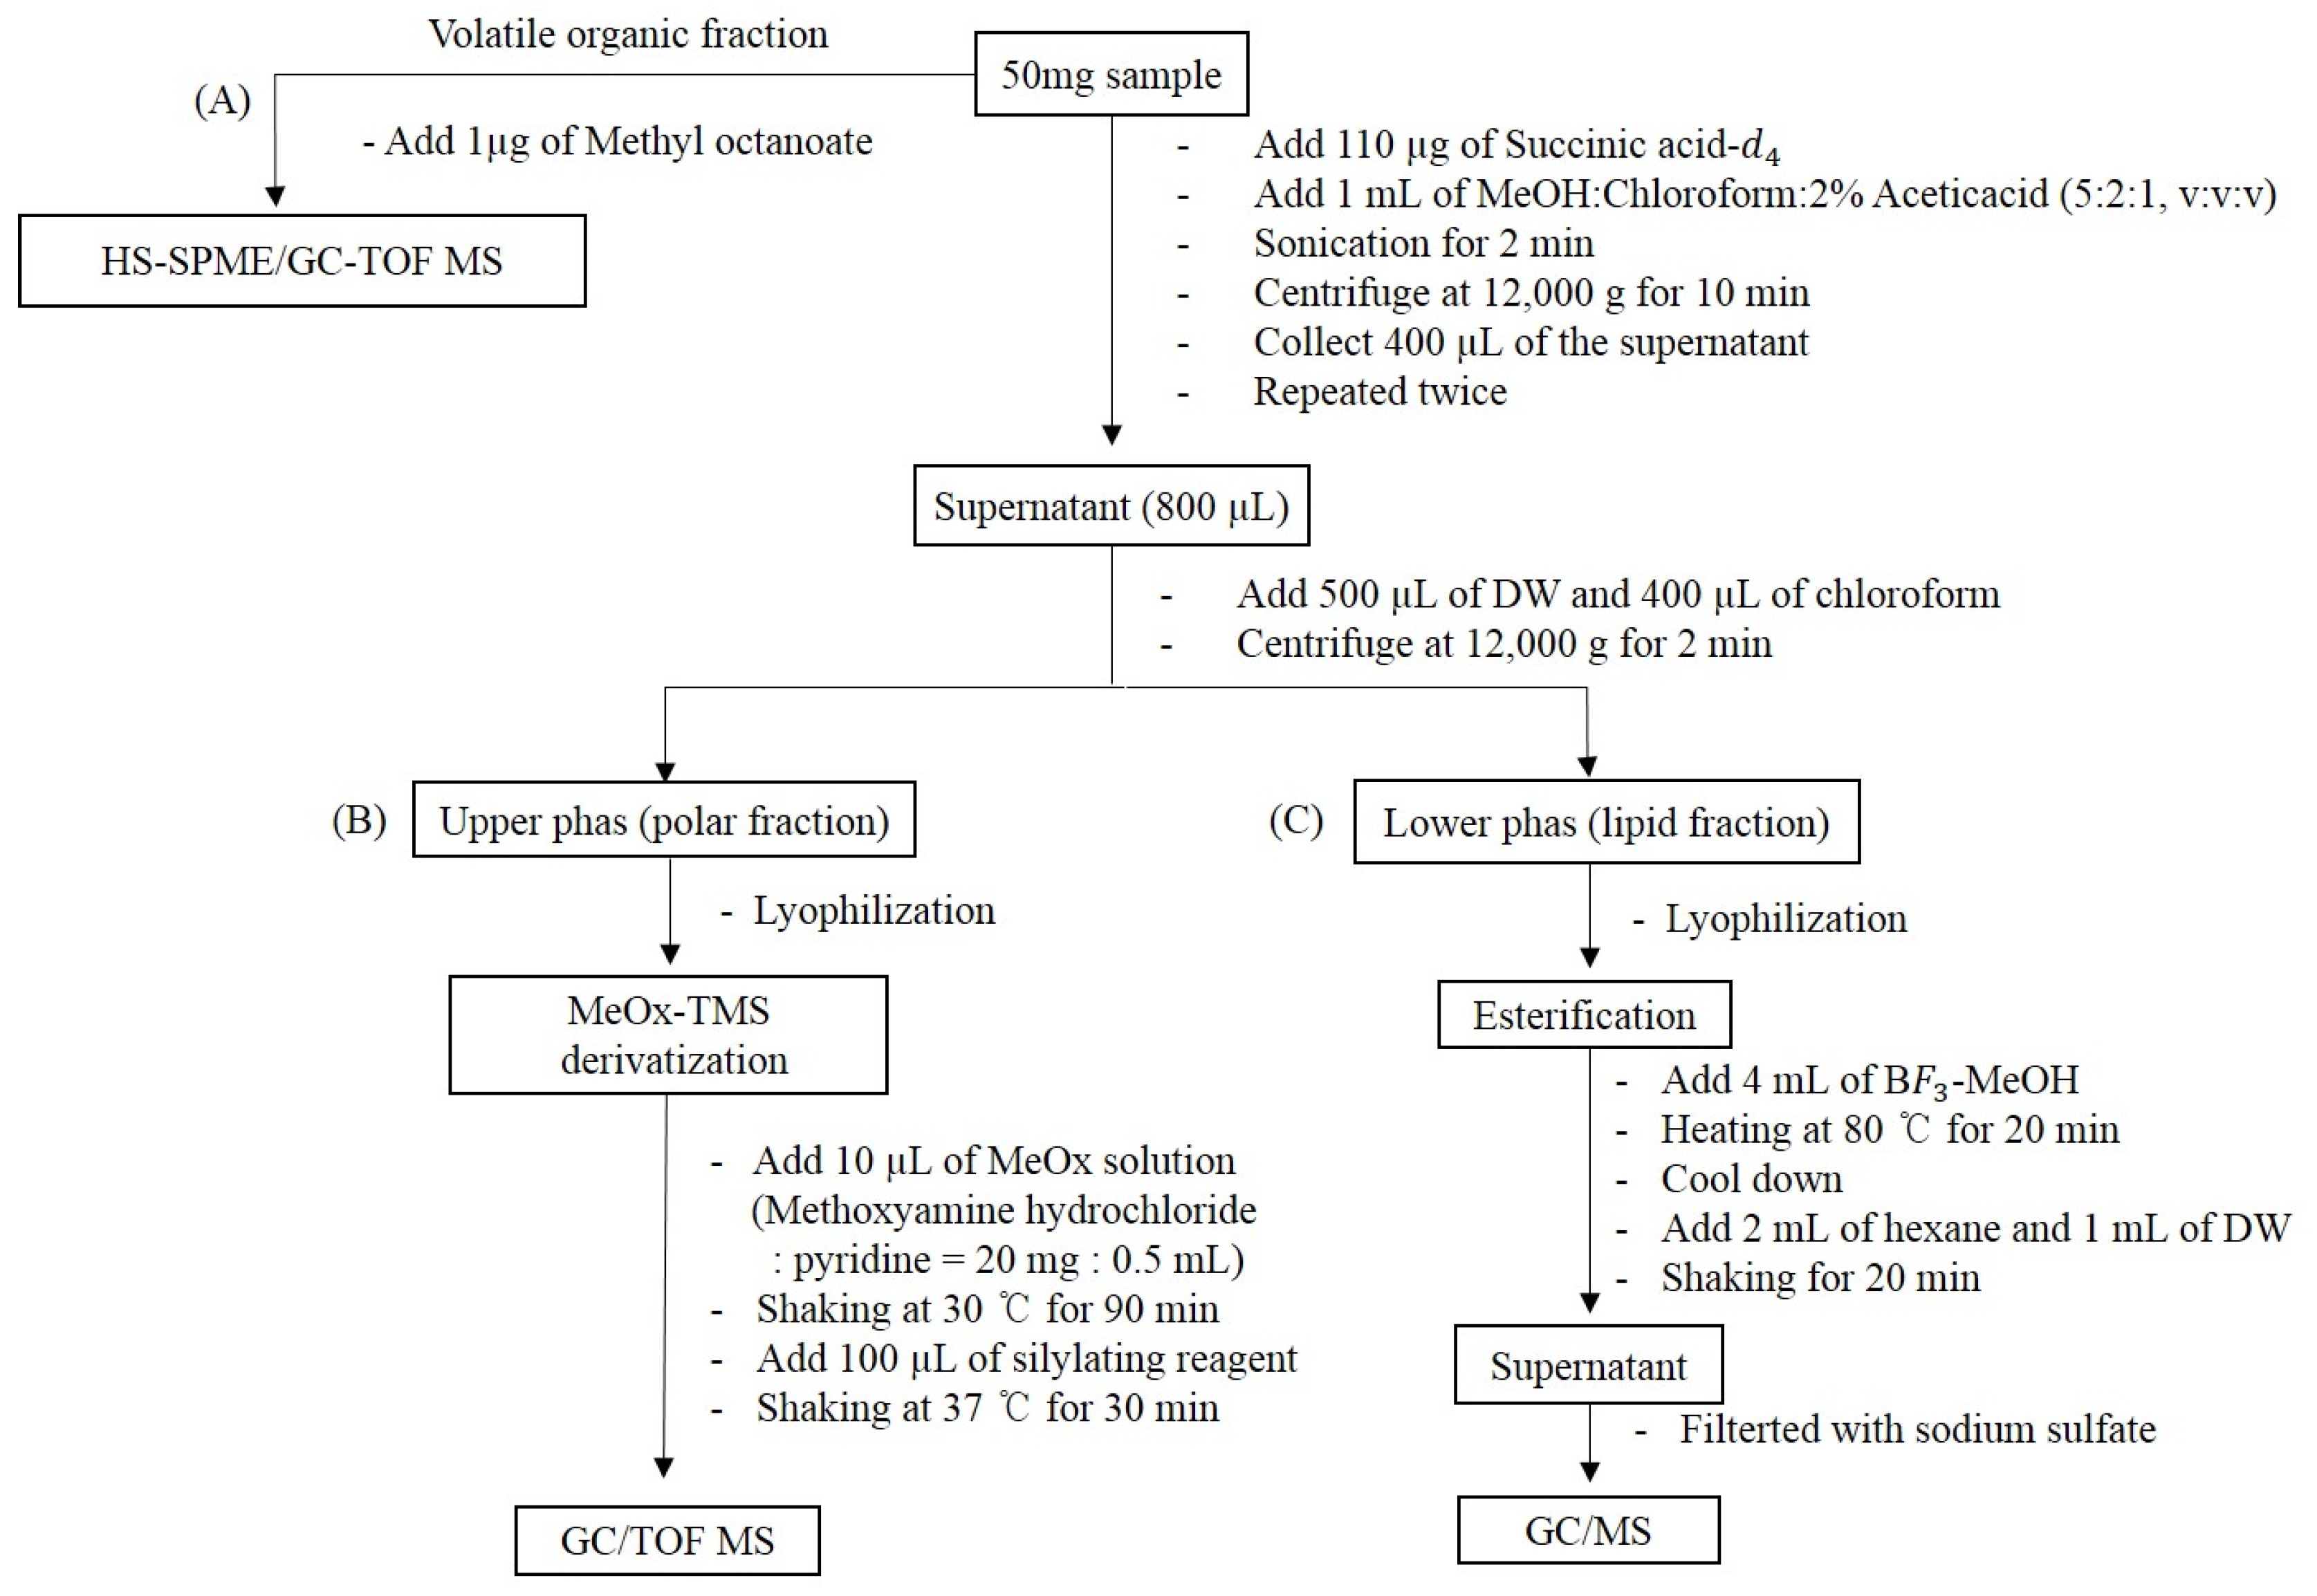
Ethanol extracts (70%) for Xanthii Fructus were obtained from the Korea Research Institute of Bioscience & Biotechnology (KRIBB) from the species of Xanthium canadense Mill. (X. canadense M, voucher number: unidentified) obtained from Yeongcheon, Gyeongsang, South Korea, and Xanthium sibiricum Patrin ex Widder (X. sibiricum PW, voucher number: D180305001) obtained from Inner Mongolia (China). Two aliquots of 50 mg of dried samples were taken, to which was subsequently added 100 μg of internal standard (succinic acid-d4) for solvent extraction analysis. For the HS-SPME/GC-TOF MS analysis, 200 mg of dried samples were used with 1 μg of methyloctanoate added as an internal standard. Five experiments were conducted with different weights of the samples of X. canadense M and X. sibiricum PW per two sampling methods. For the solvent extraction, 1 mL of a methanol, chloroform, and 2% acetic acid mixture (5/2/1, v/v/v) was added and the mixture was sonicated for 2 min. Then centrifugation was performed for 10 min and, by repeating these steps, the supernatants were collected. Polar primary metabolites and lipids were obtained from simultaneous fractionation (Figure 6). Two steps of derivatization for the profiling of polar primary metabolites and esterification to determine the fatty acid composition were applied to each fraction based on previous studies [45]. Five replicate measurements were conducted for each sample.

4.3. Preparation of Standards

For the quantification of VOC markers, 3-octen-2-one, γ-caprolactone, benzeneethanol, and 1H-pyrrole-2-carboxaldehyde were dissolved in water and benzaldehyde, butyrolactone, δ-hexalactone, pantolactone, and γ-octalactone were dissolved in ethanol, each at concentrations of 500 μg/mL. Seven calibration points in the concentration range of 0.005~25 ng/mg based on the amount of sample were prepared with the addition of 1 μg of methyloctanoate as an internal standard (100 μg/mL of 10 μL). For the polar metabolites, six calibration points, including the concentration level of the sample, were prepared by exactly the same process as the sample preparation for the polar fraction, as shown in the Figure 6B. Each standard concentration range was followed, and the concentrations based on the amount of sample were in the range of 20 to 2000 ng/mg for ethylene glycol, d-glyceric acid, gluconic acid, fumaric acid, azelaic acid, and d-mannitol; 20 to 4000 ng/mg for scyllo-inositol, succinic acid, and malic acid; and 20 to 10,000 ng/mg for l-(−)-arabitol and d-psicofuranose.

4.4. GC-TOF MS Analysis

GC-TOF MS analysis was carried out using an Agilent 7890B gas chromatograph equipped with a Pegasus 4D (Leco, St. Joseph, MI, USA) time-of-flight mass spectrometer (TOF-MS). HS-SPME sampling was performed by a combi-PAL autosampler (CTC Analytics, Zurich, Switzerland). A 50/30 µm divinylbenzene/carboxen/polydimethylsiloxane (DVB/CAR/PDMS) fiber purchased from Supelco (Bellefonte, PA, USA) was used. Chromatographic separation was achieved using a DB-WAX capillary column (30 m × 0.25 µm ID; 0.25 µm film thickness) from J&W Scientific (Santa Clara, CA, USA) along with a Siltek SPME splitless liner 0.75 mm ID from Supelco (Bellefonte, PA, USA). The sample vial was incubated for 20 min at 80 °C, and the SPME fiber was exposed to the headspace for 30 min before desorption for 5 min at 240 °C in the injection port. The GC oven temperature was started at 40 °C for 2 min and then raised to 240 °C at 10 °C per min. For the analysis of polar metabolites, the GC oven temperature was held at 60 °C for 2 min and raised at 10 °C/min to 310 °C for 20 min using a DB-5MS capillary column (30 m × 0.25 mm ID; 0.25-μm film thickness) from J&W Scientific (Santa Clara, CA, USA). The temperature of the injector was 250 °C, and column flow rate was set at 1 mL/min in a split ratio of 10:1. The TOF-MS was operated in electron impact (EI) mode at 70 eV electron energy. The mass spectrometry data were acquired at the full scan mode, which ranged between m/z 40 and 600, with an acquisition rate of 10 spectra per second.

4.5. Statistical Analysis

GC-TOF MS data were analyzed by ChromaTOF software and processed using a statistical compare function including peak deconvolution, alignment, and baseline correction before statistical analysis. Compound identifications were carried out by ChromaTOF software combined with two mass spectral libraries (NIST 17 and LECO/Fiehn Metabolomics Library), and the criteria of match factors were above 800. To quantify the compounds, the integrated areas based on those quantifying ions were normalized to the areas of each of the internal standards (methyloctanoate, succinic acid-d4). Orthogonal partial least-squares discriminant analysis (OPLS-DA) was performed and treated using log transformation and Pareto scaling by a SIMCA-P+ software package (version 15.0, Umetrics, Umeå, Sweden).

4.6. Analysis of Fatty Acid Composition by GC-MS Analysis

The polarity of the column stationary phase, SP-2560 (100 m × 0.25 mm ID; 0.25 µm film thickness) from Supelco (Bellefonte, PA, USA) in conjunction with an Agilent 7890B gas chromatograph equipped with a 5977A quadrupole mass spectrometer (GC-MS) system, was used to improve peak resolution and separated 37 FAMEs completely. The temperature of the GC injector was 240 °C and the injection was made in splitless mode. The helium as carrier gas (99.999%) flow was 1 mL/min. The GC oven temperature program was as follows. The initial temperature of 100 °C was held for 5 min after injection. Then the temperature was increased up to 240 °C at 4 °C /min and held for 20 min. The CRM was used to determine the fatty acid elution order and also to properly identify each fatty acid in the sample with GC-MS to confirm peaks matched with the CRM.

5. Conclusions

In summary, this work presents a comprehensive study on the chemical composition of Xanthii Fructus and the differentiating characteristics of two species (X. canadense M and X. sibiricum PW) using a GC-MS platform. An integrated sample preparation was applied for the simultaneous broad range detection of compounds. For the discovery of biomarkers in accordance with different sample fractions, statistical criteria, RSDs (<30%), VIP score (>1), and p-value (<0.01), were adopted from the OPLS-DA model. Among them, 9 VOCs and 11 polar metabolites were quantitatively analyzed and their concentrations, which showed differences in the two species of Xanthium fruits, demonstrated the validity for the statistical results. Furthermore, free fatty acid profiles were used to characterize the two species of Xanthii Fructus in this study. Our results indicate that the global chemical compositions of Xanthii Fructus are diverse in terms of species, even though the morphological appearances of the species are similar. Our findings also provide a method for the comprehensive evaluation and quality control of medicinal plants by considering multiple constituents.

Supplementary Materials

The following are available online. Table S1: Potential candidates for discrimination between X. canadense M and X. sibiricum PW obtained by VOCs profiles, Table S2: Potential candidates for discrimination of polar metabolites between X. canadense M and X. sibiricum PW obtained by GC-TOF MS.

Author Contributions

H.K.; Y.G.A. designed the study. The experiment was executed by H.K., Y.J., and S.H.J. Supervision of experimental work and analysis of results were done by Y.J.; G.-S.H., and Y.G.A., H.K., Y.G.A. contributed to the draft version of the manuscript.

Funding

This work was supported by the Bio-Synergy Research Project of the Ministry of Science, ICT & Future Planning through the National Research Foundation Basic Science Research (NRF-2019001542).

Conflicts of Interest

The authors declare no conflict of interest.

References

  1. Amin, S.; Barkatullah, H.K. Pharmacology of Xanthium species. A review. J. Phytopharm. 2016, 5, 126–127. [Google Scholar]
  2. Goodarzi, M.; Russell, P.J.; Vander Heyden, Y. Similarity analyses of chromatographic herbal fingerprints: A review. Analytica Chimica Acta 2013, 804, 16–28. [Google Scholar] [CrossRef] [PubMed]
  3. Kamboj, A.; Saluja, A.K. Phytopharmacological review of Xanthium strumarium L. (Cocklebur). Int. J. Green Pharm. 2010, 4. [Google Scholar] [CrossRef]
  4. Kan, S.; Chen, G.; Han, C.; Chen, Z.; Song, X.; Ren, M.; Jiang, H. Chemical constituents from the roots of Xanthium sibiricum. Nat. Prod. Res. 2011, 25, 1243–1249. [Google Scholar] [CrossRef] [PubMed]
  5. Zhang, W.Z.; LI, N. Chemical constituents and bioactivity of Xanthium sibiricum Patrin. ex Widder. J. Sci. Teachers’College Univer. 2016, 10. [Google Scholar]
  6. Sakuda, Y.; Tahara, T. The Constituents of Essential Oil from Xanthium canadense Mill. J. Japan Oil Chem. Soc. 1982, 31, 151–153. [Google Scholar] [CrossRef]
  7. Li, N.; Zhang, W.-Z. Study on chemical constituents of Xanthium sibiricum Patrin ex Widder. J. Qiqihar Univer. 2016, 4, 13. [Google Scholar]
  8. Tang, J.S.; Jiang, C.Y.; Liu, Y.; Zhang, X.Y.; Shao, H.; Zhang, C. Allelopathic potential of volatile organic compounds released by Xanthium sibiricum Patrin ex Widder. Allelopathy J. 2019, 47, 233–241. [Google Scholar] [CrossRef]
  9. Henson, I.; Wareing, P. Cytokinins in Xanthium strumarium L.: Distribution in the plant and production in the root system. J. Exp. Botany 1976, 27, 1268–1278. [Google Scholar] [CrossRef]
  10. Kim, I.T.; Park, Y.M.; Won, J.H.; Jung, H.J.; Park, H.J.; Choi, J.W.; Lee, K.T. Methanol extract of Xanthium strumarium L. possesses anti-inflammatory and anti-nociceptive activities. Bio. Pharm. Bull. 2005, 28, 94–100. [Google Scholar] [CrossRef] [PubMed]
  11. Lin, B.; Zhao, Y.; Han, P.; Yue, W.; Ma, X.Q.; Rahman, K.; Han, T. Anti-arthritic activity of Xanthium strumarium L. extract on complete Freund’s adjuvant induced arthritis in rats. J. Ethnopharmacol. 2014, 155, 248–255. [Google Scholar] [CrossRef] [PubMed]
  12. Sharifi-Rad, J.; Hoseini-Alfatemi, S.M.; Sharifi-Rad, M.; Sharifi-Rad, M.; Iriti, M.; Sharifi-Rad, M.; Sharifi-Rad, R.; Raeisi, S. Phytochemical compositions and biological activities of essential oil from Xanthium strumarium L. Molecules 2015, 20, 7034–7047. [Google Scholar] [CrossRef] [PubMed]
  13. Yadav, R.; Agarwala, M. Phytochemical analysis of some medicinal plants. J. Phytol. 2011, 3. [Google Scholar]
  14. Yoon, J.H.; Lim, H.J.; Lee, H.J.; Kim, H.D.; Jeon, R.; Ryu, J.H. Inhibition of lipopolysaccharide-induced inducible nitric oxide synthase and cyclooxygenase-2 expression by xanthanolides isolated from Xanthium strumarium. Bioorg. Med. Chem. Lett. 2008, 18, 2179–2182. [Google Scholar] [CrossRef] [PubMed]
  15. Iordache, A.; Culea, M.; Gherman, C.; Cozar, O. Characterization of some plant extracts by GC–MS. Nucl. Ins. Methods Phys. Res. 2009, 267, 338–342. [Google Scholar] [CrossRef]
  16. Taherpour, A.A.; Khaef, S.; Yari, A.; Nikeafshar, S.; Fathi, M.; Ghambari, S. Chemical composition analysis of the essential oil of Mentha piperita L. from Kermanshah, Iran by hydrodistillation and HS/SPME methods. J. Analy. Sci. Technol. 2017, 8, 11. [Google Scholar] [CrossRef]
  17. Boyacı, E.; Rodriguez-Lafuente, A.; Gorynski, K.; Mirnaghi, F.; Souza-Silva, E.A.; Hein, D.; Pawliszyn, J. Sample preparation with solid phase microextraction and exhaustive extraction approaches: Comparison for challenging cases. Analytica Chimica Acta 2015, 873, 14–30. [Google Scholar] [CrossRef] [PubMed]
  18. Manzo, A.; Panseri, S.; Vagge, I.; Giorgi, A. Volatile Fingerprint of Italian Populations of Orchids Using Solid Phase Microextraction and Gas Chromatography Coupled with Mass Spectrometry. Molecules 2014, 19, 7913–7936. [Google Scholar] [CrossRef] [PubMed]
  19. Zhang, Q.H.; Zhou, L.D.; Chen, H.; Wang, C.Z.; Xia, Z.N.; Yuan, C.S. Solid-phase microextraction technology for in vitro and in vivo metabolite analysis. TrAC Trends Analy. Chem. 2016, 80, 57–65. [Google Scholar] [CrossRef] [PubMed]
  20. Han, T.; Zhang, Q.Y.; Zhang, H.; Wen, J.; Wang, Y.; Huang, B.K.; Qin, L.P. Authentication and quantitative analysis on the chemical profile of Xanthium fruit (Cang-Er-Zi) by high-performance liquid chromatography-diode-array detection tandem mass spectrometry method. Analytica Chimica Acta 2009, 634, 272–278. [Google Scholar] [CrossRef] [PubMed]
  21. Rodríguez-Burruezo, A.; Kollmannsberger, H.; González-Mas, M.C.; Nitz, S.; Fernando, N. HS-SPME Comparative Analysis of Genotypic Diversity in the Volatile Fraction and Aroma-Contributing Compounds of Capsicum Fruits from the annuum−chinense−frutescens Complex. J. Agric. Food Chem. 2010, 58, 4388–4400. [Google Scholar] [CrossRef] [PubMed]
  22. Kim, M.K.; Nam, P.W.; Lee, S.J.; Lee, K.G. Antioxidant activities of volatile and non-volatile fractions of selected traditionally brewed Korean rice wines. J. Ins. Brewing 2014, 120, 537–542. [Google Scholar] [CrossRef]
  23. Worley, B.; Powers, R. PCA as a practical indicator of OPLS-DA model reliability. Curr. Metab. 2016, 4, 97–103. [Google Scholar] [CrossRef] [PubMed]
  24. Chung, I.M.; Kim, J.K.; Han, J.G.; Kong, W.S.; Kim, S.Y.; Yang, Y.J.; Kim, S.H. Potential geo-discriminative tools to trace the origins of the dried slices of shiitake (Lentinula edodes) using stable isotope ratios and OPLS-DA. Food Chem. 2019, 295, 505–513. [Google Scholar] [CrossRef] [PubMed]
  25. Tambellini, N.; Zaremberg, V.; Turner, R.; Weljie, A. Evaluation of Extraction Protocols for Simultaneous Polar and Non-Polar Yeast Metabolite Analysis Using Multivariate Projection Methods. Metabolites 2013, 3, 592–605. [Google Scholar] [CrossRef] [PubMed]
  26. Kind, T.; Fiehn, O. Seven Golden Rules for heuristic filtering of molecular formulas obtained by accurate mass spectrometry. BMC Bioinform. 2007, 8, 105. [Google Scholar] [CrossRef] [PubMed]
  27. Robert, A.; Samwel, P.M.; Limbu, M.; Chacha, J. Mwita Fatty Acid Composition and Levels of Selected Polyunsaturated Fatty Acids in Four Commercial Important Freshwater Fish Species from Lake Victoria, Tanzania. J. Lipids 2014, 2014, 7. [Google Scholar] [CrossRef] [PubMed]
  28. Kirk, J.L.; Beaudette, L.A.; Hart, M.; Moutoglis, P.; Klironomos, J.N.; Lee, H.; Trevors, J.T. Methods of studying soil microbial diversity. J. Microbiol. Methods 2004, 58, 169–188. [Google Scholar] [CrossRef] [PubMed]
  29. Whittaker, P.; Fry, F.S.; Curtis, S.K.; Al-Khaldi, S.F.; Mossoba, M.M.; Yurawecz, M.P.; Dunkel, V.C. Use of Fatty Acid Profiles to Identify Food-Borne Bacterial Pathogens and Aerobic Endospore-Forming Bacilli. J. Agric. Food Chem. 2005, 53, 3735–3742. [Google Scholar] [CrossRef] [PubMed]
  30. Hofstetter, H.H.; Sen, N.; Holman, R.T. Characterization of unsaturated fatty acids by gas-liquid chromatography. J. Amer. Oil Chem. Soc. 1965, 42, 537–540. [Google Scholar] [CrossRef]
  31. Zhang, X.J.; Huang, L.L.; Cai, X.J.; Li, P.; Wang, Y.T.; Wan, J.B. Fatty acid variability in three medicinal herbs of Panaxspecies. Chem. Central J. 2013, 7, 12. [Google Scholar] [CrossRef] [PubMed]
  32. Vibha, J.B.; Choudhary, K.; Singh, M.; Rathore, M.S.; Shekhawat, N.S. A study on pharmacokinetics and therapeutic efficacy of Glycyrrhiza glabra: A miracle medicinal herb. Botany Res. Int. 2009, 2, 157–163. [Google Scholar]
  33. Tanaka, K.; Taniguchi, S.; Tamaoki, D.; Yoshitomi, K.; Akimitsu, K.; Gomi, K. Multiple roles of plant volatiles in jasmonate-induced defense response in rice. Plant Signaling Behavior 2014, 9, e29247. [Google Scholar] [CrossRef] [PubMed]
  34. Ullah, I.; Khan, A.L.; Ali, L.; Khan, A.R.; Waqas, M.; Hussain, J.; Shin, J.H. Benzaldehyde as an insecticidal, antimicrobial, and antioxidant compound produced by Photorhabdus temperata M1021. J. Microbiol. 2015, 53, 127–133. [Google Scholar] [CrossRef] [PubMed]
  35. Kahriman, N.; Tosun, G.; Terzioglu, S.; Karaoglu, S.A.; Yayli, N. Chemical composition and antimicrobial activity of the essential oils from the flower, leaf, and stem of Senecio pandurifolius. Records Nat. Prod. 2011, 5, 82. [Google Scholar]
  36. Shebl, M. Coordination behavior of new bis (tridentate ONO, ONS and ONN) donor hydrazones towards some transition metal ions: Synthesis, spectral, thermal, antimicrobial and antitumor studies. J. Mol. Struc. 2017, 1128, 79–93. [Google Scholar] [CrossRef]
  37. Sharma, K.; Pasricha, V.; Satpathy, G.; Gupta, R.K. Evaluation of phytochemical and antioxidant activity of raw Pyrus communis (l), an underexploited fruit. J. Pharm. Phytochem. 2015, 3. [Google Scholar]
  38. Goicoechea, E.; Van Twillert, K.; Duits, M.; Brandon, E.D.; Kootstra, P.R.; Blokland, M.H.; Guillén, M.D. Use of an in vitro digestion model to study the bioaccessibility of 4-hydroxy-2-nonenal and related aldehydes present in oxidized oils rich in omega-6 acyl groups. J. Agric. Food Chem. 2008, 56, 8475–8483. [Google Scholar] [CrossRef] [PubMed]
  39. Chu, S.S.; Du, S.S.; Liu, Q.Z.; Liu, Q.R.; Liu, Z.L. Composition and insecticidal activity of the essential oil of Artemisia igniaria Maxim. Flowering aerial parts against Sitophilus zeamais Motschulsky (Coleoptera: Curculionidae). J. Med. Plants Res. 2012, 6, 3188–3192. [Google Scholar]
  40. Holt, S.; Miks, M.H.; de Carvalho, B.T.; Foulquié-Moreno, M.R.; Thevelein, J.M. The molecular biology of fruity and floral aromas in beer and other alcoholic beverages. FEMS Microbiol. Rev. 2018, 43, 193–222. [Google Scholar] [CrossRef] [PubMed] [Green Version]
  41. Ko, K.H.; Nam, S. Antioxidant activities of volatile aroma components from Cudrania tricuspidata (carr.) bureau extracts. J. Korean Soc. Food Sci. Nutr. 2012, 41, 1493–1501. [Google Scholar] [CrossRef] [Green Version]
  42. Rohloff, J. Analysis of phenolic and cyclic compounds in plants using derivatization techniques in combination with GC-MS-based metabolite profiling. Molecules 2015, 20, 3431–3462. [Google Scholar] [CrossRef] [PubMed] [Green Version]
  43. Brglez Mojzer, E.; Knez Hrnčič, M.; Škerget, M.; Knez, Ž.; Bren, U. Polyphenols: Extraction methods, antioxidative action, bioavailability and anticarcinogenic effects. Molecules 2016, 21, 901. [Google Scholar] [CrossRef] [PubMed]
  44. Ros, E.; Mataix, J. Fatty acid composition of nuts–implications for cardiovascular health. British J. Nutr. 2006, 96, S29–S35. [Google Scholar] [CrossRef] [PubMed] [Green Version]
  45. Abate, S.; Ahn, Y.G.; Kind, T.; Cataldi, T.R.; Fiehn, O. Determination of elemental compositions by gas chromatography/time-of-flight mass spectrometry using chemical and electron ionization. Rapid Commun. Mass Spectr. 2010, 24, 1172–1180. [Google Scholar] [CrossRef] [PubMed] [Green Version]
Sample Availability: Not available.
Figure 1. (a) Typical total ion chromatogram and (b) relative contents (%) of chemical classes of Xanthii Fructus samples obtained by headspace solid-phase microextraction/gas chromatography- time-of-flight mass spectrometry (HS-SPME/GC-TOF MS).
Molecules 24 04079 g001
Figure 2. An OPLS-DA score plot obtained by HS-SPME/GC-TOF MS data that illustrates group similarities between X. canadense M and X. sibiricum PW. The predicted scores t versus the orthogonal scores t0 are shown.
Molecules 24 04079 g002
Figure 3. (a) Typical total ion chromatogram and (b) relative contents (%) of chemical classes of Xanthii Fructus samples obtained by gas chromatography time-of-flight mass spectrometry (GC-TOF MS).
Molecules 24 04079 g003
Figure 4. OPLS-DA score plot obtained from the polar fraction of the aqueous extract elucidating group similarities between X. canadense M and X. sibiricum PW. The predicted scores t versus the orthogonal scores t0 are shown.
Molecules 24 04079 g004
Figure 5. Typical total ion chromatograms obtained from the lipid phase of Xanthii Fructus samples without esterification (A) (the major peak at tR = 20.37 (a) was identified by consultation with the Wiley7n EI mass spectral library (b)) and after the esterification procedure (B). Numbered peaks were identified as follows: 1. cis-10-pentadecanoic acid (C15:1), 2. cis-10-heptadecenoic acid (C17:1), 3. elaidic acid (C18:1n9t), 4. linolelaidic acid (C18:2n6t), and 5. cis-11,14-eicosadienoic acid (C20:2).
Molecules 24 04079 g005
Figure 6. Integrated sample preparation for the analysis of (A) VOCs, (B) polar metabolites, and (C) fatty acids.
Molecules 24 04079 g006
Table 1. Concentrations of chemical markers identified in Xanthii Fructus and their calibration.
ClassCompoundX. canadense MX. sibiricum PWLinear Range (ng/mg)Calibration Curve
Concentration (ng/mg)RSD (%)Concentration (ng/mg)RSD (%)Equationγ2
VOCs (ng/mg)Benzeneethanol3.8220.110.6510.150.005~25y = 0.0003x − 0.0040.9974
Benzaldehyde0.1020.17n.d. y = 0.0013x + 0.01370.9994
1H-Pyrrole-2-carboxaldehyde2.388.380.698.47y = 0.0003x − 0.01580.9984
3-Octen-2-one0.5713.37n.d. y = 0.0002x − 0.0040.9978
Butyrolactone57.1212.7631.541.20y = 0.000002x − 0.00020.9951
γ-Caprolactone11.059.190.794.76y = 0.00007x − 0.00490.9974
δ-Hexalactone0.371.830.320.21y = 0.0073x − 0.46650.9981
Pantolactone19.1022.312.035.02y = 0.00001x + 0.00090.9969
γ-Octalactone2.157.790.314.93y = 0.0001x − 0.00490.9983
Polar Metabolites (ng/mg)Ethylene glycol102.700.17n.d. 20~2000y = 0.0009x − 4.53730.9953
l-(−)-Arabitol511.182.153684.112.3620~10000y = 0.0001x − 2.0140.9955
d-Mannitol424.325.314404.0713.6420~2000y = 0.00006x − 0.26870.9921
Scyllo-inositol 1080.151.41650.465.4620~4000y = 0.0001x − 1.44940.9947
Succinic acid750.503.09259.242.7320~4000y = 0.00005x − 0.51670.995
d-Glyceric acid267.906.19205.648.2720~2000y = 0.0001x − 0.60620.9939
Fumaric acid185.2110.72n.d. 20~2000y = 0.00003x − 0.13610.995
Malic acid422.729.63n.d. 20~4000y = 0.00008x − 0.8320.994
Azelaic acid353.0613.43n.d. 20~2000y = 0.000008x − 0.03780.9931
Gluconic acid141.7210.74n.d. 20~2000y = 0.00003x + 0.13440.9915
d-Psicofuranose866.105.263748.901.5720~10000y = 0.0001x −2.10830.9948
Table 2. Comparison of relative contents of fatty acids between X. canadense M and X. sibiricum PW.
Fatty Acids X. canadense MX. sibiricum PW
Common NameSymbolGC RT%%RSD%%RSD
Lauric C12:027.350.10.70.12.2
Tridecanoic C13:029.270.36.90.33.9
Palmitic C16:034.060.33.60.25.6
Saturated fatty acids (SFA) 0.7 0.6
Myristoleic C14:131.110.26.10.21.5
Cis-10-pentadecanoic C15:132.8619.40.320.41.0
Palmitoleic C16:134.500.31.10.32.5
Cis-10-heptadecenoic C17:136.075.00.95.90.9
ElaidicC18:1n9t37.098.10.620.30.3
Cis-11-eicosanoic C20:1n940.191.71.20.84.5
NervonicC24:1n945.720.212.81.72.4
Monounsaturated (MUFA) 34.9 49.6
Linolelaidic C18:2n6t38.5861.50.248.60.3
Linoleic C18:2n6c39.040.69.40.38.2
Gamma-linolenic C18:3n3-639.960.115.20.12.3
Linolenic C18:3n3-340.400.328.3--
Cis-11,14-eicosadienoic C20:241.811.22.10.62.9
Cis-11,14,17-eicosatrienoic C20:3n343.220.37.00.120.9
Cis-13,16-docosadienoic C22:244.680.45.80.19.6
Polyunsaturated (PUFA) 64.4 49.8