Evaluating the In Vivo Specificity of [18F]UCB-H for the SV2A Protein, Compared with SV2B and SV2C in Rats Using microPET

 , , , ,
Abstract
:1. Introduction
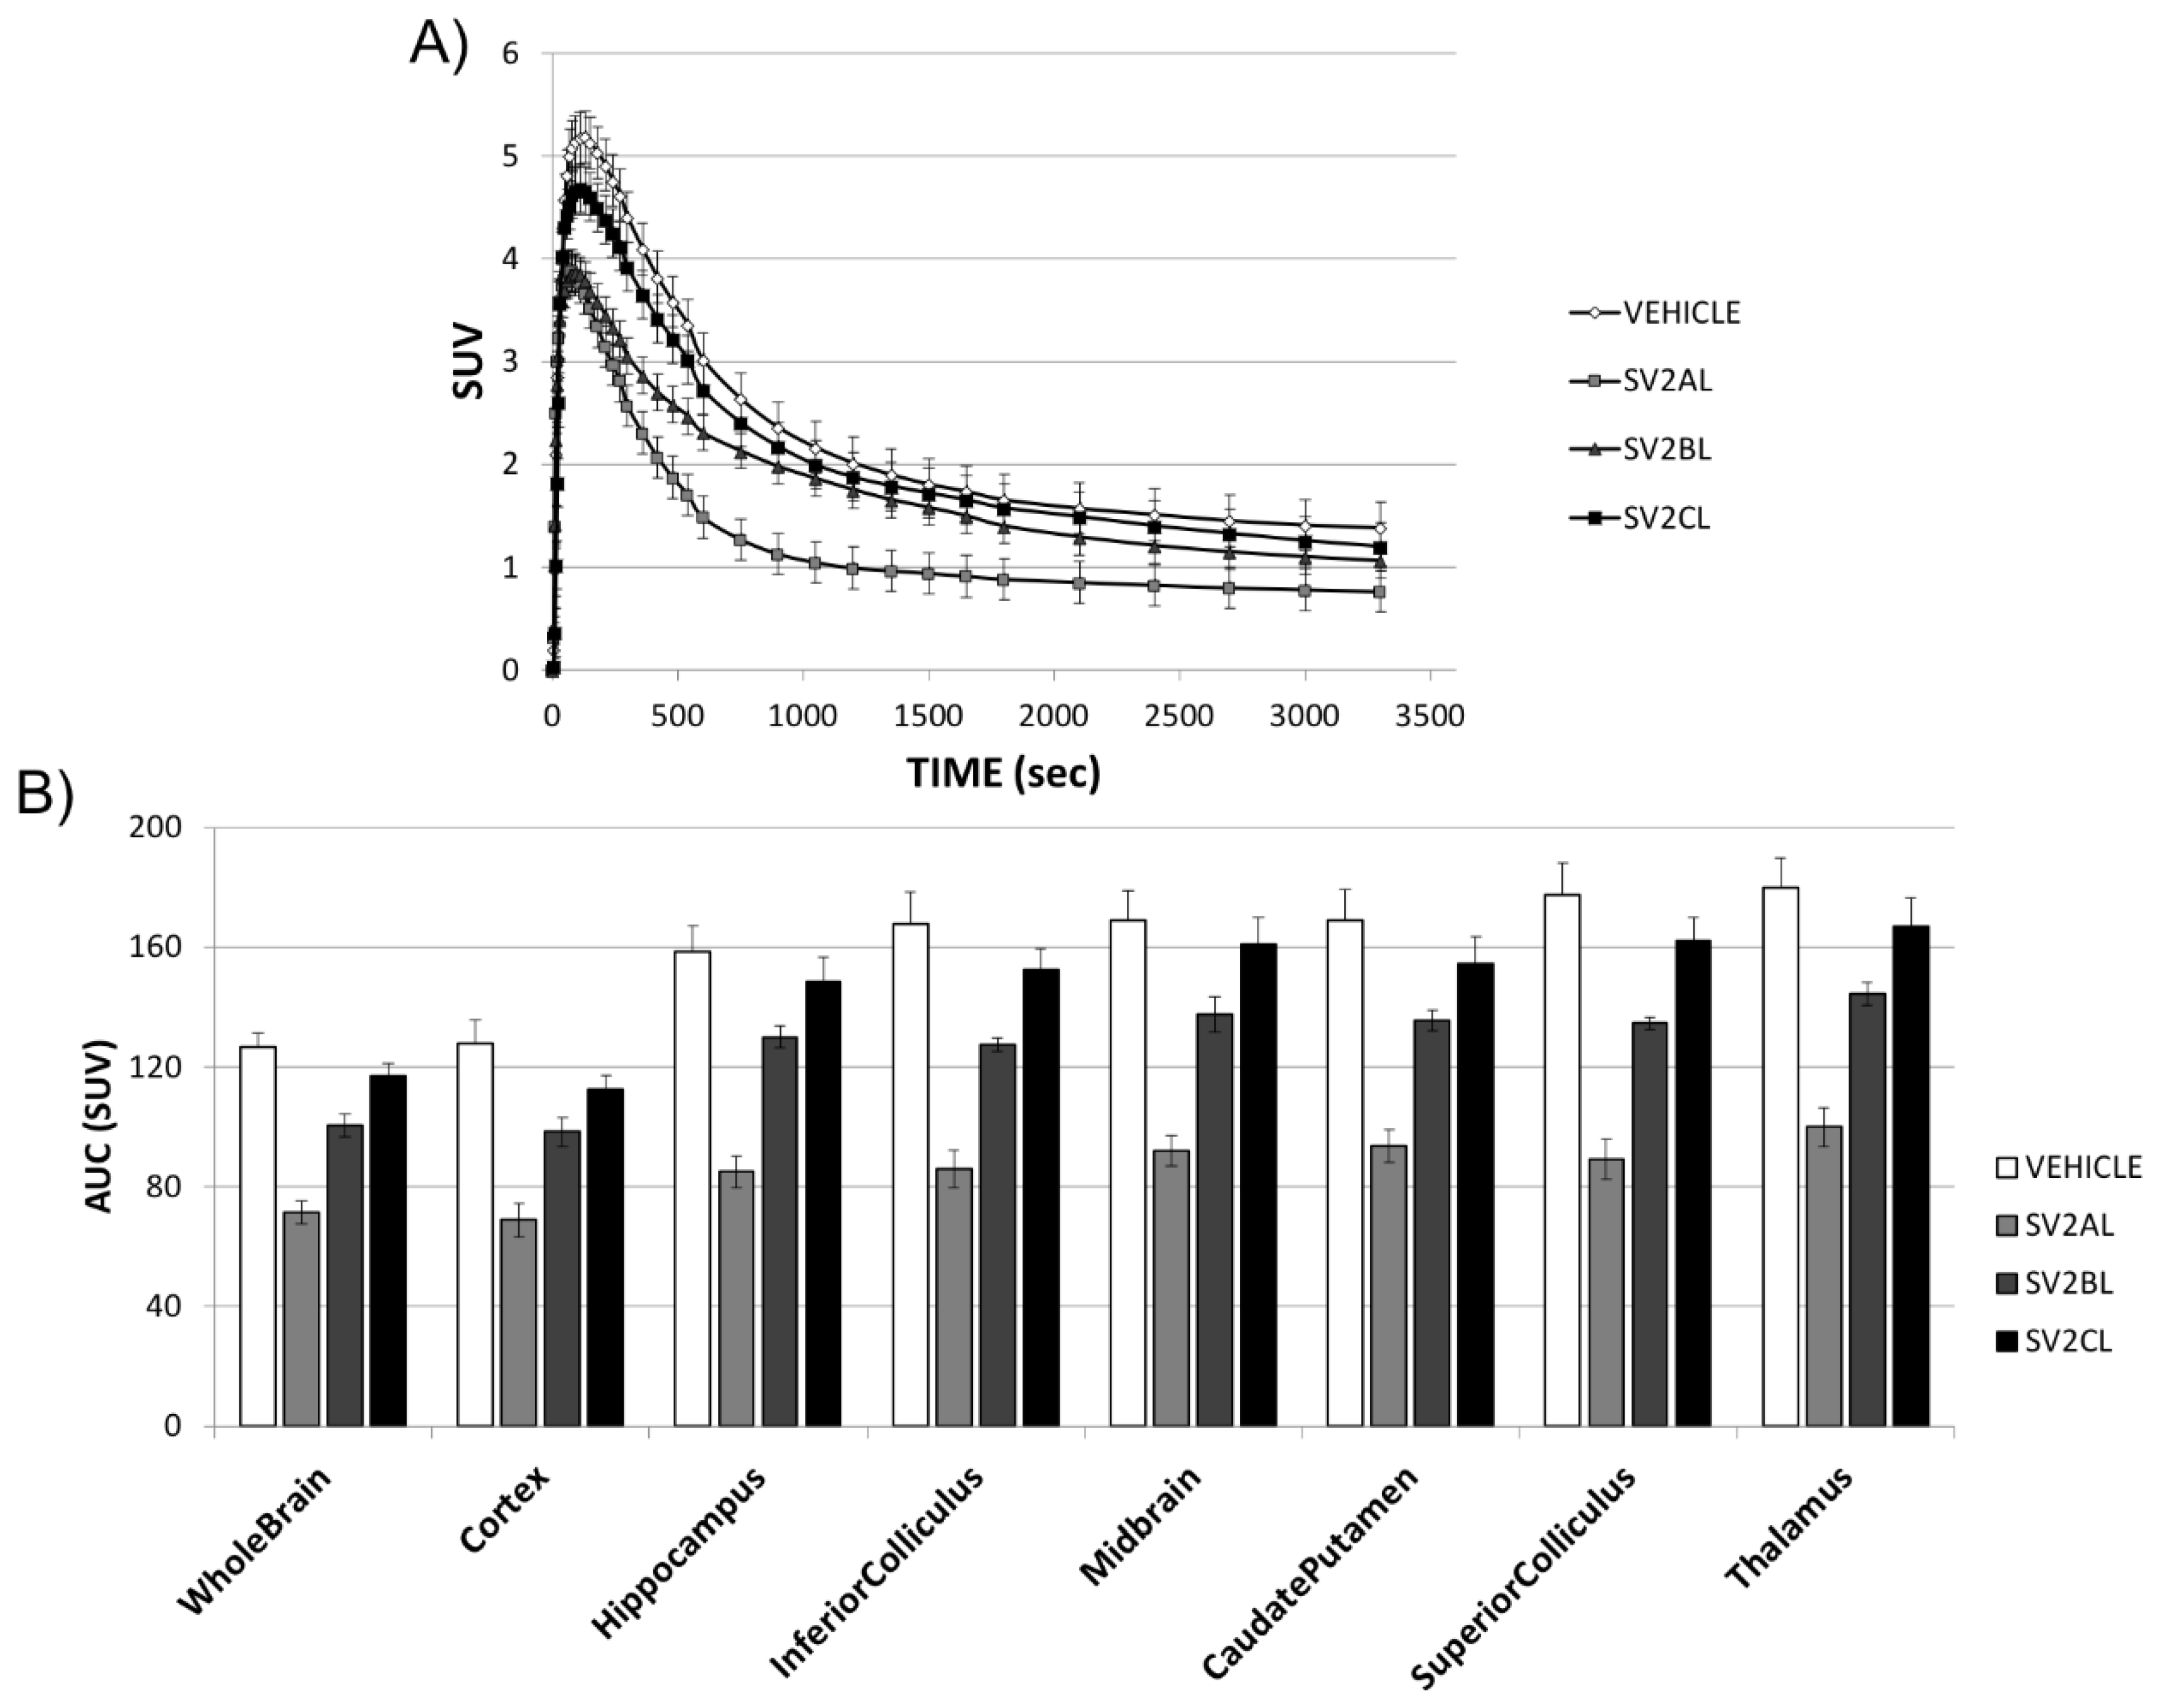
2. Results
3. Discussion
4. Materials and Methods
4.1. Animals
4.2. Radiopharmaceutical Production and Drugs
4.3. In Vitro Binding Assays
4.4. PET Acquisitions
4.5. Imaging Data Processing
4.6. Statistical Analysis
5. Conclusions
Supplementary Materials
Author Contributions
Funding
Conflicts of Interest
References
- Buckley, K.; Kelly, R.B. Identification of a Transmembrane Glycoprotein Specific for Secretory Vesicles of Neural and Endocrine Cells. J. Cell Biol. 1985, 100, 1284–1294. [Google Scholar] [CrossRef] [PubMed]
- Finnema, S.J.; Nabulsi, N.B.; Eid, T.; Detyniecki, K.; Lin, S.-F.; Chen, M.-K.; Dhaher, R.; Matuskey, D.; Baum, E.; Holden, D.; et al. Imaging synaptic density in the living human brain. Sci. Transl. Med. 2016, 8, 348ra96. [Google Scholar] [CrossRef] [PubMed]
- Mercier, J.; Provins, L.; Valade, A. Discovery and development of SV2A PET tracers: Potential for imaging synaptic density and clinical applications. Drug Discov. Today Technol. 2017, 25, 45–52. [Google Scholar] [CrossRef]
- Custer, K.L.; Austin, N.S.; Sullivan, J.M.; Bajjalieh, S.M. Synaptic Vesicle Protein 2 Enhances Release Probability at Quiescent Synapses. J. Neurosci. 2006, 26, 1303–1313. [Google Scholar] [CrossRef] [PubMed]
- Van Vliet, E.A.; Aronica, E.; Redeker, S.; Boer, K.; Gorter, J.A. Decreased expression of synaptic vesicle protein 2A, the binding site for levetiracetam, during epileptogenesis and chronic epilepsy. Epilepsia 2009, 50, 422–433. [Google Scholar] [CrossRef] [PubMed]
- Bartholome, O.; Van den Ackerveken, P.; Sánchez Gil, J.; de la Brassinne Bonardeaux, O.; Leprince, P.; Franzen, R.; Rogister, B. Puzzling Out Synaptic Vesicle 2 Family Members Functions. Front. Mol. Neurosci. 2017, 10, 148. [Google Scholar] [CrossRef]
- Crèvecœur, J.; Foerch, P.; Doupagne, M.; Thielen, C.; Vandenplas, C.; Moonen, G.; Deprez, M.; Rogister, B. Expression of SV2 isoforms during rodent brain development. BMC Neurosci. 2013, 14, 87. [Google Scholar] [CrossRef] [PubMed]
- Bajjalieh, S.M.; Frantz, G.D.; Weimann, J.M.; McConnell, S.K.; Scheller, R.H. Differential expression of synaptic vesicle protein 2 (SV2) isoforms. J. Neurosci. 1994, 14, 5223–5235. [Google Scholar] [CrossRef]
- Janz, R.; Südhof, T.C. SV2C is a synaptic vesicle protein with an unusually restricted localization: anatomy of a synaptic vesicle protein family. Neuroscience 1999, 94, 1279–1290. [Google Scholar] [CrossRef]
- Bajjalieh, S.M.; Peterson, K.; Linial, M.; Scheller, R.H. Brain contains two forms of synaptic vesicle protein 2. Proc. Natl. Acad. Sci. USA 1993, 90, 2150–2154. [Google Scholar] [CrossRef]
- Stahl, S.M. Psychopharmacology of anticonvulsants: levetiracetam as a synaptic vesicle protein modulator. J. Clin. Psychiatry 2004, 65, 1162–1163. [Google Scholar] [CrossRef] [PubMed]
- Matagne, A.; Margineanu, D.-G.; Kenda, B.; Michel, P.; Klitgaard, H. Anti-convulsive and anti-epileptic properties of brivaracetam (ucb 34714), a high-affinity ligand for the synaptic vesicle protein, SV2A. Br. J. Pharmacol. 2008, 154, 1662–1671. [Google Scholar] [CrossRef] [PubMed]
- Kaminski, R.M.; Gillard, M.; Leclercq, K.; Hanon, E.; Lorent, G.; Dassesse, D.; Matagne, A.; Klitgaard, H. Proepileptic phenotype of SV2A-deficient mice is associated with reduced anticonvulsant efficacy of levetiracetam. Epilepsia 2009, 50, 1729–1740. [Google Scholar] [CrossRef] [PubMed]
- Lynch, B.A.; Lambeng, N.; Nocka, K.; Kensel-Hammes, P.; Bajjalieh, S.M.; Matagne, A.; Fuks, B. The synaptic vesicle protein SV2A is the binding site for the antiepileptic drug levetiracetam. Proc. Natl. Acad. Sci. USA 2004, 101, 9861–9866. [Google Scholar] [CrossRef] [PubMed]
- Bretin, F.; Bahri, M.A.; Bernard, C.; Warnock, G.; Aerts, J.; Mestdagh, N.; Buchanan, T.; Otoul, C.; Koestler, F.; Mievis, F.; et al. Biodistribution and Radiation Dosimetry for the Novel SV2A Radiotracer [18F]UCB-H: First-in-Human Study. Mol. Imaging Biol. 2015, 17, 557–564. [Google Scholar] [CrossRef] [PubMed]
- Bretin, F.; Warnock, G.; Bahri, M.A.; Aerts, J.; Mestdagh, N.; Buchanan, T.; Valade, A.; Mievis, F.; Giacomelli, F.; Lemaire, C.; et al. Preclinical radiation dosimetry for the novel SV2A radiotracer [18F]UCB-H. EJNMMI Res. 2013, 3, 35. [Google Scholar] [CrossRef]
- Warnier, C.; Lemaire, C.; Becker, G.; Zaragoza, G.; Giacomelli, F.; Aerts, J.; Otabashi, M.; Bahri, M.A.; Mercier, J.; Plenevaux, A.; et al. Enabling Efficient Positron Emission Tomography (PET) Imaging of Synaptic Vesicle Glycoprotein 2A (SV2A) with a Robust and One-Step Radiosynthesis of a Highly Potent 18F-Labeled Ligand ([18F]UCB-H). J. Med. Chem. 2016, 59, 8955–8966. [Google Scholar] [CrossRef] [PubMed]
- Nabulsi, N.B.; Mercier, J.; Holden, D.; Carre, S.; Najafzadeh, S.; Vandergeten, M.-C.; Lin, S.-F.; Deo, A.; Price, N.; Wood, M.; et al. Synthesis and Preclinical Evaluation of 11C-UCB-J as a PET Tracer for Imaging the Synaptic Vesicle Glycoprotein 2A in the Brain. J. Nucl. Med. 2016, 57, 777–784. [Google Scholar] [CrossRef] [PubMed]
- Cai, H.; Mangner, T.J.; Muzik, O.; Wang, M.-W.; Chugani, D.C.; Chugani, H.T. Radiosynthesis of 11C-levetiracetam: A potential marker for PET imaging of SV2A expression. ACS Med. Chem. Lett. 2014, 5, 1152–1155. [Google Scholar] [CrossRef]
- Estrada, S.; Lubberink, M.; Thibblin, A.; Sprycha, M.; Buchanan, T.; Mestdagh, N.; Kenda, B.; Mercier, J.; Provins, L.; Gillard, M.; et al. [11C]UCB-A, a novel PET tracer for synaptic vesicle protein 2 A. Nucl. Med. Biol. 2016, 43, 325–332. [Google Scholar] [CrossRef] [PubMed]
- Heurling, K.; Ashton, N.J.; Leuzy, A.; Zimmer, E.R.; Blennow, K.; Zetterberg, H.; Eriksson, J.; Lubberink, M.; Schöll, M. Synaptic vesicle protein 2A as a potential biomarker in synaptopathies. Mol. Cell. Neurosci. 2019. [Google Scholar] [CrossRef] [PubMed]
- Rabiner, E.A. Imaging Synaptic Density: A Different Look at Neurologic Diseases. J. Nucl. Med. 2018, 59, 380–381. [Google Scholar] [CrossRef] [PubMed]
- Cai, Z.; Li, S.; Matuskey, D.; Nabulsi, N.; Huang, Y. PET imaging of synaptic density: A new tool for investigation of neuropsychiatric diseases. Neurosci. Lett. 2019, 691, 44–50. [Google Scholar] [CrossRef] [PubMed]
- Li, S.; Cai, Z.; Wu, X.; Holden, D.; Pracitto, R.; Kapinos, M.; Gao, H.; Labaree, D.; Nabulsi, N.; Carson, R.E.; et al. Synthesis and in Vivo Evaluation of a Novel PET Radiotracer for Imaging of Synaptic Vesicle Glycoprotein 2A (SV2A) in Nonhuman Primates. ACS Chem. Neurosci. 2019, 10, 1544–1554. [Google Scholar] [CrossRef] [PubMed]
- Bahri, M.A.; Plenevaux, A.; Aerts, J.; Bastin, C.; Becker, G.; Mercier, J.; Valade, A.; Buchanan, T.; Mestdagh, N.; Ledoux, D.; et al. Measuring brain synaptic vesicle protein 2A with positron emission tomography and [18F]UCB-H. Alzheimer’s Dement. 2017, 3, 481–486. [Google Scholar]
- Serrano, M.E.; Bahri, M.A.; Becker, G.; Seret, A.; Mievis, F.; Giacomelli, F.; Lemaire, C.; Salmon, E.; Luxen, A.; Plenevaux, A. Quantification of [18F]UCB-H Binding in the Rat Brain: From Kinetic Modelling to Standardised Uptake Value. Mol. Imaging Biol. 2018. [Google Scholar] [CrossRef] [PubMed]
- Hanaya, R.; Hosoyama, H.; Sugata, S.; Tokudome, M.; Hirano, H.; Tokimura, H.; Kurisu, K.; Serikawa, T.; Sasa, M.; Arita, K. Low distribution of synaptic vesicle protein 2A and synaptotagimin-1 in the cerebral cortex and hippocampus of spontaneously epileptic rats exhibiting both tonic convulsion and absence seizure. Neuroscience 2012, 221, 12–20. [Google Scholar] [CrossRef] [PubMed]
- Clegg, N.; Ferguson, C.; True, L.D.; Arnold, H.; Moorman, A.; Quinn, J.E.; Vessella, R.L.; Nelson, P.S. Molecular characterization of prostatic small-cell neuroendocrine carcinoma. Prostate 2003, 55, 55–64. [Google Scholar] [CrossRef] [PubMed]
- Dardou, D.; Monlezun, S.; Foerch, P.; Courade, J.P.; Cuvelier, L.; de Ryck, M.; Schiffmann, S.N. A role for Sv2c in basal ganglia functions. Brain Res. 2013, 1507, 61–73. [Google Scholar] [CrossRef]
- Altmann, V.; Schumacher-Schuh, A.F.; Rieck, M.; Callegari-Jacques, S.M.; Rieder, C.R.; Hutz, M.H. Influence of genetic, biological and pharmacological factors on levodopa dose in Parkinson’s disease. Pharmacogenomics 2016, 17, 481–488. [Google Scholar] [CrossRef] [PubMed]
- Dunn, A.R.; Stout, K.A.; Ozawa, M.; Lohr, K.M.; Hoffman, C.A.; Bernstein, A.I.; Li, Y.; Wang, M.; Sgobio, C.; Sastry, N.; et al. Synaptic vesicle glycoprotein 2C (SV2C) modulates dopamine release and is disrupted in Parkinson disease. Proc. Natl. Acad. Sci. USA 2017, 114, E2253–E2262. [Google Scholar] [CrossRef] [PubMed]
- Karp, J.S.; Daube-Witherspoon, M.E.; Muehllehner, G. Factors affecting accuracy and precision in PET volume imaging. J. Cereb. Blood Flow Metab. 1991, 11, A38–A44. [Google Scholar] [CrossRef] [PubMed]
- Aston, J.A.D.; Cunningham, V.J.; Asselin, M.-C.; Hammers, A.; Evans, A.C.; Gunn, R.N. Positron emission tomography partial volume correction: estimation and algorithms. J. Cereb. Blood Flow Metab. 2002, 22, 1019–1034. [Google Scholar] [CrossRef] [PubMed]
- Dardou, D.; Dassesse, D.; Cuvelier, L.; Deprez, T.; De Ryck, M.; Schiffmann, S.N. Distribution of SV2C mRNA and protein expression in the mouse brain with a particular emphasis on the basal ganglia system. Brain Res. 2011, 1367, 130–145. [Google Scholar] [CrossRef] [PubMed]
- Becker, G.; Warnier, C.; Serrano, M.E.; Bahri, M.A.; Mercier, J.; Lemaire, C.; Salmon, E.; Luxen, A.; Plenevaux, A. Pharmacokinetic Characterization of [18F]UCB-H PET Radiopharmaceutical in the Rat Brain. Mol. Pharm. 2017, 14, 2719–2725. [Google Scholar] [CrossRef]
- Warnock, G.I.; Aerts, J.; Bahri, M.A.; Bretin, F.; Lemaire, C.; Giacomelli, F.; Mievis, F.; Mestdagh, N.; Buchanan, T.; Valade, A.; et al. Evaluation of 18F-UCB-H as a novel PET tracer for synaptic vesicle protein 2A in the brain. J. Nucl. Med. 2014, 55, 1336–1341. [Google Scholar] [CrossRef] [PubMed]
- Kilkenny, C.; Browne, W.; Cuthill, I.; Emerson, M.; Altman, D. Improving bioscience research reporting: The ARRIVE guidelines for reporting animal research. J. Pharmacol. Pharmacother. 2010, 1, 94. [Google Scholar] [CrossRef] [PubMed]
Sample Availability: Not available. |


| Synaptic Vesicle Protein Isoforms | |||
|---|---|---|---|
| SV2A | SV2B | SV2C | |
| SV2AL | 5.2 | −3.1 | −3.2 |
| SV2BL | 5.6 | 7.8 | 5.5 |
| SV2CL | <5 | 5.9 | 7.8 |
| ROIs | Vehicle vs. SV2AL | Vehicle vs. SV2BL | Vehicle vs. SV2CL |
|---|---|---|---|
| Whole brain | 42.3 | 19.9 | 5.6 |
| Cortex | 42.7 | 21.1 | 9.1 |
| Hippocampus | 46.8 | 16.9 | 2.1 |
| Inferior colliculus | 49.1 | 23.7 | 8.5 |
| Midbrain | 46.3 | 19.1 | 5.1 |
| Caudate/Putamen | 46.2 | 20.2 | 6.2 |
| Superior colliculus | 50.4 | 23.4 | 7.6 |
| Thalamus | 45.9 | 19.7 | 4.4 |
| Mean | 46.2 | 20.5 | 6.1 |
| SEM | 1.0 | 0.8 | 0.8 |
| In Vitro Binding Details | hSV2A Assay | hSV2B | hSV2C |
|---|---|---|---|
| Binding buffer | 50 mM Tris-HCl (pH 7.4) containing 2 mM MgCl2 | ||
| Filtration buffer | Ice-cold 50 mM Tris-HCl (pH 7.4) | ||
| Incubation time | 120 min at 37 °C in 0.5 mL | 120 min at 37 °C in 0.5 mL | 120 min at 37 °C in 0.2 mL |
| Radioligand | 3H-UCB30889 (4 nM) | 3H-UCB1418435 (8 nM) | 3H-UCB101275-1 (20 nM) |
| Proteins | 75–125 µg HEK293 membranes | 2–5 µg HEK293 membranes | 40–60 µg HEK293 membranes |
| Blocking drug | Levetiracetam (1 mM) | UCB108649-2 (10 µM) | UCB101275-1 (100 µM) |
© 2019 by the authors. Licensee MDPI, Basel, Switzerland. This article is an open access article distributed under the terms and conditions of the Creative Commons Attribution (CC BY) license (http://creativecommons.org/licenses/by/4.0/).
Share and Cite
Serrano, M.E.; Becker, G.; Bahri, M.A.; Seret, A.; Mestdagh, N.; Mercier, J.; Mievis, F.; Giacomelli, F.; Lemaire, C.; Salmon, E.; et al. Evaluating the In Vivo Specificity of [18F]UCB-H for the SV2A Protein, Compared with SV2B and SV2C in Rats Using microPET. Molecules 2019, 24, 1705. https://doi.org/10.3390/molecules24091705
Serrano ME, Becker G, Bahri MA, Seret A, Mestdagh N, Mercier J, Mievis F, Giacomelli F, Lemaire C, Salmon E, et al. Evaluating the In Vivo Specificity of [18F]UCB-H for the SV2A Protein, Compared with SV2B and SV2C in Rats Using microPET. Molecules. 2019; 24(9):1705. https://doi.org/10.3390/molecules24091705
Chicago/Turabian StyleSerrano, Maria Elisa, Guillaume Becker, Mohamed Ali Bahri, Alain Seret, Nathalie Mestdagh, Joël Mercier, Frédéric Mievis, Fabrice Giacomelli, Christian Lemaire, Eric Salmon, and et al. 2019. "Evaluating the In Vivo Specificity of [18F]UCB-H for the SV2A Protein, Compared with SV2B and SV2C in Rats Using microPET" Molecules 24, no. 9: 1705. https://doi.org/10.3390/molecules24091705
APA StyleSerrano, M. E., Becker, G., Bahri, M. A., Seret, A., Mestdagh, N., Mercier, J., Mievis, F., Giacomelli, F., Lemaire, C., Salmon, E., Luxen, A., & Plenevaux, A. (2019). Evaluating the In Vivo Specificity of [18F]UCB-H for the SV2A Protein, Compared with SV2B and SV2C in Rats Using microPET. Molecules, 24(9), 1705. https://doi.org/10.3390/molecules24091705