Article

Biogenesis of Prism-Like Silver Oxide Nanoparticles Using Nappa Cabbage Extract and Their p-Nitrophenol Sensing Activity

Department of Chemical and Biochemical Engineering, Dongguk University—Seoul, Seoul 04620, Korea
*
Author to whom correspondence should be addressed.
Molecules 2020, 25(10), 2298; https://doi.org/10.3390/molecules25102298
Submission received: 13 April 2020 / Revised: 7 May 2020 / Accepted: 11 May 2020 / Published: 13 May 2020

Abstract

:
The present study aimed to explore the eco-friendly synthesis of prism-like silver oxide nanoparticles (Ag2ONPs) from nappa cabbage extract and its p-nitrophenol sensing activity. The prepared Ag2ONPs were characterized by X-ray diffraction (XRD), field-emission scanning spectroscopy (FESEM), energy-dispersive spectroscopy (EDS), transmission electron microscopy (TEM), and ultraviolet (UV)–visible light spectral analysis (UV–Vis). p-Nitrophenol sensing properties of the prepared nanoparticles were also determined using a simple I–V method. The results showed that the as-prepared Ag2ONPs have a face-centered cubic (fcc) crystalline nature and a prism-like morphology with particle size in the range 21.61–92.26 nm. The result also showed a high intensity of the (111) facet, making the Ag2ONP–carbon black/nickel foam electrode (Ag2ONP–C/NFE) exhibit a high-performance response to p-nitrophenol spanning a wide range of concentrations from 1.0 mM to 0.1 pM and a response time of around 5 s, indicating a high potential for water treatment applications.

Graphical Abstract

1. Introduction

Over the past couple of decades, industrialization resulted in increasing quantities of organic pollutants in waterbodies, imposing detrimental effects to the ecosystem [1,2]. Among these is the environmental pollution caused by the untreated discharge of dyes from manufacturing industries which can impede the photosynthesis of aquatic organisms [3,4,5]. Globally, water pollution is one among the most crucial issues owing to the discharge of toxic effluents posing greater threats to human health [6]. Nitrophenols are extensively used in several petrochemical syntheses, including plastics, dyes, rubber, pulp, paints, and pesticides [7,8]. In particular, p-nitrophenol (p-NP, 4-nitrophenol, PNP) can cause an intensive effect on methemoglobin formation, triggering skin and eye irritation, anemia, liver and kidney damage, and systematic poisoning [9]. Furthermore, it was found that, in the bodies of water, p-NP concentration and exposure time are directly proportional to the mortality rate of fishes [10]. Because of its harmful impacts on the growth and metabolism of plants, animals, and human beings, it is listed by the United States (US) Environmental Protection Agency (EPA) as one of the priority pollutants [11,12]. For years, several methods of minimizing nitrophenol pollution in water were developed, including adsorption [13], photo-degradation [14], chemical oxidation [15], etc. However, for a successful elimination method of pollutants, all these methods must always be accompanied by a detection and measurement method. Previous reports on the detection of p-NP focused on gas chromatography–mass spectroscopy [16], high-performance liquid chromatography [17], ultraviolet–visible light (UV–Vis) spectrophotometry [18], liquid chromatography [19], fluorescence detection [20], and capillary electrophoresis [21]. Because of the long duration of analysis, the complexity of sample preparation, and the high cost of the machines, the quick and cost-efficient quantification of p-NP is an obstacle to manufacturing plants. Therefore, it is necessary to develop an accurate, selective, fast, easy, cost-effective, and portable analytical measurement of the concentration of p-NP without causing extra pollution. With this, an electrochemical sensing method of p-NP pollutant gained huge attention in the detection of p-NP because of the advantages of fast response, simple operation, inexpensive instrument, low analysis cost, and time saving, along with real-time detection in situ conditions [22,23]. The determining factor for the success of these electrochemical sensors is the sensing electrode used. The development of novel electrode materials for the modification of electrodes is the most important factor to enhance their electrochemical performance, which is found to be significantly dependent on the microstructures of the electrode materials. Thus, a variety of functional materials, particularly metal materials and carbon materials, were designed and synthesized for constructing a novel electrode system [24].
A chemical sensor is a sensor that produces an electric signal directly proportional to the concentration of chemical analytes. Metal oxide nanostructures have unique properties, such as good electrical conductivity, magnetic properties, optical properties, and outstanding catalytic activity. Recently, transition metal oxide-doped semiconductor materials received significant interest in developing their physico-chemical behaviors and extending their efficient chemical sensor applications [25,26,27]. In particular, the silver–oxygen system (Ag–O) gained extensive attraction by researchers due to its novel applications in gas sensors, high-density optical storage devices, photovoltaic cells, antibacterial coatings, photo diodes, and chemical sensors [28,29]. This system exists in different defined compounds, namely, Ag2O, AgO, Ag3O4, Ag4O3, Ag2O3, and Ag4O4. However, the most thermodynamically stable among these compounds is Ag2O which possesses a simple cubic structure at room temperature [30]. The performance of Ag2O-based sensors highly depends on the specific surface area of the particle which can be tuned by controlling its microstructure in terms of morphology and porosity at the nanolevel. Furthermore, Ag2O is already utilized for its bacterio-static properties [31], giving the material wide potential applications such as wastewater treatment, potable water monitoring, and medical devices. With this, scientists reported several methods to synthesize silver oxide nanoparticles including a sonochemical method [32], galvanosynthesis [33], green synthesis [34], etc. Due to our aim of creating an effective p-nitrophenol sensor without causing extra pollution in the fabrication process, we chose green synthesis. Using plant extract to reduce metal salts gives the advantage of producing stabilized nanoparticles without using any stabilizing agent [35].
In this paper, we propose a facile biological synthesis of prism-like silver oxide nanoparticles (Ag2ONPs) used as sensing material for electrode modification for the detection of p-nitrophenol. The as-prepared Ag2ONPs were synthesized by reducing AgNO3 precursor with nappa cabbage extract. Nappa cabbage, Brassica rapa L. subsp. pekinensis, is a commonly used vegetable in Korea [36]. Studies reported that nappa cabbage is rich in natural phenolic compounds such as phenols, phenolic acid, hydroxycinnamic acid derivatives, and flavonoids [37]. In connection to this, the ability of plant extracts to act as reducing and capping agents in the plant-mediated synthesis of metals and metal oxides is due to the presence of these complex compounds possessed by plants [38,39,40]. Most of the previous reports incorporate a boiling step to get an extract from the specific plant used [41]. Moreover, it was found that phytochemicals found in plants and vegetables are susceptible to destruction upon boiling [42]. Since the key factors in the biological reduction process are these natural compounds, protecting these compounds from destruction is very important. Thus, we opted for a boiling step during extraction. With this, we decided to choose a plant that has high liquid content to easily get an extract without boiling in the extraction process. One of the plants that has high enough liquid content and is a highly used vegetable in Korea and other countries is the nappa cabbage, which is also one of the dominating sources of waste in traditional markets [43]. To the best of our knowledge the biosynthesis of silver oxide using nappa cabbage extract was never previously reported.

2. Results

2.1. X-ray Diffraction (XRD) Analysis of Nappa Cabbage-Mediated Biosynthesis of Prism-Like Silver Oxide Nanoparticles (Ag2ONPs)

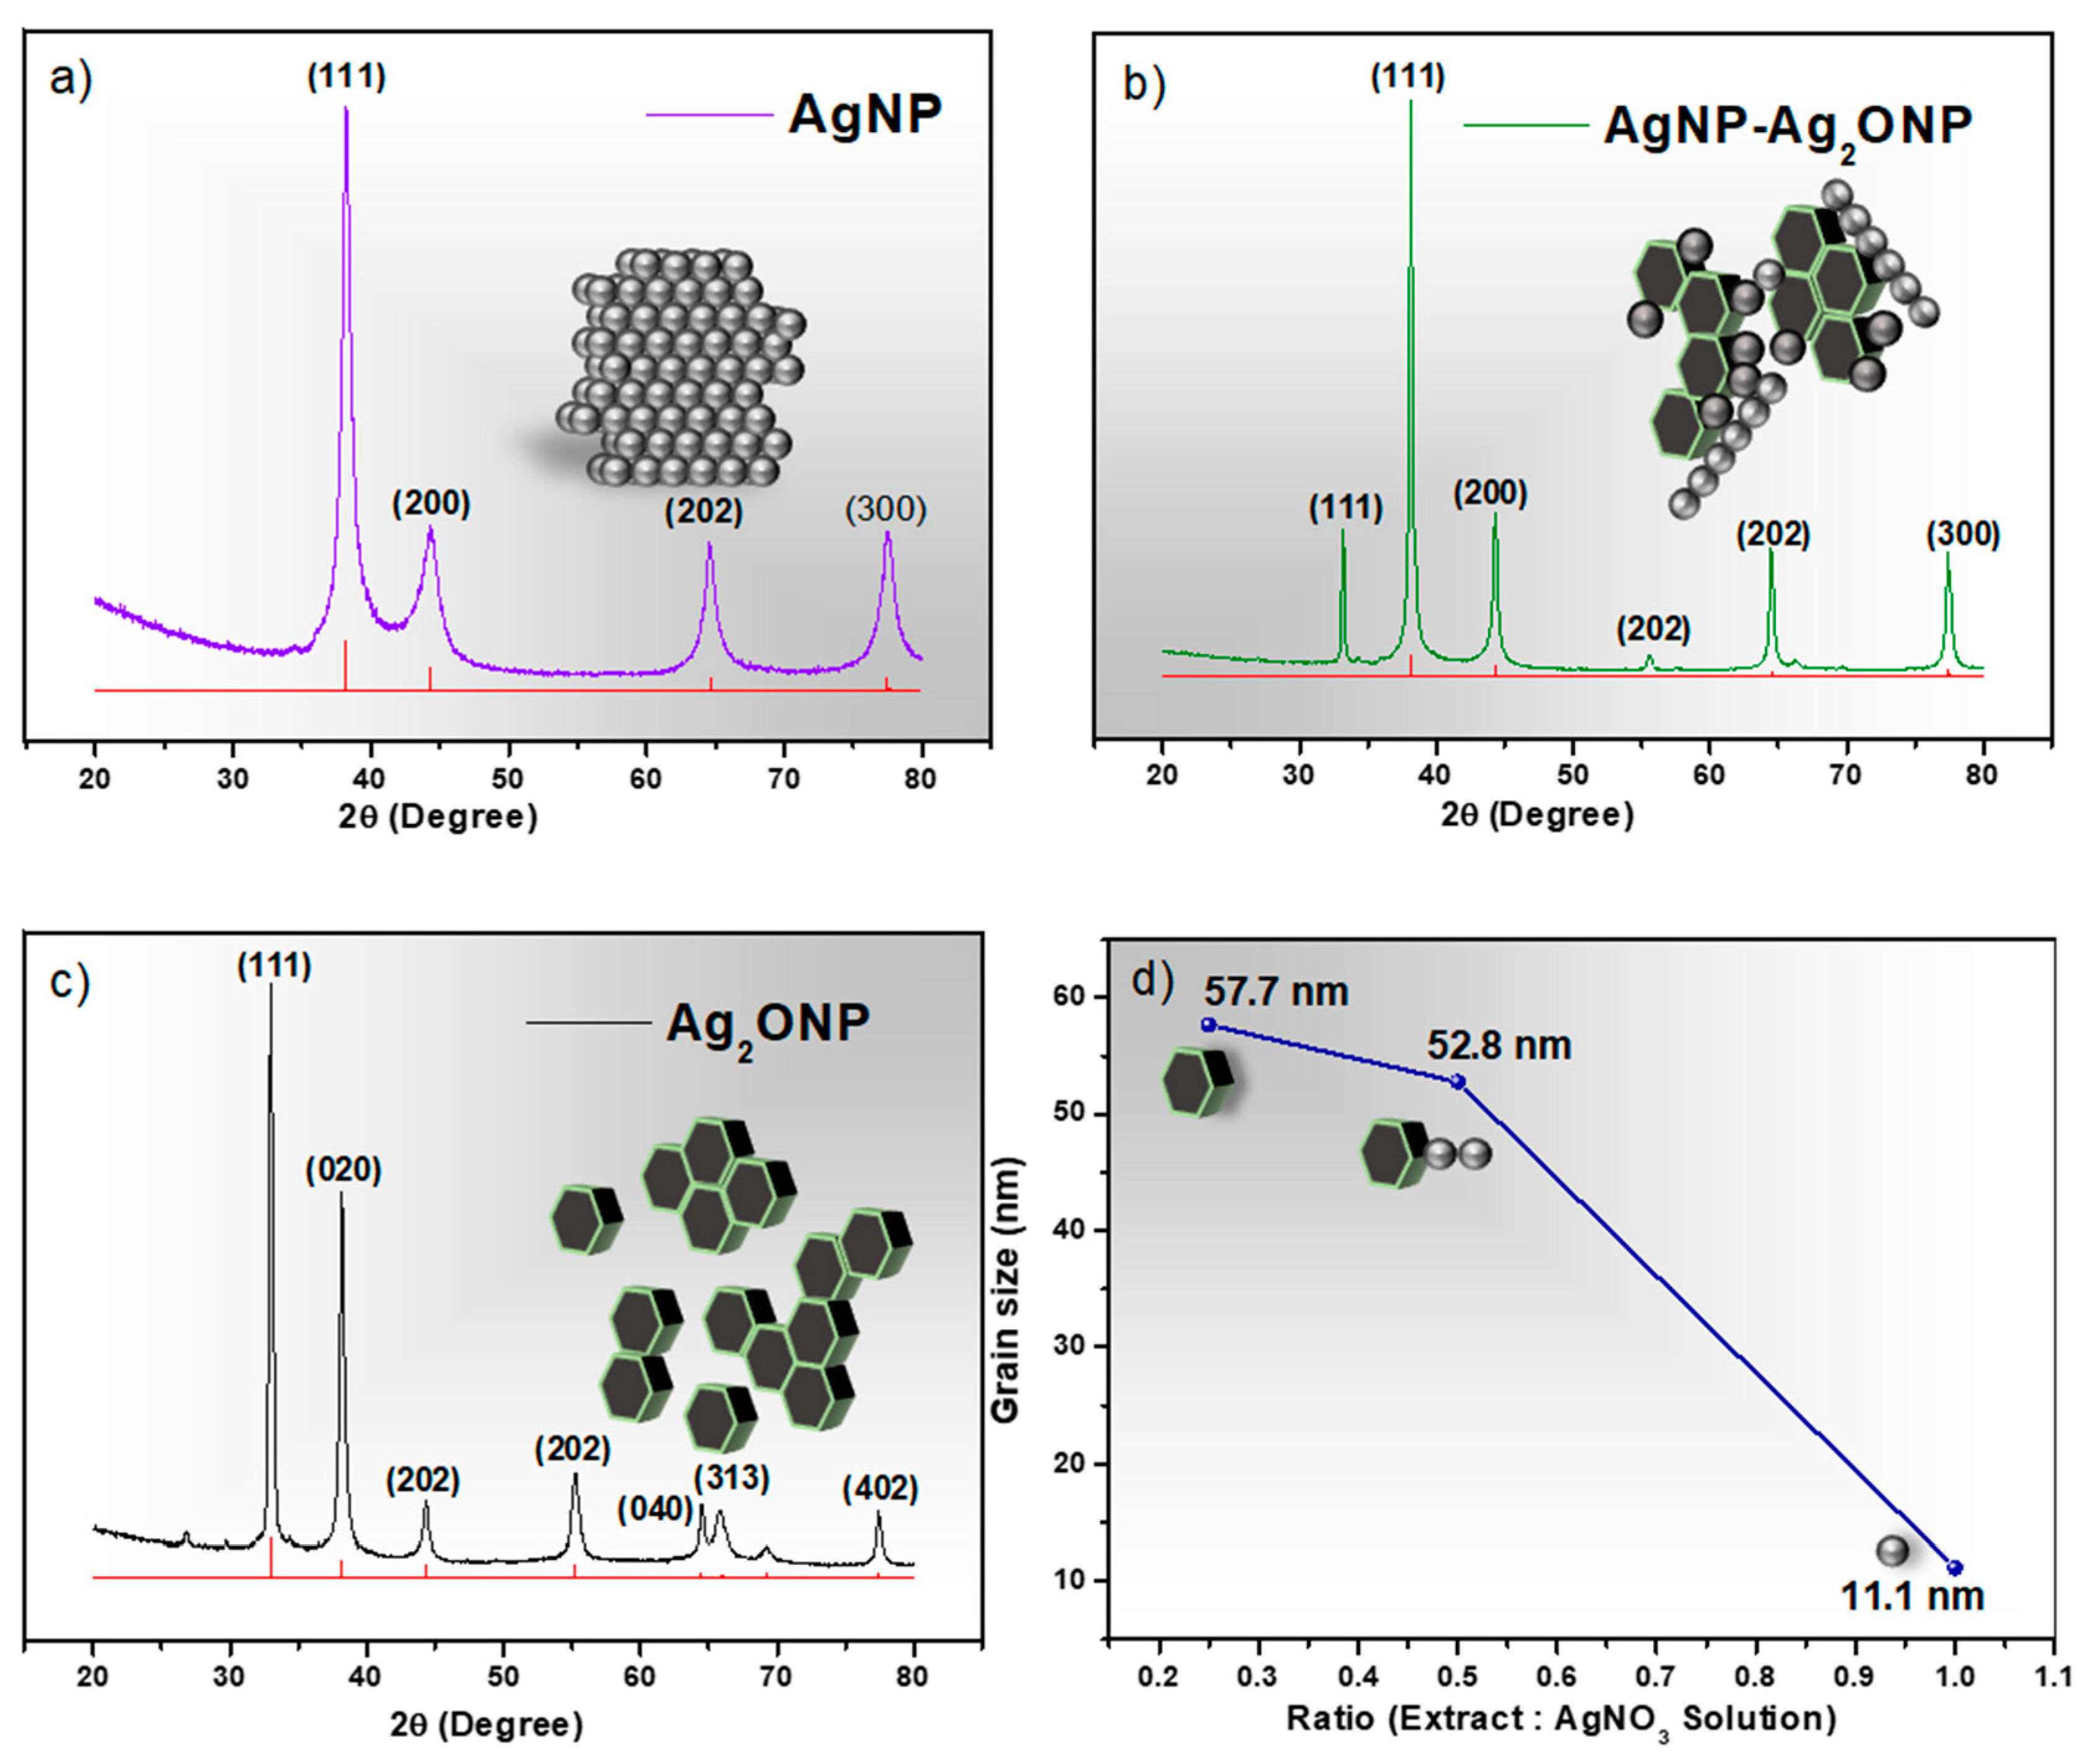
To synthesize the stable prism-like silver oxide nanoparticles, a facile biological synthesis method was employed. The as-prepared Ag2ONP was found to exhibit a high sensitivity to the detection of low concentration of p-NP. Furthermore, the resulting nanoparticle showed a dependency on the amount of extract used. In order to comprehend the significance of extract concentration in the biological reduction process, different amounts of extract were used (40 mL, 20 mL, and 10 mL) with a fixed amount of AgNO3 solution. The XRD patterns of the synthesized nanoparticles at varying extract concentration shown in Figure 1 confirm the effect of the amount of extract in the biological synthesis of Ag2ONPs.
Figure 1a shows the XRD pattern of the sample having an extract-to-AgNO3-solution ratio of 1:1. It shows four peaks at 2θ = 38.18°, 43.34°, 64.48°, and 77.46° corresponding to the (111), (200), (202), and (300) planes of Ag XRD pattern with JCPDS no. 96-110-0137, having no extra peak detected, which confirmed the formation of pure Ag nanoparticles using the ratio mentioned. This suggests that, using a 1:1 volume ratio, all the silver atoms in the solution were completely biologically reduced to their elemental form by the extract. When the volume of extract was halved giving a ratio of 1:2 extract to AgNO3 solution, the diffraction peaks of the resulting nanoparticles were observed again, as shown in Figure 1b. The XRD pattern detected two unknown peaks with respect to the same Ag XRD pattern basis (JCPDS no. 96-110-0137). The 1:2 ratio shows the same four peaks corresponding to (111), (200), (202), and (300) planes which were assigned to the lattice representative of Ag. However, two new prominent peaks were detected at 2θ = 33.17° and 55.54° corresponding to (111) and (202), which belong to Ag2O (JCPDS no. 96-101-0487). This suggests that reducing the amount of extract in the reactional mixture allows the formation of silver oxide which is the material of interest in this research. Finally, further reduction of the extract volume to 10 mL giving a ratio of 1:4 extract to AgNO3 solution gave the XRD pattern shown in Figure 1c. The 1:4 ratio had seven prominent peaks at 2θ = 33.18°, 38.16°, 44.32°, 55.54°, 64.44°, 66.26°, and 77.40° conforming to (111), (020), (202), (202), (040), (313), and (402) planes of Ag2O. Furthermore, there was a peak at 2θ = 26.88° corresponding to the (101) plane. The presence of this peak could be incorporated into the plant extract which contains organic compounds, and it is responsible for the reduction of silver ions and stabilization of resultant nanoparticles [18]. The XRD results show that the transition of the resulting nanoparticles from Ag to Ag2O is caused by the amount of extract used in the mixture.

2.2. Field-Emission Scanning Spectroscopy (FESEM) and Energy-Dispersive Spectroscopy (EDS) Analyses of Nappa Cabbage-Mediated Biosynthesis of Prism-Like Silver Oxide Nanoparticles (Ag2ONPs)

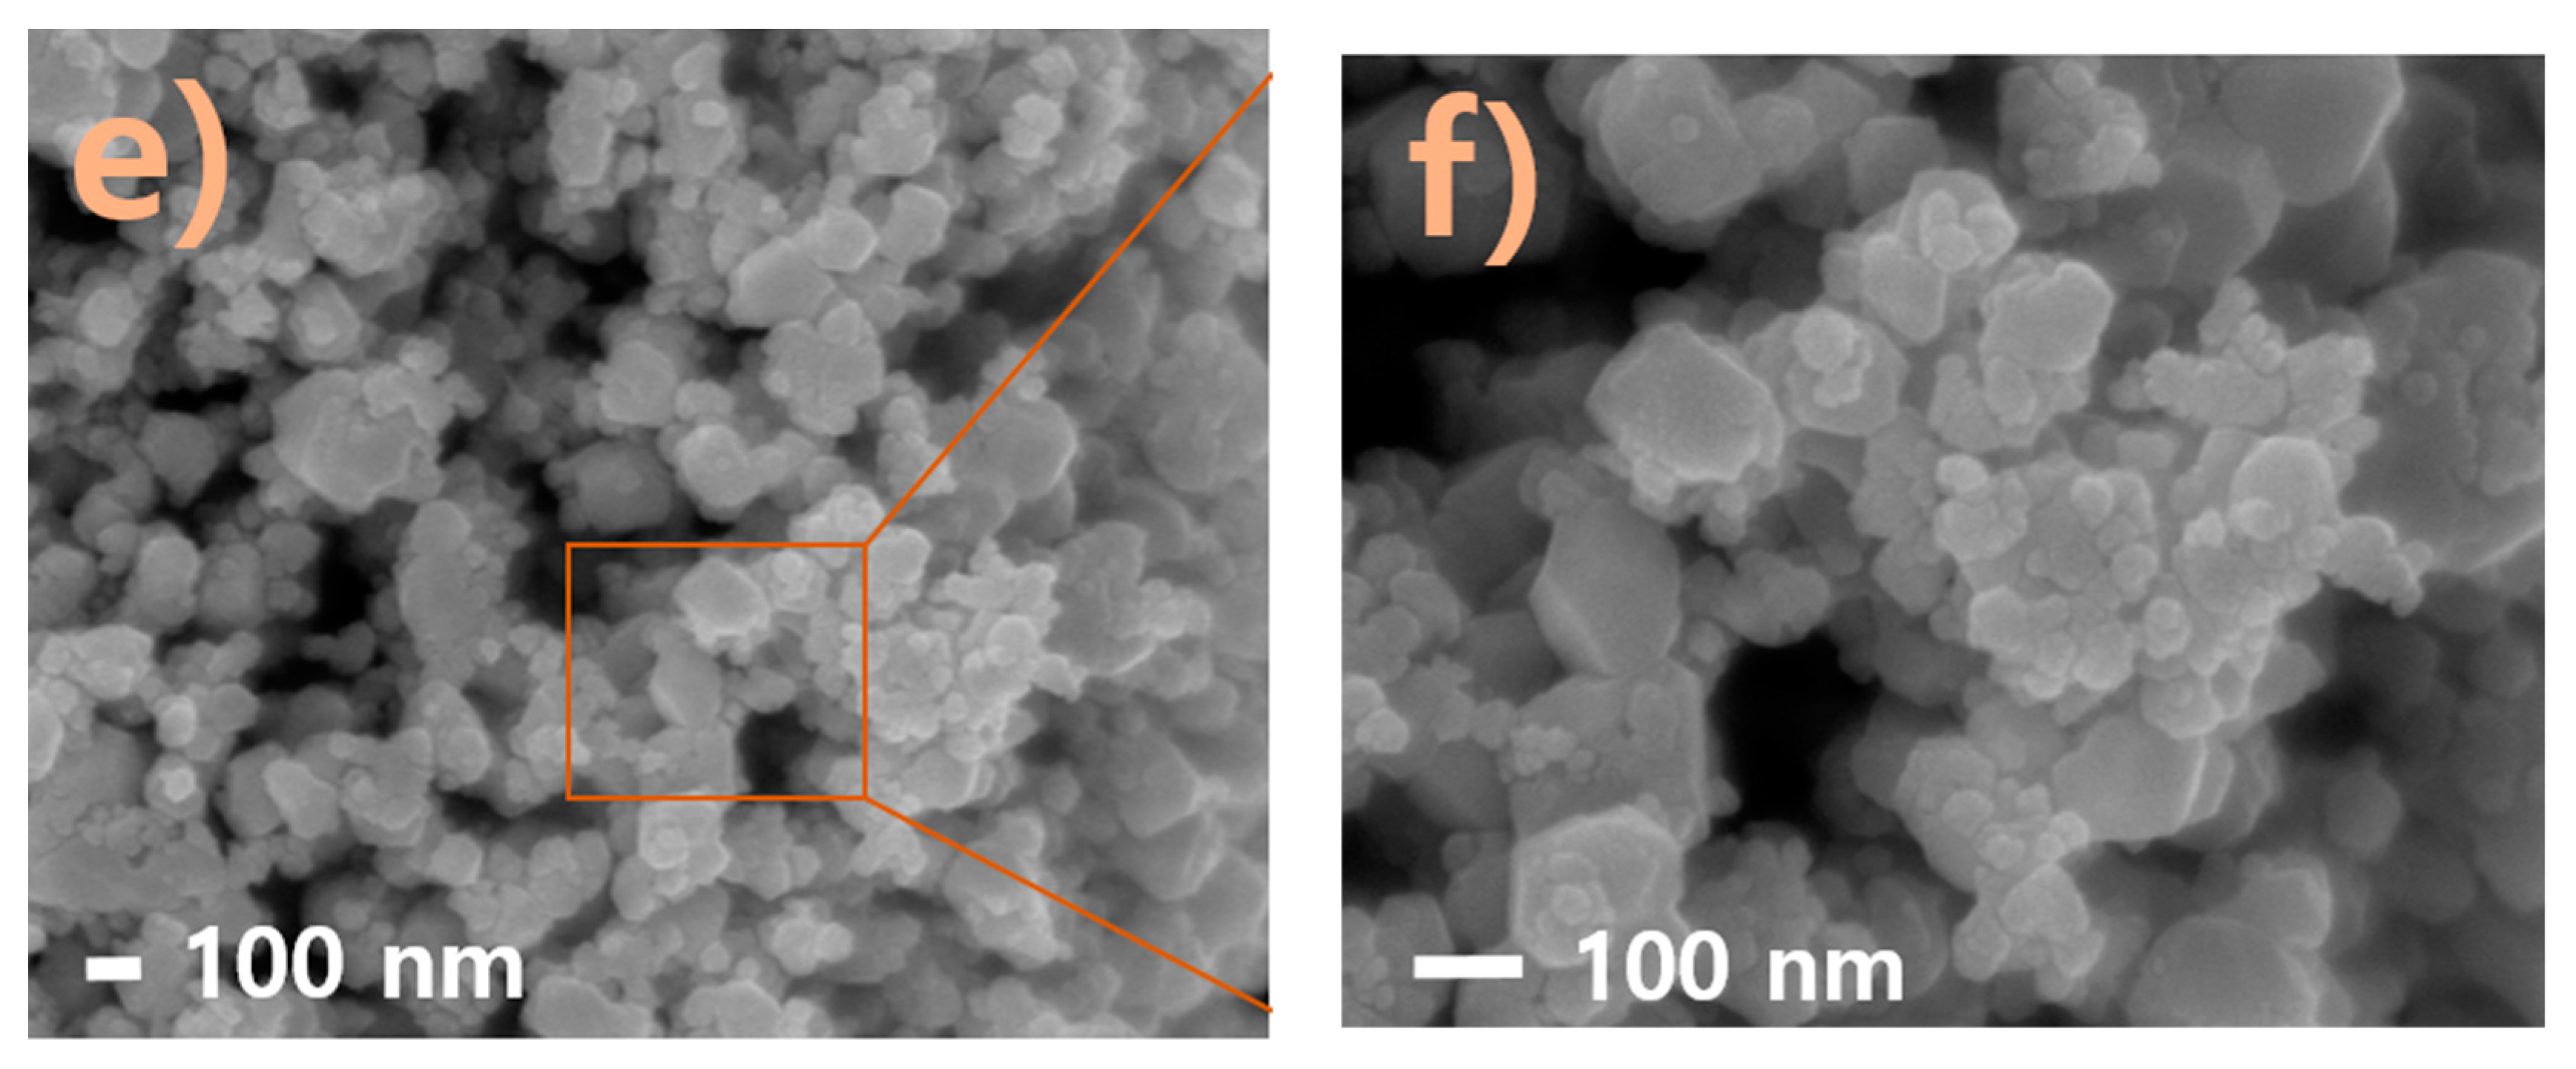
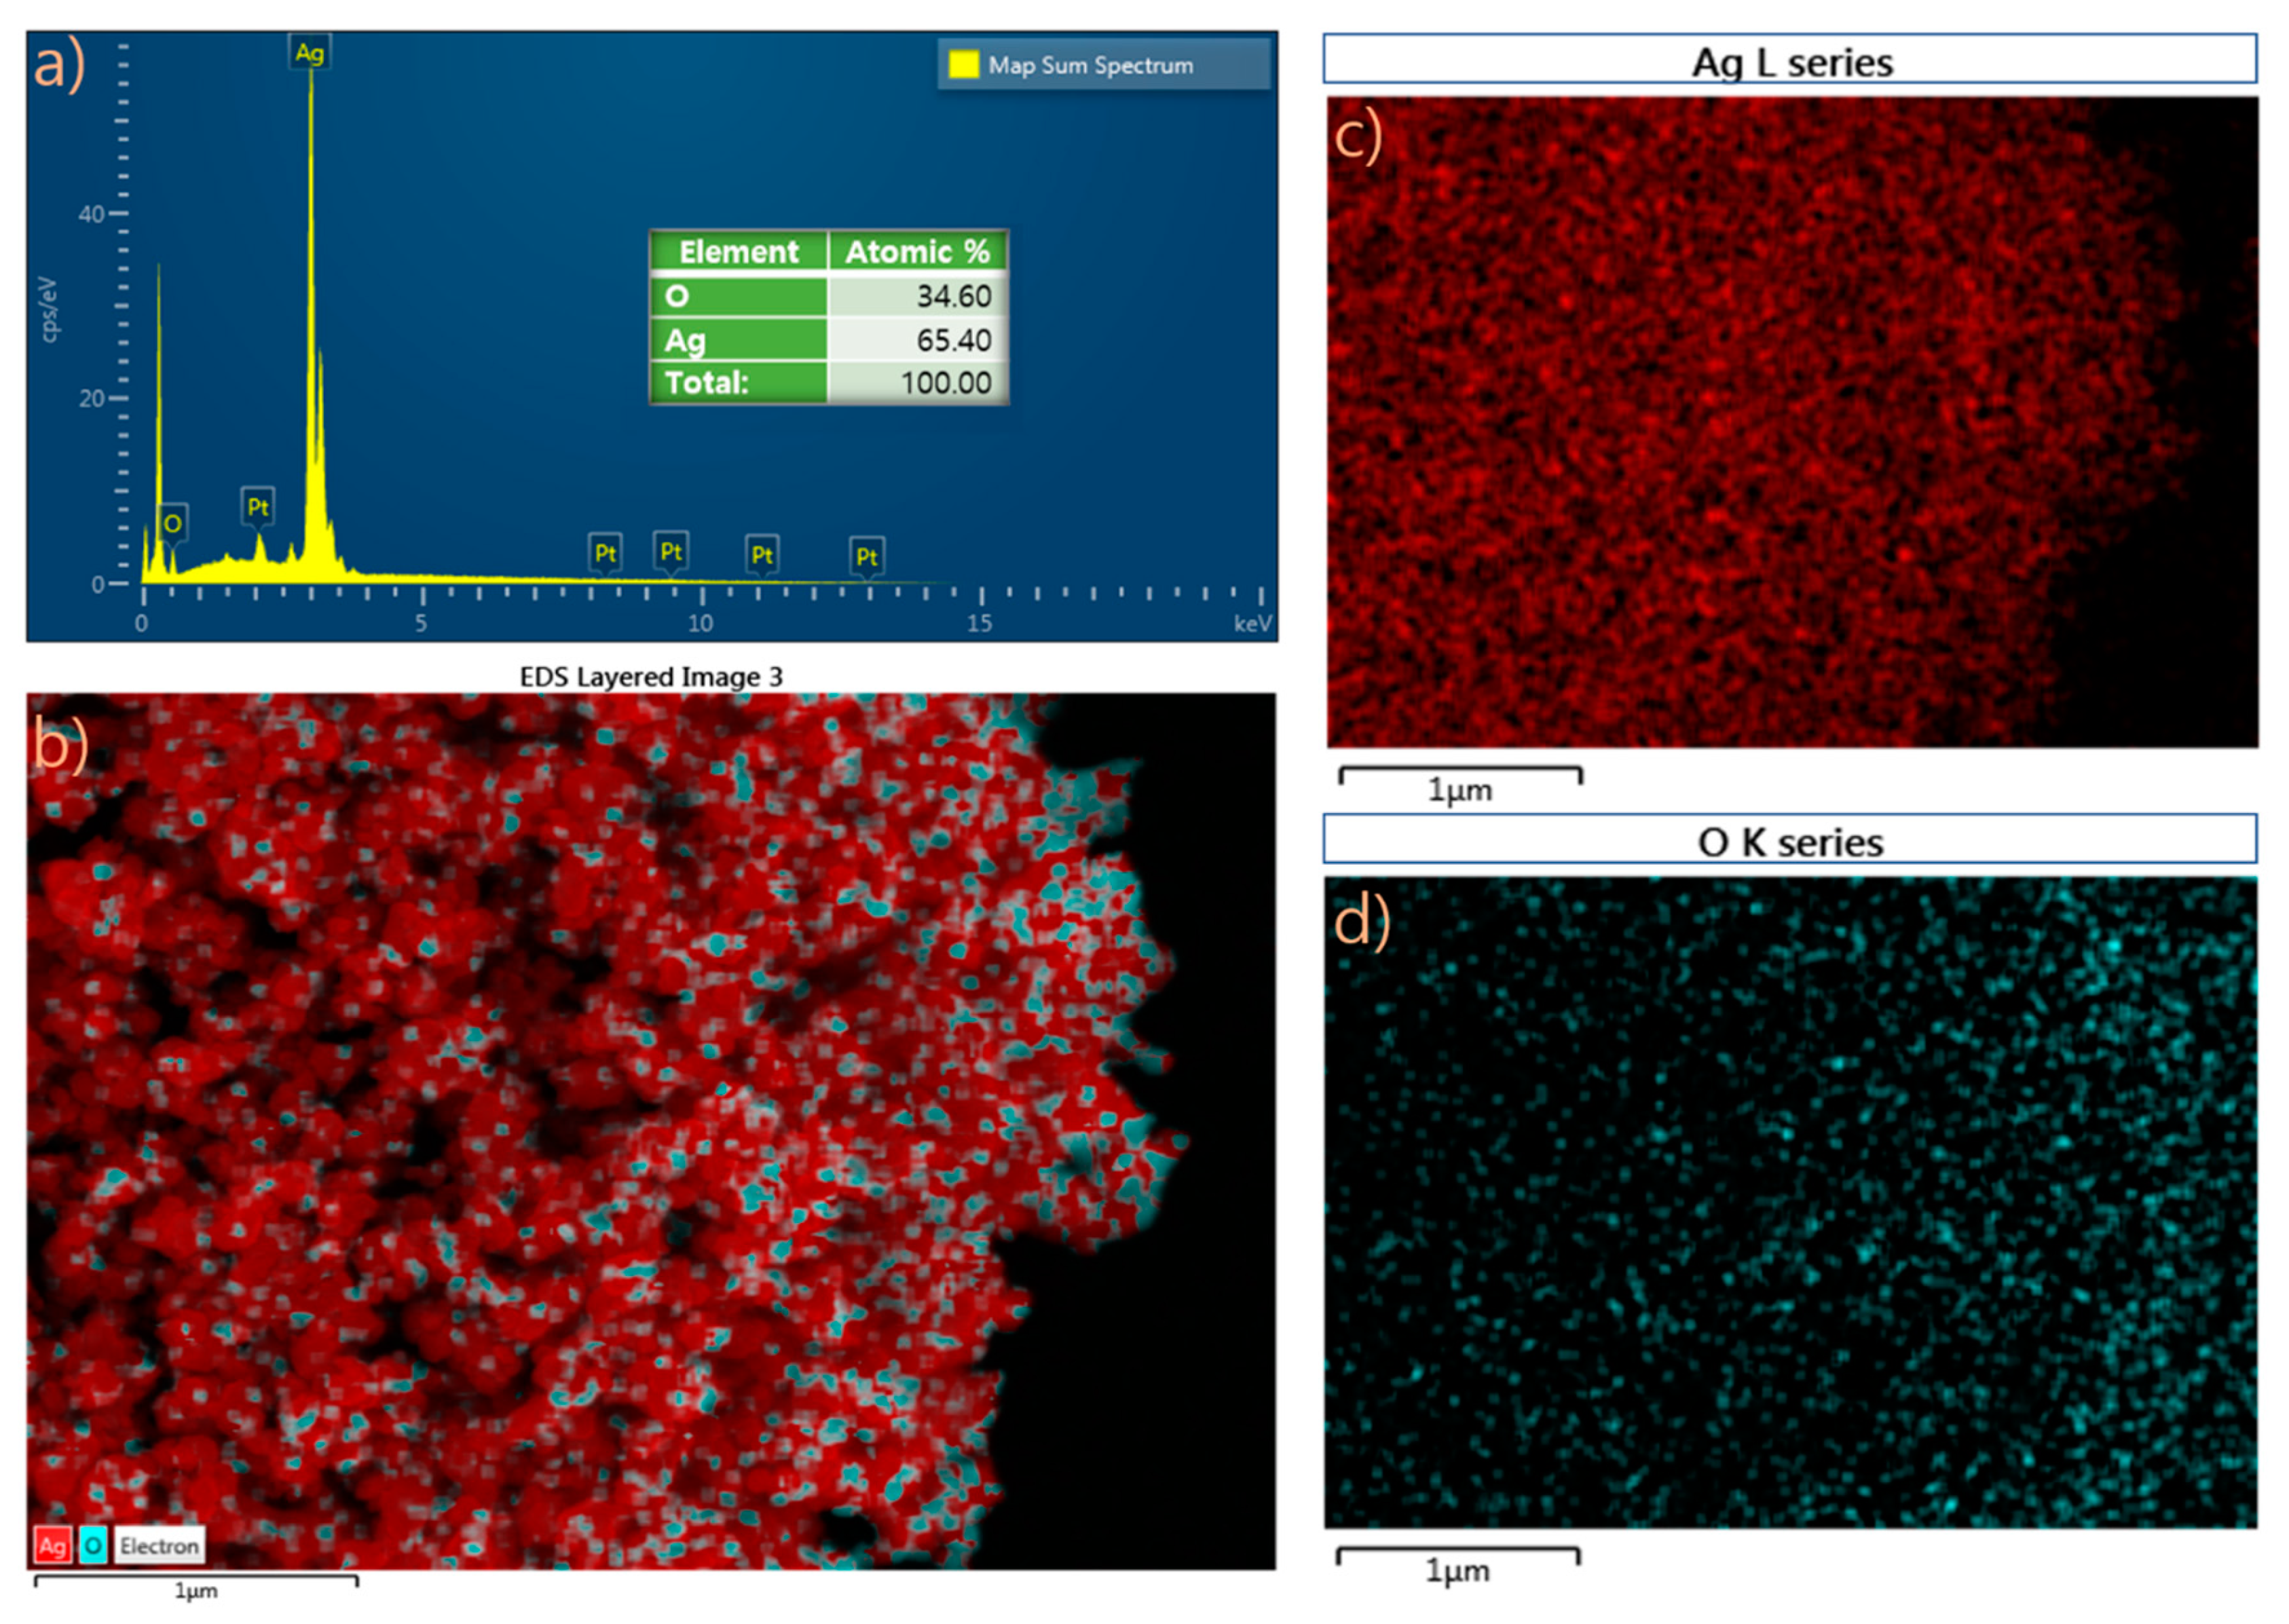
FESEM (Figure 2a) clearly shows the presence of synthesized silver nanoparticles. The nanoparticles were oval and spherical in shape. Most of the nanoparticles were aggregated, and a few individual particles were also observed. In addition, the 1:2 ratio (Figure 2b) showed the presence of a few particles with prism-like nanoparticles. Finally, shown in Figure 2c is the FESEM image of the prism-like silver oxide nanoparticles with an average grain size of 57 nm and particle size ranging from 21.61–92.26 nm. Additionally, to comprehend the atomic composition of the prepared nanoparticles, the EDS elemental mapping of the 1:4 ratio was investigated as shown in Figure 3.

2.3. Transmission Electron Microscopy (TEM) Analysis of Nappa Cabbage-Mediated Biosynthesis of Prism-Like Silver Oxide Nanoparticles (Ag2ONPs)

The shape and size of Ag2ONPs were elucidated using TEM (Figure 4). Aliquots of Ag2ONPs dispersed in ethanol were placed on a carbon-coated copper grid and allowed to dry under ambient conditions, and TEM images were recorded. The TEM micrographs suggest that the sizes of the particles were around 50–60 nm. The particles were aggregated and display a prism-like shape. Additionally, Ag2ONP has lattice fringes with a spacing of 0.209 nm, as shown in Figure 4e, which is in agreement with the previous literature [44].

2.4. UV–Visible Light Spectral Analysis (UV–Vis) of Nappa Cabbage-Mediated Biosynthesis of Prism-Like Silver Oxide Nanoparticles (Ag2ONPs)

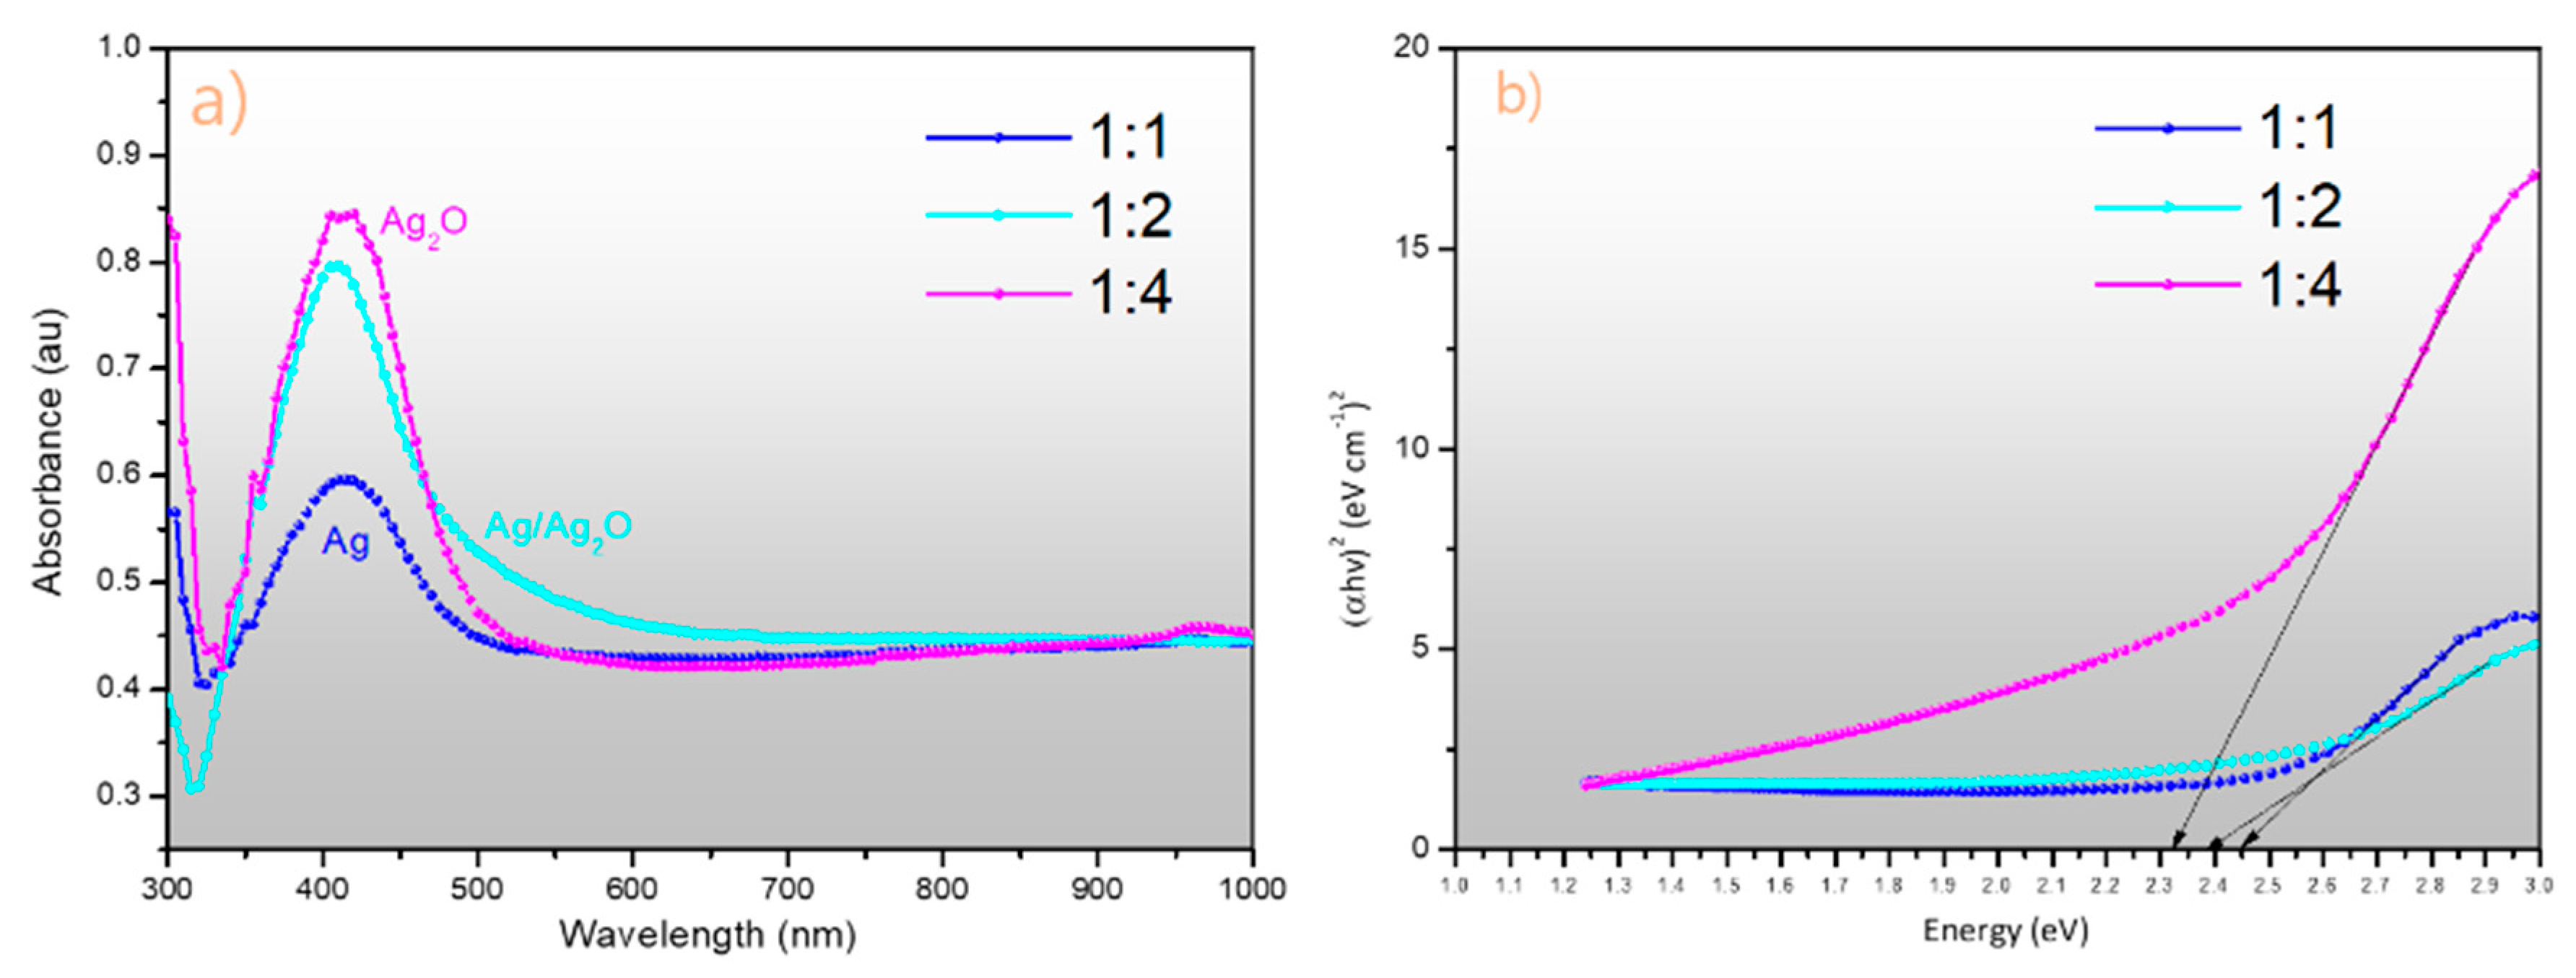
The UV–Vis analysis of the synthesized AgNPs and Ag2ONPs at different extract concentrations is shown in Figure 5a, indicating that the AgNPs synthesized at an extract-to-AgNO3-solution ratio of 1:1 show an absorbance band at 420 nm, whereas, for the AgNP–Ag2ONPs synthesized at ratio of 1:2, the bands were developed at 418 nm. In contrast, the UV–vis band observed in the Ag2ONPs synthesized using the extract-to-AgNO3-solution ratio of 1:4 was observed at 408 nm. Additionally, the Tauc plot shown in Figure 5b was investigated to see the energy band gaps of the 1:1, 1:2, and 1:4 samples, and they were found to be between 2.45 eV, 2.38 eV, and 2.33 eV respectively.

2.5. p-Nitrophenol Sensing Measurement

To test the p-nitrophenol sensing capability of the as-prepared Ag2ONPs, a nickel foam electrode was modified by incorporating Ag2ONPs and carbon black (Ag2ONP–C/NFE) where p-NP was detected and measured as a target analyte in the simple I–V method. The Ag2ONP–C/NFE fabricated electrodes have several advantages such as simplicity to construct, large surface area, good conductivity, chemical stability, bio-safe characteristics, non-toxicity, and electrochemical activity. In the case of p-NP sensors, the current response of Ag2ONP–C/NFE significantly changes when aqueous p-NP is adsorbed. A simple I–V method and response time experiments were performed to see the electrochemical characteristics and sensitivity of Ag2ONP–C/NFE toward p-NP. The I–V response was investigated for the bare and modified C/NFE, as shown in Figure 6a, tested at a fixed scan rate of 160 mV/s.
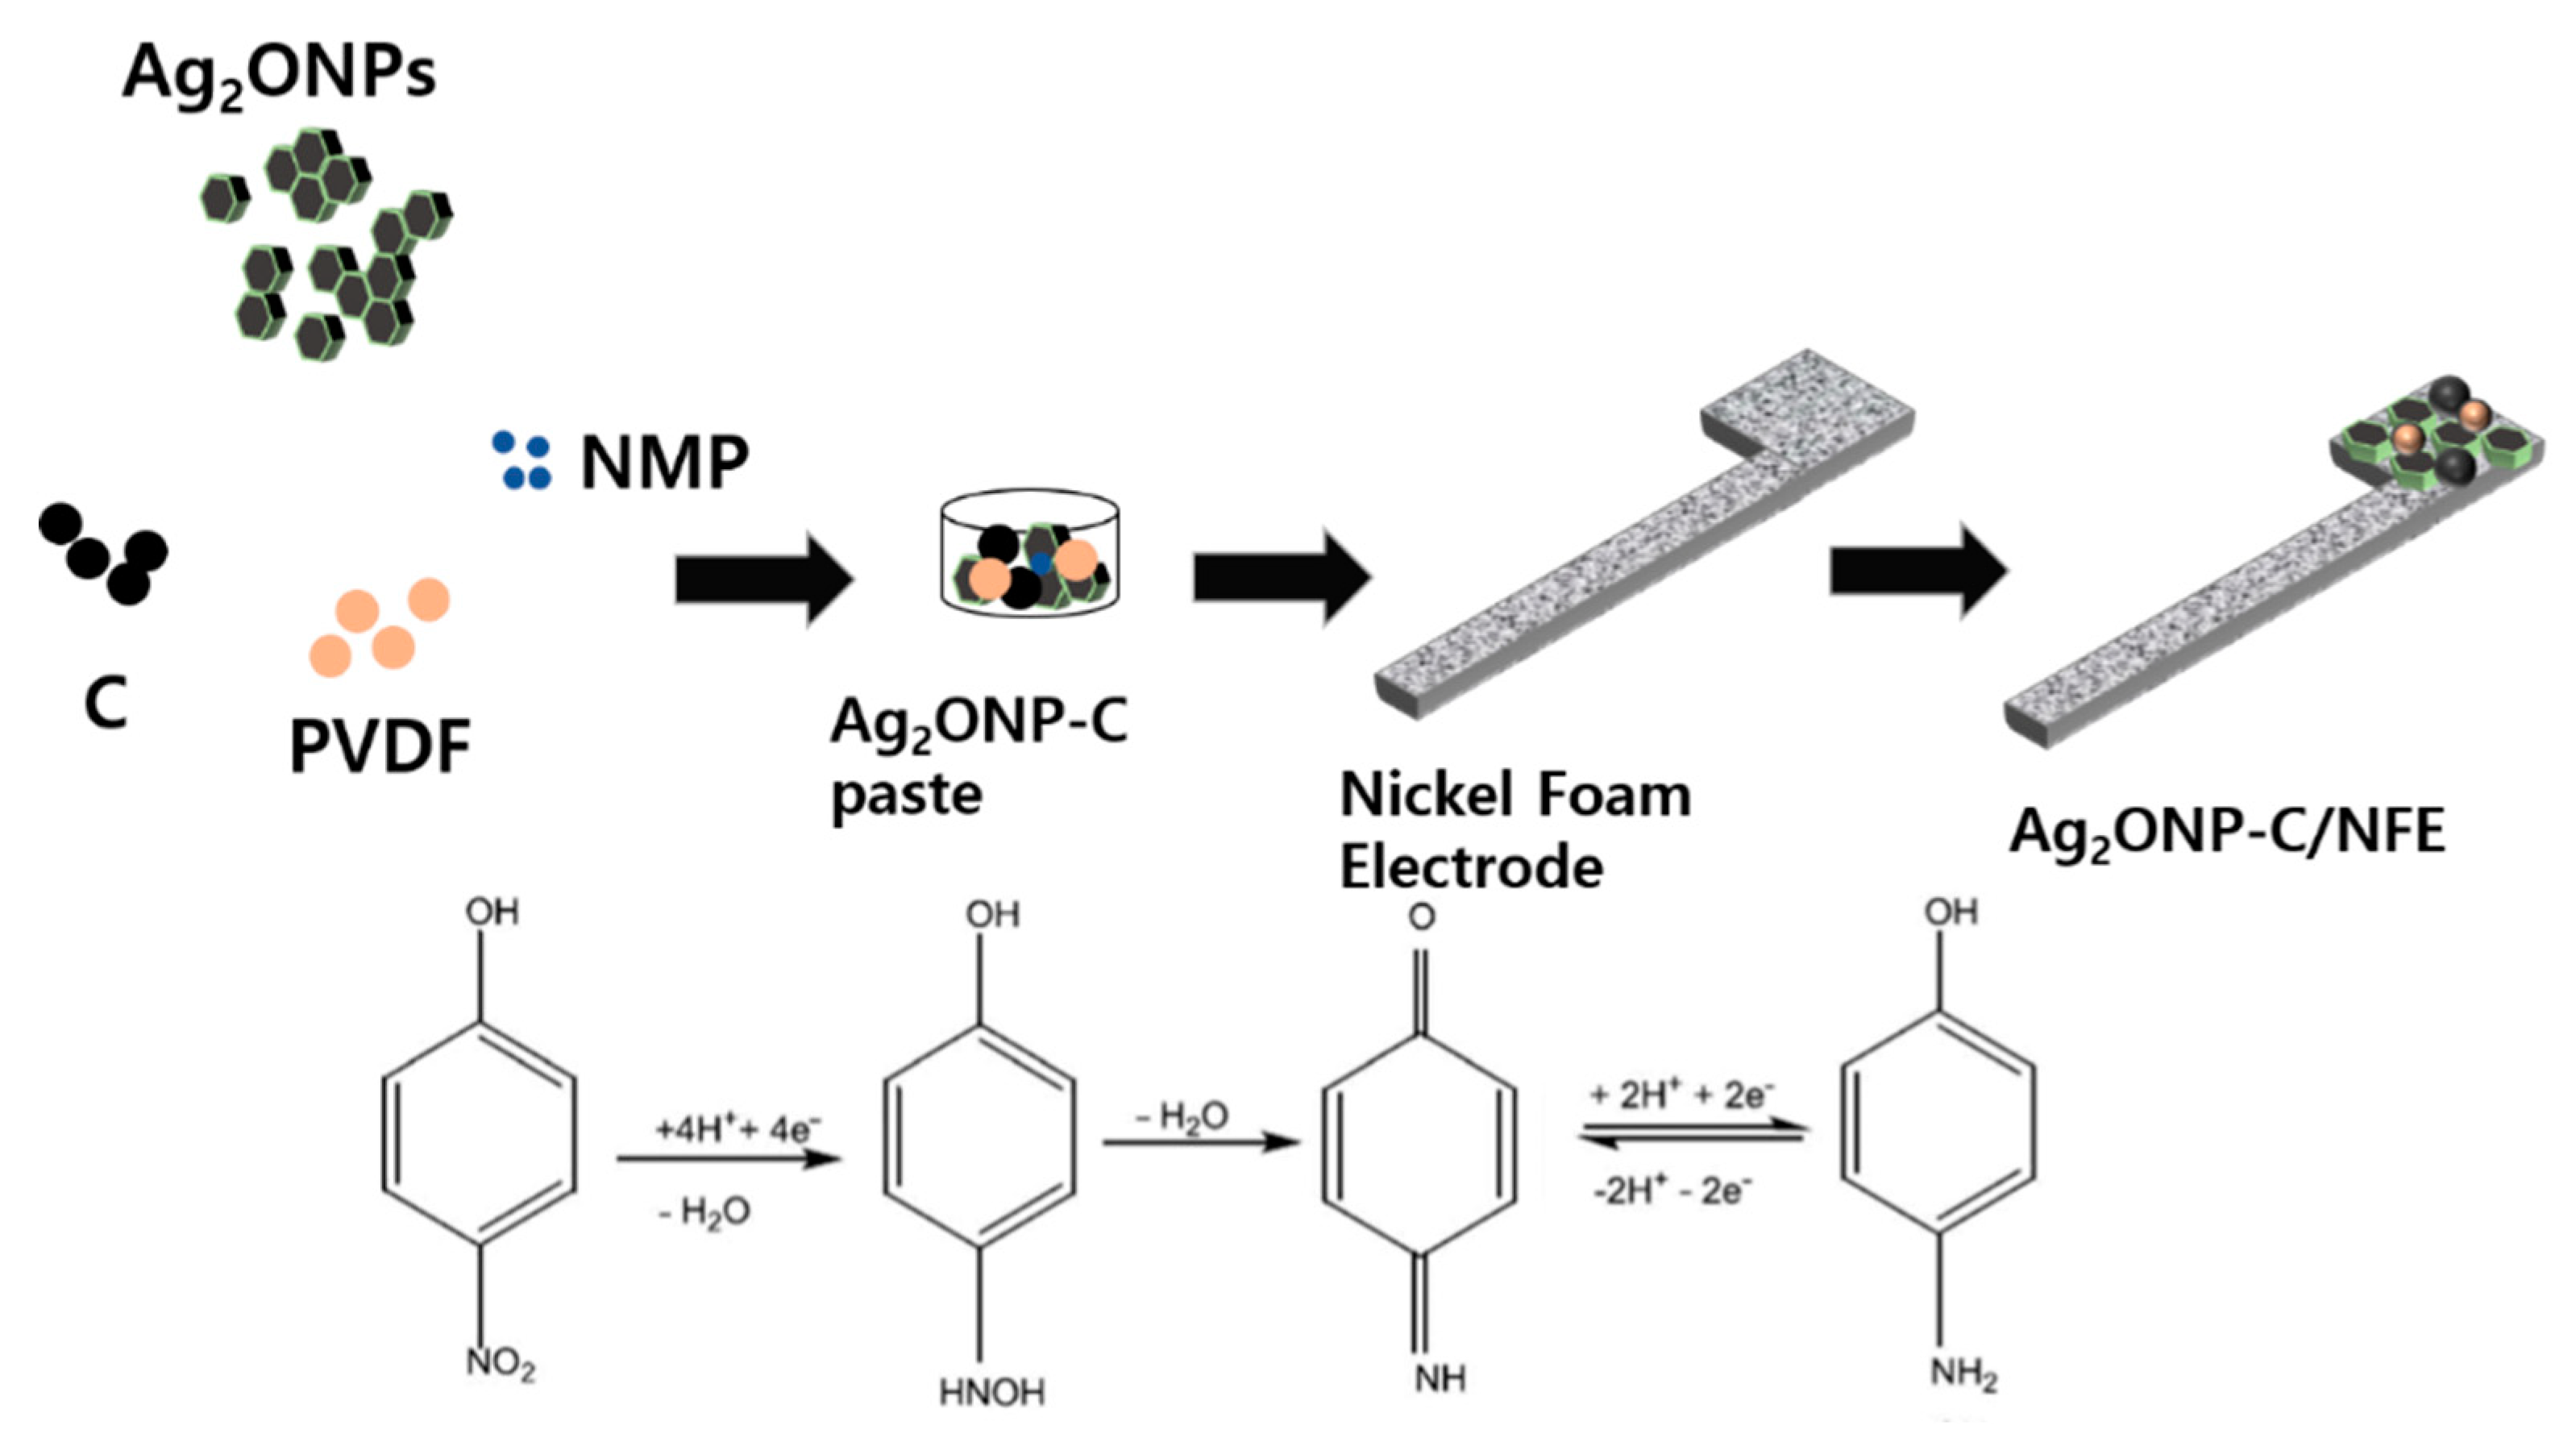
This response clearly shows the effect of modification of the carbon black/nickel foam electrode toward the p-NP sensitivity of the sensor. Additionally, a response time measurement of the Ag2ONP–C/NFE sensor was conducted as shown in Figure 6b. It was found to be around 5 s for the fabricated Ag2ONP–C/NFE sensor to reach the saturated current response upon addition of 25 μL of 0.01 mM p-nitrophenol to the electrolyte. The potential application of Ag2ONP–C/NFE as a chemical sensor was explored for detecting and quantifying toxic chemicals having adverse effects on the environment. The molecular structure, electron transfer mechanism, and possible reaction mechanism are generalized in Figure 7, where p-nitrophenol is reduced to p-aminophenol on the Ag2ONP–C/NFE sensor surface during I–V measurement.
In the presence of p-NP, 4e/4H reduction of the nitro-group of the hydroxylamine species occurred on the Ag2ONP–C/NFE surface, which improved and enhanced the current responses against potential during the I–V measurement at room conditions. This suggests that the p-NP molecules could be adsorbed by the Ag2ONP–C/NFE modified electrodes and reduced. This could be due to increase in the specific surface area, adsorption sites, and conductivity of Ag2ONP, which increased the current response for the sensing of p-NP in Ag2ONP–C/NFE.
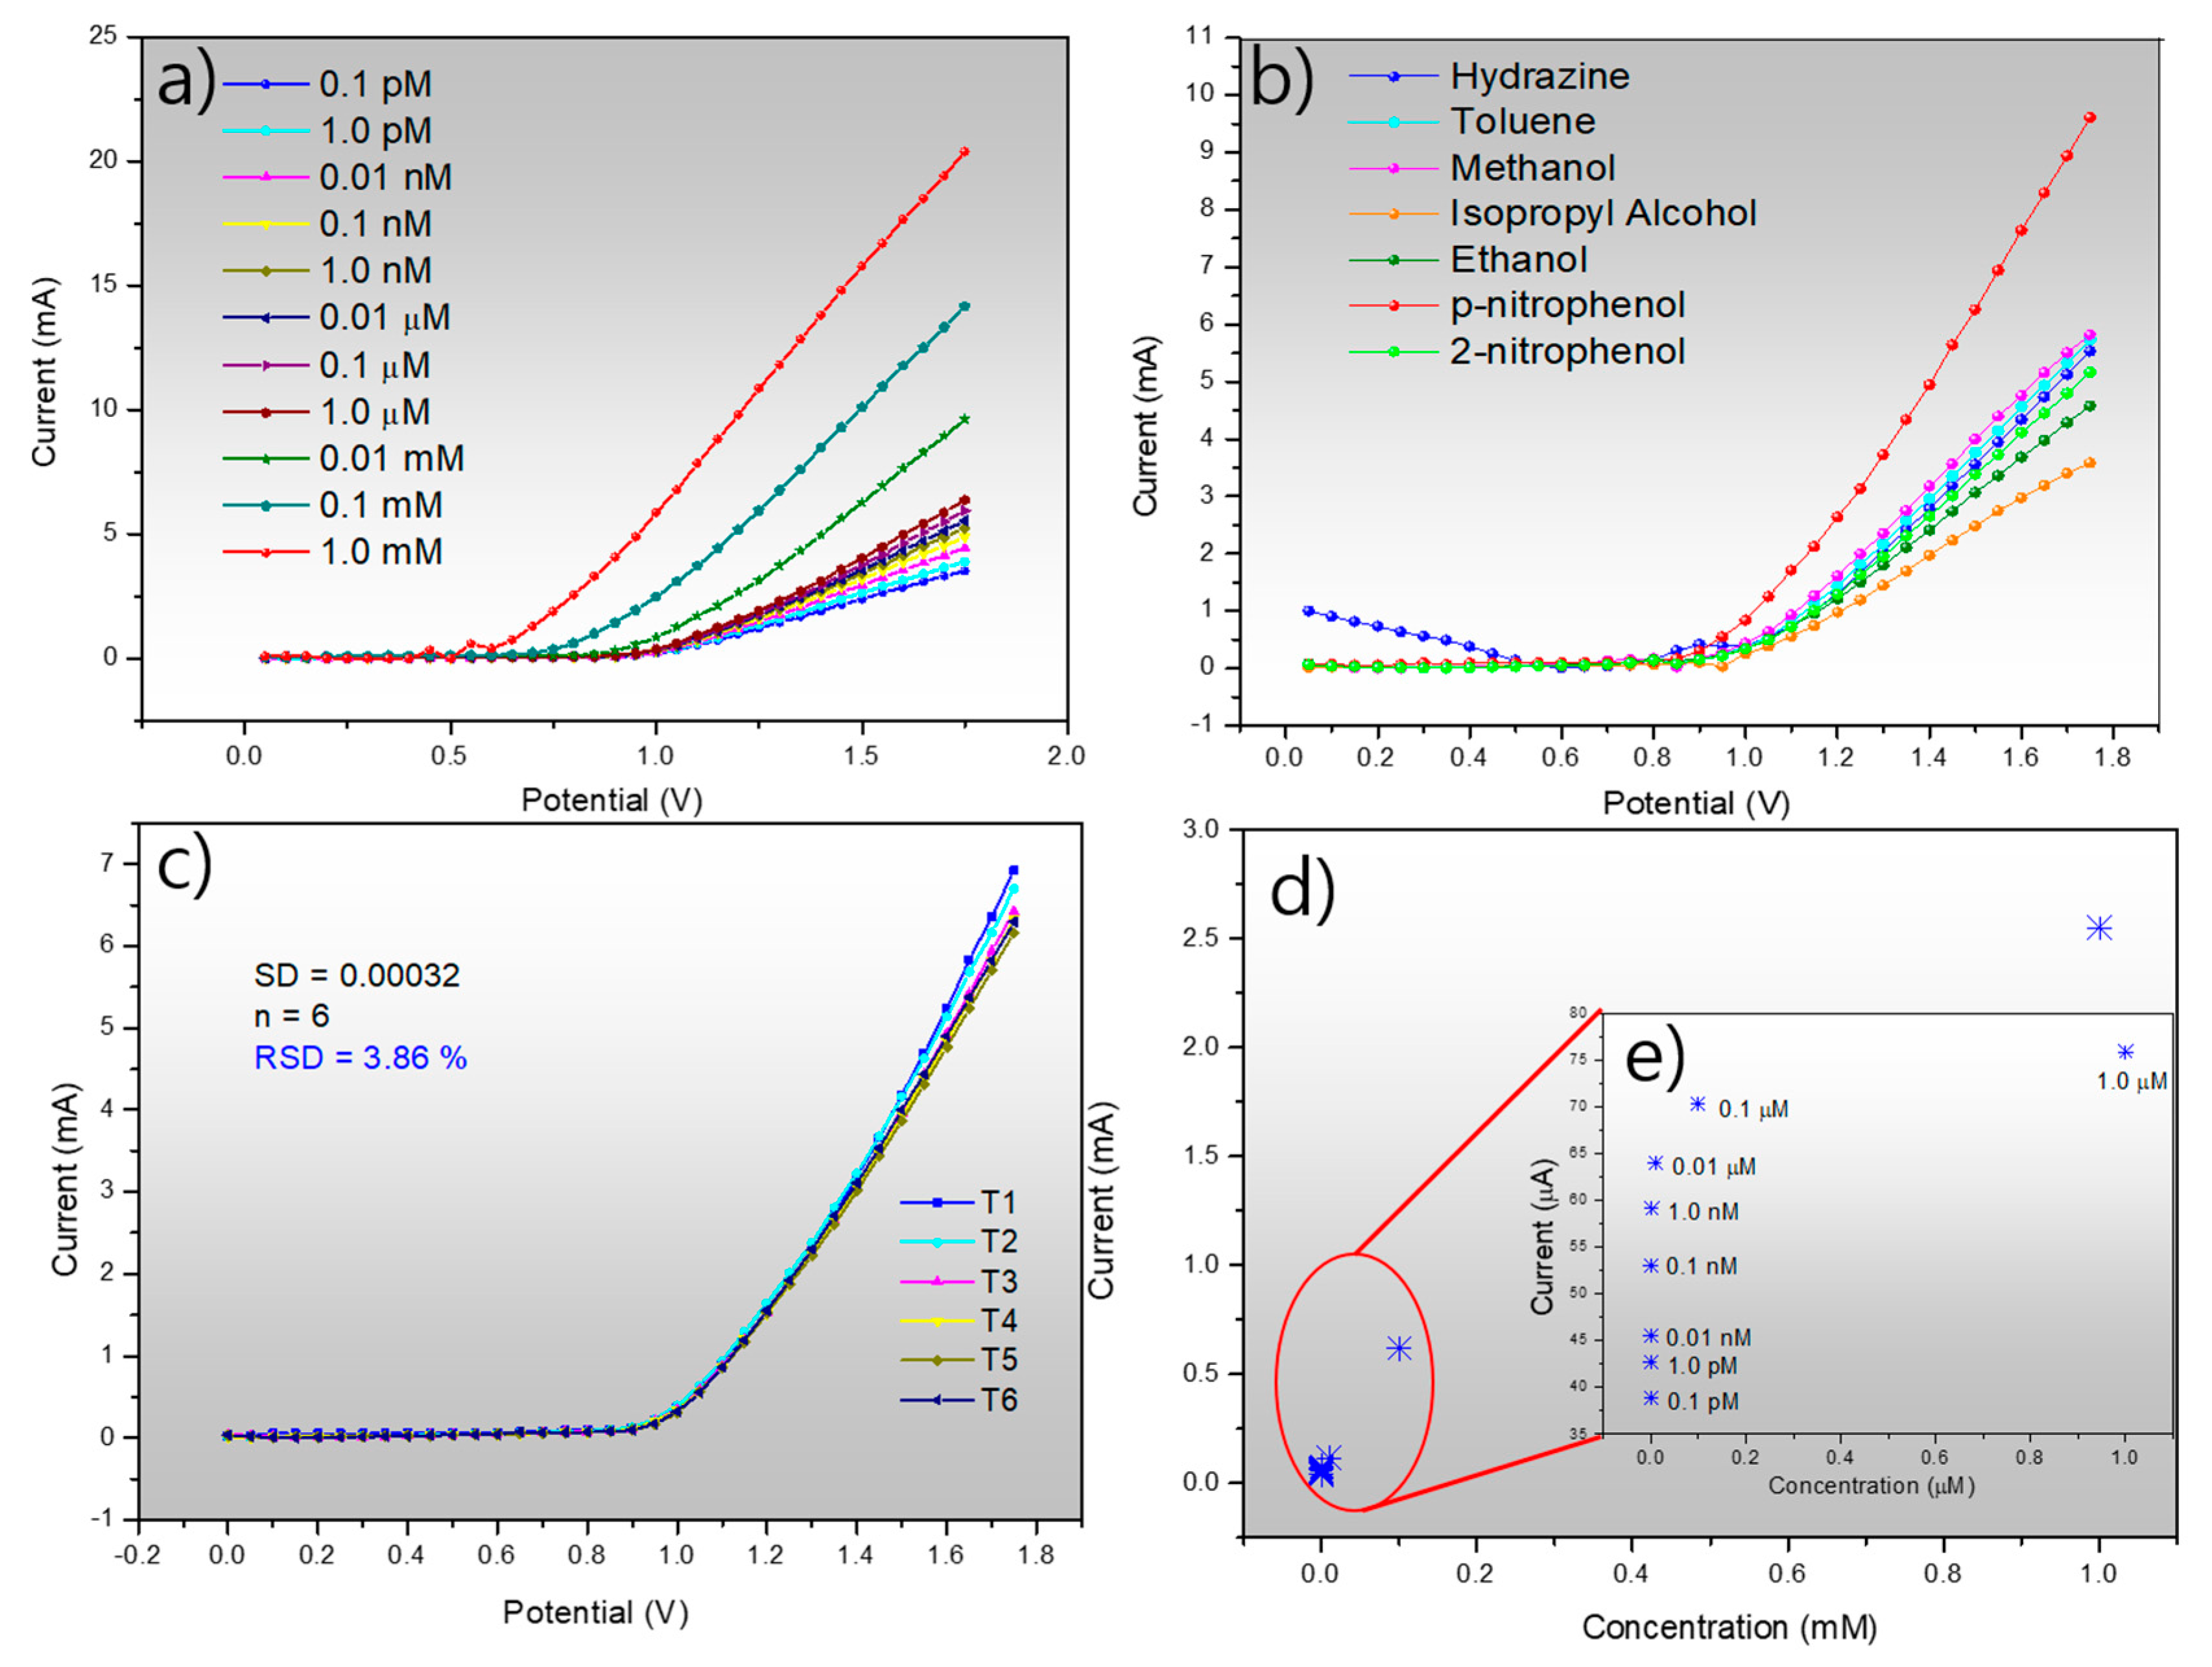
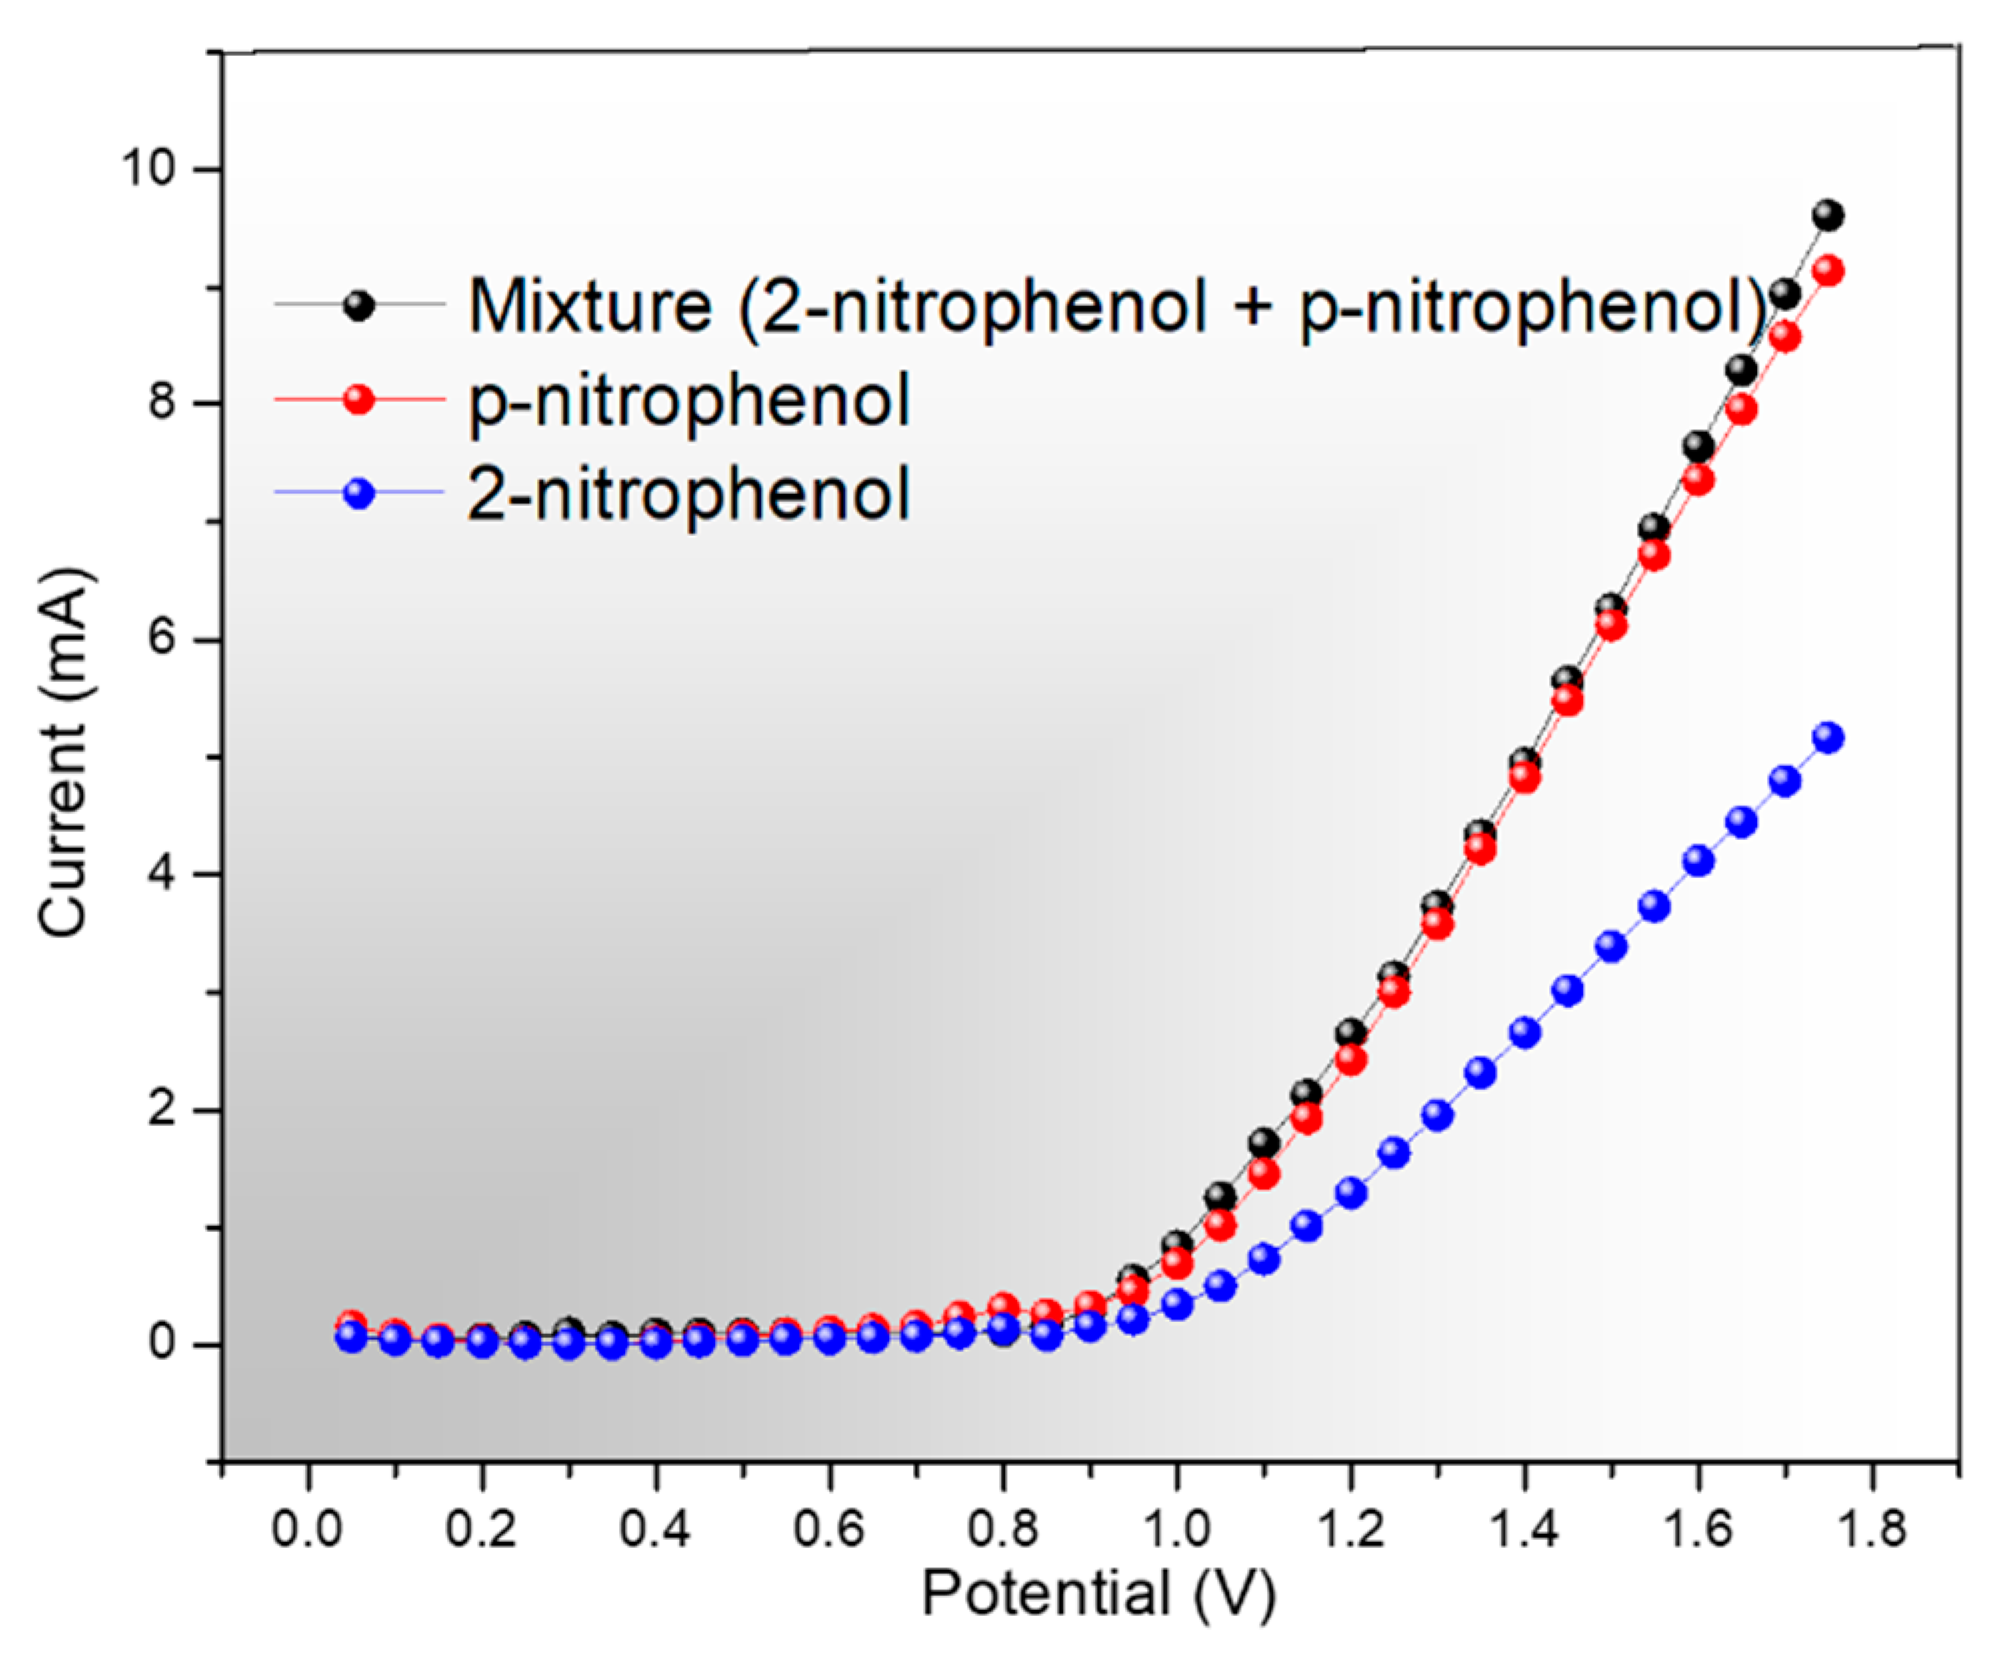
Figure 8a shows the electrochemical response of fabricated Ag2ONP–C/NFE with varying concentrations of p-NP. The analytes were mixed with the phosphate buffer solution at pH 6.6 electrolyte at a fixed volume of 25 μL. It is clearly shown here the sensitivity of the Ag2ONP–C/NFE sensor for as low as a 0.1 pM concentration of p-NP up to 1.0 mM concentration. This could be due to the crystal structure of the as-prepared Ag2ONP. Additionally, it was mentioned in a previous report that the high (111) facet exposure on the morphology of crystals gives the highest conductivity compared to other index facets [45]. In accordance with this report, the Ag2ONP showed a high-intensity peak corresponding to the (111) plane. This characteristic of the (111) facet is due to the minimal broken chemical bond of the surface atoms of each facet—four broken chemical bonds for (100), five broken chemical bonds for (110), and finally three for (111) [46] Another, key factor in fabricating a good semiconductor device is the electron mobility that plays a very important role in sensing performance. It was previously reported that the electron holes are lighter on (111) compared to (100) and (110), thus resulting in a higher electron mobility [47]. These factors led to higher device performance of Ag2ONP–C/NFE sensor. Figure 8b shows the selectivity of Ag2ONP–C/NFE sensor toward p-NP against various common chemicals such as hydrazine, toluene, methanol, isopropyl alcohol, ethanol, and 2-nitrophenol. The figure clearly shows the highest current response of the Ag2ONP–C/NFE sensor toward p-NP which makes it selective to p-NP with respect to the chemicals tested, thus making the Ag2ONP–C/NFE sensor good for large manufacturing plants that use several chemicals. Along with sensor selectivity, the reproducibility shown in Figure 8c was also measured and resulted in a relative standard deviation of 3.86% upon repetition which is much lower than the previous report of 9.68% [29]. Furthermore, Figure 8d shows the calibration plot of Ag2ONP–C/NFE with an inset at Figure 8e to magnify the low-concentration current response at +0.8 V. Furthermore, a test against the interference of 2-nitrophenol (Figure 9) showed a comparable current response of p-nitrophenol in the solution and the mixture of both, which suggest an almost negligible effect of the presence of 2-nitrophenol. A comparison of proposed electrode with the previously reported modified electrode is given in Table 1. It is found that the Ag2ONP–C/NFE sensor showed the highest performance among the reported sensors.

3. Materials and Methods

3.1. Materials

Nappa cabbage was purchased from Greenmart located in Seoul. Silver nitrate (99.8%) and ammonium hydroxide (25.0–28.0%) were purchased from Daejung Chemicals (Siheung, South Korea). Sodium hydroxide (93.0%) was purchased from Duksan Reagents (Ansan, South Korea). Polyvinylidene difluoride, carbon black, N-methyl-2-pyrrolidone, hydrochloric acid, ethanol, hydrazine, toluene, methanol, isopropyl alcohol, 2-nitrophenol, phosphate buffer solution pH 6.6 at 25 °C, and p-nitrophenol were purchased from Sigma-Aldrich Company (St. Louis, MO, USA). All these reagents were used as received. Deionized water was used throughout the experiment.

3.2. Preparation of Nappa Cabbage Extract

To prepare the nappa cabbage extract, leaves were washed thoroughly with distilled water and cut into small pieces of approximately 1 cm2 each. Then, 10 g of these small pieces were weighed and ground in a mortar and pestle until a paste-like consistency was achieved. Next, the paste was transferred into a beaker and 100 mL of distilled water was added, followed by stirring for 2 h at room temperature. Finally, the solution was filtered two times using Whatman filter paper no. 1 and stored under 5 °C for biological synthesis of Ag2ONPs. To get an agreeable reproducibility, the nappa cabbage must be fresh as we want the liquid content in it for easy extraction of the phytochemicals for the reduction process.

3.3. Synthesis of Prism-Like Silver Oxide Nanoparticles

In this “bottom-up” approach of biological synthesis of silver oxide, the nanoparticles were formed from atoms and molecules to form the nanostructures. Figure 10 shows the schematic biological synthesis of Ag2ONPs.
The 0.5 mM silver nitrate solution was prepared by dissolving 1.6987 g of AgNO3 in 100 mL of distilled water, marked as solution A, while 1.33 g of NaOH was dissolved in 100 mL of distilled water, marked as solution B; then, the two solutions (A, B) were mixed together forming a brown solution. NH4OH was added to the solution drop by drop with vigorous stirring until no trace of brown precipitate was present in the solution.
For the Ag2ONP synthesis, different volume ratios of extract to silver nitrate solution were prepared (extract mL: silver nitrate solution mL)—40:40 mL, 20:40 mL, and 10:40 mL. The reactional mixtures were kept under magnetic stirring (500 rpm) at 130 °C for 25 min of total reaction time. The time of color change varied, resulting in the 1:1 ratio as being the fastest one to change from a pale yellow-green solution to a pale brown to black solution, indicating the formation of silver oxide nanoparticles. The nanoparticles were collected through vacuum pump filtration and washed with ethanol several times before drying at 60 °C for 12 h for 1:1, 1:2, and 1:4 samples.

3.4. X-ray Diffraction (XRD)

X-ray diffraction (XRD) patterns of the samples were measured using Rigaku Ultima IV with copper Kα (λ = 1.54059 Å) as an incident beam. The tests were carried out at room temperature with a scanning rate of 0.02°∙s−1 in a 2θ range of 20° to 80°. Furthermore, the grain size of the samples was analyzed by employing the Scherrer equation (Equation (1)) [57].
τ = k λ β cos θ ,
where τ is the average size of the nanoparticles, k is a dimensionless shape factor (value of 0.9), λ is the wavelength of radiation, β is full width half maximum in radians, and θ is the angle diffraction.

3.5. Field-Emission Scanning Spectroscopy (FESEM) and Energy-Dispersive Spectroscopy (EDS)

The transition of surface morphologies of the nanoparticles was examined using field-emission scanning spectroscopy (FESEM, JEOL-7610F-Plus, Tokyo, Japan) at 15 kV. The FESEM test samples were carefully collected in glass vials. Additionally, to cover the FESEM copper plate, conductive resin tape was used where the particles were distributed and coated with gold. Element mapping was observed by energy dispersion spectrum (EDS).

3.6. Transmission Electron Microscopy (TEM)

The internal structure of as-synthesized Ag2ONP was scanned by field-emission transmission electron spectroscopy (FETEM, JEM-F200, Multipurpose Electron Microscope, Tokyo, Japan).

3.7. UV–Visible Light Spectral Analysis (UV–Vis)

Additionally, UV–visible light spectra of the samples were collected using a T60 UV–visible light spectrophotometer (Maharashtra, India), were scanned in the range of 300 nm to 800 nm. Finally, band gaps were computed using Tauc’s law [58].

3.8. Fabrication of p-Nitrophenol Sensing Electrode

As presented in Figure 7, nickel foam was used as a substrate to form the sensing device. To prepare the modified electrode, the nickel foam was firstly carefully cleaned using concentrated HCl solution (12M) in a sonicator for 5 min to remove the surface oxide layer, followed by deionized water and ethanol for another 5 min each. Next, the p-nitrophenol sensing electrode was prepared by creating a paste-like consistency of the following components: Ag2ONPs, carbon black, polyvinylidene difluoride (PVDF) with a ratio of 80:10:10, respectively, and a few drops of n-methyl-2-pyrrolidone. The mixture was ground in a mortar and pestle to form a homogeneous paste. Afterward, the paste was brushed onto the nickel foam electrode and oven-dried at 60 °C for 24 h.

3.9. p-Nitrophenol Sensing Measurement

In order to measure the p-NP sensing capability of the synthesized Ag2ONPs, the simple I–V method test was employed using Electromer, Keithley 6517A at room temperature. The electrolyte used was phosphate buffer solution at pH 6.6. Different concentrations of p-NP were prepared corresponding to 0.1 pM, 1.0 pM, 0.01 nM, 0.1 nM, 1.0 nM, 0.01 μM, 0.1 μM, 1.0 μM, 0.01 mM, 0.1 mM, and 1.0 mM. A uniform volume of the analyte was used throughout the experiment amounting to 25 μL mixed with 5 mL of electrolyte. The current was measured against the applied potential of fabricated silver oxide nanoparticle–carbon black/nickel foam electrode (Ag2ONPs–C/NFE) sensor for selective p-NP detection. A 0.01 mM concentration of the analyte was used in conducting the bare C/NFE and Ag2ONPs–C/NFE test, as well as the response time, reproducibility, and selectivity tests.

4. Conclusions

In summary, we synthesized silver oxide nanoparticles using nappa cabbage extract as a biological reducing agent. The extract-to-AgNO3-solution ratio of 1:4 favored the synthesis of Ag2ONPs with a morphological structure of a prism-like nanoparticle with a high intensity of the (111) facet, which is the most conductive compared to (100) and (110). This resulted in an enhanced performance of the Ag2ONPs–C/NFE toward the detection of p-nitrophenol. The Ag2ONPs–C/NFE had high sensitivity and selectivity to p-NP with respect to various chemicals tested at room temperature. A simple analysis procedure means that it can be applied for in-line analysis in manufacturing plants and synthesized using an eco-friendly method. These factors suggest that Ag2ONPs–C/NFE has wide application prospects toward p-NP monitoring at an ultra-low concentration range, and it could potentially be applied for p-nitrophenol determination in real samples.

Author Contributions

Conceptualization, J.B.; Data curation, J.B.; Formal analysis, J.B.; Methodology, J.B.; Supervision, J.I.H.; Writing—original draft, J.B.; Writing—review & editing, J.B. All authors have read and agreed to the published version of the manuscript.

Funding

This work was supported by the Basic Science Research Program through the National Research Foundation of Korea (NRF) founded by Ministry of Education (NRF-2017R1D1A1B03030456).

Conflicts of Interest

The authors declare no conflicts of interest.

References

  1. Zhou, Y.; Zhao, J.; Li, S.; Guo, M.; Fan, Z. An electrochemical sensor for the detection of p-nitrophenol based on a cyclodextrin-decorated gold nanoparticle-mesoporous carbon hybrid. Analyst 2019, 144, 4400–4406. [Google Scholar] [CrossRef] [PubMed]
  2. Mucci, M.; Douglas, G.; Lürling, M. Lanthanum modified bentonite behaviour and efficiency in adsorbing phosphate in saline waters. Chemosphere 2020, 249, 126131. [Google Scholar] [CrossRef] [PubMed]
  3. Samuel, M.S.; Jose, S.; Selvarajan, E.; Mathimani, T.; Pugazhendhi, A. Biosynthesized silver nanoparticles using Bacillus amyloliquefaciens; Application for cytotoxicity effect on A549 cell line and photocatalytic degradation of p-nitrophenol. J. Photochem. Photobiol. B Biol. 2020, 202, 111642. [Google Scholar] [CrossRef] [PubMed]
  4. Chen, R.; Yang, L.; Guo, Y.; Zheng, W.; Liu, H.; Wei, Y. Effect of p-nitrophenol degradation in aqueous dispersions of different crystallized goethites. J. Photochem. Photobiol. A Chem. 2018, 353, 337–343. [Google Scholar] [CrossRef]
  5. Vieira, G.B.; José, H.J.; Peterson, M.; Baldissarelli, V.Z.; Alvarez, P.; de Fátima Peralta Muniz Moreira, R. CeO2/TiO2 nanostructures enhance adsorption and photocatalytic degradation of organic compounds in aqueous suspension. J. Photochem. Photobiol. A Chem. 2018, 353, 325–336. [Google Scholar] [CrossRef]
  6. Holkar, C.R.; Jadhav, A.J.; Pinjari, D.V.; Mahamuni, N.M.; Pandit, A.B. A critical review on textile wastewater treatments: Possible approaches. J. Environ. Manag. 2016, 182, 351–366. [Google Scholar] [CrossRef]
  7. Yao, Y.-X.; Li, H.-B.; Liu, J.-Y.; Tan, X.-L.; Yu, J.-G.; Peng, Z.-G. Removal and Adsorption of p-Nitrophenol from Aqueous Solutions Using Carbon Nanotubes and Their Composites. J. Nanomater. 2014, 2014, 571745. [Google Scholar] [CrossRef] [Green Version]
  8. Hamidouche, S.; Bouras, O.; Zermane, F.; Cheknane, B.; Houari, M.; Debord, J.; Harel, M.; Bollinger, J.-C.; Baudu, M. Simultaneous sorption of 4-nitrophenol and 2-nitrophenol on a hybrid geocomposite based on surfactant-modified pillared-clay and activated carbon. Chem. Eng. J. 2015, 279, 964–972. [Google Scholar] [CrossRef]
  9. Wu, Z.; Yuan, X.; Zhong, H.; Wang, H.; Zeng, G.; Chen, X.; Wang, H.; Zhang, L.; Shao, J. Enhanced adsorptive removal of p-nitrophenol from water by aluminum metal-organic framework/reduced graphene oxide composite. Sci. Rep. 2016, 6, 1–13. [Google Scholar] [CrossRef] [Green Version]
  10. Kuang, S.; Le, Q.; Hu, J.; Wang, Y.; Yu, N.; Cao, X.; Zhang, M.; Sun, Y.; Gu, W.; Yang, Y.; et al. Effects of p-nitrophenol on enzyme activity, histology, and gene expression in Larimichthys crocea. Comp. Biochem. Physiol. C Toxicol. Pharmacol. 2020, 228, 108638. [Google Scholar] [CrossRef]
  11. Liu, S.; Lai, C.; Li, B.; Zhang, C.; Zhang, M.; Huang, D.; Qin, L.; Yi, H.; Liu, X.; Huang, F.; et al. Role of radical and non-radical pathway in activating persulfate for degradation of p-nitrophenol by sulfur-doped ordered mesoporous carbon. Chem. Eng. J. 2020, 384, 123304. [Google Scholar] [CrossRef]
  12. Oueslati, M.H.; Ben Tahar, L.; Harrath, A.H. Synthesis of ultra-small gold nanoparticles by polyphenol extracted from Salvia officinalis and efficiency for catalytic reduction of p-nitrophenol and methylene blue. Green Chem. Lett. Rev. 2020, 13, 18–26. [Google Scholar] [CrossRef] [Green Version]
  13. Jing, Q.; Yi, Z.; Lin, D.; Zhu, L.; Yang, K. Enhanced sorption of naphthalene and p-nitrophenol by Nano-SiO2 modified with a cationic surfactant. Water Res. 2013, 47, 4006–4012. [Google Scholar] [CrossRef] [PubMed]
  14. Tuo, Y.; Liu, G.; Dong, B.; Zhou, J.; Wang, A.; Wang, J.; Jin, R.; Lv, H.; Dou, Z.; Huang, W. Microbial synthesis of Pd/Fe3O4, Au/Fe3O4 and PdAu/Fe3O4 nanocomposites for catalytic reduction of nitroaromatic compounds. Sci. Rep. 2015, 5, 13515. [Google Scholar] [CrossRef] [PubMed] [Green Version]
  15. Ribeiro, R.S.; Silva, A.M.T.; Figueiredo, J.L.; Faria, J.L.; Gomes, H.T. Removal of 2-nitrophenol by catalytic wet peroxide oxidation using carbon materials with different morphological and chemical properties. Appl. Catal. B Environ. 2013, 140–141, 356–362. [Google Scholar] [CrossRef]
  16. Li, X.; Li, C.; Gao, G.; Lv, B.; Xu, L.; Lu, Y.; Zhang, G. In-situ self-assembly of robust Fe (III)-carboxyl functionalized polyacrylonitrile polymeric bead catalyst for efficient photo-Fenton oxidation of p-nitrophenol. Sci. Total Environ. 2020, 702, 134910. [Google Scholar] [CrossRef]
  17. Brega, A.; Prandini, P.; Amaglio, C.; Pafumi, E. Determination of phenol, m-, o- and p-cresol, p-aminophenol and p-nitrophenol in urine by high-performance liquid chromatography. J. Chromatogr. A 1990, 535, 311–316. [Google Scholar] [CrossRef]
  18. Anandalakshmi, K.; Venugobal, J.; Ramasamy, V. Characterization of silver nanoparticles by green synthesis method using Pedalium murex leaf extract and their antibacterial activity. Appl. Nanosci. 2016, 6, 399–408. [Google Scholar] [CrossRef] [Green Version]
  19. Honeychurch, K.C.; Hart, J.P. Voltammetric Behavior ofp-Nitrophenol and Its Trace Determination in Human Urine by Liquid Chromatography with a Dual Reductive Mode Electrochemical Detection System. Electroanalysis 2007, 19, 2176–2184. [Google Scholar] [CrossRef]
  20. Xiao, N.; Liu, S.G.; Mo, S.; Li, N.; Ju, Y.J.; Ling, Y.; Li, N.B.; Luo, H.Q. Highly selective detection of p-nitrophenol using fluorescence assay based on boron, nitrogen co-doped carbon dots. Talanta 2018, 184, 184–192. [Google Scholar] [CrossRef]
  21. Takayanagi, T.; Mine, M.; Mizuguchi, H. Capillary Electrophoresis/Dynamic Frontal Analysis for the Enzyme Assay of 4-Nitrophenyl Phosphate with Alkaline Phosphatase. Anal. Sci. 2020. [Google Scholar] [CrossRef] [Green Version]
  22. Vinoth, S.; Sampathkumar, P.; Giribabu, K.; Pandikumar, A. Ultrasonically assisted synthesis of barium stannate incorporated graphitic carbon nitride nanocomposite and its analytical performance in electrochemical sensing of 4-nitrophenol. Ultrason. Sonochem. 2019, 62, 104855. [Google Scholar] [CrossRef] [PubMed]
  23. Huang, Y.; Bai, S.; Huang, J.; Ma, Y.; Zeng, Q.; Wang, M.; Wang, L. Simultaneous detection of nitrophenol isomers using an easy-to-fabricate thiophene-based microporous polymer film modified electrode. Microchem. J. 2019, 153, 104465. [Google Scholar] [CrossRef]
  24. Wang, J.; Qiu, C.; Mu, X.; Pang, H.; Chen, X.; Liu, D. Ultrasensitive SERS detection of rhodamine 6G and p-nitrophenol based on electrochemically roughened nano-Au film. Talanta 2020, 210, 120631. [Google Scholar] [CrossRef] [PubMed]
  25. Li, H.; Li, J.; Xu, Q.; Yang, Z.; Hu, X. A derivative photoelectrochemical sensing platform for 4-nitrophenolate contained organophosphates pesticide based on carboxylated perylene sensitized nano-TiO2. Anal. Chim. Acta 2013, 766, 47–52. [Google Scholar] [CrossRef] [PubMed]
  26. Toberer, E.S.; Schladt, T.D.; Seshadri, R. Macroporous Manganese Oxides with Regenerative Mesopores. J. Am. Chem. Soc. 2006, 128, 1462–1463. [Google Scholar] [CrossRef]
  27. Kipke, A.; Hofmeister, H. Formation of silver nanoparticles in low-alkali borosilicate glass via silver oxide intermediates. Mater. Chem. Phys. 2008, 111, 254–259. [Google Scholar] [CrossRef]
  28. Reddy, P.N.; Reddy, M.H.P.; Pierson, J.F.; Uthanna, S. Characterization of Silver Oxide Films Formed by Reactive RF Sputtering at Different Substrate Temperatures. ISRN Opt. 2014, 2014, 1–7. [Google Scholar] [CrossRef] [Green Version]
  29. Rahman, M.M.; Marwani, H.M.; Algethami, F.K.; Asiri, A.M.; Hameed, S.A.; Alhogbi, B. Ultra-sensitive p-nitrophenol sensing performances based on various Ag2O conjugated carbon material composites. Environ. Nanotechnol. Monit. Manag. 2017, 8, 73–82. [Google Scholar]
  30. Pierson, J.F.; Rousselot, C. Stability of reactively sputtered silver oxide films. Surf. Coatings Technol. 2005, 200, 276–279. [Google Scholar] [CrossRef]
  31. Rahman, M.M.; Bahadar Khan, S.; Jamal, A.; Faisal, M.; Asiri, A.M. Fabrication of highly sensitive acetone sensor based on sonochemically prepared as-grown Ag2O nanostructures. Chem. Eng. J. 2012, 192, 122–128. [Google Scholar] [CrossRef]
  32. Balachandramohan, J.; Sivasankar, T.; Sivakumar, M. Facile sonochemical synthesis of Ag2O-guar gum nanocomposite as a visible light photocatalyst for the organic transformation reactions. J. Hazard. Mater. 2020, 385, 121621. [Google Scholar] [CrossRef] [PubMed]
  33. Karaca, E.; Gökcen, D.; Pekmez, N.Ö.; Pekmez, K. Galvanostatic synthesis of nanostructured Ag-Ag2O dispersed PPy composite on graphite electrode for supercapacitor applications. Int. J. Energy Res. 2020, 44, 158–170. [Google Scholar] [CrossRef]
  34. Skiba, M.I.; Vorobyova, V.I.; Pivovarov, A.; Makarshenko, N.P. Green Synthesis of Silver Nanoparticles in the Presence of Polysaccharide: Optimization and Characterization. J. Nanomater. 2020, 2020, 1–10. [Google Scholar] [CrossRef]
  35. Goutam, S.P.; Saxena, G.; Roy, D.; Yadav, A.K.; Bharagava, R.N. Green Synthesis of Nanoparticles and Their Applications in Water and Wastewater Treatment. In Bioremediation of Industrial Waste for Environmental Safety; Springer: Singapore, 2020; pp. 349–379. [Google Scholar]
  36. Jeong, J.W.; Park, K.J.; Lim, J.H.; Sung, J.M. Analysis of hazard on fresh and salted baechus (nappa cabbage, Brassica rapa L. subsp. pekinensis) in Korea. J. Korean Soc. Appl. Biol. Chem. 2013, 56, 69–76. [Google Scholar] [CrossRef]
  37. Cartea, M.E.; Francisco, M.; Soengas, P.; Velasco, P. Phenolic Compounds in Brassica Vegetables. Molecules 2010, 16, 251–280. [Google Scholar] [CrossRef]
  38. Johnson, I.; Prabu, H.J. Green synthesis and characterization of silver nanoparticles by leaf extracts of Cycas circinalis, Ficus amplissima, Commelina benghalensis and Lippia nodiflora. Int. Nano Lett. 2015, 5, 43–51. [Google Scholar] [CrossRef] [Green Version]
  39. Hussain, M.; Raja, N.I.; Iqbal, M.; Aslam, S. Applications of Plant Flavonoids in the Green Synthesis of Colloidal Silver Nanoparticles and Impacts on Human Health. Iran. J. Sci. Technol. Trans. A Sci. 2019, 43, 1381–1392. [Google Scholar] [CrossRef]
  40. Kumar, P.P.N.V.; Shameem, U.; Kollu, P.; Kalyani, R.L.; Pammi, S.V.N. Green Synthesis of Copper Oxide Nanoparticles Using Aloe vera Leaf Extract and Its Antibacterial Activity Against Fish Bacterial Pathogens. Bionanoscience 2015, 5, 135–139. [Google Scholar] [CrossRef]
  41. Sougandhi, P.R.; Ramanaiah, S. Green synthesis and spectral characterization of silver nanoparticles from Psidium guajava leaf extract. Inorg. Nano-Metal Chem. 2020, 0, 1–5. [Google Scholar]
  42. Salari, S.; Jafari, S.M. The Influence of Ohmic Heating on Degradation of Food Bioactive Ingredients. Food Eng. Rev. 2020. [Google Scholar] [CrossRef]
  43. Utama, G.L.; Utba, F.; Irena, F.; Wira, D.W. Napa Cabbage (Brassica rapa subsp. pekinensis&) Wastes as Sources of Potential Ethanol-Fermenting Indigenous Yeasts with Stress Tolerance Ability. J. Jpn. Inst. Energy 2018, 97, 261–265. [Google Scholar]
  44. Vinay, S.P.; Udayabhanu; Nagaraju, G.; Chandrappa, C.P.; Chandrasekhar, N. Novel Gomutra (cow urine) mediated synthesis of silver oxide nanoparticles and their enhanced photocatalytic, photoluminescence and antibacterial studies. J. Sci. Adv. Mater. Devices 2019, 4, 392–399. [Google Scholar] [CrossRef]
  45. Tan, C.-S.; Chen, Y.-J.; Hsia, C.-F.; Huang, M.H. Facet-Dependent Electrical Conductivity Properties of Silver Oxide Crystals. Chem. Asian J. 2017, 12, 293–297. [Google Scholar] [CrossRef]
  46. Cao, G.; Wang, Y. Nanostructures and Nanomaterials; In World Scientific Series in Nanoscience and Nanotechnology; World Scientific: Singapore, 2011; Volume 2. [Google Scholar]
  47. Ribeiro, R.A.P.; Oliveira, M.C.; Bomio, M.R.D.; de Lazaro, S.R.; Andrés, J.; Longo, E. Connecting the surface structure, morphology and photocatalytic activity of Ag2O: An in depth and unified theoretical investigation. Appl. Surf. Sci. 2020, 509, 145321. [Google Scholar] [CrossRef]
  48. Laghrib, F.; Houcini, H.; Khalil, F.; Liba, A.; Bakasse, M.; Lahrich, S.; El Mhammedi, M.A. Synthesis of Silver Nanoparticles Using Chitosan as Stabilizer Agent: Application towards Electrocatalytical Reduction of p-Nitrophenol. ChemistrySelect 2020, 5, 1220–1227. [Google Scholar] [CrossRef]
  49. Chu, L.; Han, L.; Zhang, X. Electrochemical simultaneous determination of nitrophenol isomers at nano-gold modified glassy carbon electrode. J. Appl. Electrochem. 2011, 41, 687–694. [Google Scholar] [CrossRef]
  50. Yang, Y.-L.; Unnikrishnan, B.; Chen, S.-M. Amperometric Determination of 4-Nitrophenol at Multi-Walled Carbon Nanotube-Poly(Diphenylamine) Composite Modified Glassy Carbon Electrode. Int. J. Electrochem. Sci. 2011, 6, 3902–3912. [Google Scholar]
  51. Karuppiah, C.; Palanisamy, S.; Chen, S.M.; Emmanuel, R.; Ali, M.A.; Muthukrishnan, P.; Prakash, P.; Al-Hemaid, F.M.A. Green biosynthesis of silver nanoparticles and nanomolar detection of p-nitrophenol. J. Solid State Electrochem. 2014, 18, 1847–1854. [Google Scholar] [CrossRef]
  52. Yin, H.; Zhou, Y.; Ai, S.; Ma, Q.; Zhu, L.; Lu, L. Electrochemical oxidation determination and voltammetric behaviour of 4-nitrophenol based on Cu 2O nanoparticles modified glassy carbon electrode. Int. J. Environ. Anal. Chem. 2012, 92, 742–754. [Google Scholar] [CrossRef]
  53. Yin, H.; Ai, S.; Zhu, L.-S. Electrochemical oxidative determination of 4-nitrophenol based on a glassy carbon electrode modified with a hydroxyapatite nanopowder. Microchim. Acta 2010, 169, 87–92. [Google Scholar] [CrossRef]
  54. Arvinte, A.; Mahosenaho, M.; Pinteala, M.; Sesay, A.M.; Virtanen, V. Electrochemical oxidation of p-nitrophenol using graphene-modified electrodes, and a comparison to the performance of MWNT-based electrodes. Microchim. Acta 2011, 174, 337–343. [Google Scholar] [CrossRef]
  55. Madhu, R.; Karuppiah, C.; Chen, S.M.; Veerakumar, P.; Liu, S. Bin Electrochemical detection of 4-nitrophenol based on biomass derived activated carbons. Anal. Methods 2014, 6, 5274–5280. [Google Scholar] [CrossRef]
  56. Casella, I.G.; Contursi, M. The Electrochemical Reduction of Nitrophenols on Silver Globular Particles Electrodeposited under Pulsed Potential Conditions. J. Electrochem. Soc. 2007, 154, D697. [Google Scholar] [CrossRef]
  57. Ajitha, B.; Ashok Kumar Reddy, Y.; Reddy, P.S. Biogenic nano-scale silver particles by Tephrosia purpurea leaf extract and their inborn antimicrobial activity. Spectrochim. Acta A Mol. Biomol. Spectrosc. 2014, 121, 164–172. [Google Scholar] [CrossRef]
  58. Hilal, M.; Han, J.I. Preparation of hierarchical flower-like nickel sulfide as hole transporting material for organic solar cells via a one-step solvothermal method. Sol. Energy 2019, 188, 403–413. [Google Scholar] [CrossRef]
Sample Availability: Samples of the compounds are not available from the authors.
Figure 1. X-ray diffraction (XRD) patterns of synthesized nanoparticles at different extract ratios: (a) AgNP at 1:1 ratio; (b) AgNP–Ag2ONP at 1:2 ratio; (c) Ag2ONP at 1:4 ratio; (d) grain size vs. extract ratio of synthesized nanoparticles.
Molecules 25 02298 g001
Figure 2. Field-emission scanning electron microscope (FESEM) images of synthesized nanoparticles at different extract ratios: (a) AgNP at 1:1 ratio; (b) magnified image of 1:1; (c) AgNP–Ag2ONP at 1:2 ratio; (d) magnified image of 1:2; (e) Ag2ONP at 1:4 ratio; (f) magnified image of 1:4.
Molecules 25 02298 g002aMolecules 25 02298 g002b
Figure 3. Energy-dispersive spectroscopy (EDS) elemental mapping of 1:4 ratio: (a) EDS spectrum and EDS element mapping images of combined O and Ag, (b) O, (c) and (d) Ag.
Molecules 25 02298 g003
Figure 4. TEM images of synthesized Ag2ONP: (a) low-magnification TEM image of Ag2ONP; (b) high-magnification TEM image of Ag2ONP; (c) high-resolution (HR)TEM image of Ag2ONP; (d) lattice spacing of Ag2ONP; (e) SAED pattern image of Ag2ONP.
Molecules 25 02298 g004
Figure 5. (a) Ultraviolet–visible light (UV–Vis) spectra of synthesized nanoparticles at different extract ratios: AgNP at 1:1 ratio, AgNP–Ag2ONP at 1:2 ratio, Ag2ONP at 1:4 ratio; (b) Tauc plot for band gap determination.
Molecules 25 02298 g005
Figure 6. (a) I–V response curve of bare carbon black/nickel foam electrode and nickel foam electrode incorporating Ag2ONPs and carbon black (Ag2ONP–C/NFE) and (b) response time (s) at 25 μL of 0.01 mM p-nitrophenol (p-NP) added to the phosphate buffer solution pH 6.6 at 25 °C.
Molecules 25 02298 g006
Figure 7. Schematic diagram of device fabrication and p-NP detection chemical route.
Molecules 25 02298 g007
Figure 8. (a) Electrochemical detection of p-nitrophenol using Ag2ONP–C/NFE at different concentrations from 0.10 pM to 1.0 mM; (b) selectivity test of Ag2ONP–C/NFE against various analytes at 25 μL of 0.01 mM added to the phosphate buffer solution pH 6.6 at 25 °C; (c) reproducibility using the same working electrode; (d) calibration plot of Ag2ONP–C/NFE sensor at +0.8 V measured using 25 μL of 0.01 mM of p-NP; (e) inset: magnified view.
Molecules 25 02298 g008
Figure 9. Selectivity against 2-nitrophenol (I–V response on individual analyte and mixture of 2-nitrophenol and p-nitrophenol.
Molecules 25 02298 g009
Figure 10. Schematic diagram of biological synthesis of Ag2ONP.
Molecules 25 02298 g010
Table 1. Comparison of analytical parameters for detection of p-NP over various modified electrodes.
ElectrodeTechniqueLinear Range (μM)Limit of Detection (μM)Reference
β-1,4-p-DGA-AgNPs/GrCEDifferential pulse voltammetry1–1000.6[48]
Au NPs/GCESemi-derivative voltammetry10–10005.81[49]
MWCNT/PDPA/GCEAmperometry8.9–15000.632[50]
Ag NPs/GCEDifferential pulse voltammetry0.1–3502.57[51]
HA-NP/GCEDifferential pulse voltammetry1–3000.6[52]
Nano-Cu2O/GCEDifferential pulse voltammetry1–4000.5[53]
Graphene/Nf/SPCEDifferential pulse voltammetry10–6200.6[54]
AC/GCELinear sweep voltammetry1–5005.81[55]
Ag particles/GCEDifferential pulse voltammetry1–4000.5[56]
Ag2O-CNT-NCs/GCEI–V method0.001–100.000091 ± 0.000002[29]
Ag2ONP–C/NFE I–V method0.0000001–0.010.0000007This work
The abbreviations of the modified electrodes can be referred from the corresponding references.