Influence of Drainage on Peat Organic Matter: Implications for Development, Stability, and Transformation

 ,
, 
Abstract
:1. Introduction
2. Methods
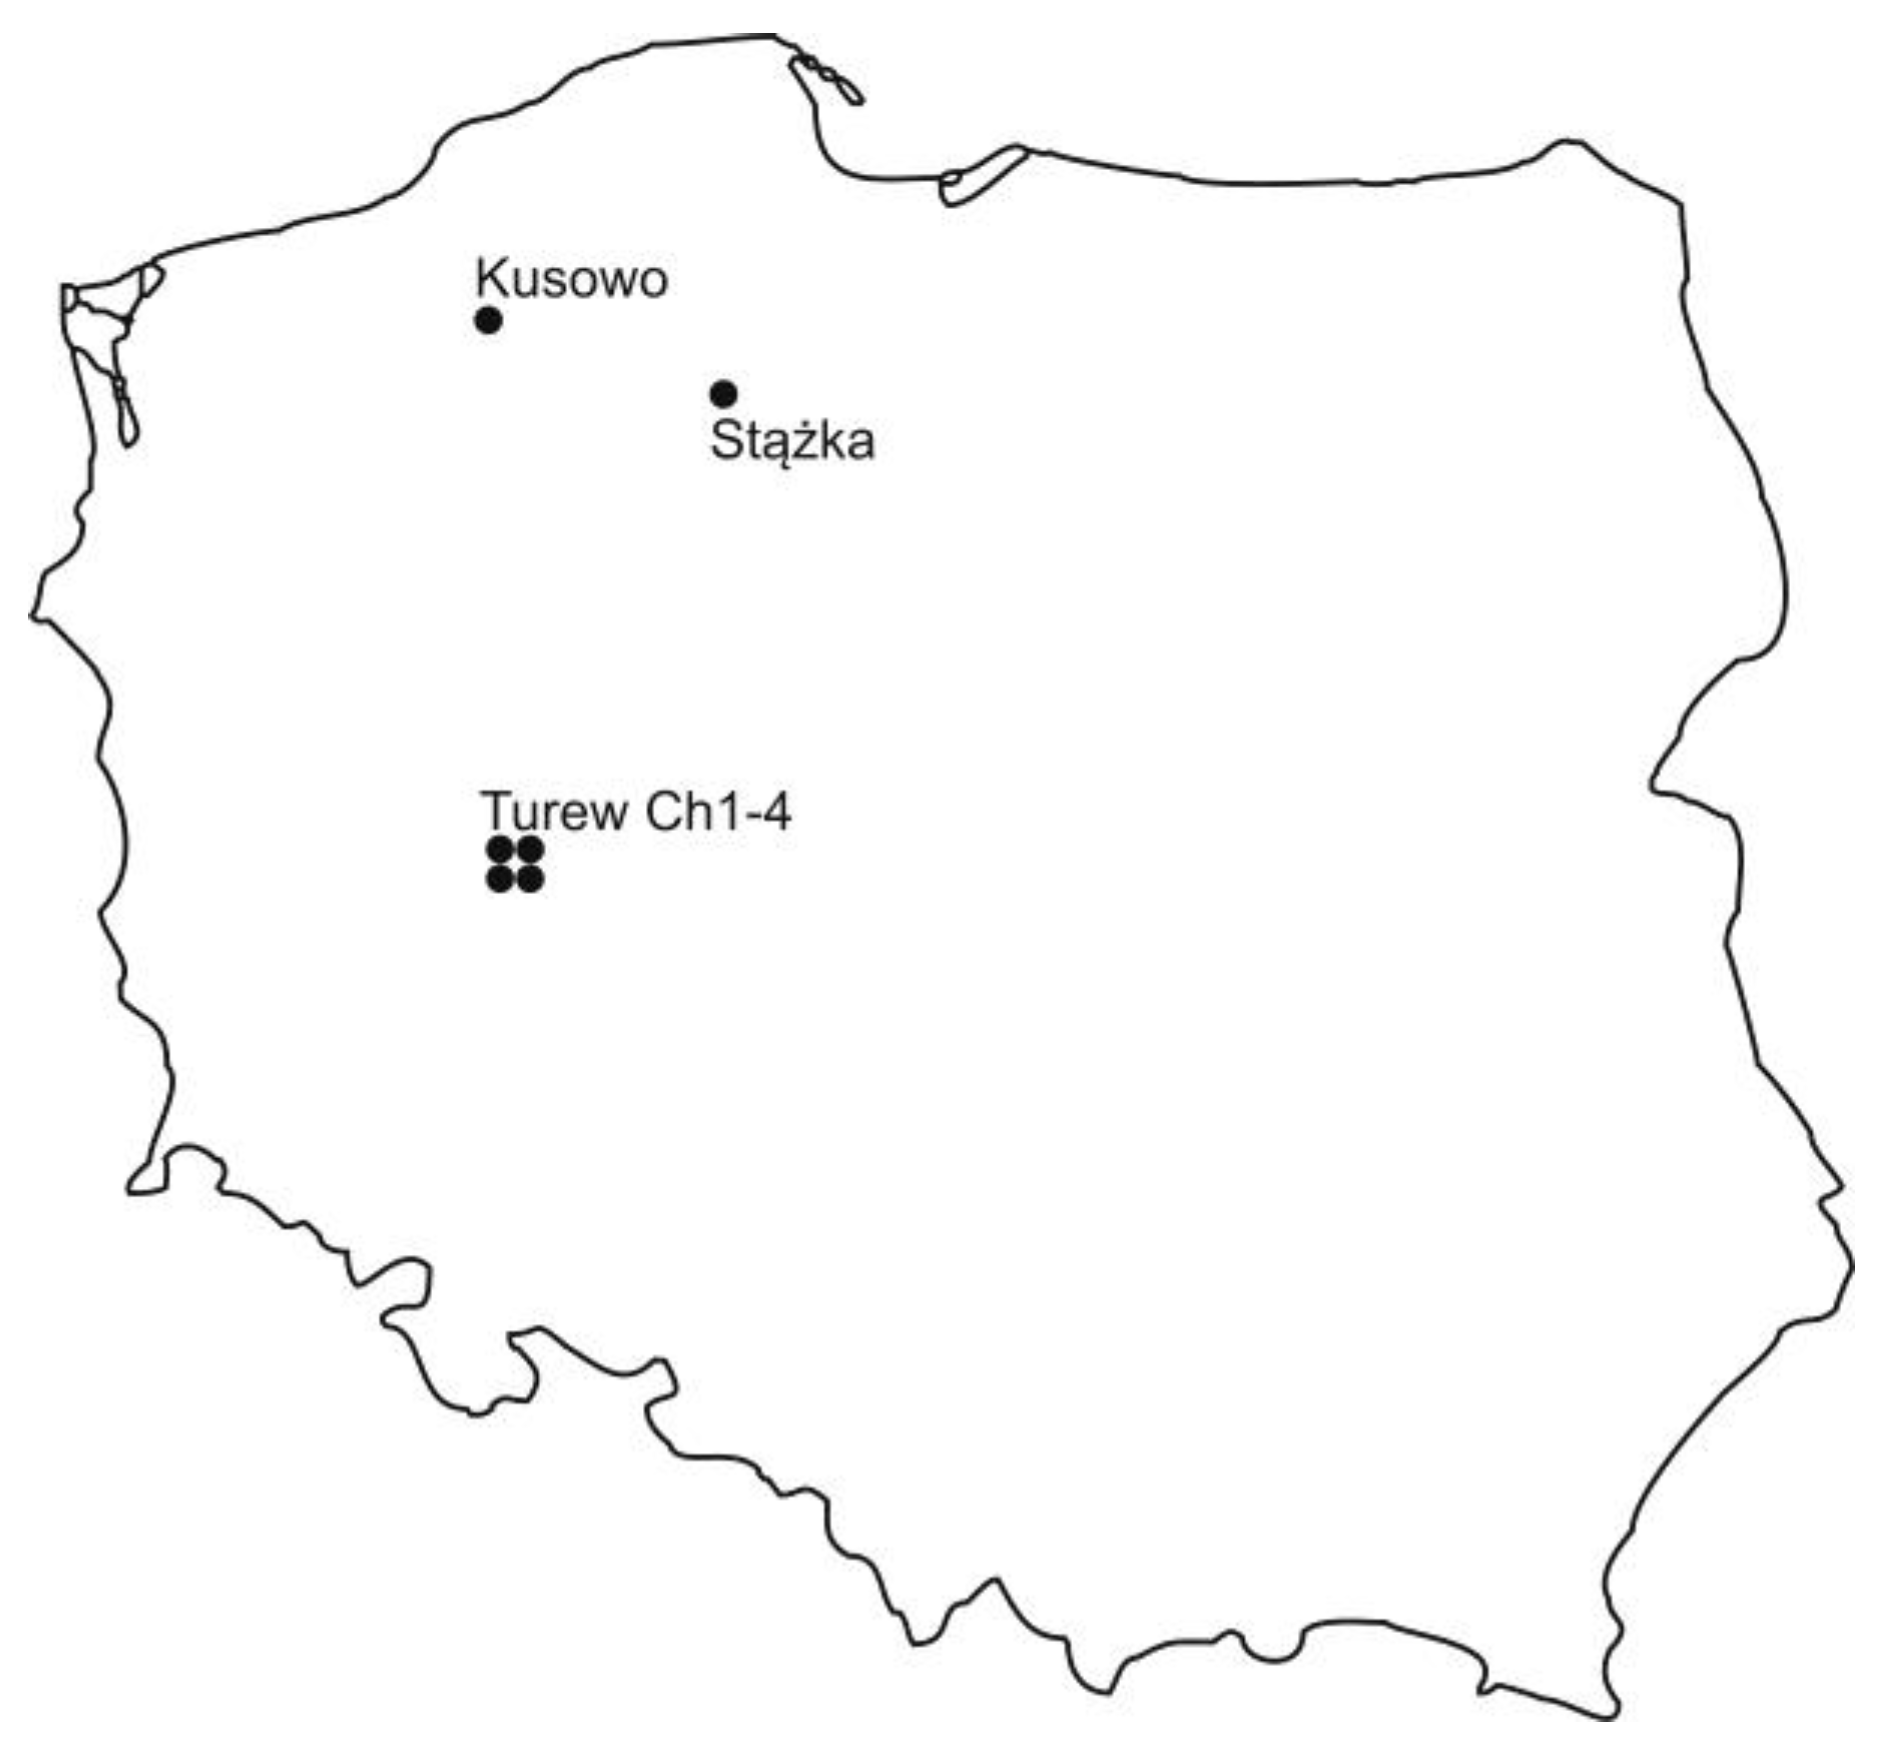
2.1. Study Sites
2.2. Collection of Smples (WRB classification 2015)
- (a)
- Baltic-type raised bog (Kusowo)
- (b)
- fen (Stążka)
- (c)
- peat-moorsh soils: Ch1, Ch2, Ch3, and Ch4 (Turew)
2.3. Organic Carbon, Nitrogen, C/N, and Degree of Decomposition
2.4. Extraction and Purification of HAs
2.5. Elemental Composition
2.6. VIS-Spectroscopy of HAs
2.7. Electron Paramagnetic Resonance of HAs
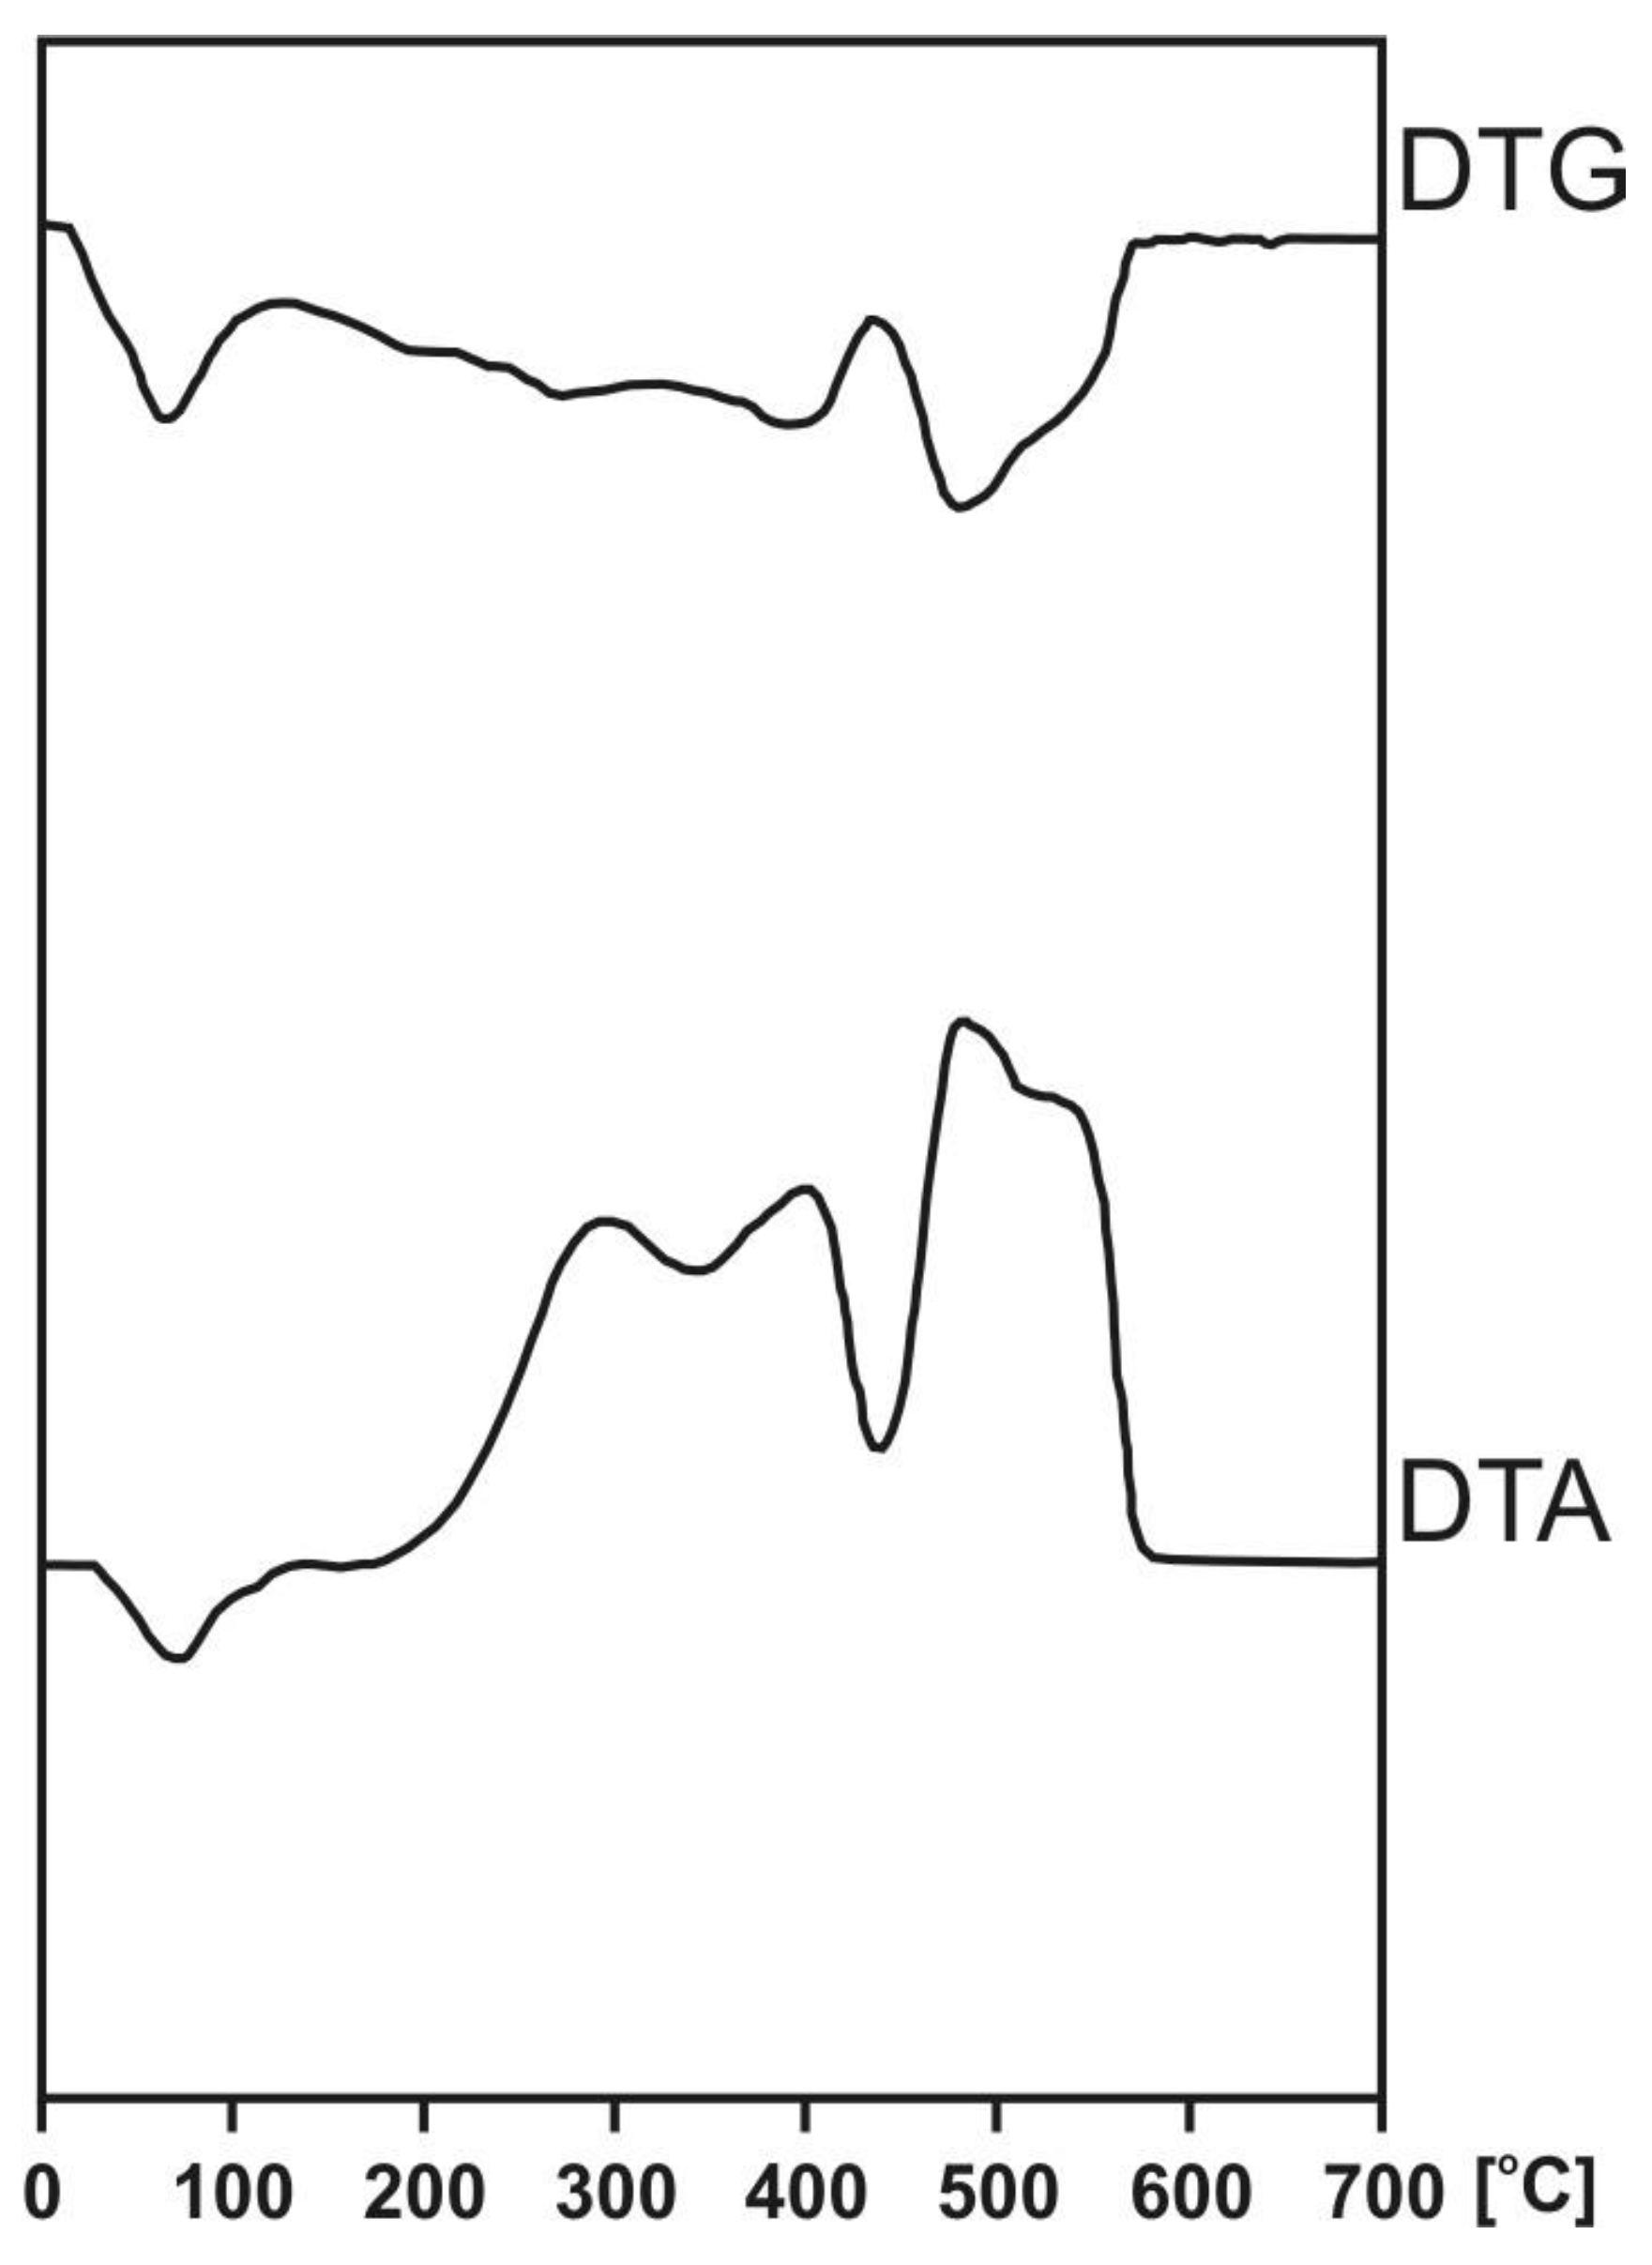
2.8. Differential Thermal Analysis of HAs
2.9. Statistical Analysis
3. Results and Discussion
3.1. Characteristics of Peats
3.1.1. Decomposition Degree, Carbon, Nitrogen, and C/N Ratio of Peat Soils
Decomposition Degree
TOC
CHWE
C/N
3.2. Analytical Data of HAs
3.2.1. Elemental Composition of HAs
3.2.2. VIS spectra of HAs
3.2.3. Electron paramagnetic resonance of HAs
3.2.4. Thermal Properties of HAs
3.2.5. PCA Analysis
4. Conclusions
Author Contributions
Funding
Acknowledgments
Conflicts of Interest
References
- Lappalainen, E. Global Peat Resources; International Peat Society–Geological Survey of Finland, Saarijärven Offset Oy: Saarijärvi, Finland, 1996. [Google Scholar]
- Okruszko, H. The principles of the identification and classification of hydrogenic soils according to the need of reclamation. Bibl. Wiad. IMUZ. 1976, 52, 7–53. [Google Scholar]
- Gorham, E. Northern Peatlands: Role in the Carbon Cycle and Probable Responses to Climatic Warming. Ecol. Appl. 1991, 1, 182–195. [Google Scholar] [CrossRef] [PubMed]
- Johnson, L.; Damman, A.W. Decay and its regulation in Sphagnum peatlands. Adv. Bryolog. 1993, 5, 249–296. [Google Scholar]
- Belyea, L.R. Separating the effects of litter quality and microenvironment on decomposition rates in a patterned peatland. Oikos 1996, 77, 529. [Google Scholar] [CrossRef]
- Clymo, R.S.; Turunen, J.; Tolonen, K. Carbon Accumulation in Peatland. Oikos 1998, 81, 368. [Google Scholar] [CrossRef] [Green Version]
- Bambalov, N. Regularities of peat soils anthropic evolution. Acta Agroph. 2000, 26, 179–203. [Google Scholar]
- Bridgham, S.D.; Richardson, C.J. Endogenous versus exogenous nutrient control over decomposition and mineralization in North Carolina peatlands. Biogeochemistry 2003, 65, 151–178. [Google Scholar] [CrossRef]
- Bragazza, L.; Siffi, C.; Iacumin, P.; Gerdol, R. Mass loss and nutrient release during litter decay in peatland: The role of microbial adaptability to litter chemistry. Soil Biol. Biochem. 2007, 39, 257–267. [Google Scholar] [CrossRef]
- Gierlach-Hładoń, T.; Szajdak, L. Physicochemical properties of humic acids isolated from an Eriophorum Sphagnum raised bog. In Mires and Peat; Kļavinš, M., Ed.; University of Latvia Press: Riga, Latvia, 2010; pp. 143–157. [Google Scholar]
- Lindsay, R. Peatland Classification. In The Wetland Book. I: Structure and Function, Management, and Methods; Finlayson, M.C., Everard, M., Irvine, K., McInnes, R.J., Middleton, B.A., van Dam, A.A., Davidson, N.C., Eds.; Springer: Dordrecht, The Netherlands, 2018; pp. 1515–1528. [Google Scholar]
- Joosten, H.; Clarke, D. Wise Use of Mires and Peatlands–Background and Principles Including a Framework for Decision-Making; International Mire Conservation Group and International Peat Society: Saarijärvi, Finland, 2002. [Google Scholar]
- Szajdak, L.W.; Szatylowicz, J.; Kõlli, R. Peat and peatlands, physical properties. In Encyclopedia of Agrophysics, Encyclopedia of Earth Sciences; Gliński, J., Horabik, J., Lipiec, J., Eds.; Springer: Berlin, Germany, 2011; pp. 551–555. [Google Scholar]
- Joosten, H.; Tanneberger, F.; Moen, A. Mires and Peatlands of Europe: Status, Distribution and Conservation; Schweizerbart Science Publishers: Stuttgart, Germany, 2017. [Google Scholar]
- Säurich, A.; Tiemayer, B.; Don, A.; Fiedler, S.; Bechtold, M.; Wulf Amelung, W.; Freibauer, A. Drained organic soils under agriculture—The more degraded the soil the higher the specific basal respiration. Geoderma 2019, 355, 11391. [Google Scholar] [CrossRef]
- Clarke, D.; Rieley, J. Strategy for Responsible Peatlands Management; International Peat Society: Jyväskylä, Finland, 2019. [Google Scholar]
- Armentado, T.V.; Menges, E.S. Patterns of change in the carbon balance of organic soil-wetlands of the temperate zone. Ecology 1986, 74, 755–774. [Google Scholar] [CrossRef]
- Bouwman, A.F. Exchange of greenhouse gases between terrestrial ecosystems and the atmosphere. In Soils and the Greenhouse Effect; John Willey and Sons: Chichester, UK, 1990; pp. 61–129. [Google Scholar]
- Terry, R.E. Nitrogen transformations in Histosols. In The Role of Organic Matter in Modern Agriculture; Chen, Y., Avnimelech, Y., Eds.; Martinus Nijhoff Publishers: Leiden, The Netherlands, 1986; pp. 55–69. [Google Scholar]
- Nieder, R.; Benbi, D.K.; Isermann, K. Soil organic matter dynamics. In Handbook of Processes and Modeling in the Soil-Plant System; Benbi, D.K., Nieder, R., Eds.; Food Products Press: New York, NY, USA, 2003; pp. 345–408. [Google Scholar]
- Joosten, H. Peatlands, Climate Change Mitigation and Biodiversity Conservation; Nordic Council of Minister: Copenhagen, Denmark, 2015. [Google Scholar]
- Ilnicki, P. Peatlands and Peat; Wydawnictwo AR: Poznań, Poland, 2002. [Google Scholar]
- Oleszczuk, R.; Regina, K.; Szajdak, L.; Maryganova, V. Impacts of Agricultural Utilization of Peat—Soil on the Greenhouse Gas Balance. In Peatlands and Climate Change; Strack, M., Ed.; International Peat Society, Saarijärven Offset Oy: Saarijärvi, Finland, 2008; pp. 70–97. [Google Scholar]
- Laine, J.; Vanha-Majamaa, I. Vegetation ecology along a trophic gradient on drained pine mires in southern Finland. Ann. Bot. Fen. 1992, 29, 213–233. [Google Scholar]
- Laine, J.; Vasander, H.; Laiho, R. Long-term effects of water level drawdown on the vegetation of drained pine mires in southern Finland. J. App. Ecol. 1995, 32, 785–802. [Google Scholar]
- Vasander, H. Effect of forest amelioration on diversity in an ombrotrophic bog. Ann. Bot. Fen. 1984, 21, 7–15. [Google Scholar]
- Mälson, K.; Backéus, I.; Rydin, H. Long-term effects of drainage and initial effects of hydrological restoration on rich fen vegetation. App. Veg. Sci. 2008, 11, 99–106. [Google Scholar] [CrossRef]
- Similä, M.; Aapala, K.; Penttinen, J. Ecological Restoration in Drained Peatlands—Best Practices from Finland; Natural Heritage Services: Vantaa, Finland, 2014. [Google Scholar]
- Maslov, B.S.; Konstantinov, V.K.; Babikov, B.V.; Ahti, E. Permanent Experiments on Drained Peatlands in Russia; Finish Forest Research Institute: Vantaa, Finland, 2006. [Google Scholar]
- Mäkilä, M. The sufficiency of peat for energy use on the basis of carbon accumulation. In Geoscience for Society 125th Anniversary Volume; Geological Survey of Finland: Espoo, Finland, 2011; Volume 49, pp. 163–170. [Google Scholar]
- Schipper, L.A.; McLeod, M. Subsidence rates and carbon loss in peat soils following conversion to pasture in the Waikato region, New Zealand. Soil Use Manag. 2002, 18, 91–93. [Google Scholar] [CrossRef]
- Minkkinen, K.; Laine, J. Long-term effect of forest drainage on the peat carbon stores of pine mires in Finland. Can. For. Res. 1998, 28, 1267–1275. [Google Scholar] [CrossRef]
- Lucchese, M.; Waddington, J.M.; Poulin, M.; Pouliot, R.; Rochefort, L.; Strack, M. Organic matter accumulation in a restored peatland: Evaluating restoration success. Ecol. Eng. 2010, 36, 482–488. [Google Scholar] [CrossRef]
- Gawlik, J. Division of differently silted peat formation into classes according to their state of secondary transformations. Acta Agroph. 2000, 26, 17–24. [Google Scholar]
- Chason, D.B.; Siegel, D.I. Hydraulic conductivity and related properties of peat, Lost River Peatland, northern Minnesota. Soil Sci. 1986, 142, 91–99. [Google Scholar] [CrossRef]
- Beckwith, C.W.; Baird, A.J.; Heathwaite, A.L. Anisotropy and depth-related heterogeneity of hydraulic conductivity in a bog peat. I: Laboratory measurements. Hydrol. Process. 2003, 17, 89–101. [Google Scholar] [CrossRef]
- Sokołowska, Z.; Szajdak, L.; Matyka-Sarzyńska, D. Impact of the degree of secondary transformation on acid–base properties of organic compounds in mucks. Geoderma 2005, 127, 80–90. [Google Scholar] [CrossRef]
- Szajdak, L.; Szatyłowicz, J. Impact of drainage on hydrophobicity of fen peat-peat-morsh soils. In Mires and Peat; Kļavinš, M., Ed.; University of Latvia Press: Riga, Latvia, 2010; pp. 158–174. [Google Scholar]
- Okruszko, H.; Ilnicki, P. The moorsh horizons as quality indicators of reclaimed organic soils. In Organic Soils and Peat Materials for Sustainable Agriculture; Parent, L.-E., Ilnicki, P., Eds.; CRC Press: Boca Raton, FL, USA, 2003; pp. 12–25. [Google Scholar]
- Ilnicki, P.; Szajdak, L.W. Peatland Disappearance; Ilnicki, P., Szajdak, L.W., Eds.; PTPN: Poznań, Poland, 2016. [Google Scholar]
- Schnitzer, M. Water retention by humic substances. In Peat and Water. Aspects of Water Retention and Dewatering in Peat; Fuchsman, C.H., Ed.; Elsevier Applied Science Publishers Ltd.: Amsterdam, The Netherlands, 1986; pp. 159–176. [Google Scholar]
- Brandyk, T.; Szatyłowicz, J.; Oleszczuk, R.; Gnatowski, T. Water-related physical attributes of organic soils. In Organic Soils and Peat Materials for Sustainable Agriculture; Parent, L.-E., Ilnicki, P., Eds.; CRC Press: Boca Raton, FL, USA, 2002; pp. 33–66. [Google Scholar]
- Brandyk, T.; Oleszczuk, T.; Szatyłowicz, J. Investigation of soil water dynamics in a fen peat-moorsh soil profile. Int. Peat J. 2001, 11, 15–24. [Google Scholar]
- Grootjans, A.P.; Schipper, P.C.; van der Windt, H.J. Influence of drainage on N-mineralization and vegetation response in wet meadows. II. Cirsio-Molinietum stands. Oecology Plant 1986, 7, 3–14. [Google Scholar]
- Kwak, J.C.; Ayub, A.L.; Shepard, J.D. The role of colloid science in peat dewatering: Principles and dewatering studies. In Peat and water; Fuchsman, C.H., Ed.; Elsevier Applied Science Publishers: London, UK, 1986; pp. 95–118. [Google Scholar]
- Lüttig, G. Plants to peat. In Peat and Water; Fuchsman, C.H., Ed.; Elsevier Applied Science Publishers: London, UK, 1996; pp. 9–19. [Google Scholar]
- Inisheva, L.I.; Dementieva, T.V. Mineralization rate of organic matter in peats. Pochvovedenie 2000, 2, 196–203. [Google Scholar]
- Koeselman, W.; Verhoeven, J.T.A. Eutrophication of fen ecosystems: External and internal nutrient sources and restoration strategies. In Restoration of Temperate Wetlands; Wheeler, B.D., Show, S.C., Fojt, W.J., Robertson, R.A., Eds.; Willey: Chichester, UK, 1995; pp. 91–112. [Google Scholar]
- Kajak, A.; Okruszko, H. Grasslands on drained peats in Poland. In Ecosystems of the world 17A: Managed Grasslands; Breymeyer, A.I., Ed.; Elsevier Sc. Publ.: Amsterdam, The Netherlands, 1990; pp. 213–253. [Google Scholar]
- Van Diggelen, R.; Molenaar, W.J.; Kooijman, A.M. Vegetation succession in a floating mire in reaction to management and hydrology. J. Veg. Sci. 1996, 7, 809–820. [Google Scholar]
- Kotowski, W.; Fen Communities. Ecological Mechanisms and Conservation Strategies. Ph.D. Thesis, University of Groningen, Groningen, The Netherlands, 2002. [Google Scholar]
- Szajdak, L.; Matuszewska, T.; Gawlik, J. Effect of secondary transformation state of peat-muck soils on total amino acid content. Inter. Peat J. 1998, 8, 76–80. [Google Scholar]
- Van Dijk, H. Colloid chemical properties of humic matter. In Soil Biochemistry; McLaren, A.D., Skujins, J., Eds.; Marcel Dekker: New York, NY, USA, 1971; p. 21. [Google Scholar]
- Lamentowicz, M.; Tobolski, K.; Mitchell, E.A.D. Palaeoecological evidence for anthropogenic acidification of a kettle-hole peatland in northern Poland. Holocene 2007, 17, 1185–1196. [Google Scholar] [CrossRef]
- Ellenberg, H. Vegetation Ecology of Central Europe, 4th ed.; Cambridge University Press: Cambridge, UK, 1988. [Google Scholar]
- Cedro, A.; Sotek, Z. Natural and Anthropogenic Transformations of A Baltic Raised Bog (Bagno Kusowo, North West Poland) in the light of dendrochronological analysis of Pinus sylvestris L. Forests 2016, 7, 202–216. [Google Scholar] [CrossRef] [Green Version]
- IUSS Working Group WRB. World Reference Base for Soil Resources 2014, Update 2015 International Soil Classification System for Naming Soils and Creating Legends for Soil Maps; World Soil Resources Reports No. 106: Rome, Italy, 2015. [Google Scholar]
- Szajdak, L.W.; Gaca, W. Nitrate reductase activity in soil under shelterbelt and an adjoining cultivated field. Chem. Ecol. 2010, 26, 123–134. [Google Scholar] [CrossRef]
- von Post, L. Sveriges Geologiska Undersöknings torvinventering och några av dess hitills vunna resultat. Sven. Mosskulturföreningens Tidsk. 1922, 36, 1–27. [Google Scholar]
- Gałka, M.; Tobolski, K.; Górska, A.; Milecka, K.; Fiałkiewicz-Kozieł, B.; Lamentowicz, M. Disentangling the drivers for the development of a Baltic bog during the Little Ice Age in northern Poland. Quatern. Int. 2014, 329, 323–327. [Google Scholar] [CrossRef]
- Swift, R.S. Organic matter characterization. In Methods of Soil Analysis, Part 3: Chemical Methods; Sparks, D.L., Ed.; American Society of Agronomy, Inc.: Madison, WI, USA, 1996; pp. 1011–1106. [Google Scholar]
- Österberg, R.; Szajdak, L.; Mortensen, K. Temperature-dependent restructuring of fractal humic acids: A proton-dependent process. Environ. Int. 1994, 20, 77–80. [Google Scholar] [CrossRef]
- Chen, Y.; Senesi, N.; Schnitzer, M. Information Provided on Humic Substances by E4/E6 Ratios. Soil Sci. Soc. Am. J. 1977, 41, 352. [Google Scholar] [CrossRef]
- Jezierski, A.; Czechowski, F.; Jerzykiewicz, M.; Drozd, J. EPR investigations of structure of humic acids from compost, soil, peat and soft brown coal upon oxidation and metal uptake. Appl. Magn. Reason 2000, 18, 127–136. [Google Scholar] [CrossRef]
- Gołębiowska, D.; Ptak, W.; Wegner, K. Correlation between derivatographic and chemiluminescence analysis data in relation to elemental composition of humic acids. Environ. Int. 1996, 22, 495–500. [Google Scholar] [CrossRef]
- Schnitzer, M.; Levesque, M. Electron spin resonance as a guide to the degree of humification of peats. Soil Sci. 1979, 127, 140–145. [Google Scholar]
- Boelter, D.H. Physical properties of peats as related to degree of decomposition. Soil Sci Soc. Am. Proc. 1969, 33, 606–609. [Google Scholar] [CrossRef]
- Klavins, M.; Sire, J.; Purmalis, O.; Melecis, V. Approaches to estimating humification indicators for peat. Mires Peat 2008, 3, 1–15. [Google Scholar]
- Harworth, R.D. The chemical nature of humic acid. Soil Sci. 1971, 106, 188–192. [Google Scholar]
- Benavides, J.C. The effect of drainage on organic matter accumulation and plant communities of high-altitude peatlands in the Colombian tropical Andes. Mires Peat 2014, 15, 1–15. [Google Scholar]
- Batjes, N.H. Total carbon and nitrogen in the soils of the world. Euro Soil Sci. 2014, 65, 10–21. [Google Scholar] [CrossRef]
- Chambers, F.M.; Beilman, D.W.; Yu, Z. Methods for determining peat humification and for quantifying peat bulk density, organic matter and carbon content for palaeostudies of climate and peatland carbon dynamics. Mires Peat 2010, 7, 1–10. [Google Scholar]
- Fontaine, S.; Barot, S.; Barré, P.; Bdioui, N.; Mary, B.; Rumpel, C. Stability of organic carbon in deep soil layers controlled by fresh carbon supply. Nature 2007, 450, 277–280. [Google Scholar] [CrossRef]
- Wang, M.; Moore, T.R.; Talbot, J.; Riley, J.L. The stoichiometry of carbon and nutrients in peat formation. Global Biogeochem. Cy. 2015, 29, 113–121. [Google Scholar] [CrossRef]
- Smolander, A.; Kitunen, V. Soil microbial activities and characteristics of dissolved organic C and N in relation to tree species. Soil Biol. Biochem. 2002, 34, 651–660. [Google Scholar] [CrossRef]
- Kolka, R.; Weishampel, P.; Fröberg, M. Measurement and importance of dissolved organic carbon. In Field Measurements for Forest Carbon Monitoring; A Landscape-Scale Approach; Hoover, C.M., Ed.; Springer: Dordrecht, The Netherlands, 2008; pp. 171–176. [Google Scholar]
- Freeman, C.; Fenner, N.; Ostle, N.J.; Kang, H.D.; Dowrick, J.; Reynolds, B.M.; Lock, M.A.; Sleep, D.; Hughes, S.; Hudson, J. Export of dissolved organic carbon from peatlands under elevated carbon dioxide levels. Nature 2004, 430, 195–198. [Google Scholar] [CrossRef]
- Szajdak, L.; Szczepański, M.; Bogacz, A. Impact of secondary transformation of peat-moorsh soils on the decrease of nitrogen and carbon compounds in ground water. Agr. Res. 2007, 5, 189–200. [Google Scholar]
- Biester, H.; Knorr, K.-H.; Schellekens, J.; Basler, J.; Hermanns, Y.-M. Comparison of different methods to determine the degree of peat decomposition in peat bogs. Biogeosciences 2014, 11, 2691–2707. [Google Scholar] [CrossRef] [Green Version]
- Szajdak, L. Chemical properties of peat. In Peatlands and Peat; Ilnicki, P., Ed.; Wydawnictwo AR: Poznań, Poland, 2002; pp. 432–450. [Google Scholar]
- Anderson, D.E. Carbon accumulation and C/N ratios of peat bogs in North-West Scotland. Scot. Geogr. J. 2002, 118, 323–341. [Google Scholar]
- Rezanezhad, F.; William, J.S.P.; Quinton, L.; Lennartz, B.; Milojevic, T.; Van Cappellen, P. Structure of peat soils and implications for water storage, flow and solute transport: A review update for geochemists. Chem. Geol. 2016, 429, 75–84. [Google Scholar] [CrossRef]
- Malmer, N.; Holm, E. Variation in the C/N-quotient of peat in relation to decomposition rate and age determination with 210 pb. Oikos 1984, 43, 171–182. [Google Scholar] [CrossRef]
- Kuhry, P.; Vitt, D.H. Fossil carbon/nitrogen ratios as a measure of peat decomposition. Ecology. 1996, 77, 271–275. [Google Scholar] [CrossRef]
- Broder, T.; Blodau, C.; Biester, H.; Knorr, K.H. Peat decomposition records in three pristine ombrotrophic bogs in southern Patagonia. Biogeosciences 2012, 9, 1479–1491. [Google Scholar] [CrossRef] [Green Version]
- Rice, J.A.; MacCarthy, P. Statistical evaluation of the elemental composition of humic substances. Org. Geochem. 1991, 7, 635–648. [Google Scholar] [CrossRef]
- DiDonato, N.; Chen, H.; Waggoner, D.; Hatcher, P.G. Potential origin and formation for molecular components of humic acids in soils. Geochim. Cosmochim. Acta 2016, 178, 210–222. [Google Scholar] [CrossRef] [Green Version]
- Van Krevelen, D. Graphical statistical method for the study of structure and reaction processes of coal. Fuel 1950, 29, 269–284. [Google Scholar]
- Schnitzer, M. Humic Substances: Chemistry and Reactions. In Soil Organic Matter; Schnitzer, M., Khan, S.U., Eds.; Elsevier: Amsterdam, The Netherlands, 1978; pp. 1–64. [Google Scholar]
- Stevenson, F.J. Humus Chemistry: Genesis, Composition, Reactions, 2nd ed.; Wiley & Sons: New York, NY, USA, 1994; p. 512. [Google Scholar]
- Kalbitz, K.; Geyer, W.; Geyer, S. Spectroscopic properties of dissolved humic substances a reflection of land use history in a fen area. Biogeochemistry 1999, 47, 219–238. [Google Scholar] [CrossRef]
- Zaccone, C.; Miano, T.M.; Shotyk, W. Qualitative comparison between raw peat and related humic acids in an ombrotrophic bog profile. Org. Geochem. 2007, 38, 151–160. [Google Scholar] [CrossRef]
- Kļaviņš, M.; Sire, J. Variations of humic acid properties within peat profiles. In Mires and Peat; Kļaviņš, M., Ed.; University of Latvia Press: Riga, Latvia, 2010; pp. 175–197. [Google Scholar]
- Czechowski, F.; Jezierski, A. EPR studies on petrographic constituents of bituminous coals chars of brown coals group components, and humic acids 600 °C char upon oxygen and solvent action. Energy Fuels 1997, 11, 951–964. [Google Scholar] [CrossRef]
- Knüpling, M.; Tiörring, J.T.; Un, S. The relationship between the molecular structure of semiquinone radicals and their g-values. Chem. Phys. 1997, 219, 291–304. [Google Scholar] [CrossRef]
- Witwicki, M.; Jezierska, J. Protonated o-semiquinone radical as a mimetic of the humic acids native radicals: A DFT approach to the molecular structure and EPR properties. Geochim. Cosmochim. Acta 2012, 86, 384–391. [Google Scholar] [CrossRef]
- Gonet, S.S.; Cieślewicz, J. Differential thermal analysis of sedimentary humic acids in the light of their origin. Environ. Int. 1988, 24, 629–636. [Google Scholar] [CrossRef]
- Dell’Abate, M.T.; Benedetti, A.; Brookes, P.C. Hyphenated techniques of thermal analysis for characterisation of soil humic substances. J. Seph. Sci. 2003, 26, 433–440. [Google Scholar] [CrossRef]
- Purmalis, O.; Porsnovs, D.; Klavins, M. Differential Thermal Analysis of Peat and Peat Humic Acids. Mat. Sci. Appl. Chem. 2011, 24, 89–94. [Google Scholar] [CrossRef]
- Schnitzer, M.; Turner, R.C.; Hoffman, I.A. Thermogravimetric study of organic matter of representative canadian podzol soils. Can. J. Soil Sci. 1964, 44, 7–13. [Google Scholar] [CrossRef] [Green Version]
- Kodama, H.; Schnitzer, M. Kinetics and mechanism of the thermal decomposition of fulvic acids. Soil Sci. 1970, 109, 265–271. [Google Scholar] [CrossRef]
- Shurygina, E.A.; Larina, N.K.; Chubarova, M.A.; Kononova, M.M. Differential thermal analysis (DTA) and thermogravimetry (TG) of soil humus substances. Geoderma 1971, 6, 169–177. [Google Scholar] [CrossRef]
- Leinweber, P.; Schulten, H.-R. Differential thermal analysis, thermogravimetry and in-source pyrolysis-mass spectrometry studies on the formation of soil organic matter. Thermochim. Acta 1992, 200, 151–167. [Google Scholar] [CrossRef]
- Naucke, W. Die Untersuchung des Naturstiffe Torf und seiner Inhaltstoffe. Chemi. App. 1968, 261–280. [Google Scholar]
- Naucke, W. Möglichkeiten zur Analyse von Torfinhaltstoffen mit Physikalisch-Chemischen Methoden. 4; Torf-Kolloquium DDR-VR Polen: Rostock, Germany, 1968. [Google Scholar]
- Plante, A.F.; Fernández, J.M.; Leifeld, J. Application of thermal analysis techniques in soil science. Geoderma 2009, 153, 1–10. [Google Scholar] [CrossRef]
- Francioso, O.; Montecchio, D.; Gioacchini, P.; Cavani, L.; Ciavatta, C.; Trubetskoj, O.; Trybetskaja, O. Thermal analysis (TG–DTA) and isotopic characterization (13C–15N) of humic acids from different origins. Appl. Geochem. 2005, 20, 537–544. [Google Scholar] [CrossRef]
Sample Availability: Samples of compound 1 are available from the authors. |


| Sampling Site | GPS | Classification of Peat (WRB 2015) | Depth (cm) | Type of Peat Based on Macrofossil Analysis | Degree of Decomposition (Von Post) | TOC (g kg−1) | CWHE (g kg−1) | N-total (g kg−1) | C/N | |
|---|---|---|---|---|---|---|---|---|---|---|
| Baltic-type raised bog | Kusowo | 53° 48′ 07.83″ N 16° 32′ 42.03″ E | Ombric Hemic Fibric Histosols (Dystric) | 0–25 | Sphagnum | H2 | 570.05 ± 24.83 | 15.42 ± 1.59 | 12.69 ± 1.53 | 44.92 ± 5.37 |
| 25–50 | Cotton grass-Sphagnum | H3/H4 | 575.66 ± 31.34 | 12.51 ± 1.31 | 10.83 ± 0.94 | 53.15 ± 7.30 | ||||
| 50–75 | Sphagnum, cotton grass-Sphagnum | H3 | 590.44 ± 36.83 | 12.43 ± 0.38 | 9.80 ± 0.75 | 60.25 ± 8.86 | ||||
| 75–100 | Cotton grass-Sphagnum | H4/H5 | 596.56 ± 23.60 | 11.50 ± 1.03 | 9.42 ± 0.61 | 63.33 ± 7.51 | ||||
| Fen | Stążka | 53° 36′ 17.58″ N 17° 57′ 20.38″ E | Ombric Hemic Fibric Histosols (Dystric Lignic) | 0–25 | Sedge-Hypnum | H3 | 501.94 ± 37.17 | 12.49 ± 2.29 | 20.01 ± 1.26 | 25.08 ± 4.30 |
| 50–75 | Sedge-Hypnum | H4 | 557.51 ± 47.54 | 5.39 ± 0.72 | 18.75 ± 2.23 | 29.73 ± 5.78 | ||||
| 75–100 | Sedge | H5 | 581.50 ± 42.23 | 5.41 ± 0.47 | 18.11 ± 2.51 | 32.11 ± 6.57 | ||||
| Peat-moorsh soils, Turew | Ch1 | 52° 01′ 35.45″ N 16° 52′ 34.80″ E | Rheic Murshic Sapric Histosols (Limnic Dystric) | 0–25 | Moorsh soil | H8 | 294.04 ± 31.96 | 8.81 ± 0.64 | 19.19 ± 3.73 | 15.32 ± 3.19 |
| 25–50 | Sedge | H8 | 445.85 ± 35.80 | 7.80 ± 0.48 | 24.38 ± 1.71 | 18.29 ± 2.51 | ||||
| 50–75 | Sedge | H7 | 498.20 ± 33.03 | 6.09 ± 0.64 | 26.66 ± 1.49 | 18.69 ± 2.16 | ||||
| 75–100 | Sedge | H7 | 496.60 ± 43.24 | 5.79 ± 0.44 | 25.62 ± 1.45 | 19.38 ± 2.25 | ||||
| Ch2 | 52° 02′ 21.70″ N 16° 51′ 09.50″ E | Rheic Murshic Sapric Histosols (Lignic) | 0–25 | Moorsh soil | H8 | 395.39 ± 35.77 | 15.89 ± 1.25 | 31.03 ± 1.65 | 12.74 ± 2.72 | |
| 25–50 | Alder swamp | H8 | 455.81 ± 45.72 | 10.15 ± 0.89 | 27.66 ± 2.84 | 16.48 ± 2.40 | ||||
| 50–75 | Sedge | H8 | 497.46 ± 31.90 | 7.27 ± 0.70 | 24.86 ± 2.18 | 20.01 ± 2.67 | ||||
| 75–100 | Sedge | H8 | 496.11 ± 47.08 | 5.06 ± 0.53 | 21.69 ± 2.39 | 22.87 ± 2.16 | ||||
| Ch3 | 52° 00′ 57.50″ N 16° 53′ 49.75″ E | Rheic Sapric Dystric Histosols (Calcic Limnic) | 0–25 | Moorsh soil | H8 | 246.63 ± 21.40 | 7.62 ± 1.45 | 19.51 ± 2.23 | 12.64 ± 2.10 | |
| 50–75 | Alder swamp | H8 | 466.20 ± 32.60 | 7.48 ± 0.97 | 24.50 ± 2.30 | 19.03 ± 3.55 | ||||
| 75–100 | Sedge with wooden | H8 | 484.90 ± 32.20 | 5.74 ± 0.68 | 23.97 ± 1.52 | 20.23 ± 3.13 | ||||
| Ch4 | 52° 01′ 12.61″ N 16° 53′ 23.38″ E | Rheic Sapric Dystric Histosols (Limnic Lignic) | 0–25 | Moorsh soil | H7 | 370.90 ± 33.70 | 11.58 ± 0.91 | 24.81 ± 3.86 | 14.95 ± 2.76 | |
| 50–75 | Sedge | H8 | 471.21 ± 31.04 | 8.75 ± 0.82 | 25.83 ± 2.01 | 18.24 ± 2.53 | ||||
| 75–100 | Sedge | H8 | 488.46 ± 31.70 | 7.28 ± 0.69 | 25.02 ± 1.14 | 19.52 ± 2.03 | ||||
| Sampling Site | Year | |||||||||||
|---|---|---|---|---|---|---|---|---|---|---|---|---|
| 2009 | 2010 | 2011 | 2012 | 2013 | 2014 | 2015 | 2016 | 2017 | 2018 | 2019 | Average | |
| Peat-moorsh soils Ch1-4 Turew | 576.0 | 698.1 | 460.6 | 534.5 | 552.3 | 410.2 | 485.7 | 793.3 | 565.9 | 425.8 | 429.9 | 539.3 |
| Baltic-type raised bog Kusowo | 754.2 | 938.9 | 673.8 | 758.4 | 643.0 | 661.9 | 630.5 | 837.9 | 1092.2 | 647.1 | 723.4 | 760.1 |
| Fen Stążka | 556.0 | 835.6 | 487.4 | 652.9 | 510.0 | 472.0 | 485.4 | 701.0 | 885.1 | 456.0 | 546.0 | 598.9 |
| Depth [cm] | Age 14C Date | Calibrated Range 95.4% | BC/AD |
|---|---|---|---|
| 9–10 | 106.87 ± 0.33 pMC | 1694–1919 | AD |
| 16–17 | 111.4 ± 0.36 pMC | 1692–1919 | AD |
| 33–34 | 80 ± 30 BP | 1690–1926 | AD |
| 53–54 | 40 ± 40 BP | 1690–1925 | AD |
| 65–66 | 310 ± 30 BP | 1485–1650 | AD |
| 76–77 | 375 ± 30 BP | 1446–1633 | AD |
| 90–91 | 550 ± 30 BP | 1310–1435 | AD |
| 98–99 | 555 ± 30 BP | 1310–1431 | AD |
| Depth (cm) | Age 14C Date | Calibrated Range 95.4% | BC/AD |
|---|---|---|---|
| 12–13 | 120.43 ± 0.4 pMC | 1689–1928 | AD |
| 25–26 | 195 ± 30 BP | 1648–1955 | AD |
| 40–41 | 170 ± 30 BP | 1659–1954 | AD |
| 54–55 | 155 ± 30 BP | 1666–1953 | AD |
| 67–68 | 1005 ± 30 BP | 977–1153 | AD |
| 83–84 | 1125 ± 30 BP | 783–991 | AD |
| 90–91 | 1295 ± 70 BP | 620–890 | AD |
| 105–106 | 1295 ± 35 BP | 655–779 | AD |
| Sampling Site | Depth (cm) | Moisture (%) | |
|---|---|---|---|
| Baltic-type raised bog (Kusowo) | 0–25 | 91.57 ± 1.92 | |
| 25–50 | 92.31 ± 3.92 | ||
| 50–75 | 89.69 ± 1.21 | ||
| 75–100 | 91.82 ± 1.44 | ||
| Fen (Stążka) | 0–25 | 93.92 ± 1.84 | |
| 50–75 | 93.15 ± 3.98 | ||
| 75–100 | 93.17 ± 0.86 | ||
| Peat-moorsh soils (Turew) | Ch1 | 0–25 | 66.03 ± 7.55 |
| 25–50 | 77.62 ± 4.27 | ||
| 50–75 | 83.21 ± 2.59 | ||
| 75–100 | 83.55 ± 2.60 | ||
| Ch2 | 0–25 | 74.44 ± 5.88 | |
| 25–50 | 81.18 ± 4.25 | ||
| 50–75 | 82.15 ± 1.44 | ||
| 75–100 | 79.24 ± 1.73 | ||
| Ch3 | 0–25 | 61.31 ± 4.49 | |
| 50–75 | 79.80 ± 2.67 | ||
| 75–100 | 82.33 ± 1.90 | ||
| CH4 | 0–25 | 70.29 ± 5.38 | |
| 50–75 | 86.82 ± 1.97 | ||
| 75–100 | 86.04 ± 1.47 | ||
| Sampling Site | Depth (cm) | C | H | N | O | S | H/C | C/N* | O/C | |
|---|---|---|---|---|---|---|---|---|---|---|
| Baltic-type raised bog (Kusowo) | Kusowo | 0–25 | 43.41 | 4.66 | 3.26 | 47.85 | 0.82 | 1.28 | 15.53 | 0.83 |
| 25–50 | 41.79 | 4.24 | 2.56 | 50.78 | 0.63 | 1.21 | 19.04 | 0.91 | ||
| 50–75 | 46.90 | 4.78 | 2.65 | 45.20 | 0.47 | 1.21 | 20.64 | 0.72 | ||
| 75–100 | 47.04 | 4.74 | 2.74 | 45.10 | 0.38 | 1.20 | 20.02 | 0.72 | ||
| Fen | Stążka | 0–25 | 40.76 | 4.24 | 2.85 | 51.23 | 0.92 | 1.24 | 16.68 | 0.94 |
| 50–75 | 44.01 | 4.14 | 2.64 | 48.55 | 0.66 | 1.24 | 19.44 | 0.83 | ||
| 75–100 | 44.38 | 3.74 | 2.08 | 49.25 | 0.55 | 1.12 | 24.88 | 0.83 | ||
| Peat-moorsh soils | Ch1 | 0–25 | 42.84 | 4.50 | 3.64 | 48.08 | 0.94 | 1.00 | 13.73 | 0.84 |
| 25–50 | 41.62 | 3.98 | 2.86 | 50.66 | 0.88 | 1.25 | 16.97 | 0.91 | ||
| 50–75 | 46.03 | 4.31 | 2.69 | 45.86 | 1.11 | 1.14 | 19.96 | 0.75 | ||
| 75–100 | 44.63 | 4.27 | 2.86 | 46.90 | 1.34 | 1.12 | 18.20 | 0.79 | ||
| Ch2 | 0–25 | 36.09 | 3.73 | 2.86 | 56.36 | 0.96 | 1.14 | 14.72 | 1.17 | |
| 25–50 | 42.66 | 4.13 | 3.17 | 48.90 | 1.14 | 1.23 | 15.69 | 0.86 | ||
| 50–75 | 42.61 | 4.07 | 2.93 | 49.00 | 1.39 | 1.15 | 16.96 | 0.86 | ||
| 75–100 | 43.19 | 4.08 | 2.90 | 48.15 | 1.68 | 1.14 | 17.37 | 0.84 | ||
| Ch3 | 0–25 | 41.43 | 4.27 | 3.45 | 49.60 | 1.25 | 1.13 | 14.00 | 0.90 | |
| 50–75 | 42.13 | 4.10 | 3.03 | 48.80 | 1.94 | 1.23 | 16.21 | 0.87 | ||
| 75–100 | 43.41 | 4.03 | 2.73 | 47.58 | 2.25 | 1.24 | 18.54 | 0.82 | ||
| Ch4 | 0–25 | 40.57 | 4.07 | 3.00 | 51.15 | 1.21 | 1.16 | 15.77 | 0.95 | |
| 50–75 | 43.21 | 4.11 | 3.07 | 48.21 | 1.40 | 1.11 | 16.41 | 0.84 | ||
| 75–100 | 43.21 | 4.03 | 3.11 | 48.00 | 1.65 | 1.19 | 16.20 | 0.83 | ||
| Sampling Site | Depth (cm) | E4/E6 | g-Value | *Spin Concentration × 1017 | |
|---|---|---|---|---|---|
| BalticRaised bog | Kusowo | 0–25 | 6.36 | 2.0035 | 1.29 |
| 25–50 | 4.88 | 2.0029 | 3.13 | ||
| 50–75 | 4.00 | 2.0021 | 3.92 | ||
| 75–100 | 3.98 | 2.0023 | 5.64 | ||
| Fen | Stążka | 0–25 | 5.67 | 2.0035 | 1.04 |
| 50–75 | 5.57 | 2.0036 | 1.38 | ||
| 75–100 | 4.46 | 2.0036 | 3.41 | ||
| Peat-moorsh soils | Ch1 | 0–25 | 6.78 | 2.0036 | 0.77 |
| 25–50 | 6.12 | 2.0036 | 1.71 | ||
| 50–75 | 5.94 | 2.0036 | 2.22 | ||
| 75–100 | 6.19 | 2.0036 | 2.77 | ||
| Ch2 | 0–25 | 6.95 | 2.0035 | 2.20 | |
| 25–50 | 6.73 | 2.0036 | 1.23 | ||
| 50–75 | 6.49 | 2.0036 | 1.43 | ||
| 75–100 | 5.59 | 2.0036 | 1.12 | ||
| Ch3 | 0–25 | 6.65 | 2.0036 | 0.95 | |
| 50–75 | 6.14 | 2.0036 | 2.27 | ||
| 75–100 | 5.18 | 2.0036 | 3.82 | ||
| Ch4 | 0–25 | 6.37 | 2.0035 | 1.48 | |
| 50–75 | 6.19 | 2.0035 | 3.34 | ||
| 75–100 | 5.70 | 2.0035 | 4.30 | ||
| Sampling Site | Depth (cm) | Temperature of Effects on DTA Curves (°C) | Mass Loss Corresponding with the Effects on DTG Curves (%) | The Ratios of Area under DTA and DTG Curves for Exothermal Effects | Z | |||||||||
|---|---|---|---|---|---|---|---|---|---|---|---|---|---|---|
| endo | exo 1 | exo 2 | exo 3 | Endo | exo 1 | exo 2 | exo 3 | |||||||
| Raised bog | Kusowo | 0–25 | 74 | 297 | 403 | 489 | 13.6 | 27.4 | 24.0 | 35.0 | 3.32 | 4.08 | 3.84 | 0.70 |
| 25–50 | 75 | 294 | 427 | 485 | 15.4 | 28.8 | 24.1 | 31.7 | 3.41 | 6.10 | 5.18 | 0.79 | ||
| 50–75 | 76 | 295 | 400 | 473 | 13.2 | 29.4 | 24.6 | 32.8 | 4.07 | 7.83 | 6.55 | 0.74 | ||
| 75–100 | 74 | 294 | 418 | 490 | 15.7 | 28.8 | 24.7 | 30.8 | 4.75 | 8.02 | 6.90 | 0.80 | ||
| Fen | Stążka | 0–25 | 76 | 294 | 390 | 476 | 16.0 | 28.1 | 22.2 | 33.7 | 2.60 | 2.92 | 2.81 | 0.79 |
| 50–75 | 74 | 294 | 399 | 490 | 15.7 | 28.8 | 24.7 | 30.8 | 2.48 | 3.92 | 3.29 | 0.67 | ||
| 75–100 | 77 | 304 | 419 | 486 | 13.5 | 28.1 | 28.5 | 29.9 | 2.53 | 3.38 | 3.44 | 0.71 | ||
| Peat-moorsh soils | Ch1 | 0–25 | 79 | 287 | 365 | 467 | 12.7 | 31.6 | 25.4 | 30.4 | 3.07 | 4.82 | 3.88 | 0.79 |
| 25–50 | 79 | 290 | 372 | 461 | 12.7 | 29.5 | 28.4 | 29.4 | 3.80 | 5.46 | 4.50 | 0.76 | ||
| 50–75 | 78 | 320 | 421 | 483 | 12.6 | 27.8 | 32.2 | 26.3 | 4.62 | 6.75 | 5.31 | 0.69 | ||
| 75–100 | 76 | 314 | 426 | 496 | 14.2 | 28.8 | 32.4 | 24.6 | 2.76 | 5.65 | 4.68 | 0.76 | ||
| Ch2 | 0–25 | 76 | 277 | 348 | 437 | 21.7 | 29.1 | 9.1 | 40.1 | 2.15 | 5.99 | 4.64 | 1.03 | |
| 25–50 | 75 | 281 | 350 | 439 | 17.1 | 30.0 | 10.9 | 41.4 | 2.99 | 6.78 | 5.38 | 0.92 | ||
| 50–75 | 75 | 294 | 370 | 450 | 18.3 | 28.0 | 14.4 | 39.3 | 2.24 | 6.06 | 4.76 | 0.86 | ||
| 75–100 | 77 | 292 | 367 | 450 | 18.1 | 28.8 | 16.0 | 37.1 | 3.08 | 7.47 | 5.94 | 0.88 | ||
| Ch3 | 0–25 | 80 | 291 | 377 | 476 | 17.3 | 30.2 | 19.8 | 33.1 | 2.50 | 3.58 | 4.59 | 1.08 | |
| 50–75 | 84 | 296 | 394 | 481 | 13.9 | 28.3 | 21.3 | 36.6 | 3.23 | 3.70 | 4.87 | 0.95 | ||
| 75–100 | 81 | 293 | 391 | 480 | 15.9 | 31.2 | 19.3 | 32.1 | 4.58 | 5.17 | 6.23 | 0.91 | ||
| Ch4 | 0–25 | 79 | 289 | 367 | 458 | 16.4 | 30.7 | 16.2 | 36.7 | 2.32 | 4.41 | 3.64 | 0.89 | |
| 50–75 | 78 | 302 | 394 | 479 | 13.7 | 29.9 | 23.2 | 33.2 | 2.60 | 4.03 | 3.38 | 0.76 | ||
| 75–100 | 79 | 300 | 399 | 482 | 12.1 | 30.4 | 28.1 | 29.4 | 4.22 | 7.57 | 6.44 | 0.71 | ||
| Peat Deposit | HAs | ||||||||||||
|---|---|---|---|---|---|---|---|---|---|---|---|---|---|
| Parameter | TOC | CWHE | N-Total | C/N | E4/E6 | g-Value | Spin Concentr. | Z | H/C | C/N* | |||
| CWHE | 0.065 | - | |||||||||||
| N-total | −0.481 * | −0.301 | - | ||||||||||
| C/N | 0.736 * | 0.384 | −0.900 * | - | |||||||||
| E4/E6 | −0.726 * | 0.039 | 0.697 * | −0.806 * | - | ||||||||
| g-value | −0.480 * | −0.420 | 0.729 * | −0.865 * | 0.744 * | - | |||||||
| Spin conc. | 0.552 * | −0.059 | −0.313 | 0.548 * | −0.756 * | −0.620 * | - | ||||||
| 0.358 | −0.103 | −0.305 | 0.426 | −0.528 * | −0.454 * | 0.612 * | - | ||||||
| 0.283 | 0.134 | −0.106 | 0.374 | −0.313 | −0.584 * | 0.552 * | 0.607 * | - | |||||
| 0.228 | −0.008 | −0.179 | 0.376 | −0.425 | −0.569 * | 0.669 * | 0.759 * | 0.850 * | - | ||||
| Z | −0.645 * | 0.186 | 0.347 | −0.406 | 0.429 | 0.159 | −0.239 | −0.313 | −0.126 | 0.104 | - | ||
| H/C | −0.303 | 0.772 * | −0.326 | 0.203 | 0.266 | −0.285 | −0.339 | −0.095 | −0.005 | −0.051 | 0.295 | - | |
| C/N * | 0.743 * | −0.322 | −0.382 | 0.530 * | −0.815 * | −0.369 | 0.553 * | 0.296 | 0.152 | 0.163 | −0.532 * | −0.632 * | - |
| O/C | −0.454 * | 0.432 | 0.458 * | −0.462 * | 0.536 * | 0.379 | −0.421 | −0.590 * | −0.307 | −0.384 | 0.570 * | 0.279 | −0.488 * |
| Principal Components | Eigenvalues | % of total Variance | Cumulative Eigenvalues | Cumulative % of Variance |
|---|---|---|---|---|
| PC1 | 6.44 | 45.98 | 6.44 | 45.98 |
| PC2 | 2.78 | 19.84 | 9.22 | 65.83 |
| PC3 | 2.02 | 14.43 | 11.24 | 80.26 |
| Variable | PC1 | PC2 | PC3 |
|---|---|---|---|
| TOC | −0.78 | 0.17 | −0.33 |
| CWHE | −0.01 | −0.89 | −0.20 |
| N-total | 0.68 | 0.38 | 0.46 |
| C/N | −0.86 | −0.37 | −0.32 |
| E4/E6 | 0.92 | −0.08 | 0.18 |
| g-value | 0.80 | 0.50 | 0.01 |
| Spin concentration | −0.80 | 0.09 | 0.30 |
| −0.70 | 0.01 | 0.47 | |
| −0.58 | −0.22 | 0.63 | |
| −0.62 | −0.18 | 0.74 | |
| Z | 0.52 | −0.38 | 0.41 |
| H/C | 0.19 | −0.92 | −0.12 |
| C/N* | −0.72 | 0.49 | −0.27 |
| O/C | 0.68 | −0.33 | −0.03 |
© 2020 by the authors. Licensee MDPI, Basel, Switzerland. This article is an open access article distributed under the terms and conditions of the Creative Commons Attribution (CC BY) license (http://creativecommons.org/licenses/by/4.0/).
Share and Cite
Szajdak, L.W.; Jezierski, A.; Wegner, K.; Meysner, T.; Szczepański, M. Influence of Drainage on Peat Organic Matter: Implications for Development, Stability, and Transformation. Molecules 2020, 25, 2587. https://doi.org/10.3390/molecules25112587
Szajdak LW, Jezierski A, Wegner K, Meysner T, Szczepański M. Influence of Drainage on Peat Organic Matter: Implications for Development, Stability, and Transformation. Molecules. 2020; 25(11):2587. https://doi.org/10.3390/molecules25112587
Chicago/Turabian StyleSzajdak, Lech W., Adam Jezierski, Kazimiera Wegner, Teresa Meysner, and Marek Szczepański. 2020. "Influence of Drainage on Peat Organic Matter: Implications for Development, Stability, and Transformation" Molecules 25, no. 11: 2587. https://doi.org/10.3390/molecules25112587
APA StyleSzajdak, L. W., Jezierski, A., Wegner, K., Meysner, T., & Szczepański, M. (2020). Influence of Drainage on Peat Organic Matter: Implications for Development, Stability, and Transformation. Molecules, 25(11), 2587. https://doi.org/10.3390/molecules25112587