Composite Graphene-Containing Porous Materials from Carbon for Capacitive Deionization of Water

 , , ,
, , , 
Abstract
:1. Introduction
2. Result and Discussion
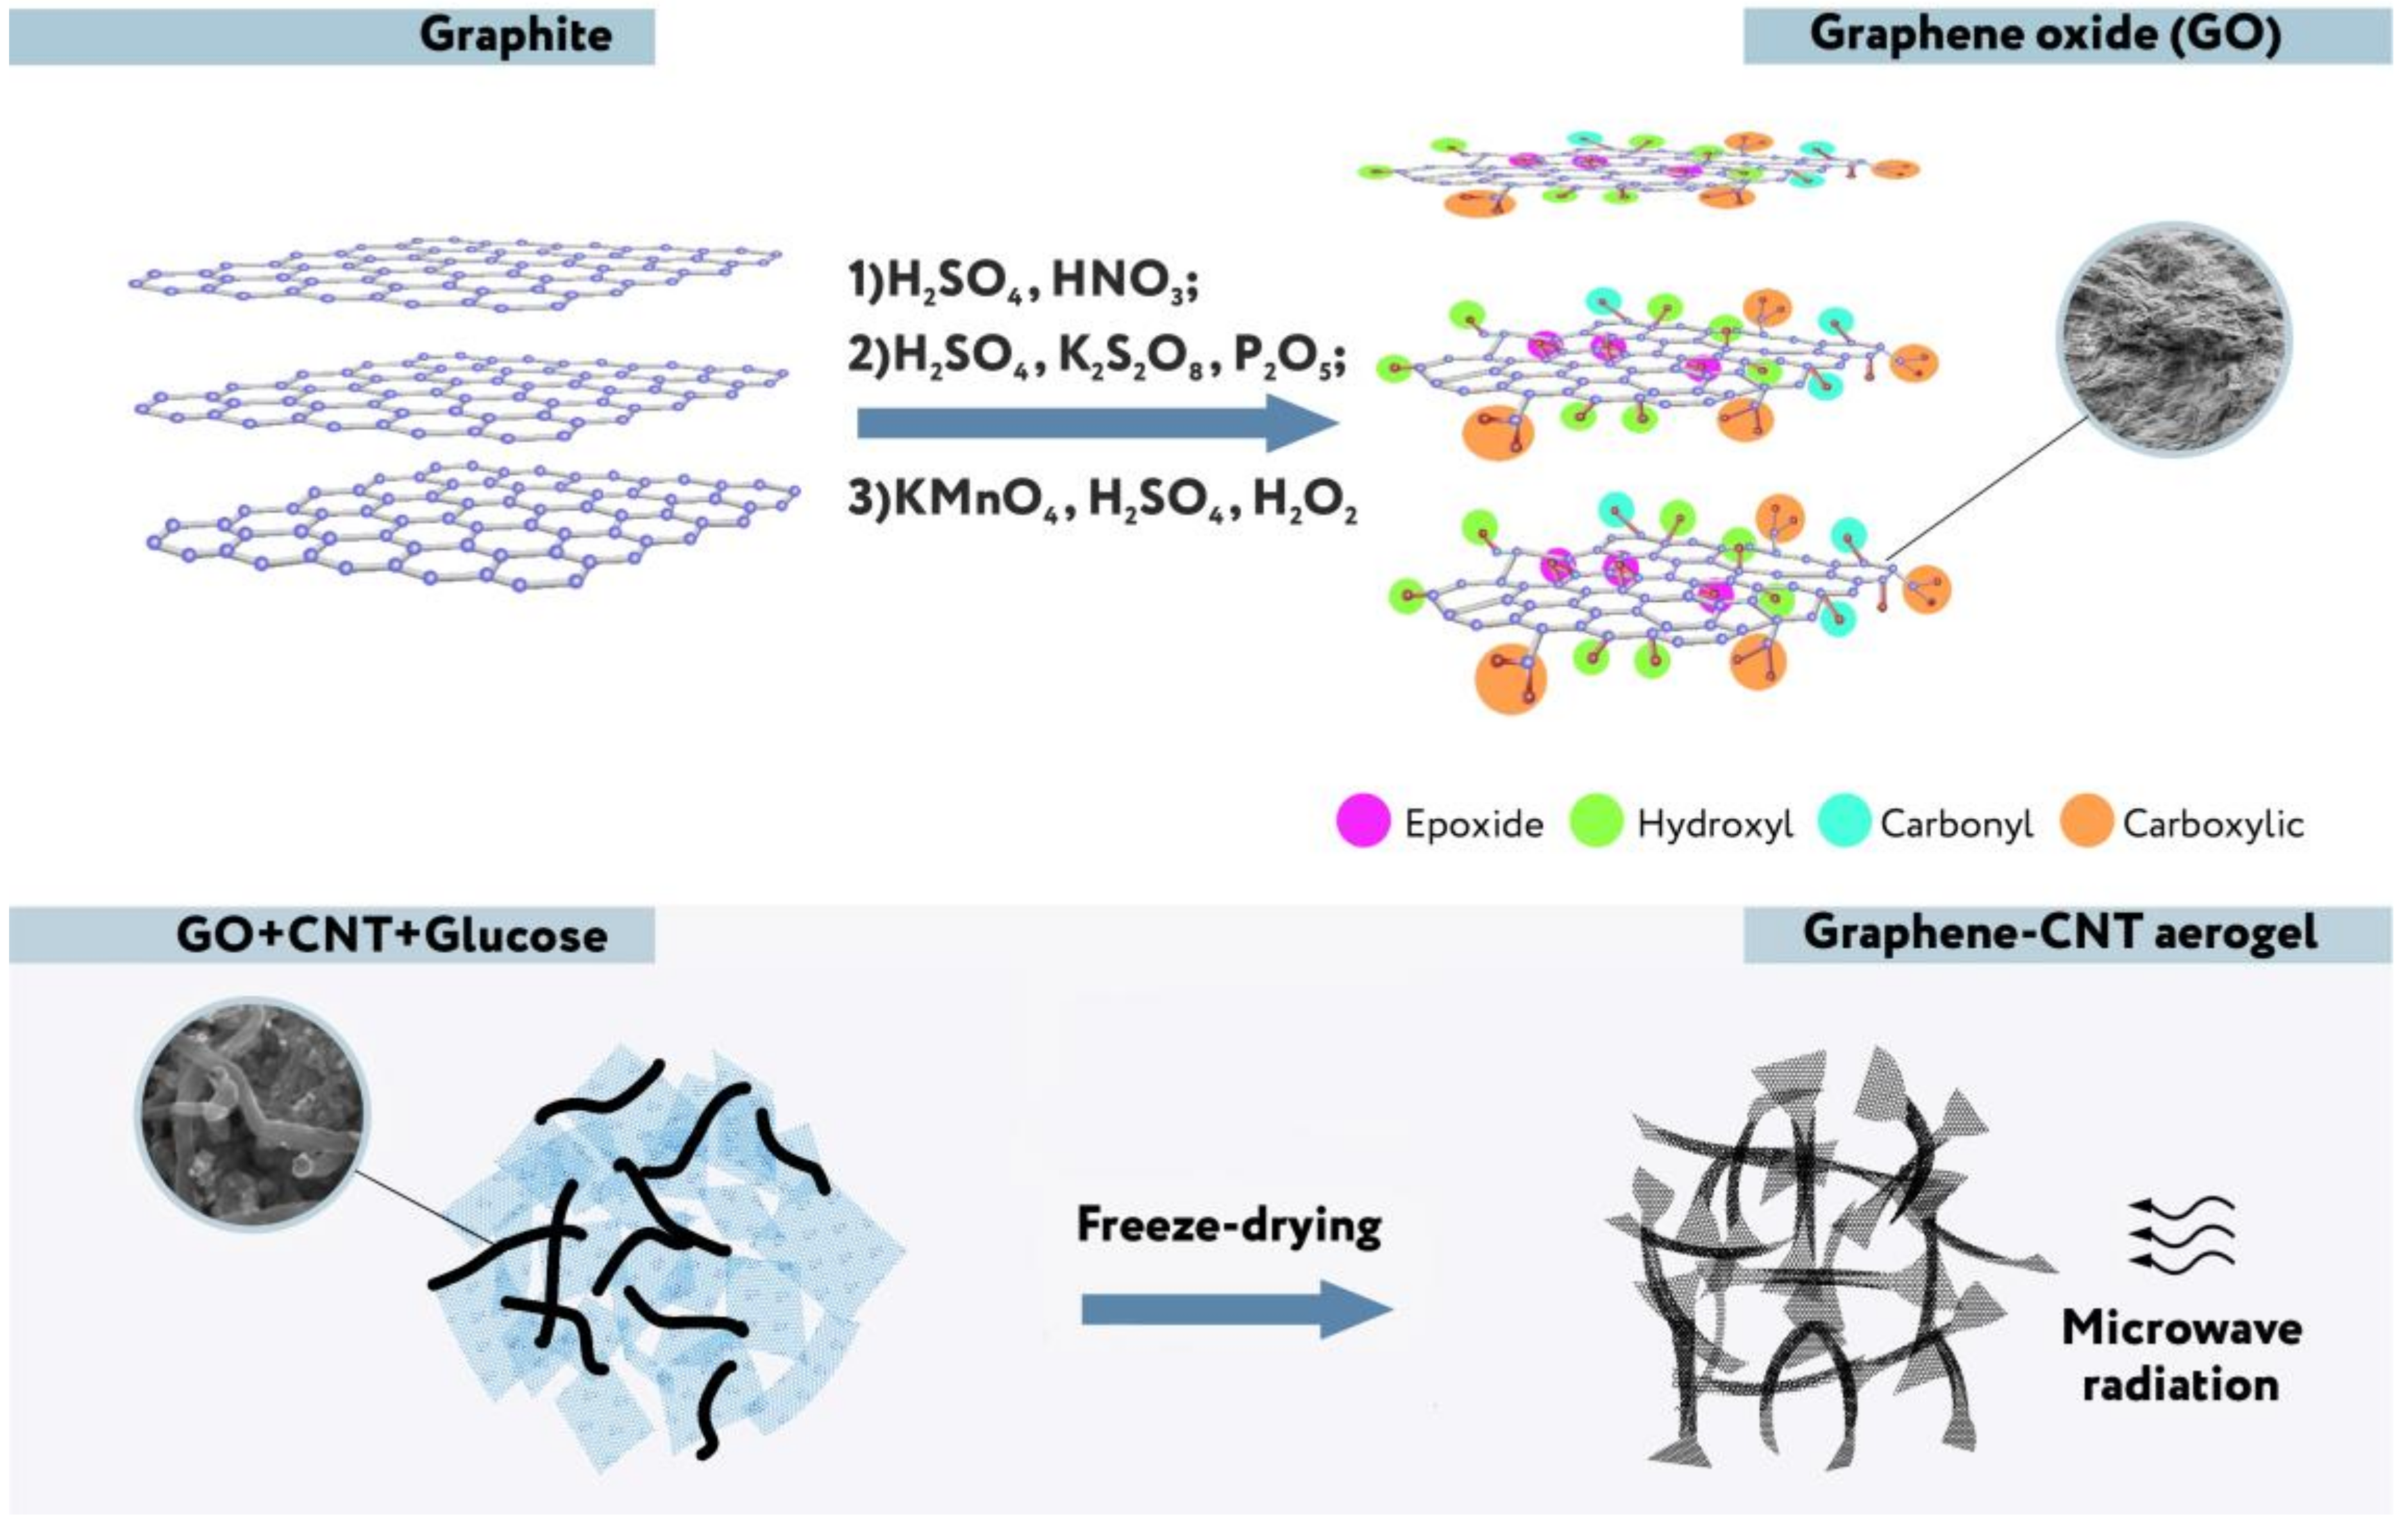
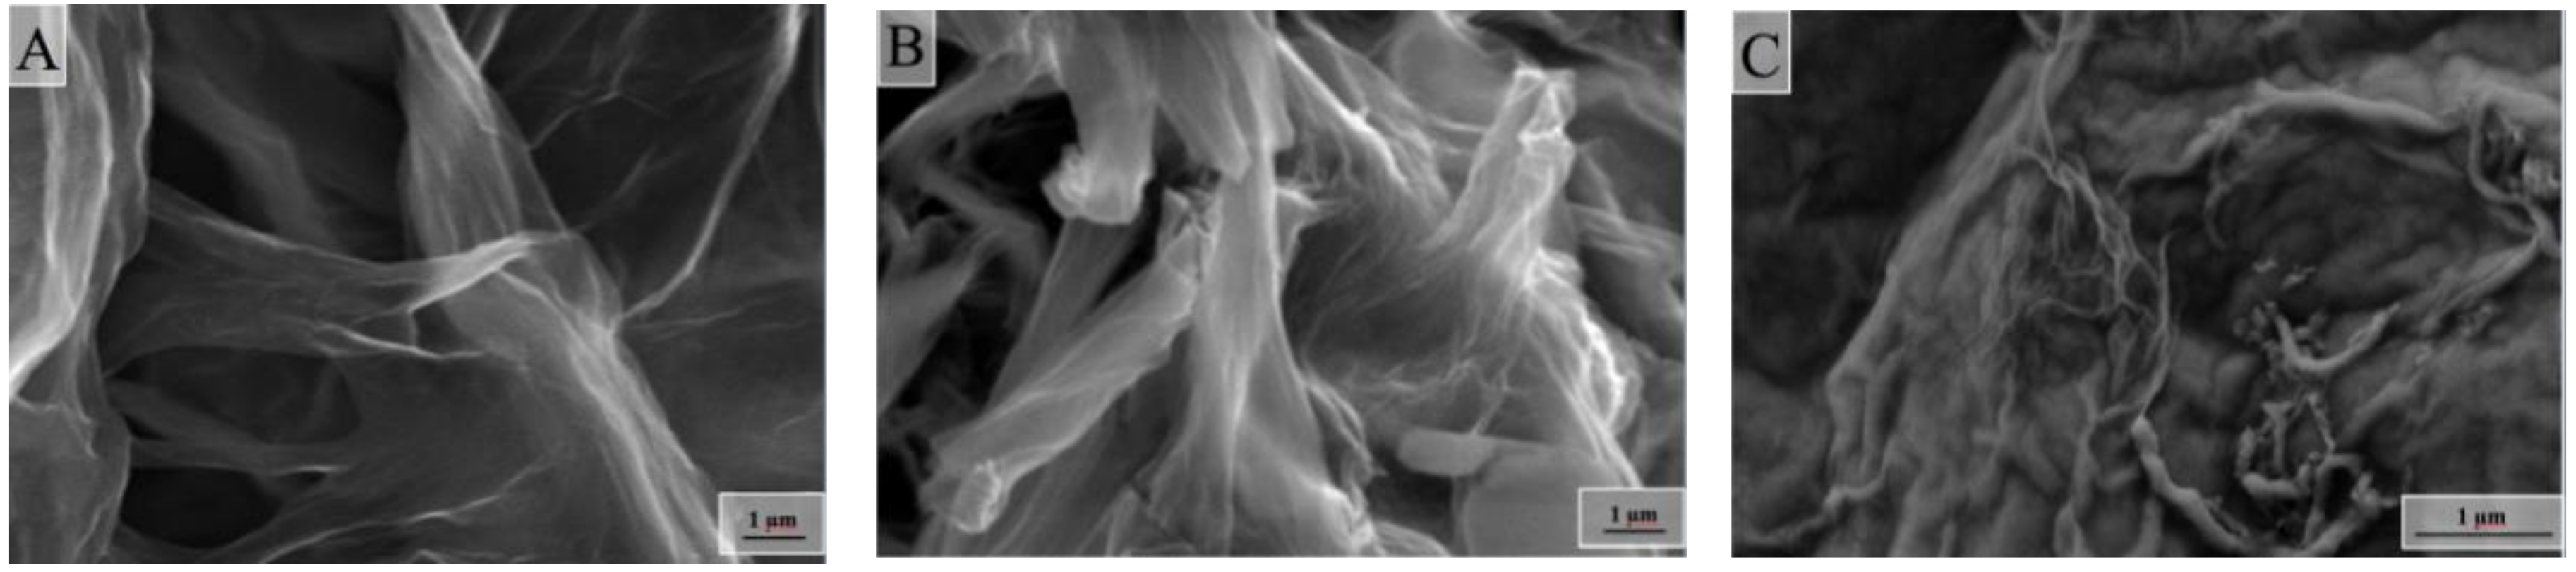
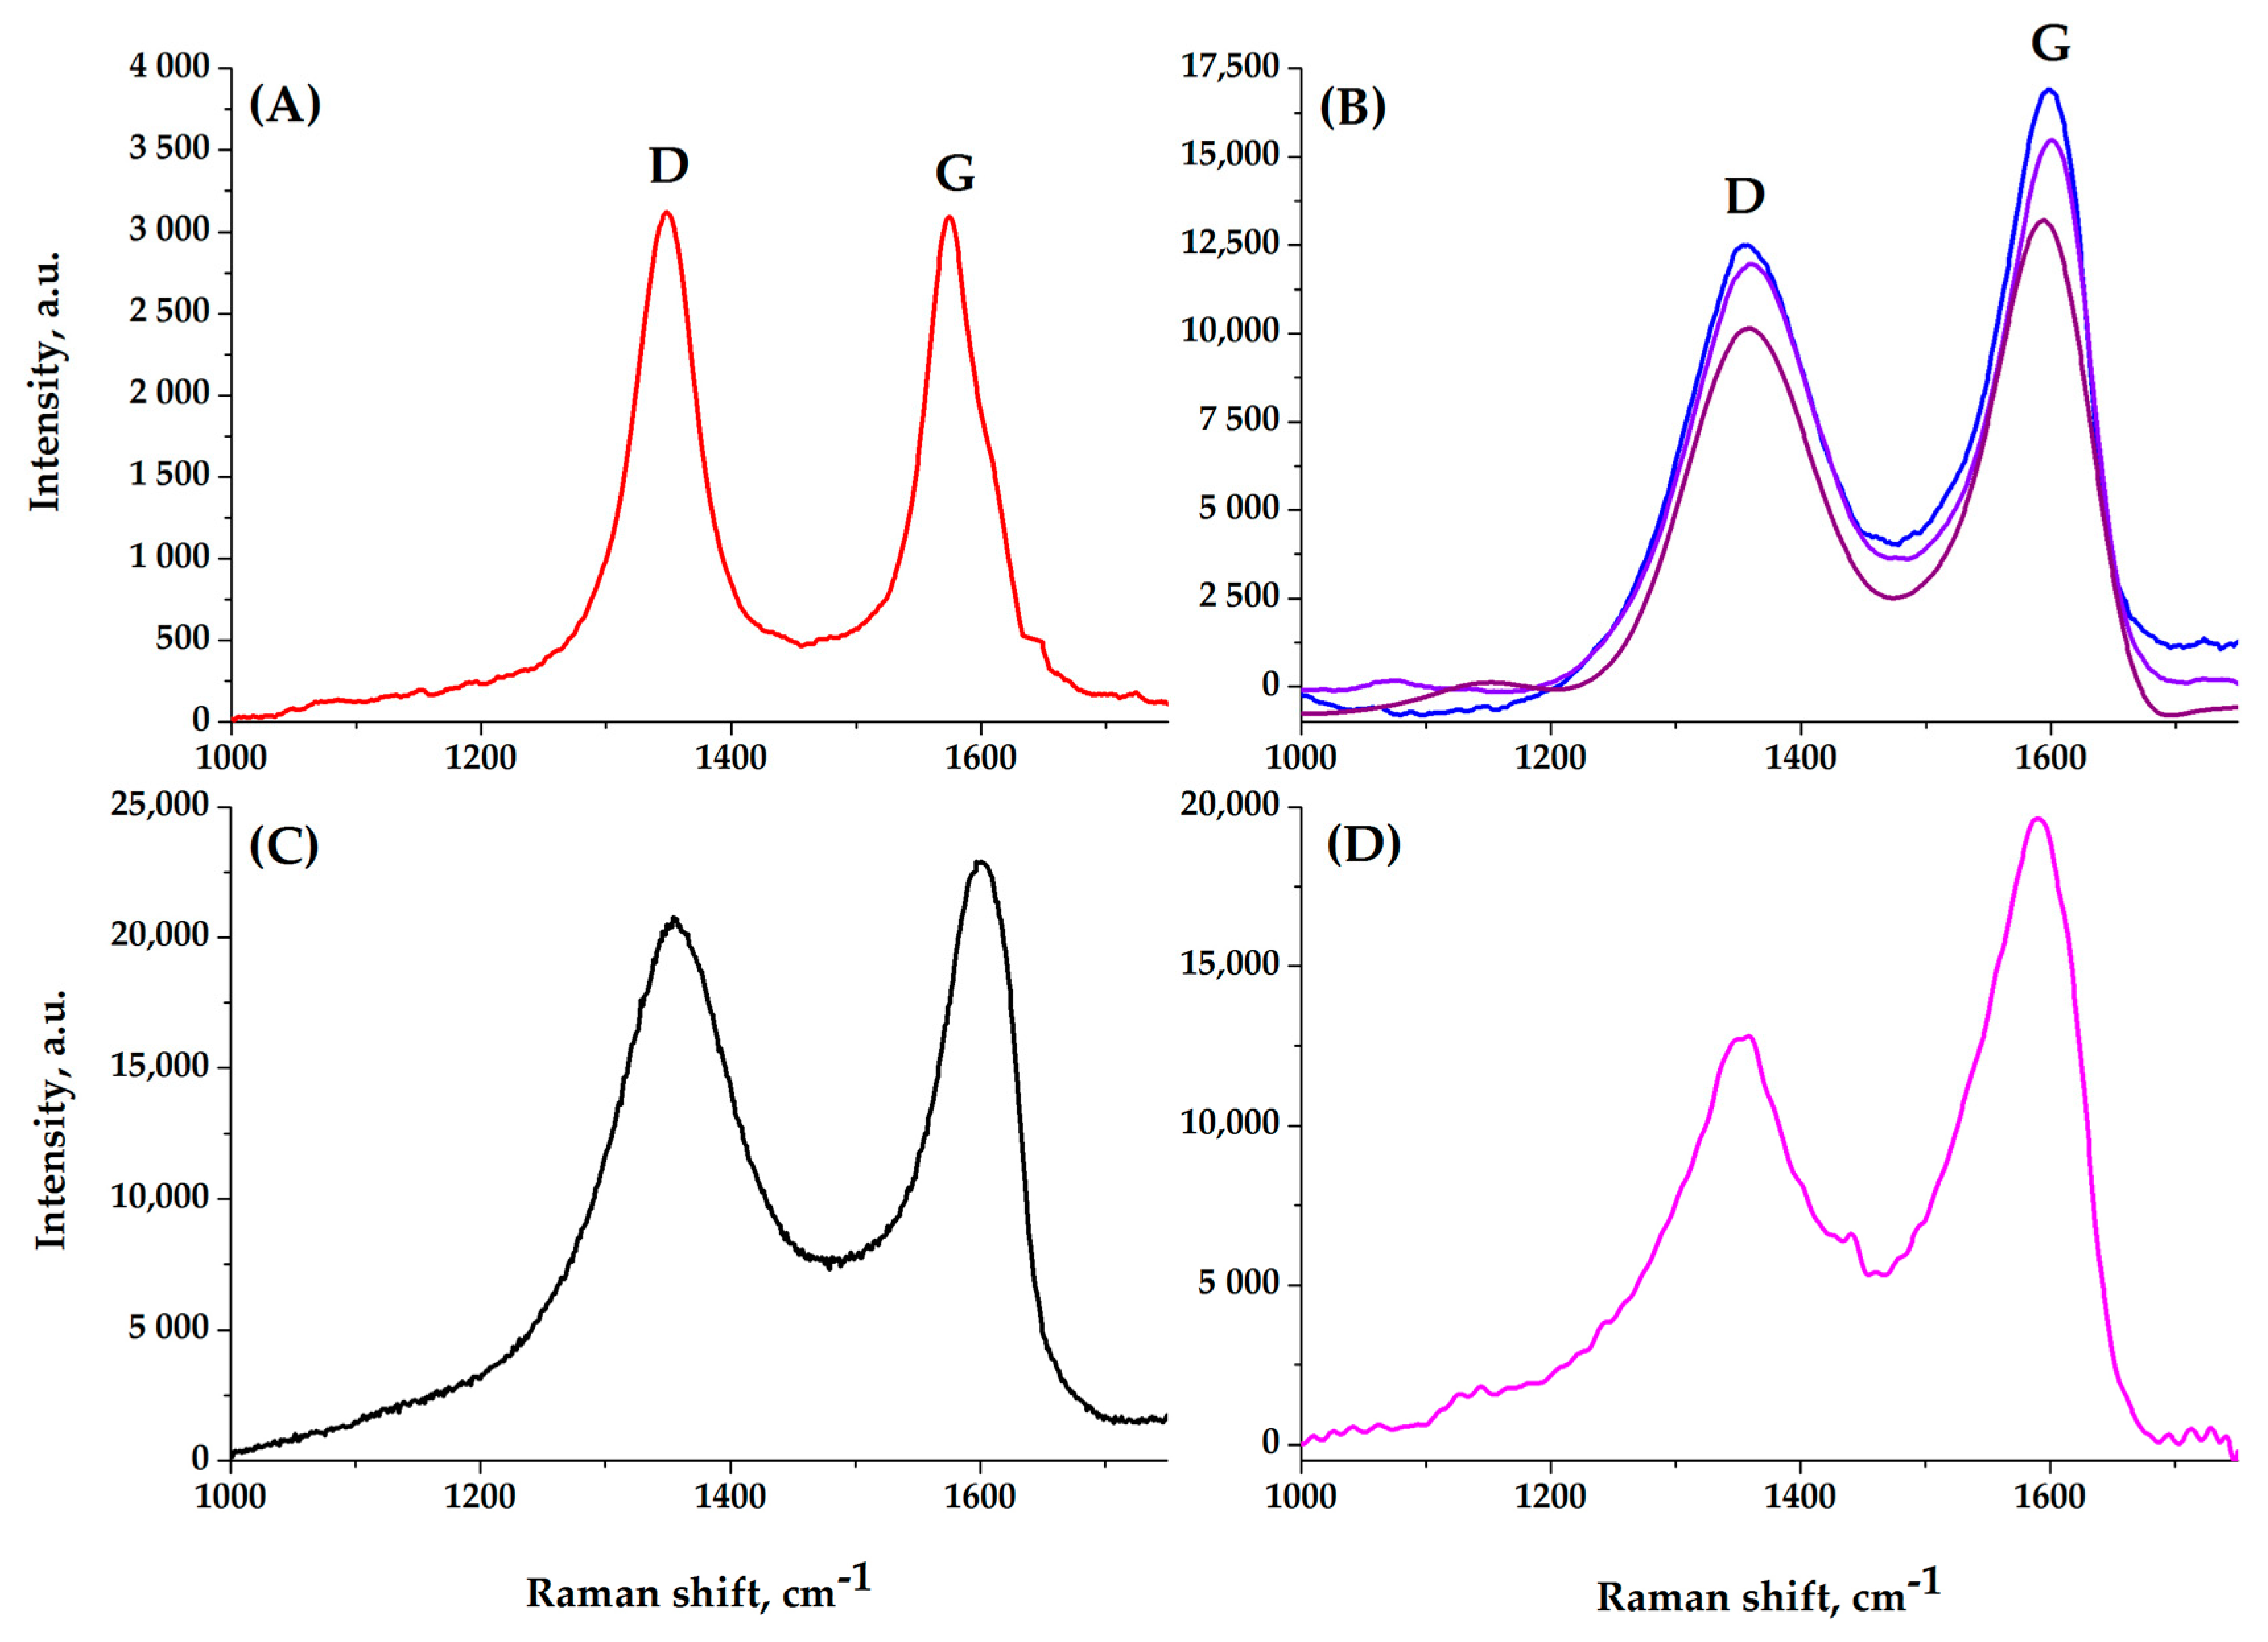
2.1. Synthesis of Composite Aerogels
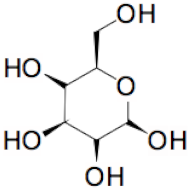 | + | 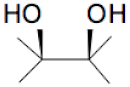 | = | 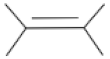 | + |  | + | H2O | (I) |
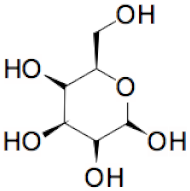 | + |  | = |  | + | H2O | (II) | ||
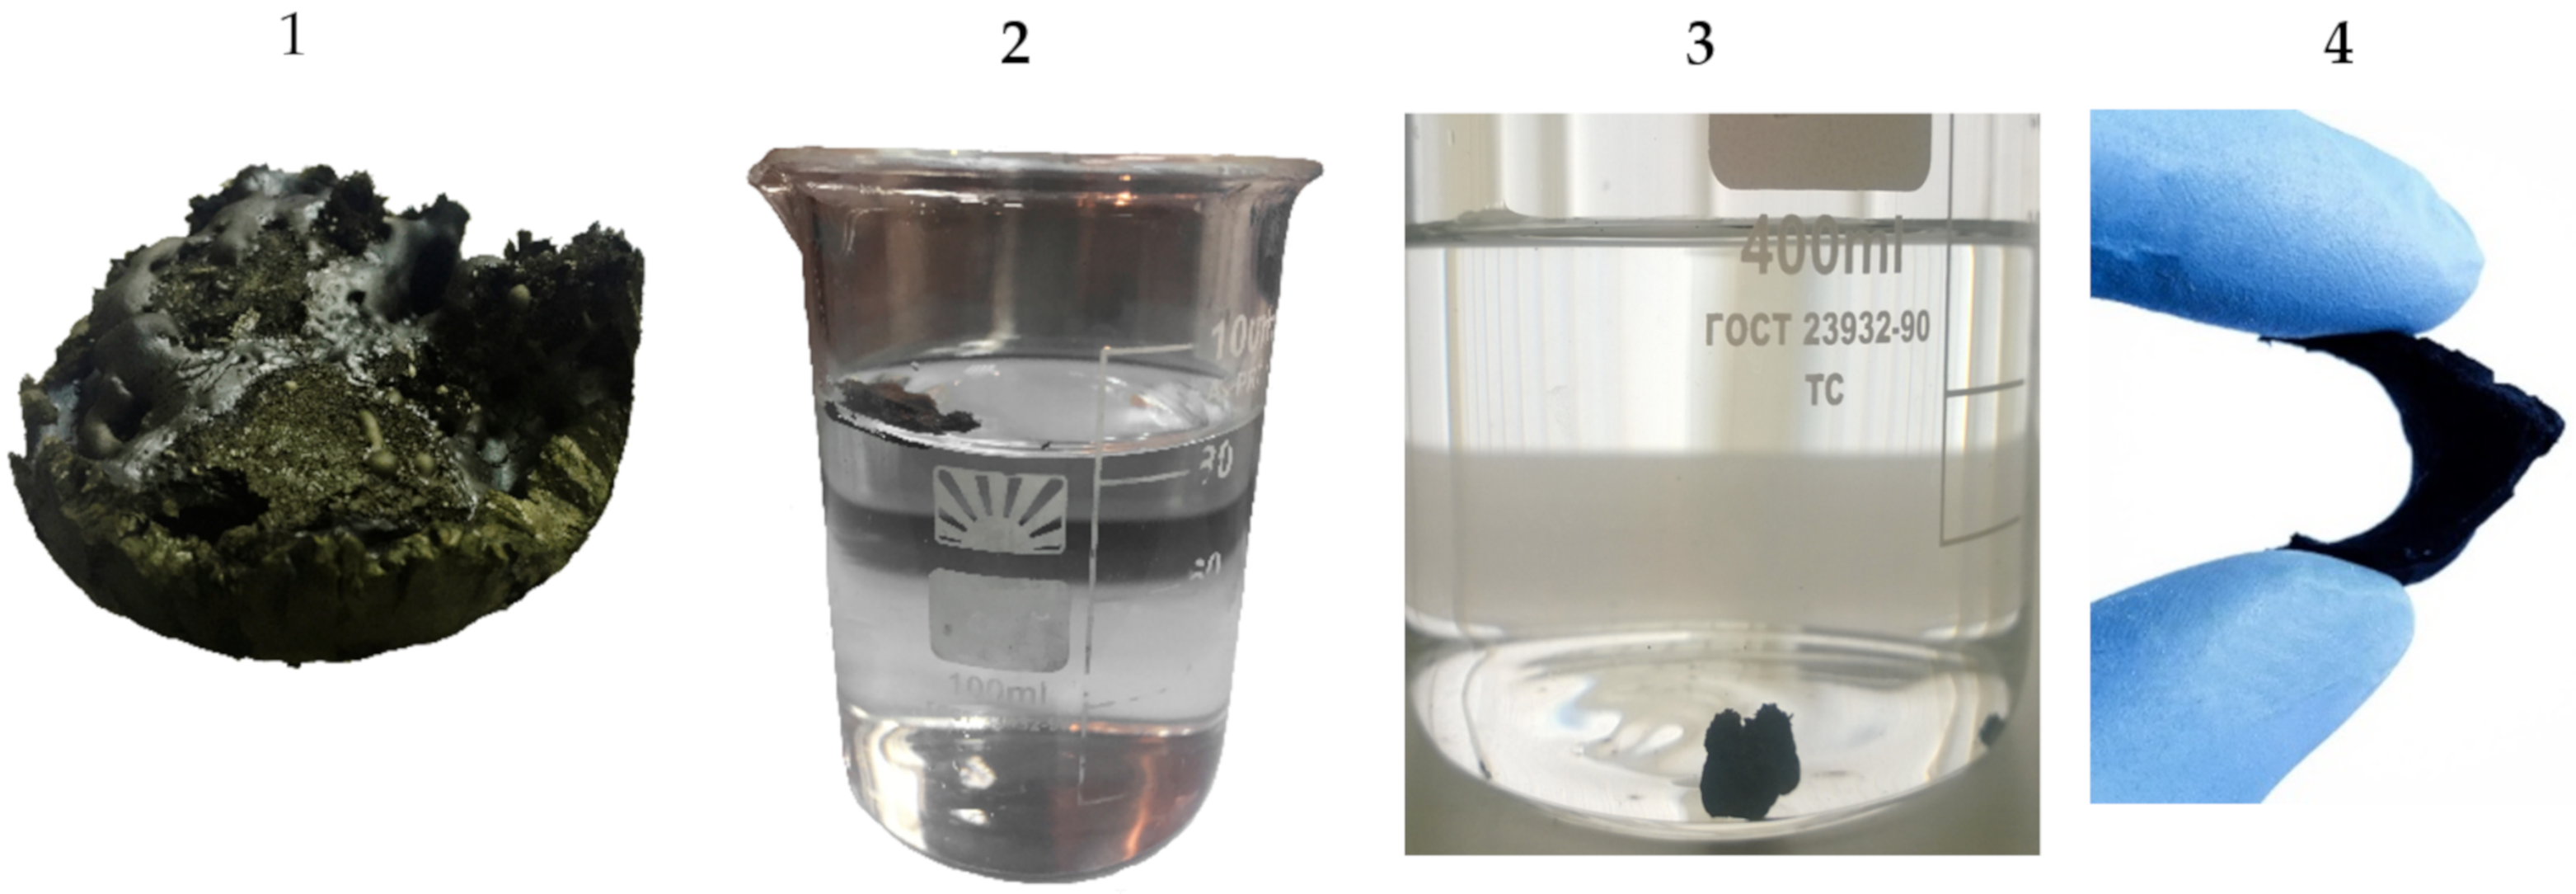
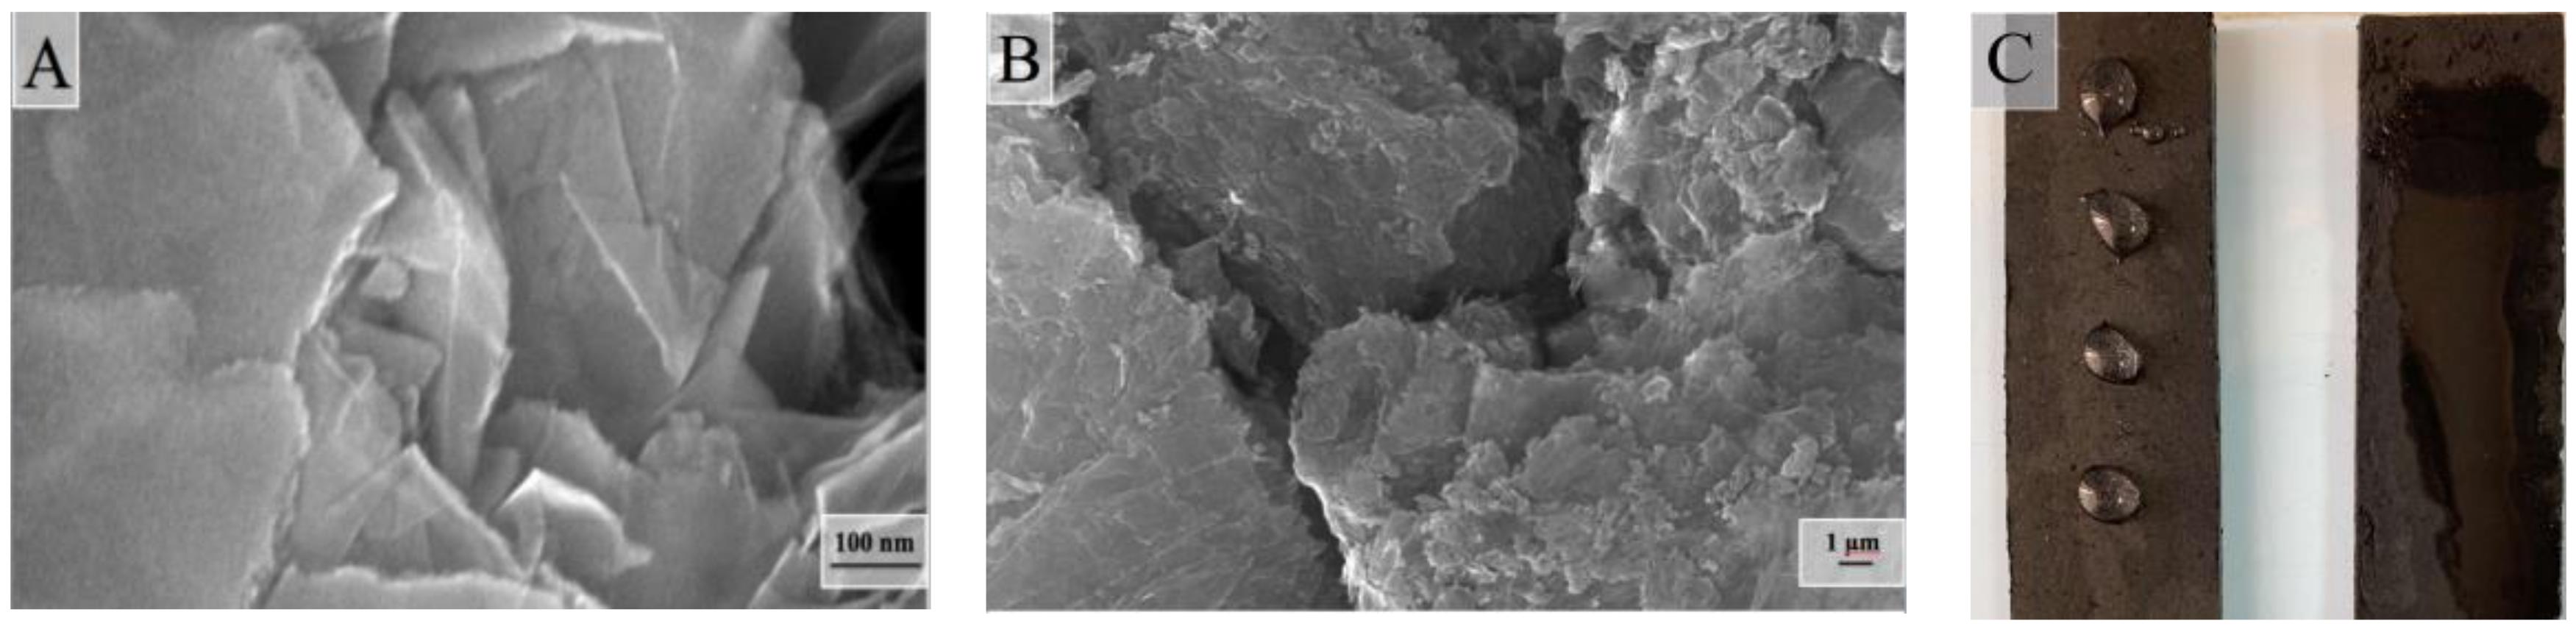
2.2. Hydrophilization of Composite Aerogels
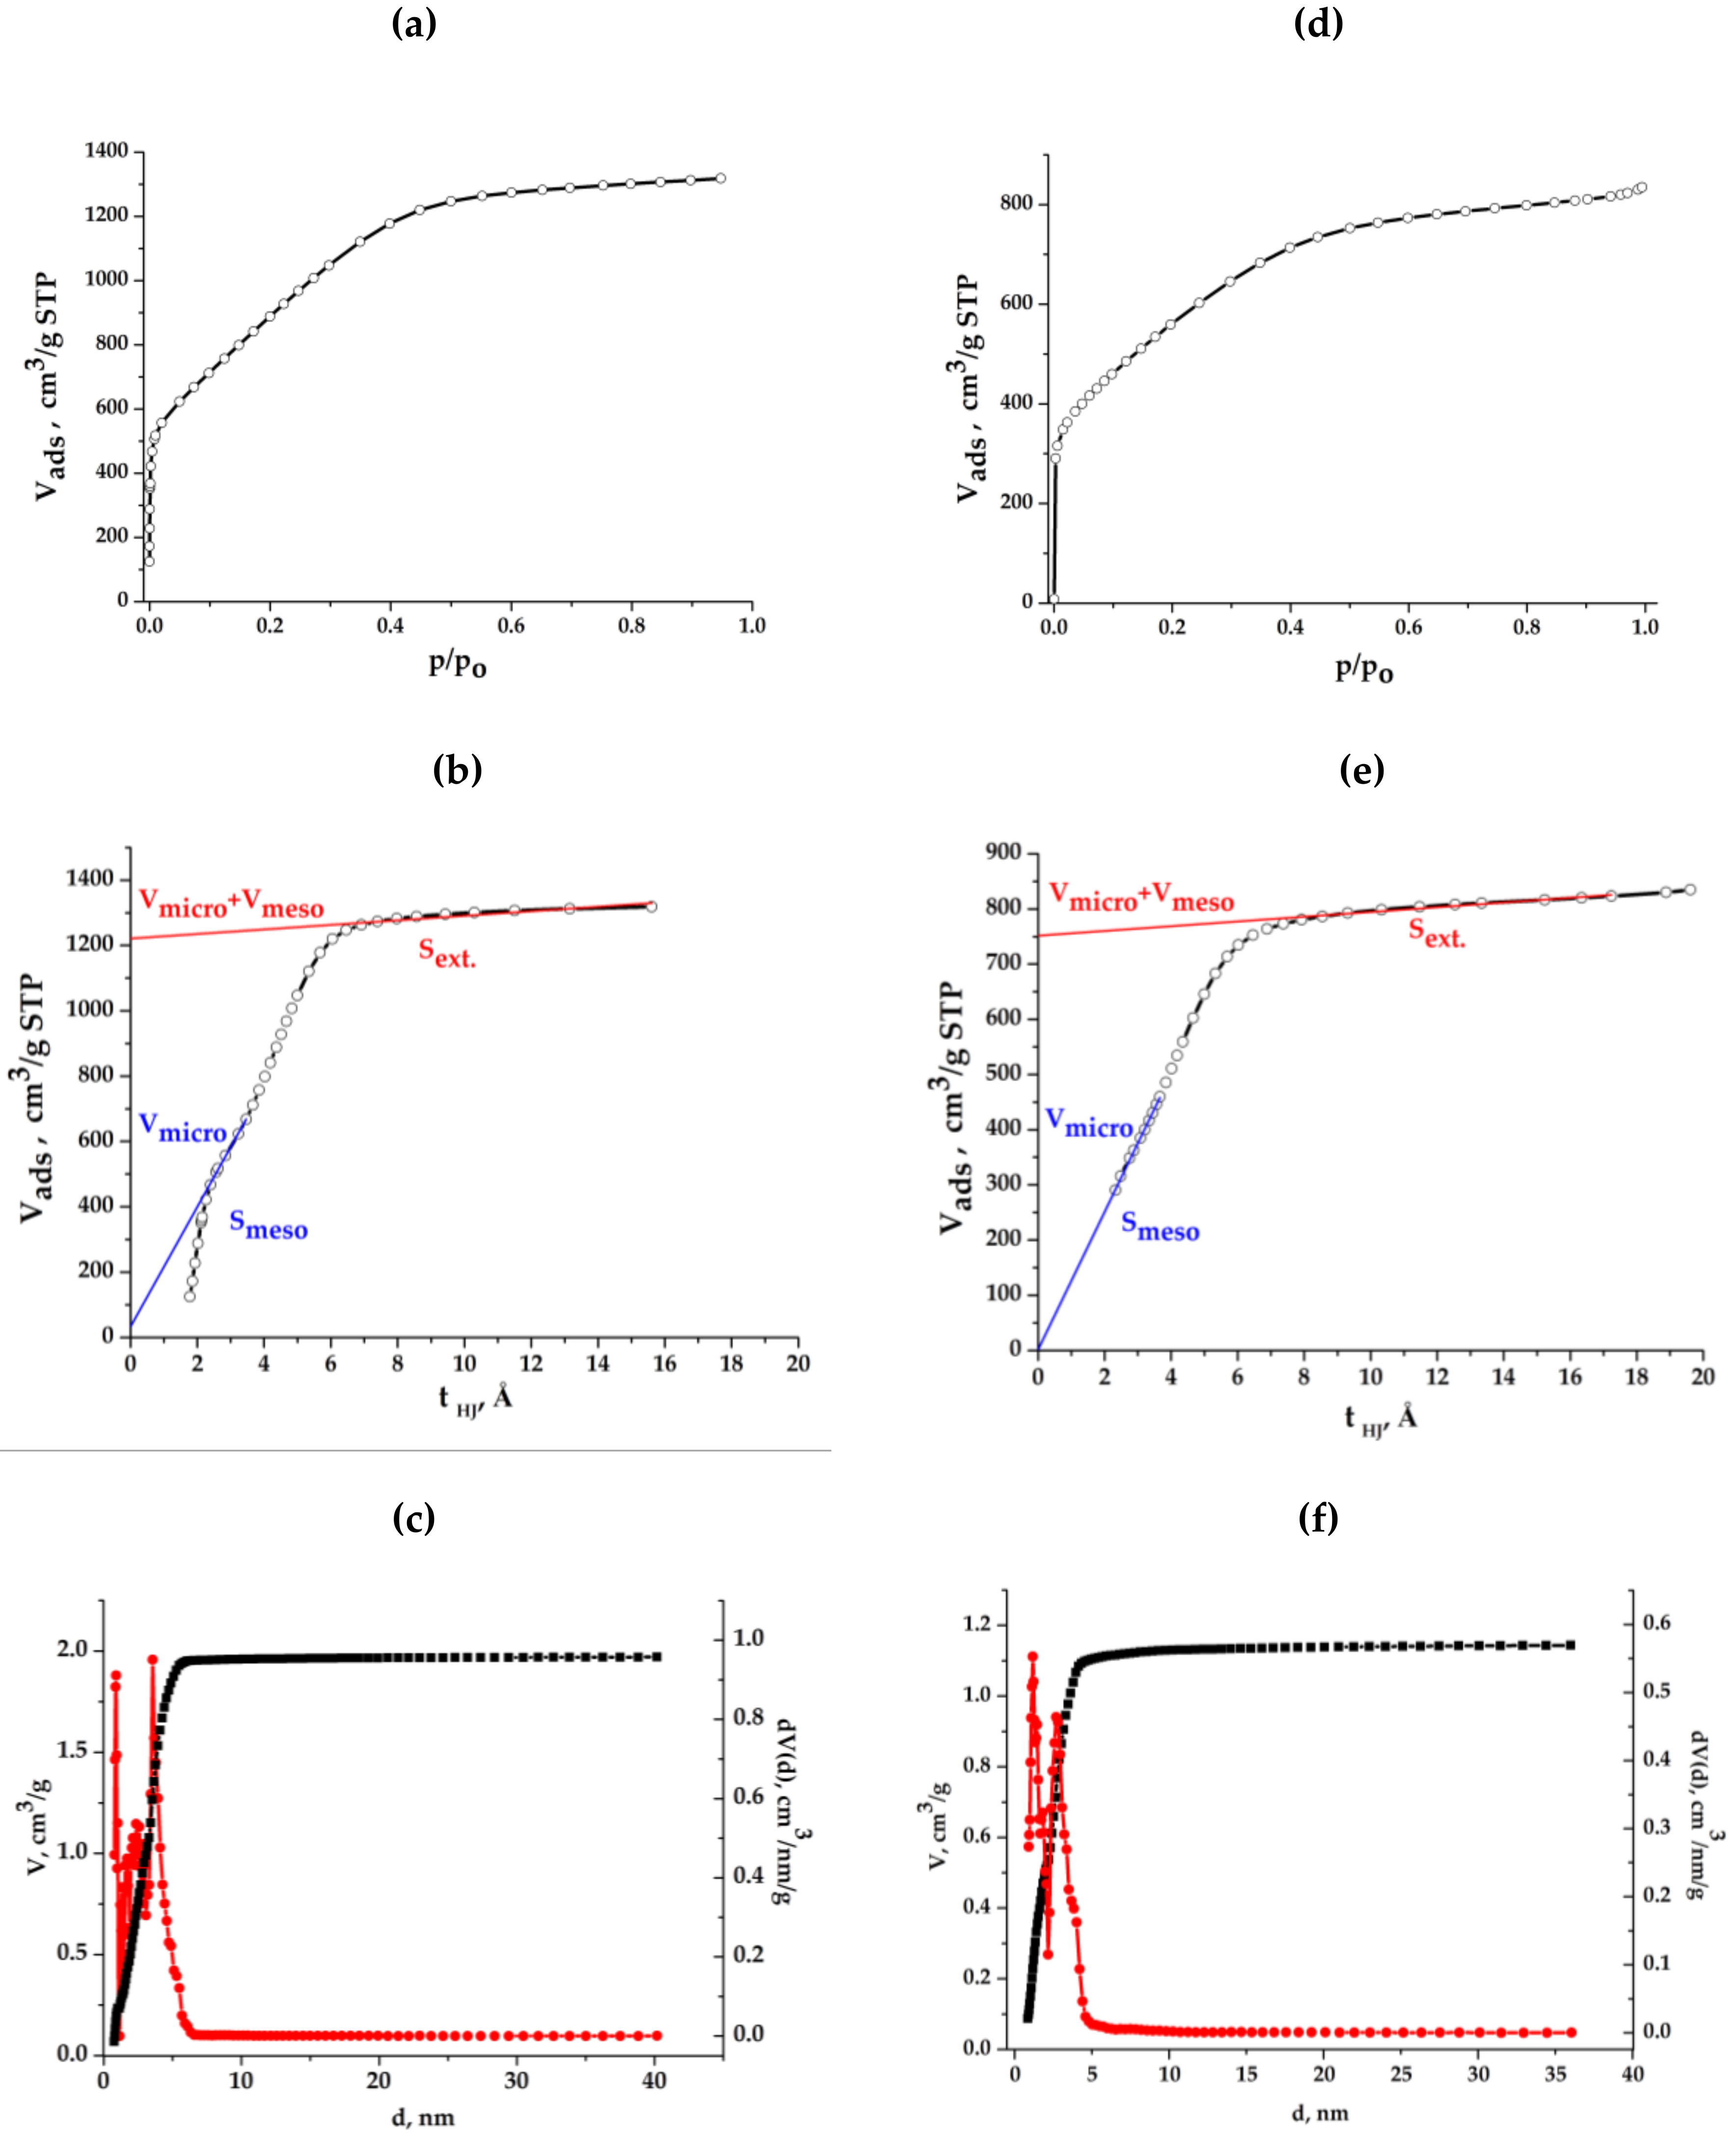
2.3. Surface and Some Other Properties of Composite Aerogels
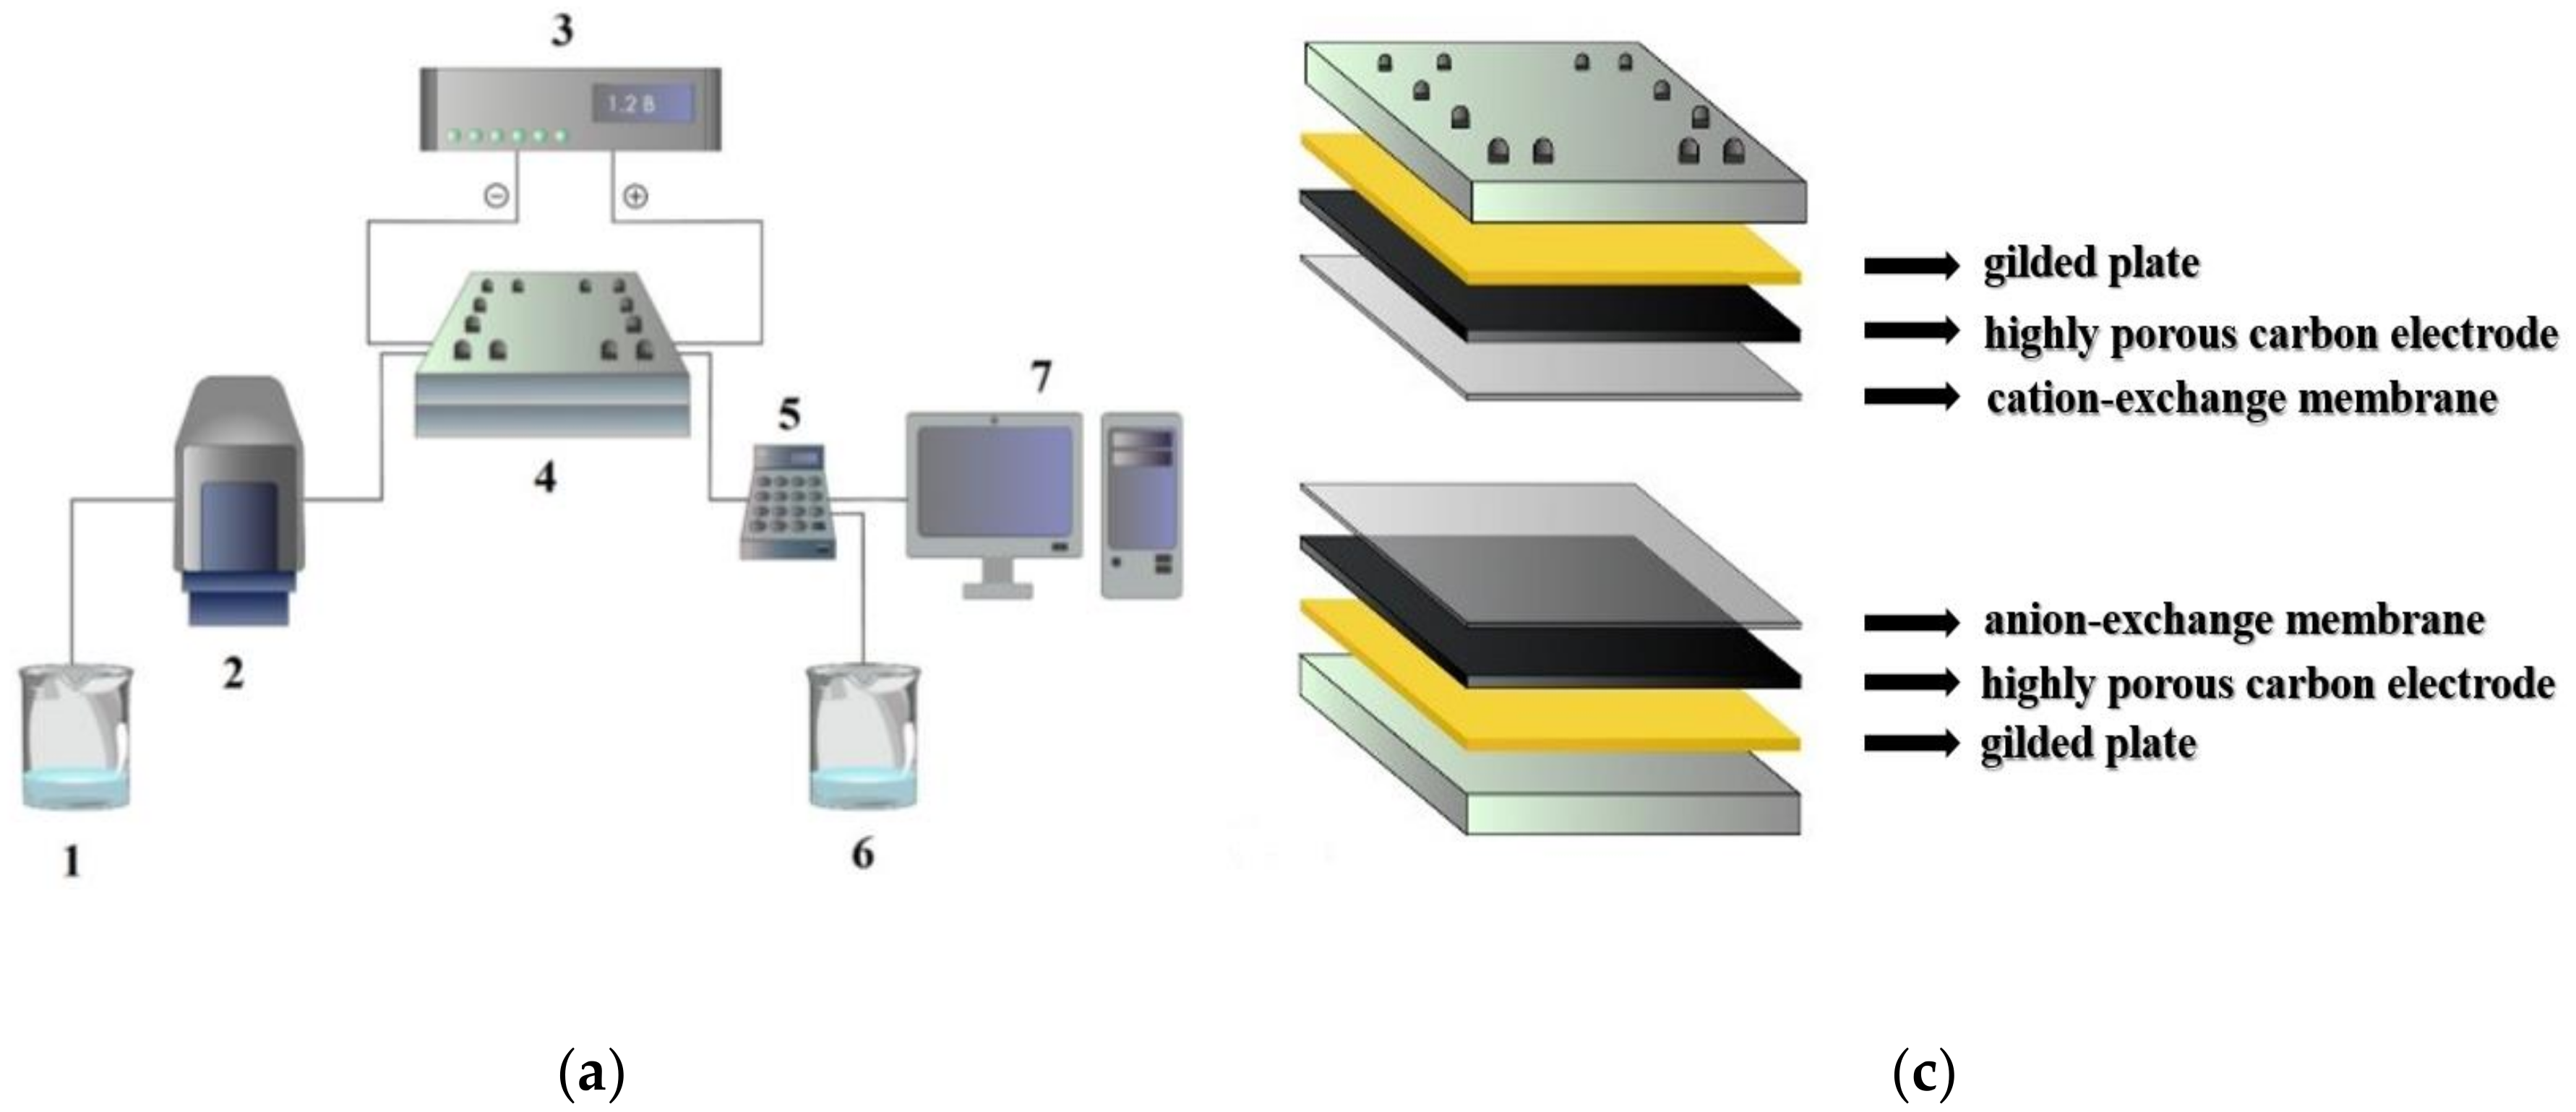
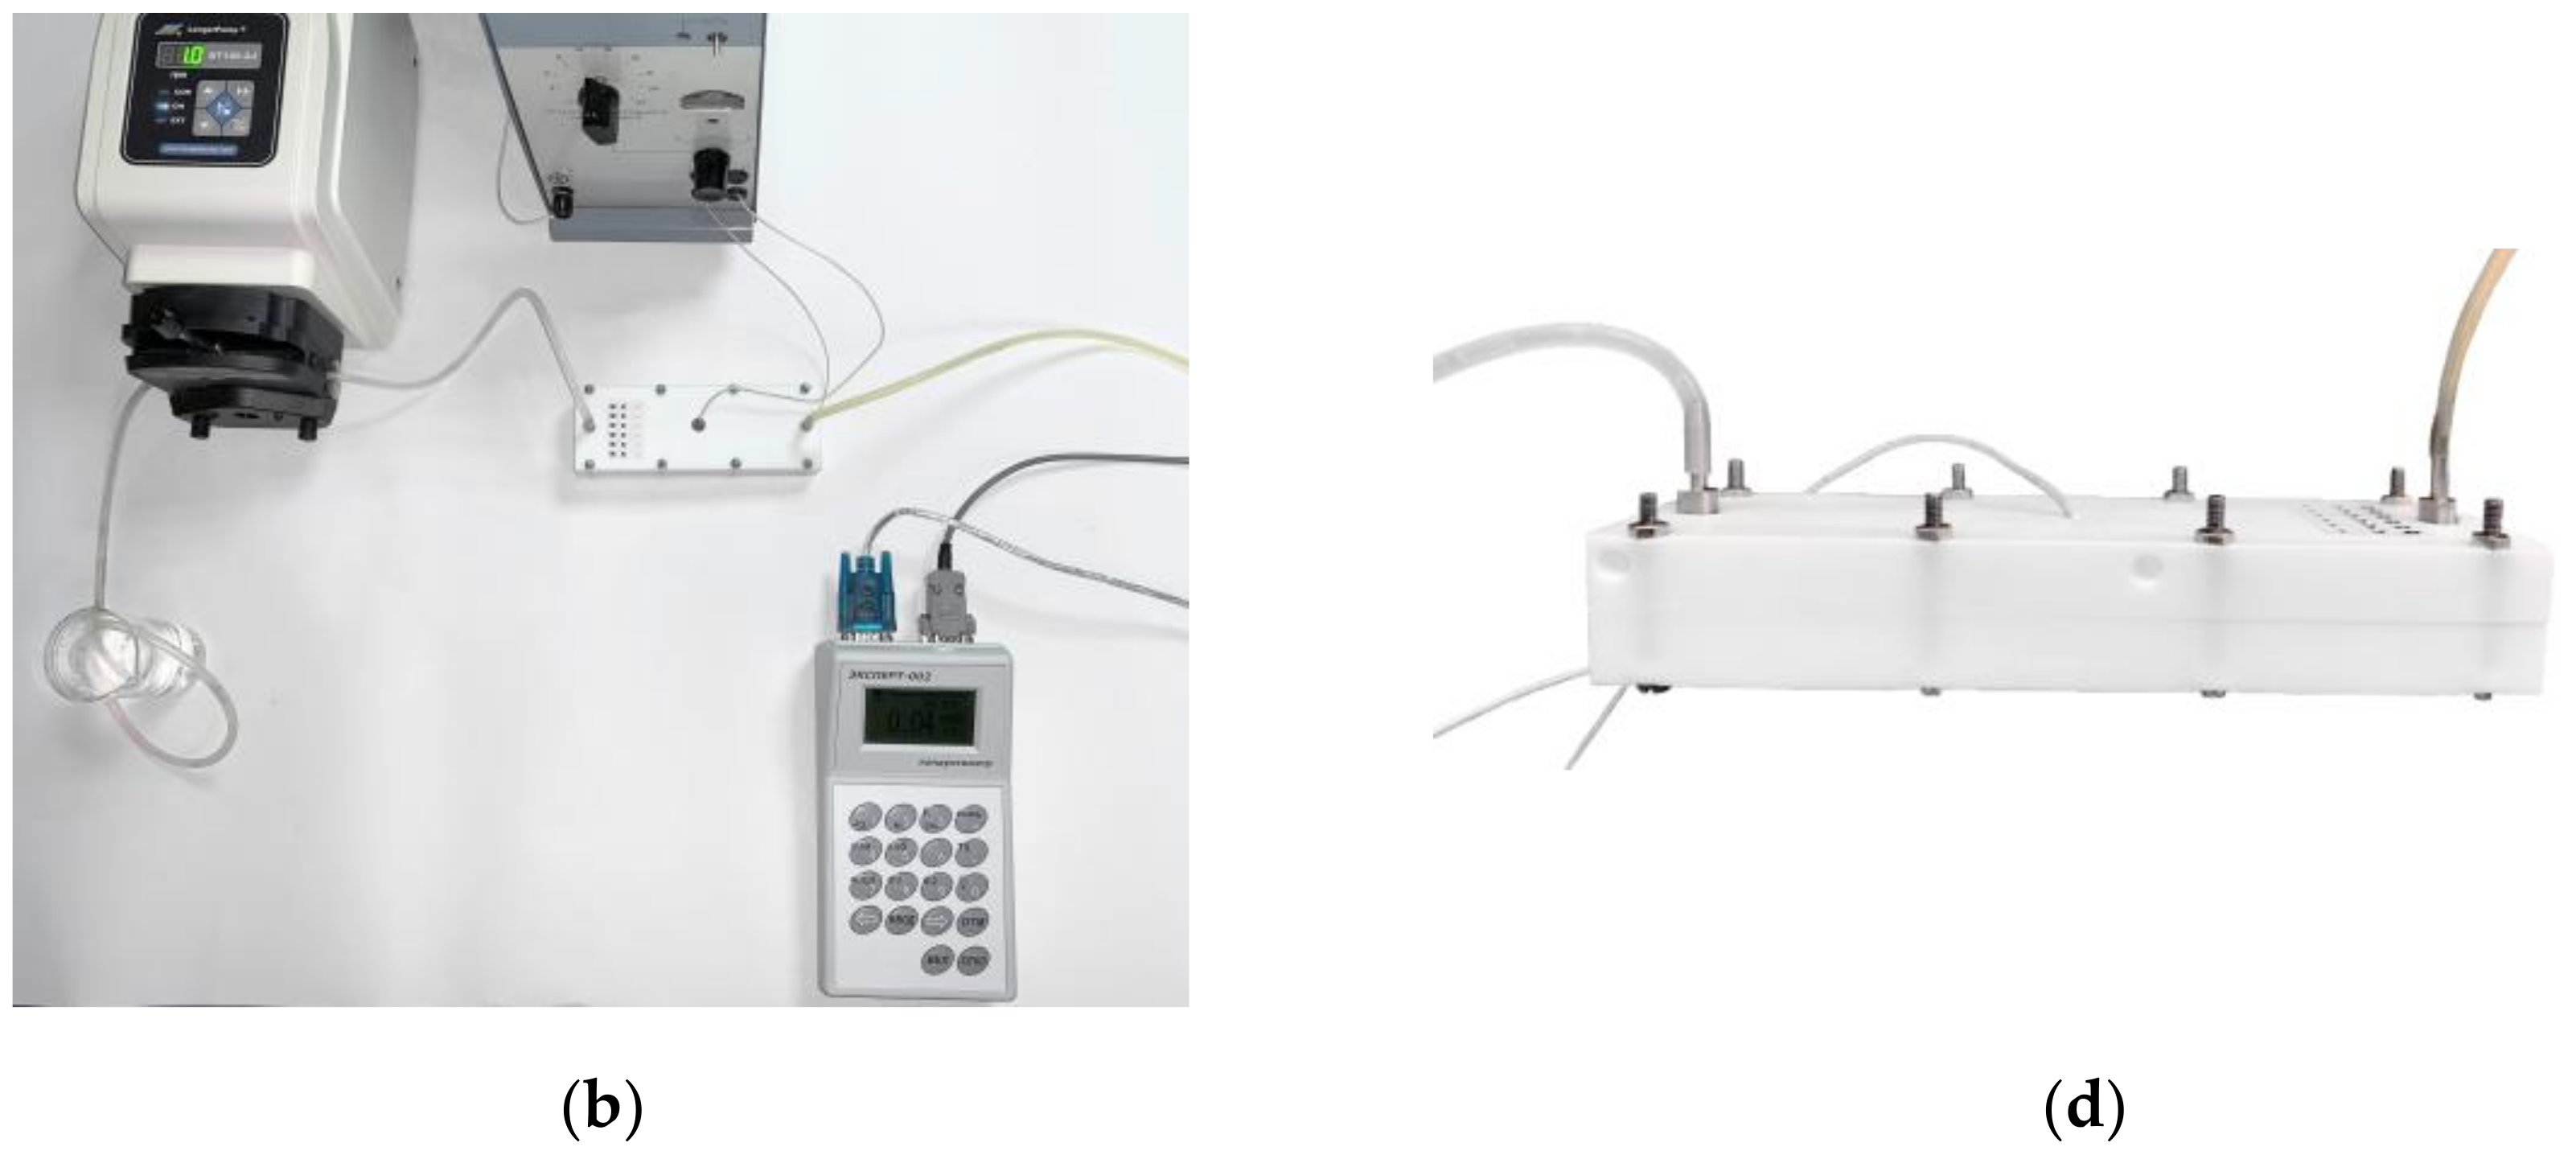
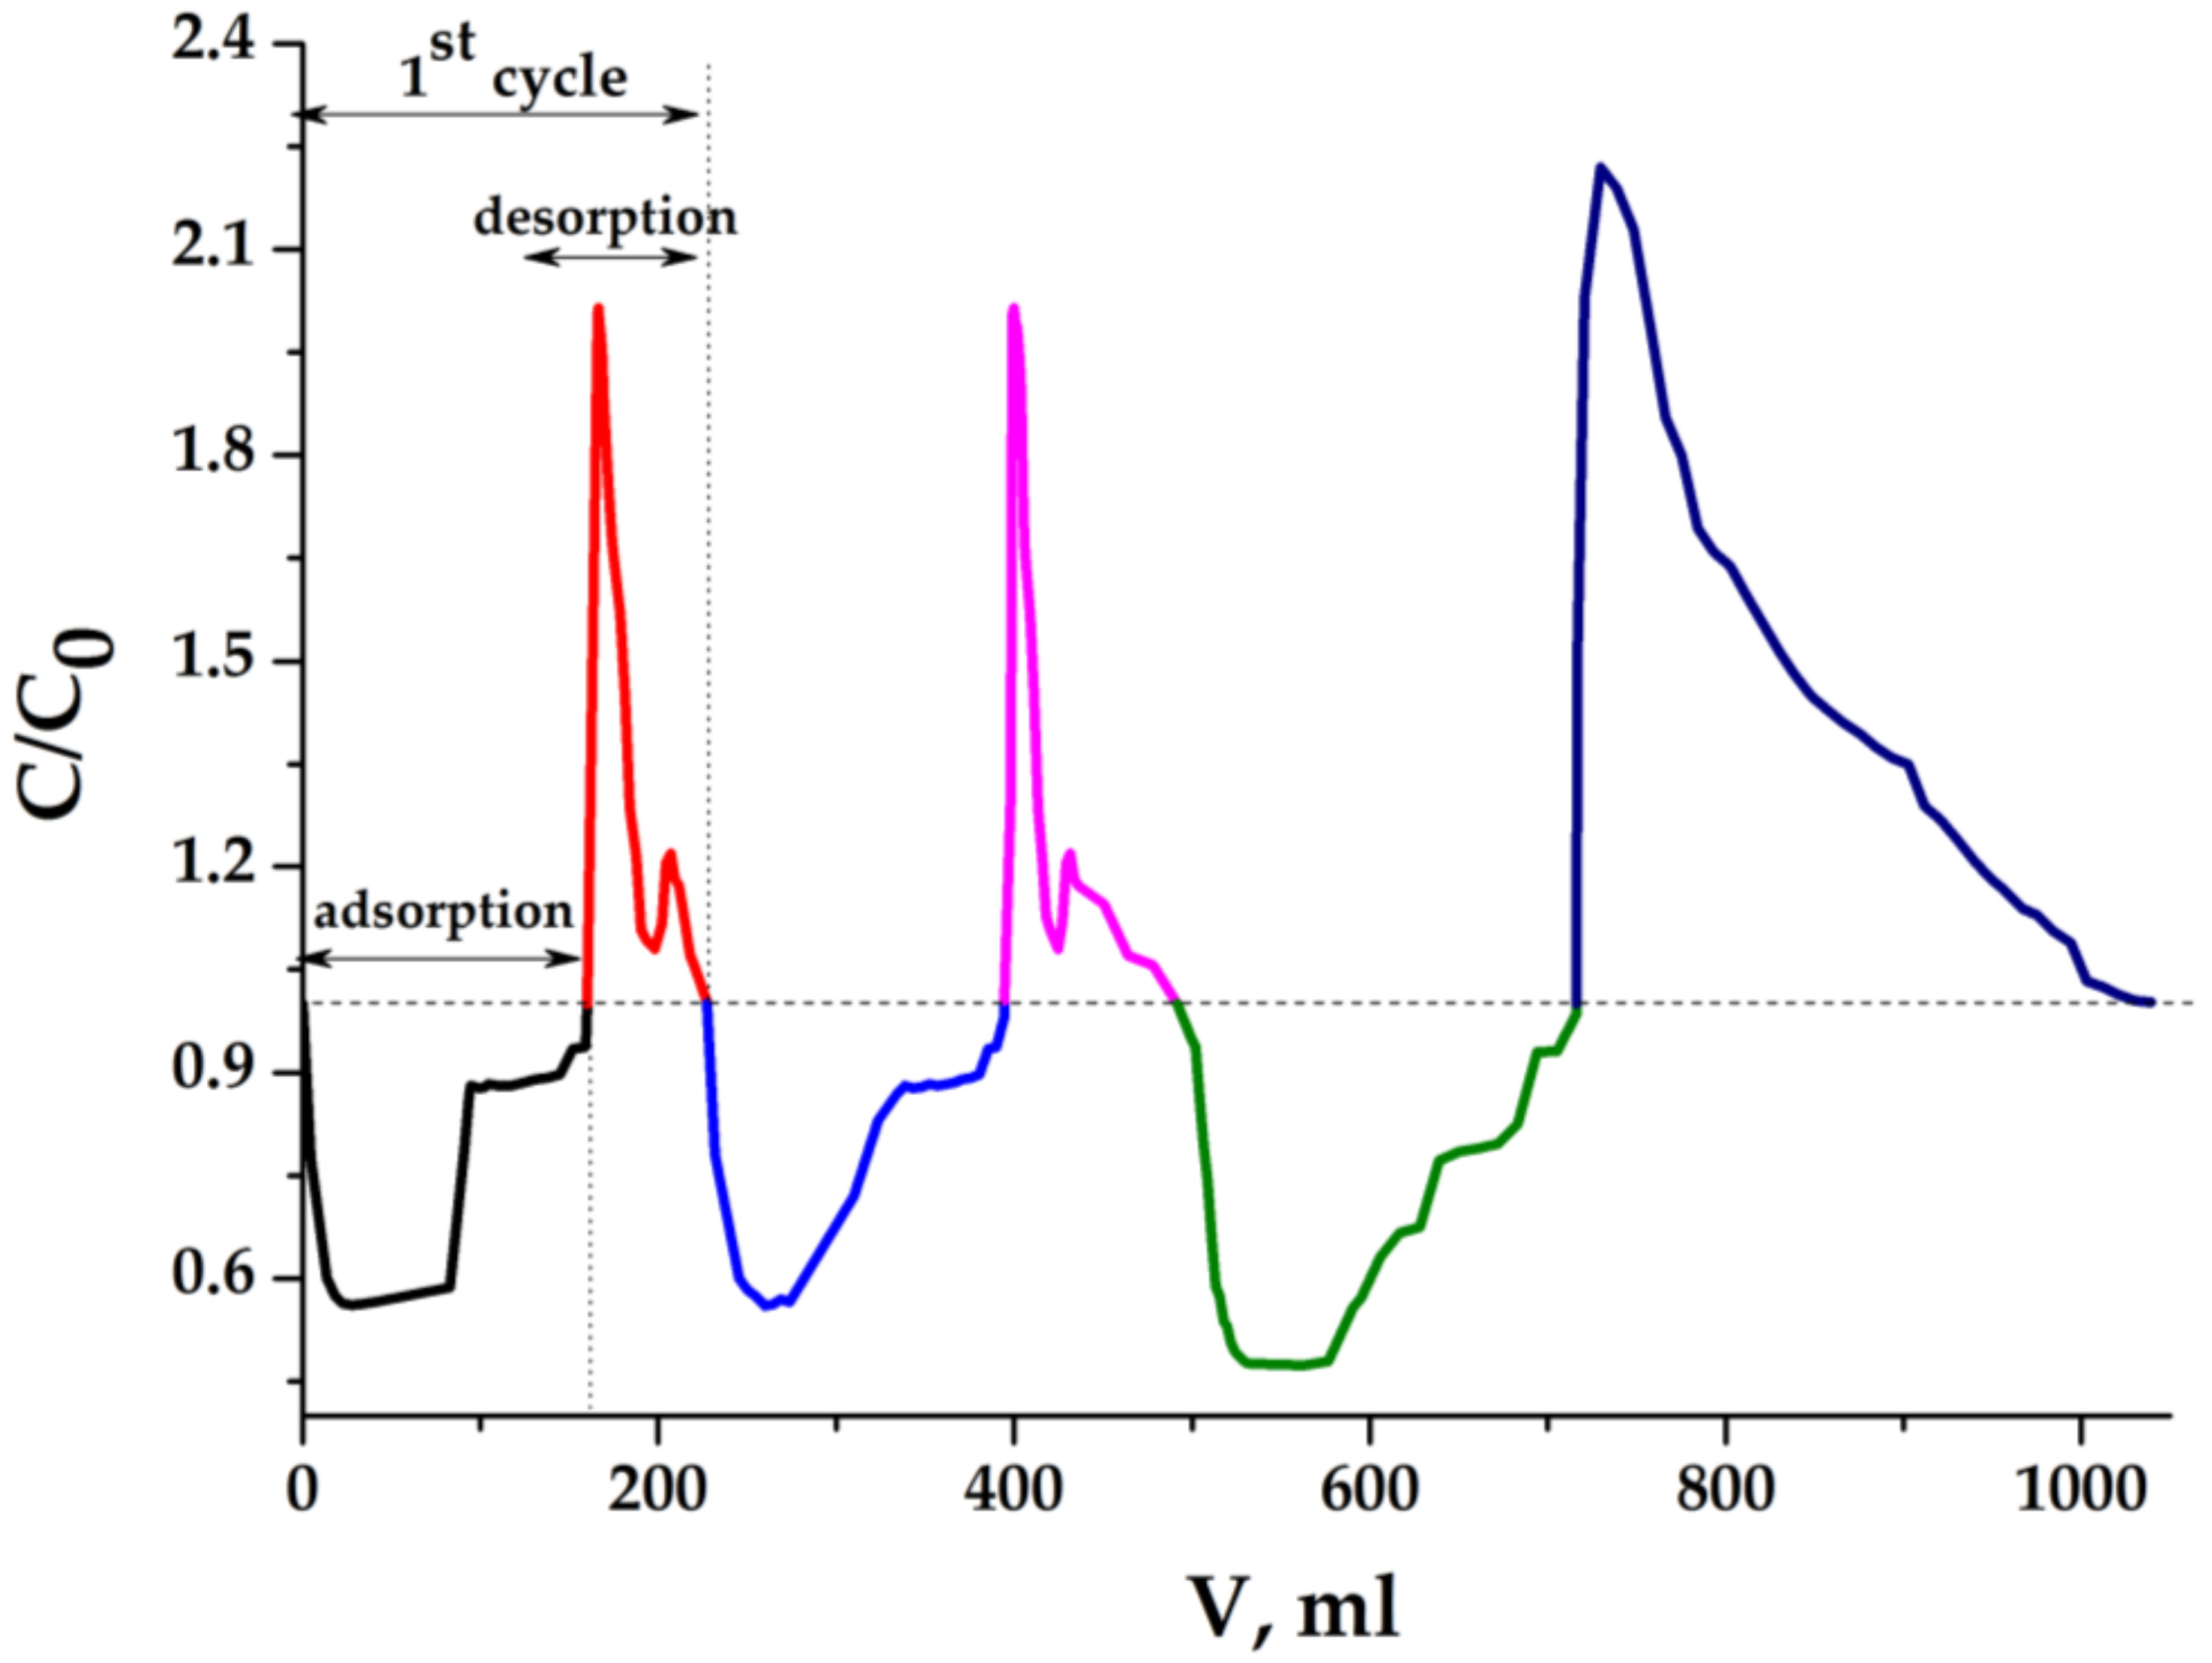
2.4. Organization of MCDI Process
2.5. Composite Aerogels in MCDI Process
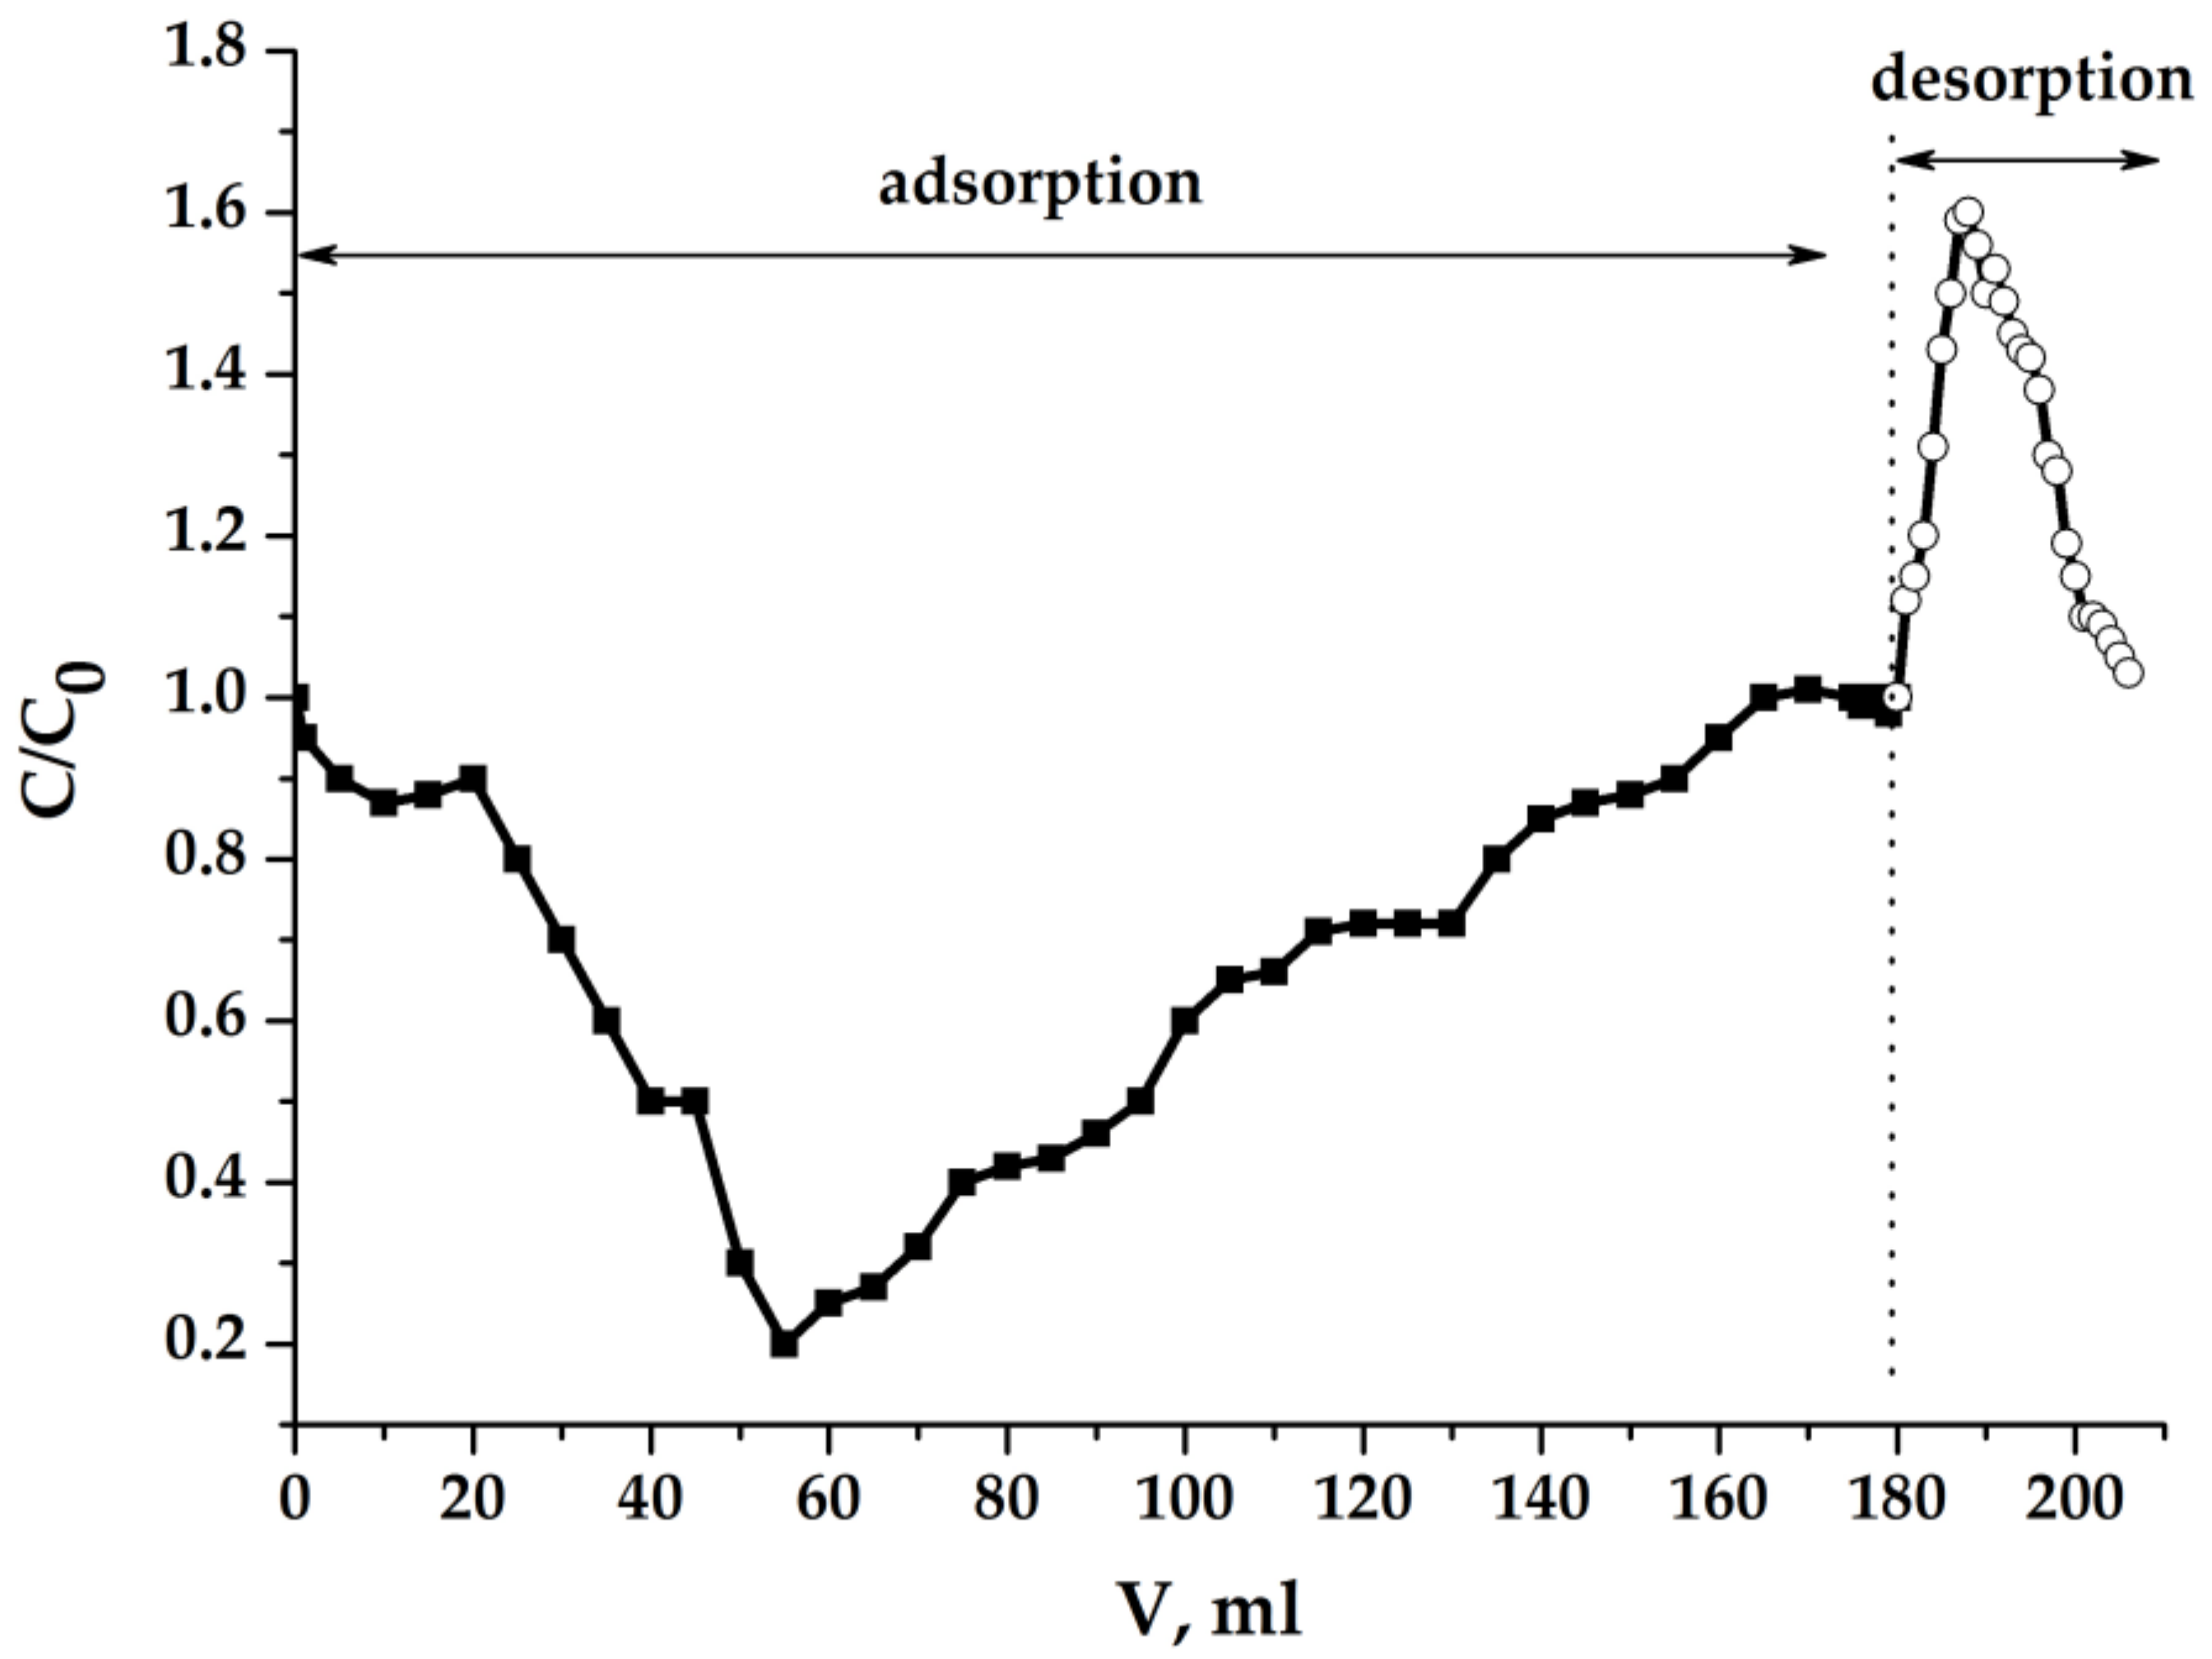
2.5.1. Results of Experiments with Light Sample
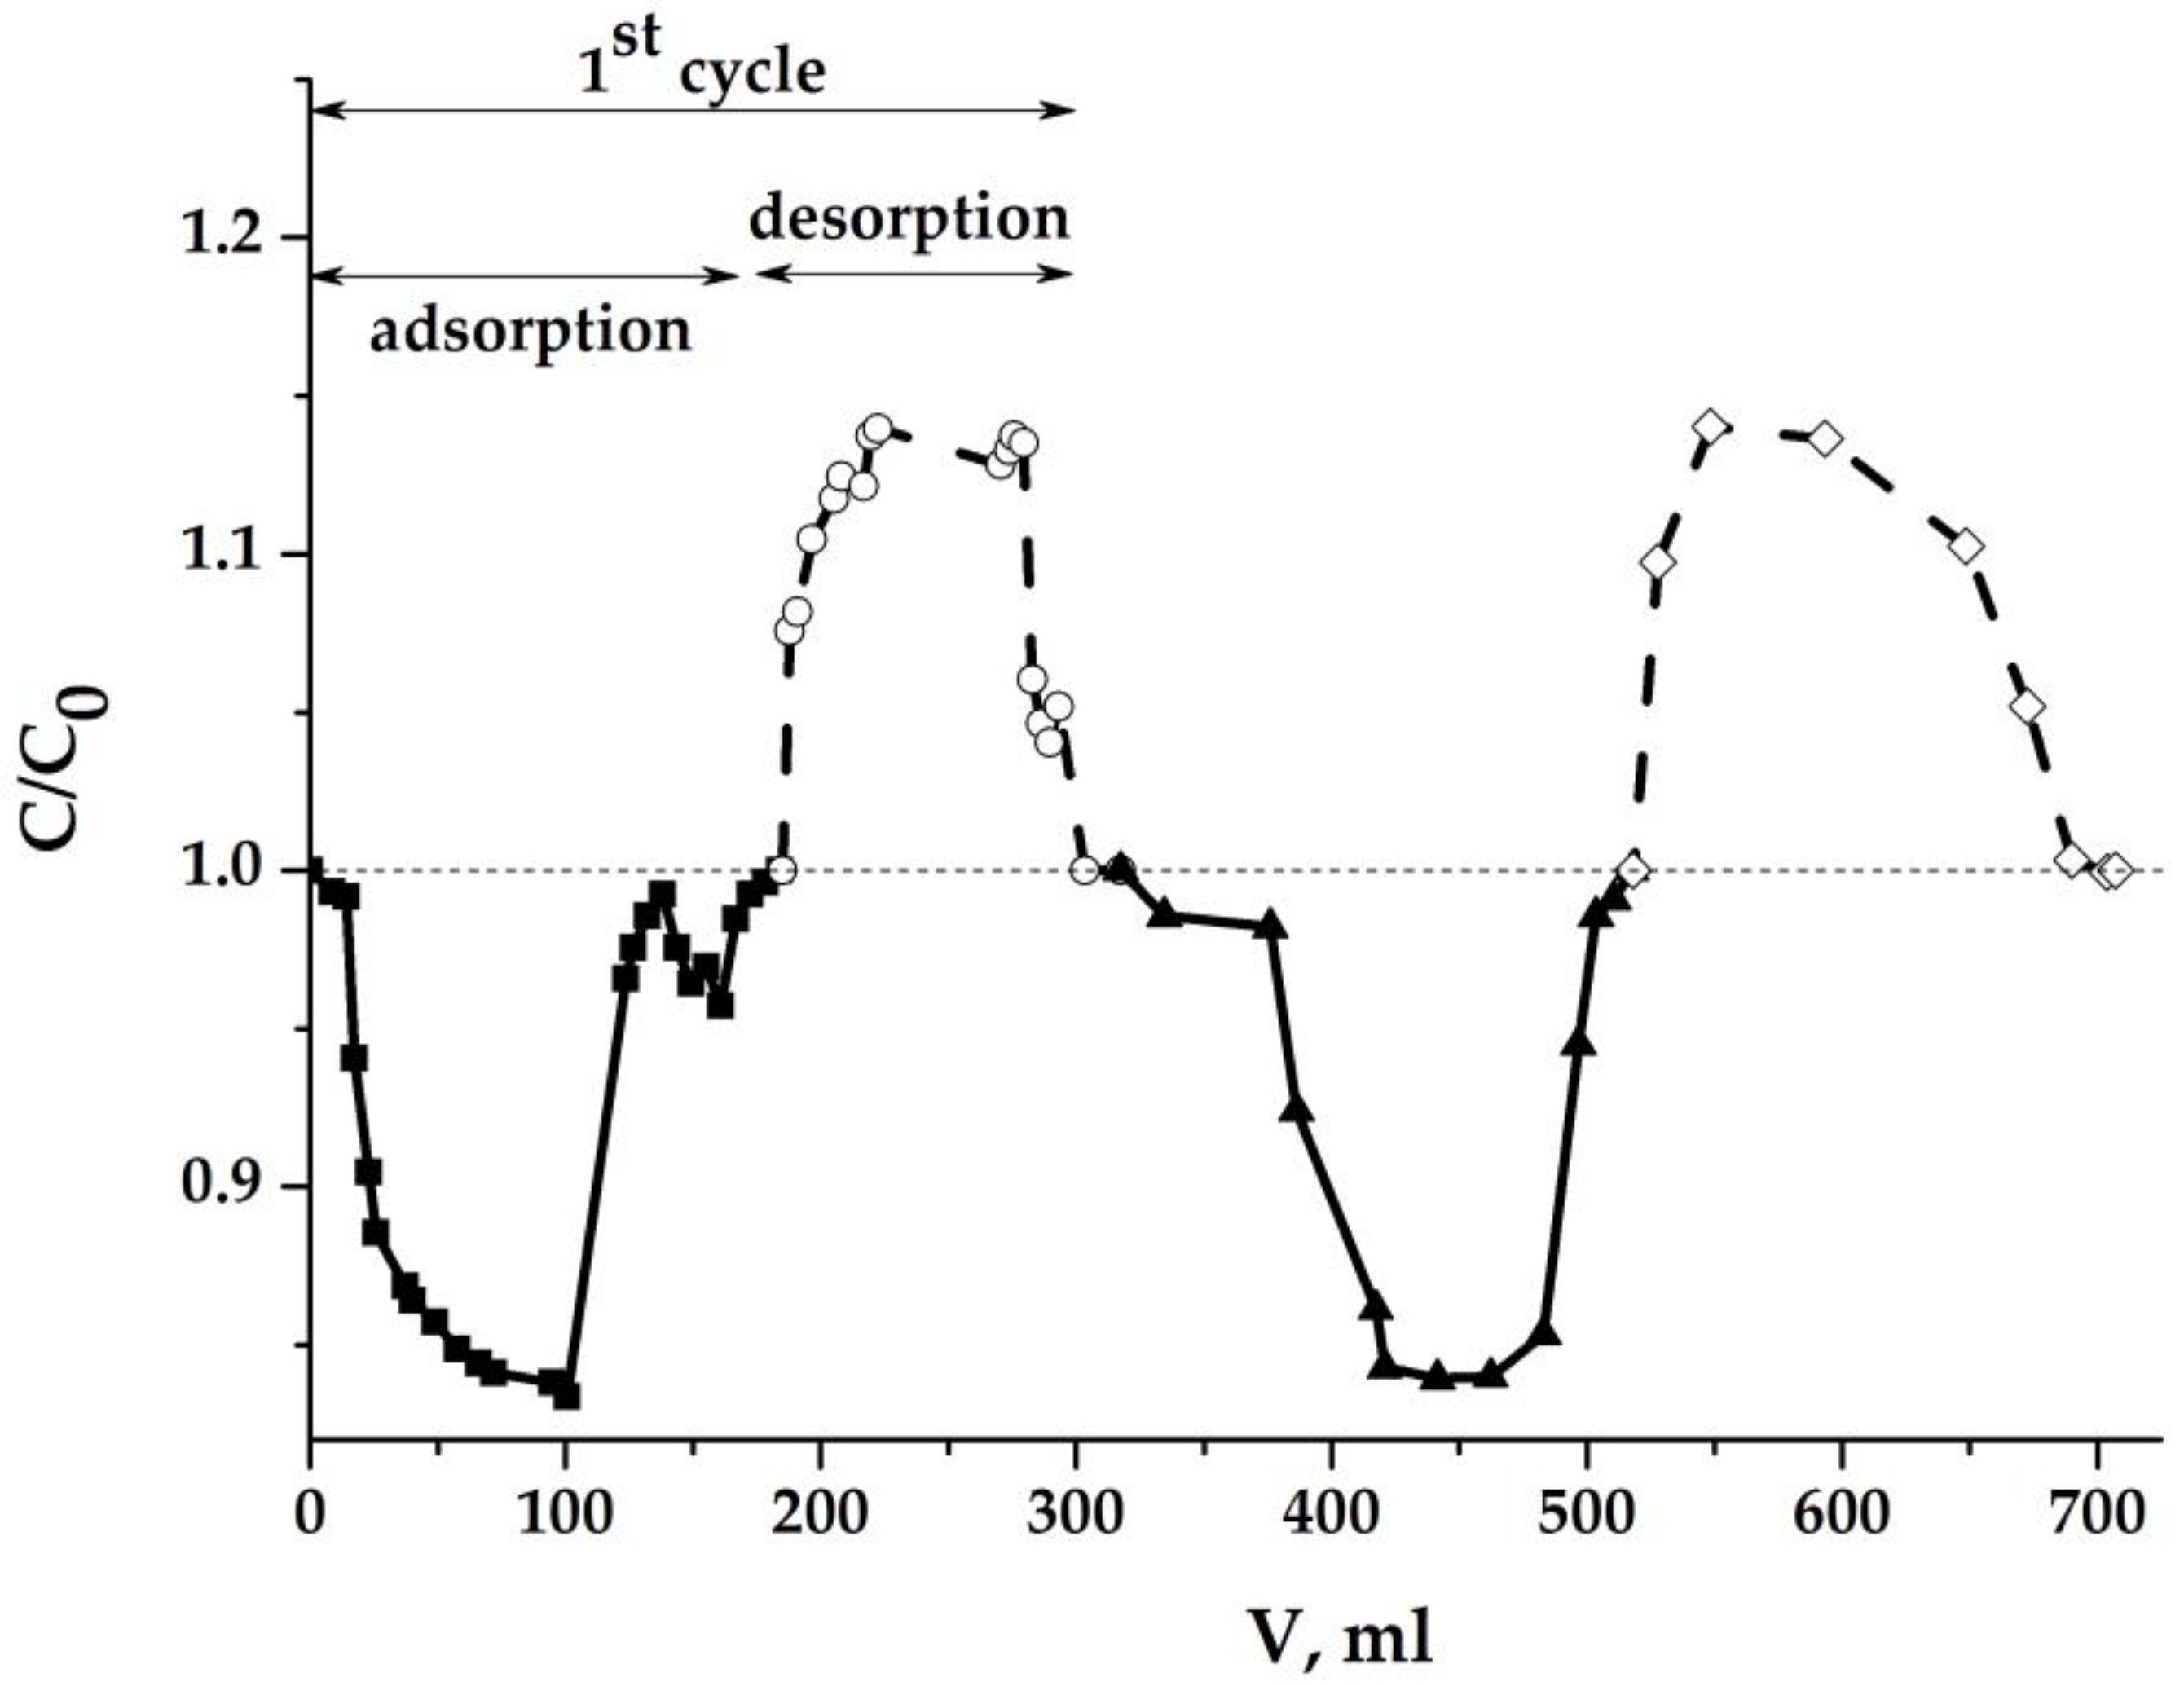
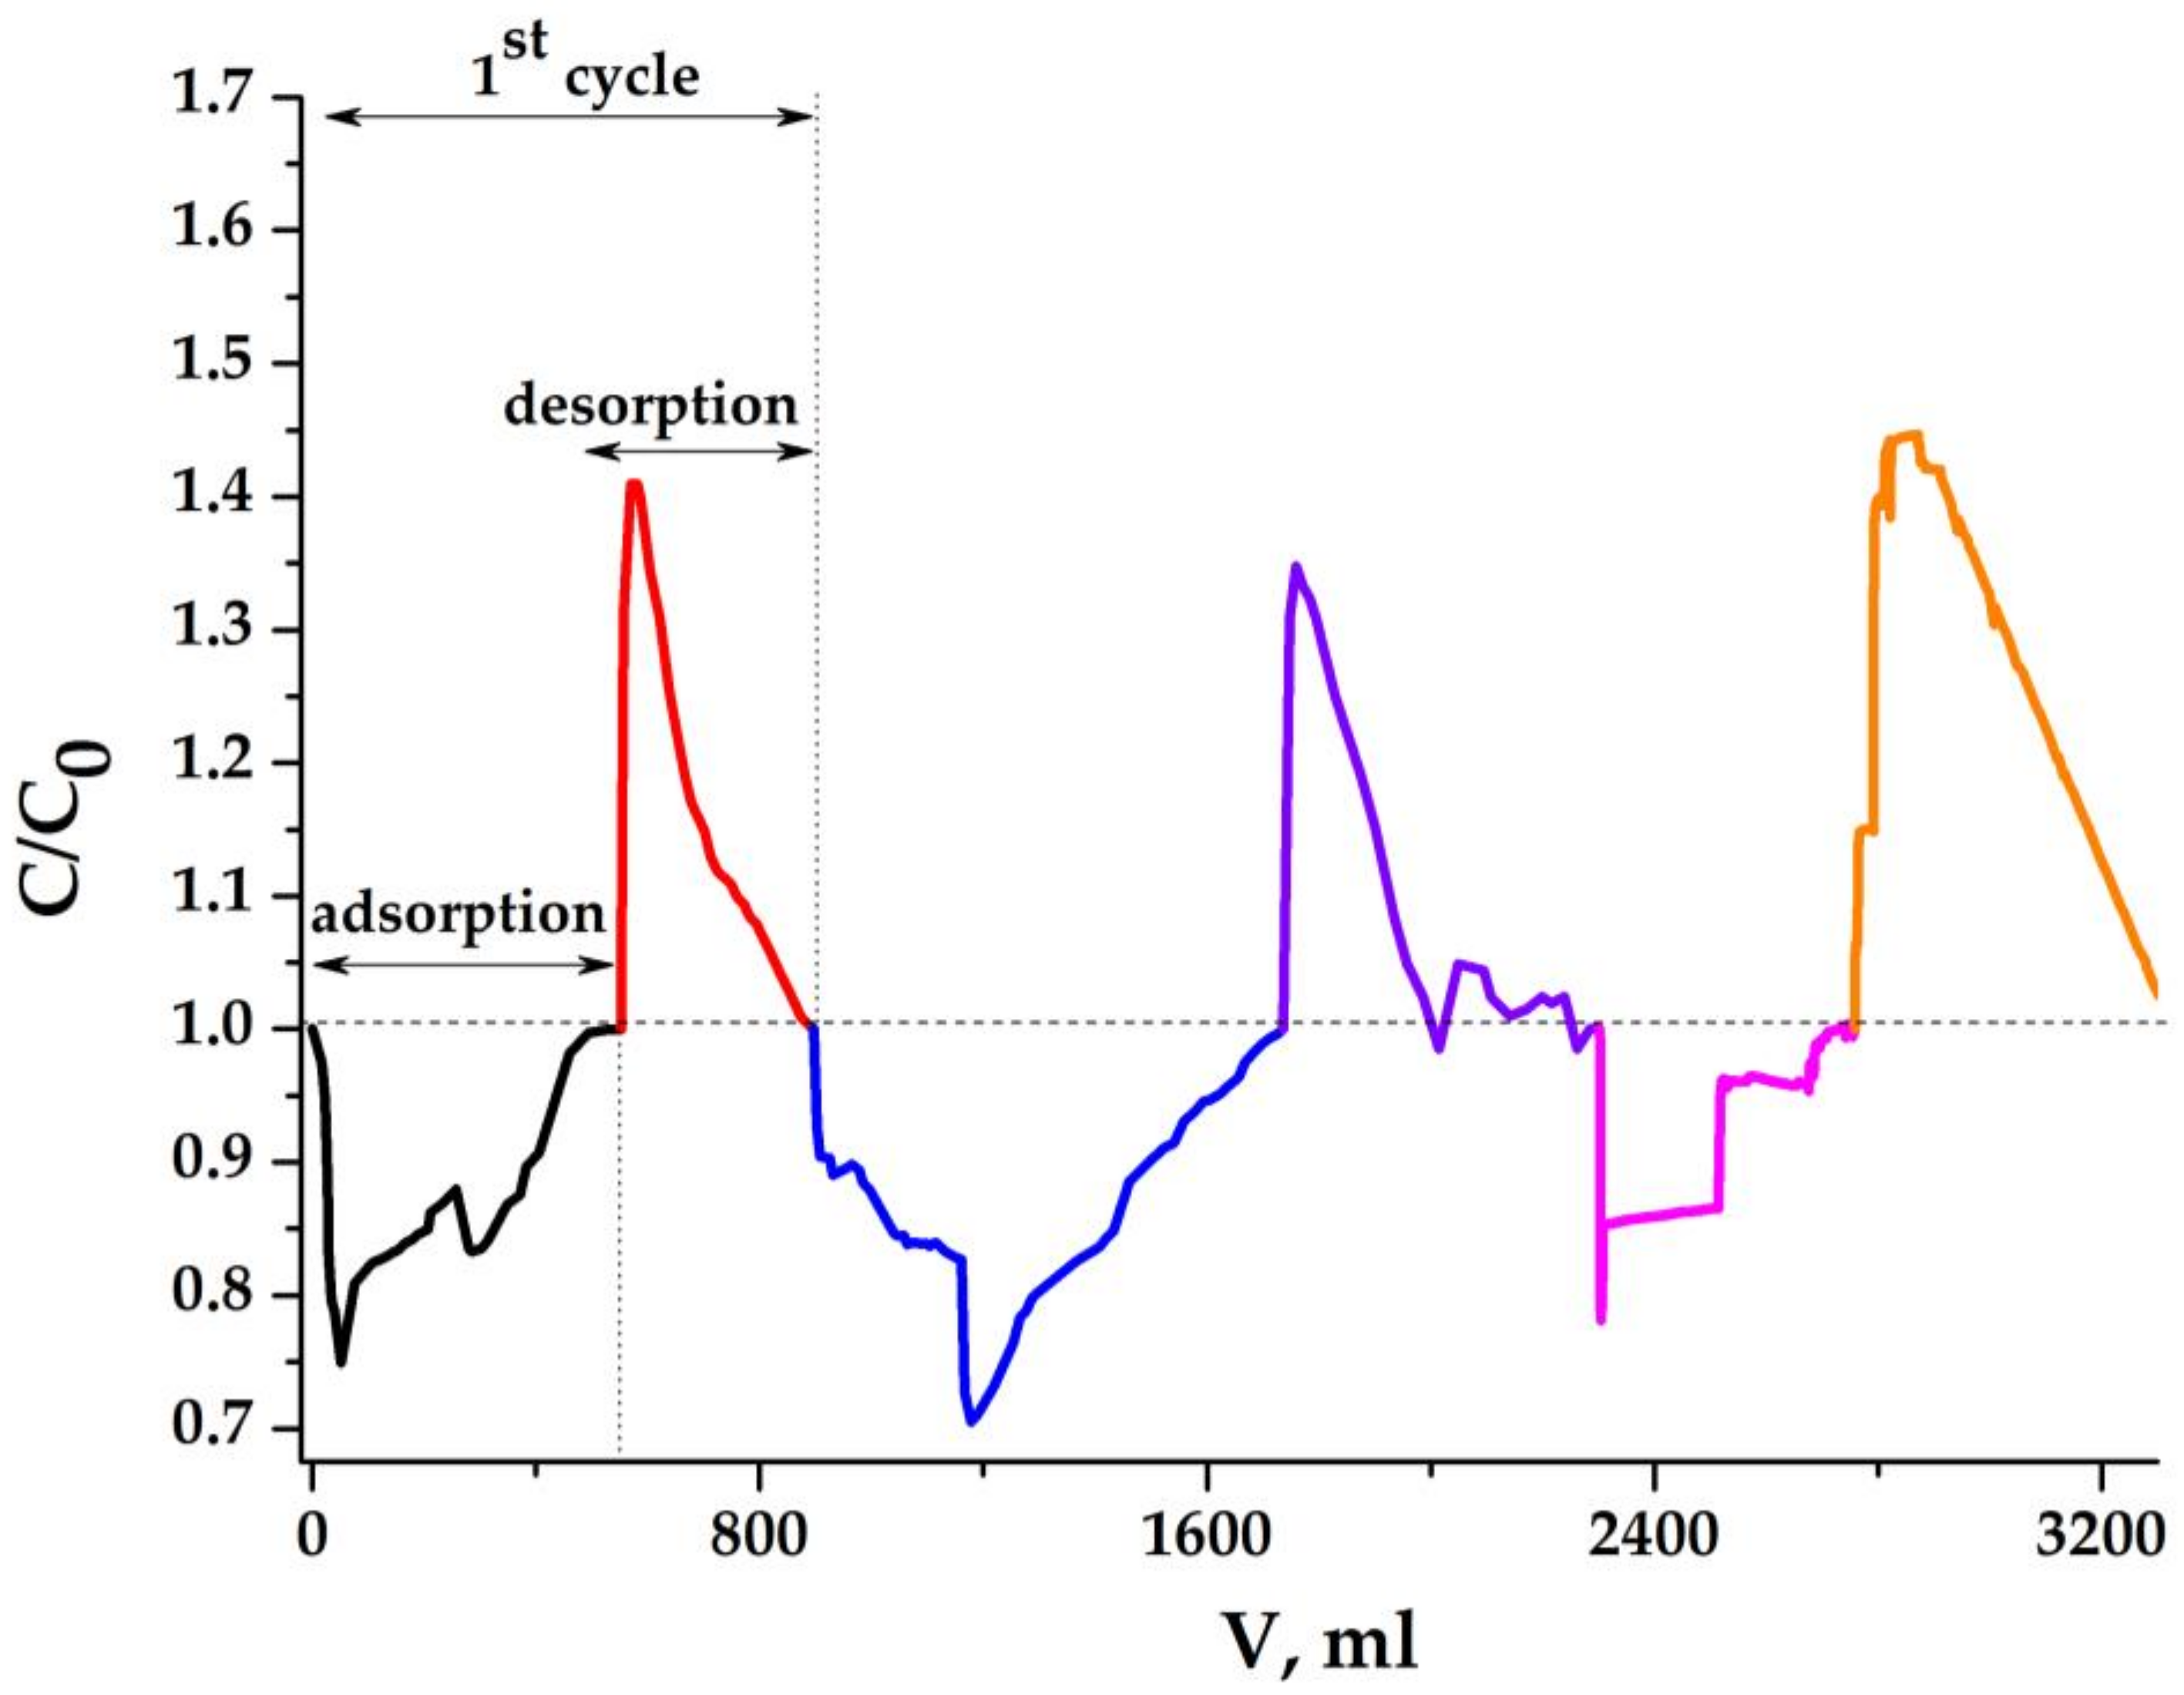
2.5.2. Results Obtained with the Dense Aerogel Sample
2.6. Synthesis and Some Properties of Graphene-Containing Mesoporous Carbon (GMC)
2.7. GMC Electrodes in MCDI Process
3. Materials and Methods
3.1. Obtaining Composite Aerogels
3.1.1. Light Aerogel Synthesis
3.1.2. Dense Aerogel Synthesis
3.2. Obtaining Mesoporous Activated Carbon and Electrodes Based on It
3.2.1. Obtaining Mesoporous Activated Carbon
3.2.2. Fabrication and Hydrophilization of Electrodes
3.3. Research Methods Used in the Work
3.4. Materials and Reagents for the Laboratory Setup for MCDI Experiments
4. Conclusions
Author Contributions
Funding
Acknowledgments
Conflicts of Interest
References
- Oren, Y. Capacitive deionization (CDI) for desalination and water treatment—Past, present and future (a review). Desalination 2008, 228, 10–29. [Google Scholar] [CrossRef]
- Porada, S.; Zhao, R.; Van der Wal, A.; Presser, V.; Biesheuvel, P.M. Review on the science and technology of water desalination by capacitive deionization. Pro. Mater. Sci. 2013, 58, 1388–1422. [Google Scholar] [CrossRef] [Green Version]
- Andelman, M.D.; Walker, G.S. Charge barrier flow-through capacitor. US Patent 6709560B2, 23 March 2004. [Google Scholar]
- Suss, M.E.; Porada, S.; Sun, X.; Biesheuvel, P.M.; Yoon, J.; Presser, V. Water desalination via capacitive deionization: What is it and what can we expect from it? Energy Environ. Sci. 2015, 8, 2296–2319. [Google Scholar] [CrossRef] [Green Version]
- Wan, W.; Zhang, R.; Li, W.; Liu, H.; Lin, Y.; Li, L.; Zhou, Y. Graphene-carbon nanotube aerogel as an ultralight, compressible and recyclable highly efficient absorbent for oil and dyes. Environ. Sci. Nano 2016, 3, 107–113. [Google Scholar] [CrossRef]
- Bakhia, T.; Khamizov, R.K.; Konov, M.A.; Bavizhev, M.D. A Method of Obtaining a Conductive Hydrophilic Aerogel Based on a Composite of Graphene and Carbon Nanotubes. RF Patent 2662484, 26 July 2018. [Google Scholar]
- Tkachev, A.G.; Melezhik, A.V.; Solomakho, G.V. A Method of Producing Mesoporous Carbon. RF Patent 2620404, 25 May 2017. [Google Scholar]
- Marcano, D.C.; Kosynkin, D.V.; Berlin, J.M.; Sinitskii, A.; Sun, Z.; Slesarev, A.S.; Alemany, L.B.; Lu, W.; Tour, J.M. Correction to improved synthesis of graphene oxide. ACS Nano 2018, 12, 2078. [Google Scholar] [CrossRef] [PubMed] [Green Version]
- Liu, H.; Li, T.; Liu, Y.; Qin, G.; Wang, X.; Chen, T. Glucose-reduced graphene oxide with excellent biocompatibility and photothermal efficiency as well as drug loading. Nanoscale Res. Let. 2016, 11, 1–10. [Google Scholar] [CrossRef] [PubMed] [Green Version]
- Chua, C.K.; Pumera, M. Chemical reduction of graphene oxide: A synthetic chemistry viewpoint. Chem. Soc. Rev. 2014, 43, 291–312. [Google Scholar] [CrossRef] [PubMed]
- Akhavan, O.; Ghaderi, E.; Aghayee, S.; Fereydooni, Y.; Talebi, A. The use of a glucose-reduced graphene oxide suspension for photothermal cancer therapy. J. Mater. Chem. 2012, 22, 13773–13781. [Google Scholar] [CrossRef]
- Huang, J.; Li, Z.; Wu, X.; Wang, J.; Yang, S. Poly(vinyl alcohol)-mediated graphene aerogels with tailorable architectures and advanced properties for anisotropic sensing. J. Phys. Chem. C 2019, 123, 3781–3789. [Google Scholar] [CrossRef]
- Haiyan, S.; Zhen, X.; Chao, G. Multifunctional, ultra-flyweight, synergistically assembled carbon aerogels. Adv. Mater. 2013, 25, 2554–2560. [Google Scholar]
- Yin, F.; Wu, S.; Wang, Y.; Wu, L.; Yuan, P.; Wang, X. Self-assembly of mildly reduced graphene oxide monolayer for enhanced Raman scattering. J. Solid State Chem. 2016, 237, 57–63. [Google Scholar] [CrossRef]
- Tokmachev, M.G.; Tikhonov, N.A. Simulation of capacitive deionization accounting the change of Stern layer thickness. J. Math. Chem. 2019, 57, 2169–2181. [Google Scholar] [CrossRef]
- Marmanis, D.; Christoforidis, A.; Ouzounis, K.; Dermentzis, K. Electrochemical desalination of NaCl solutions by electrosorption on nano-porous carbon aerogel electrodes. Global NEST J. 2014, 16, 609–615. [Google Scholar]
- Zhuyin, S.; Qinghan, M.; Xuetong, Z.; Rui, M.; Bing, C. Green synthesis of carbon nanotube-graphene hybrid aerogels and their use as versatile agents for water purification. J. Mater. Chem. 2012, 22, 8767–8771. [Google Scholar]
- Zhu, G.; Wang, W.Q.; Li, X.; Zhu, J.; Wang, H.; Zhang, L. Design and fabrication of a graphene/carbon nanotubes/activated carbon hybrid and its application for capacitive deionization. RSC Adv. 2016, 6, 5817–5823. [Google Scholar] [CrossRef]
- Teng, H.; Chang, Y.J.; Hsieh, C.T. Performance of electric double-layer capacitors using carbons prepared from phenol-formaldehyde resins by KOH etching. Carbon 2001, 39, 1981–1987. [Google Scholar] [CrossRef]
- Fan, W.; Zhang, L.; Liu, T. Graphene-Carbon Nanotube Hybrids for Energy and Environmental Applications; Springer Briefs in Molecular Science; Springer: Singapore, 2017; pp. 1–104. [Google Scholar] [CrossRef]
- Kovtyukhova, N.I.; Ollivier, P.J.; Martin, B.R.; Mallouk, T.E.; Chizhik, S.A.; Buzaneva, E.V.; Gorchinskiy, A.D. Layer-by-layer assembly of ultrathin composite films from micron-sized graphite oxide sheets and polycations. Chem. Mater. 1999, 11, 771–778. [Google Scholar] [CrossRef]
- Melezhyk, A.V.; Tkachev, A.G. Synthesis of graphene nanoplates from peroxosulfate graphite intercalation compounds. Nanosystems Phy. Math. 2014, 5, 294–306. [Google Scholar]
- Imran, A.; Burakova, I.; Galunin, E.; Burakov, A.; Mkrtchyan, E.; Melezhik, A.; Kurnosov, D.; Tkachev, A.; Grachev, V. High-speed and high-capacity removal of methyl orange and malachite green in water using newly developed mesoporous carbon: Kinetic and isotherm studies. ACS Omega 2019, 4, 19293–19306. [Google Scholar]
Sample Availability: Samples of composite graphene-containing porous materials from carbon are available from the authors. |


| Sample | Conductivity before Hydrophilization, mS/m | Conductivity after Hydrophilization, mS/m | Density of Monolith (ρ), g/cm3 | Porosity, ε∙100% |
|---|---|---|---|---|
| 1 (light) | 2000 | 2000 | 0.02 | 99.1 |
| 2 (dense) | 1900 | 1900 | 0.12 | 95.0 |
| Samples | Functional Groups and Fragments | Total at. % | ||
|---|---|---|---|---|
| O−C=O 1, O=C | C−O−C, OH−C | O 1−C=O | ||
| Graphene oxide | 3.47 | 24.05 | 3.27 | 30.79 |
| Composite aerogel after hydrophilization | 4.32 | 20.80 | 3.27 | 28.39 |
| Composite aerogel before hydrophilization | 4.07 | 19.29 | 2.63 | 25.99 |
| Spectrum | Element Content, at. % | Binding Energy, eV | Fraction, at. % | Type of Bond |
|---|---|---|---|---|
| O1s | 29.06 | 530.3 | 0.67 | O− |
| 531.4 | 4.32 | O−C=O, O=C | ||
| 532.5 | 20.80 | C−O−C, OH−C | ||
| 533.4 | 3.27 | O−C=O | ||
| C1s | 70.94 | 284.2 | 15.77 | C−C (sp2) |
| 284.9 | 19.58 | C−C (sp3) | ||
| 286.8 | 28.70 | C−O−C, C−OH | ||
| 287.9 | 3.40 | C=O, O−C−O | ||
| 288.7 | 3.49 | O=C−O |
| C, eqv/dm3 | CNaCl, g/dm3 | d, nm |
|---|---|---|
| 0.01 | 0.6 | 100 |
| 0.1 | 5.9 | 10 |
| 1.0 | 58.5 | 1.0 |
| Porosity, % | Density, g/cm3 | Specific Surface Area (S BET—S ext.), m2/g | Average Pore Width, nm | |
|---|---|---|---|---|
| GMC | 90 | 0.22 | 2370 | 3.55 |
| Electrode | 84.2 | 0.36 | 1675 | 3.1 |
| Sample | Carbon Aerogel from Activated Fibers [16] | Aerogel MWCNTs-Graphene [17] | MWCNTs Powder [17] | Graphene Powder [17] | Dense Aerogel MWCNTs-Graphene (This Work) | Graphene-Containing Mesoporous Carbon (This Work) |
|---|---|---|---|---|---|---|
| Capacity, mg/g | 14.2 | 24.5 | 17.5 | 12.0 | 25.3 | 14.6 |
| Capacity, mg/cm3 | 5.7 | 1.0 | - | - | 3.0 | 5.3 |
© 2020 by the authors. Licensee MDPI, Basel, Switzerland. This article is an open access article distributed under the terms and conditions of the Creative Commons Attribution (CC BY) license (http://creativecommons.org/licenses/by/4.0/).
Share and Cite
Bakhia, T.; Khamizov, R.K.; Bavizhev, Z.R.; Bavizhev, M.D.; Konov, M.A.; Kozlov, D.A.; Tikhonova, S.A.; Maslakov, K.I.; Ashurov, M.S.; Melezhik, A.V.; et al. Composite Graphene-Containing Porous Materials from Carbon for Capacitive Deionization of Water. Molecules 2020, 25, 2620. https://doi.org/10.3390/molecules25112620
Bakhia T, Khamizov RK, Bavizhev ZR, Bavizhev MD, Konov MA, Kozlov DA, Tikhonova SA, Maslakov KI, Ashurov MS, Melezhik AV, et al. Composite Graphene-Containing Porous Materials from Carbon for Capacitive Deionization of Water. Molecules. 2020; 25(11):2620. https://doi.org/10.3390/molecules25112620
Chicago/Turabian StyleBakhia, Tamuna, Ruslan Kh. Khamizov, Zaur R. Bavizhev, Mukhamed D. Bavizhev, Magomet A. Konov, Daniil A. Kozlov, Snezhana A. Tikhonova, Konstantin I. Maslakov, Matin S. Ashurov, Alexander V. Melezhik, and et al. 2020. "Composite Graphene-Containing Porous Materials from Carbon for Capacitive Deionization of Water" Molecules 25, no. 11: 2620. https://doi.org/10.3390/molecules25112620
APA StyleBakhia, T., Khamizov, R. K., Bavizhev, Z. R., Bavizhev, M. D., Konov, M. A., Kozlov, D. A., Tikhonova, S. A., Maslakov, K. I., Ashurov, M. S., Melezhik, A. V., Kurnosov, D. A., Burakov, A. E., & Tkachev, A. G. (2020). Composite Graphene-Containing Porous Materials from Carbon for Capacitive Deionization of Water. Molecules, 25(11), 2620. https://doi.org/10.3390/molecules25112620