
Screening Risk Assessment of Agricultural Areas under a High Level of Anthropopressure Based on Chemical Indexes and VIS-NIR Spectroscopy


Abstract
:1. Introduction
2. Results and Discussion
2.1. Characteristics of Soil Properties and PAHs Concentrations
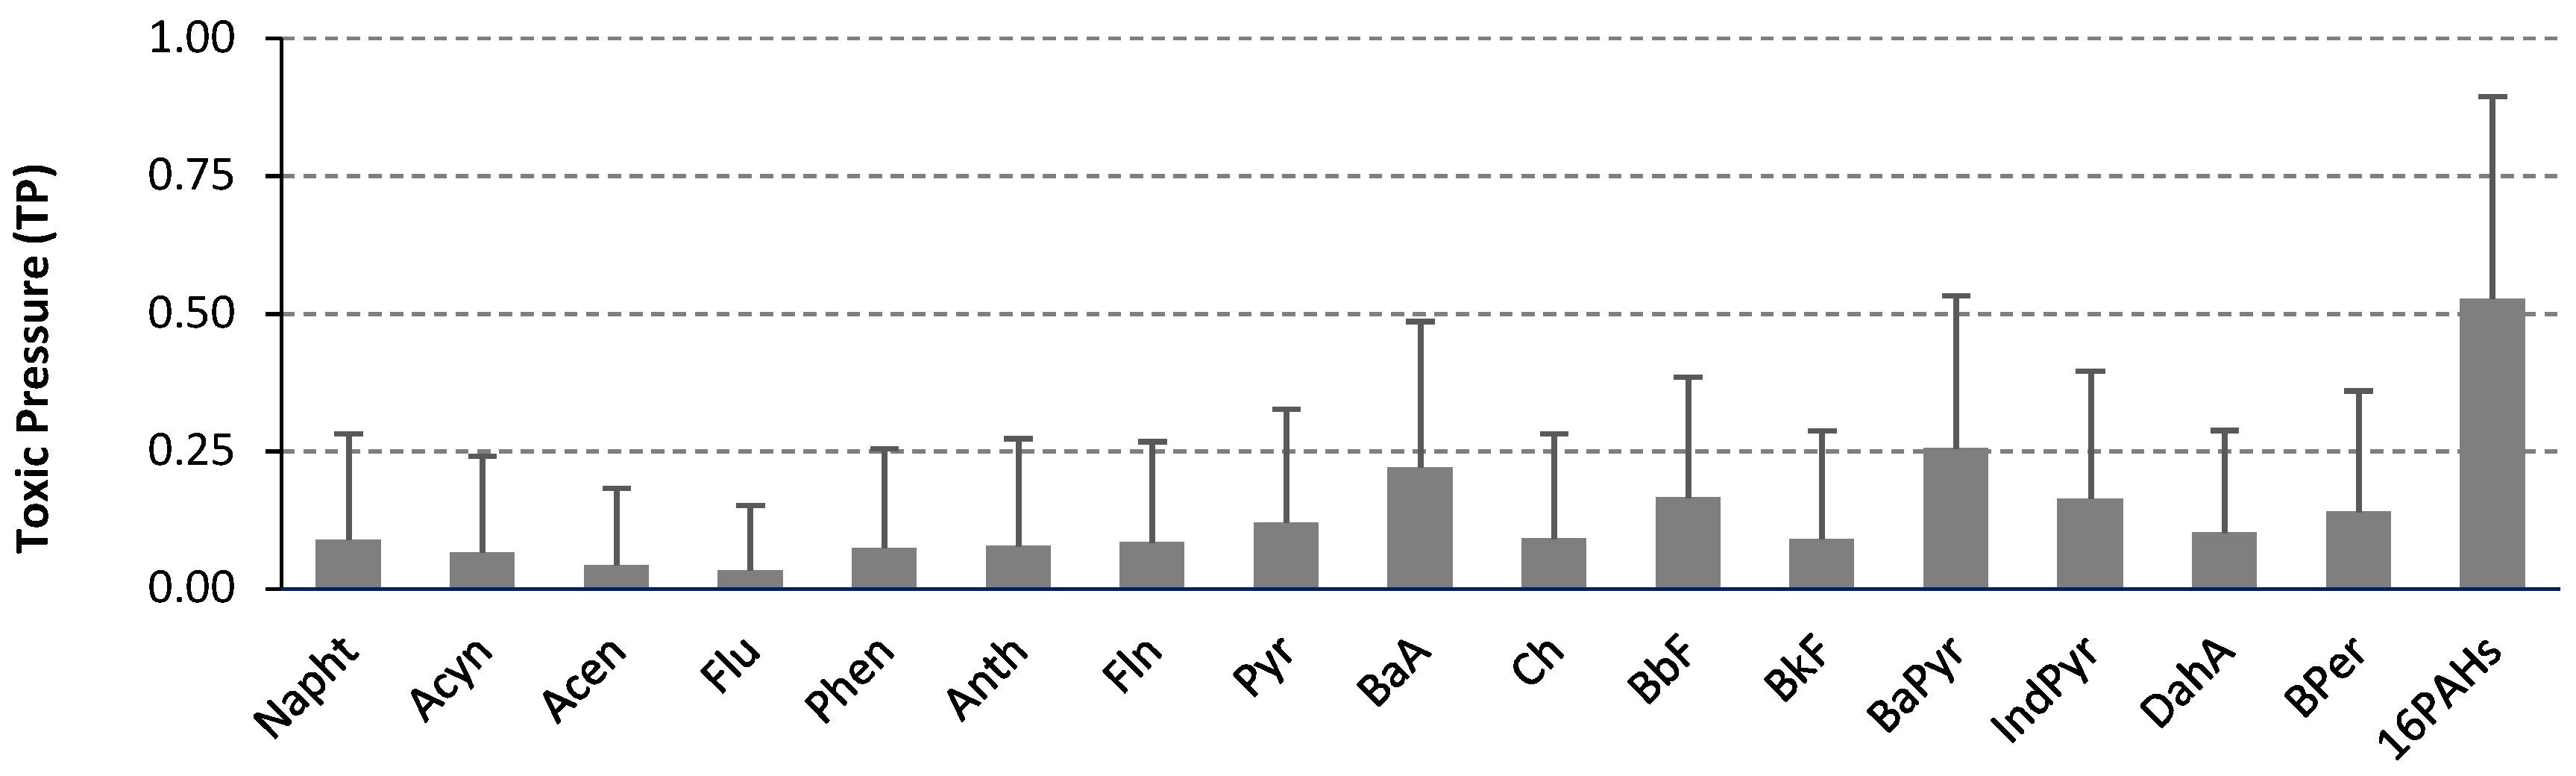
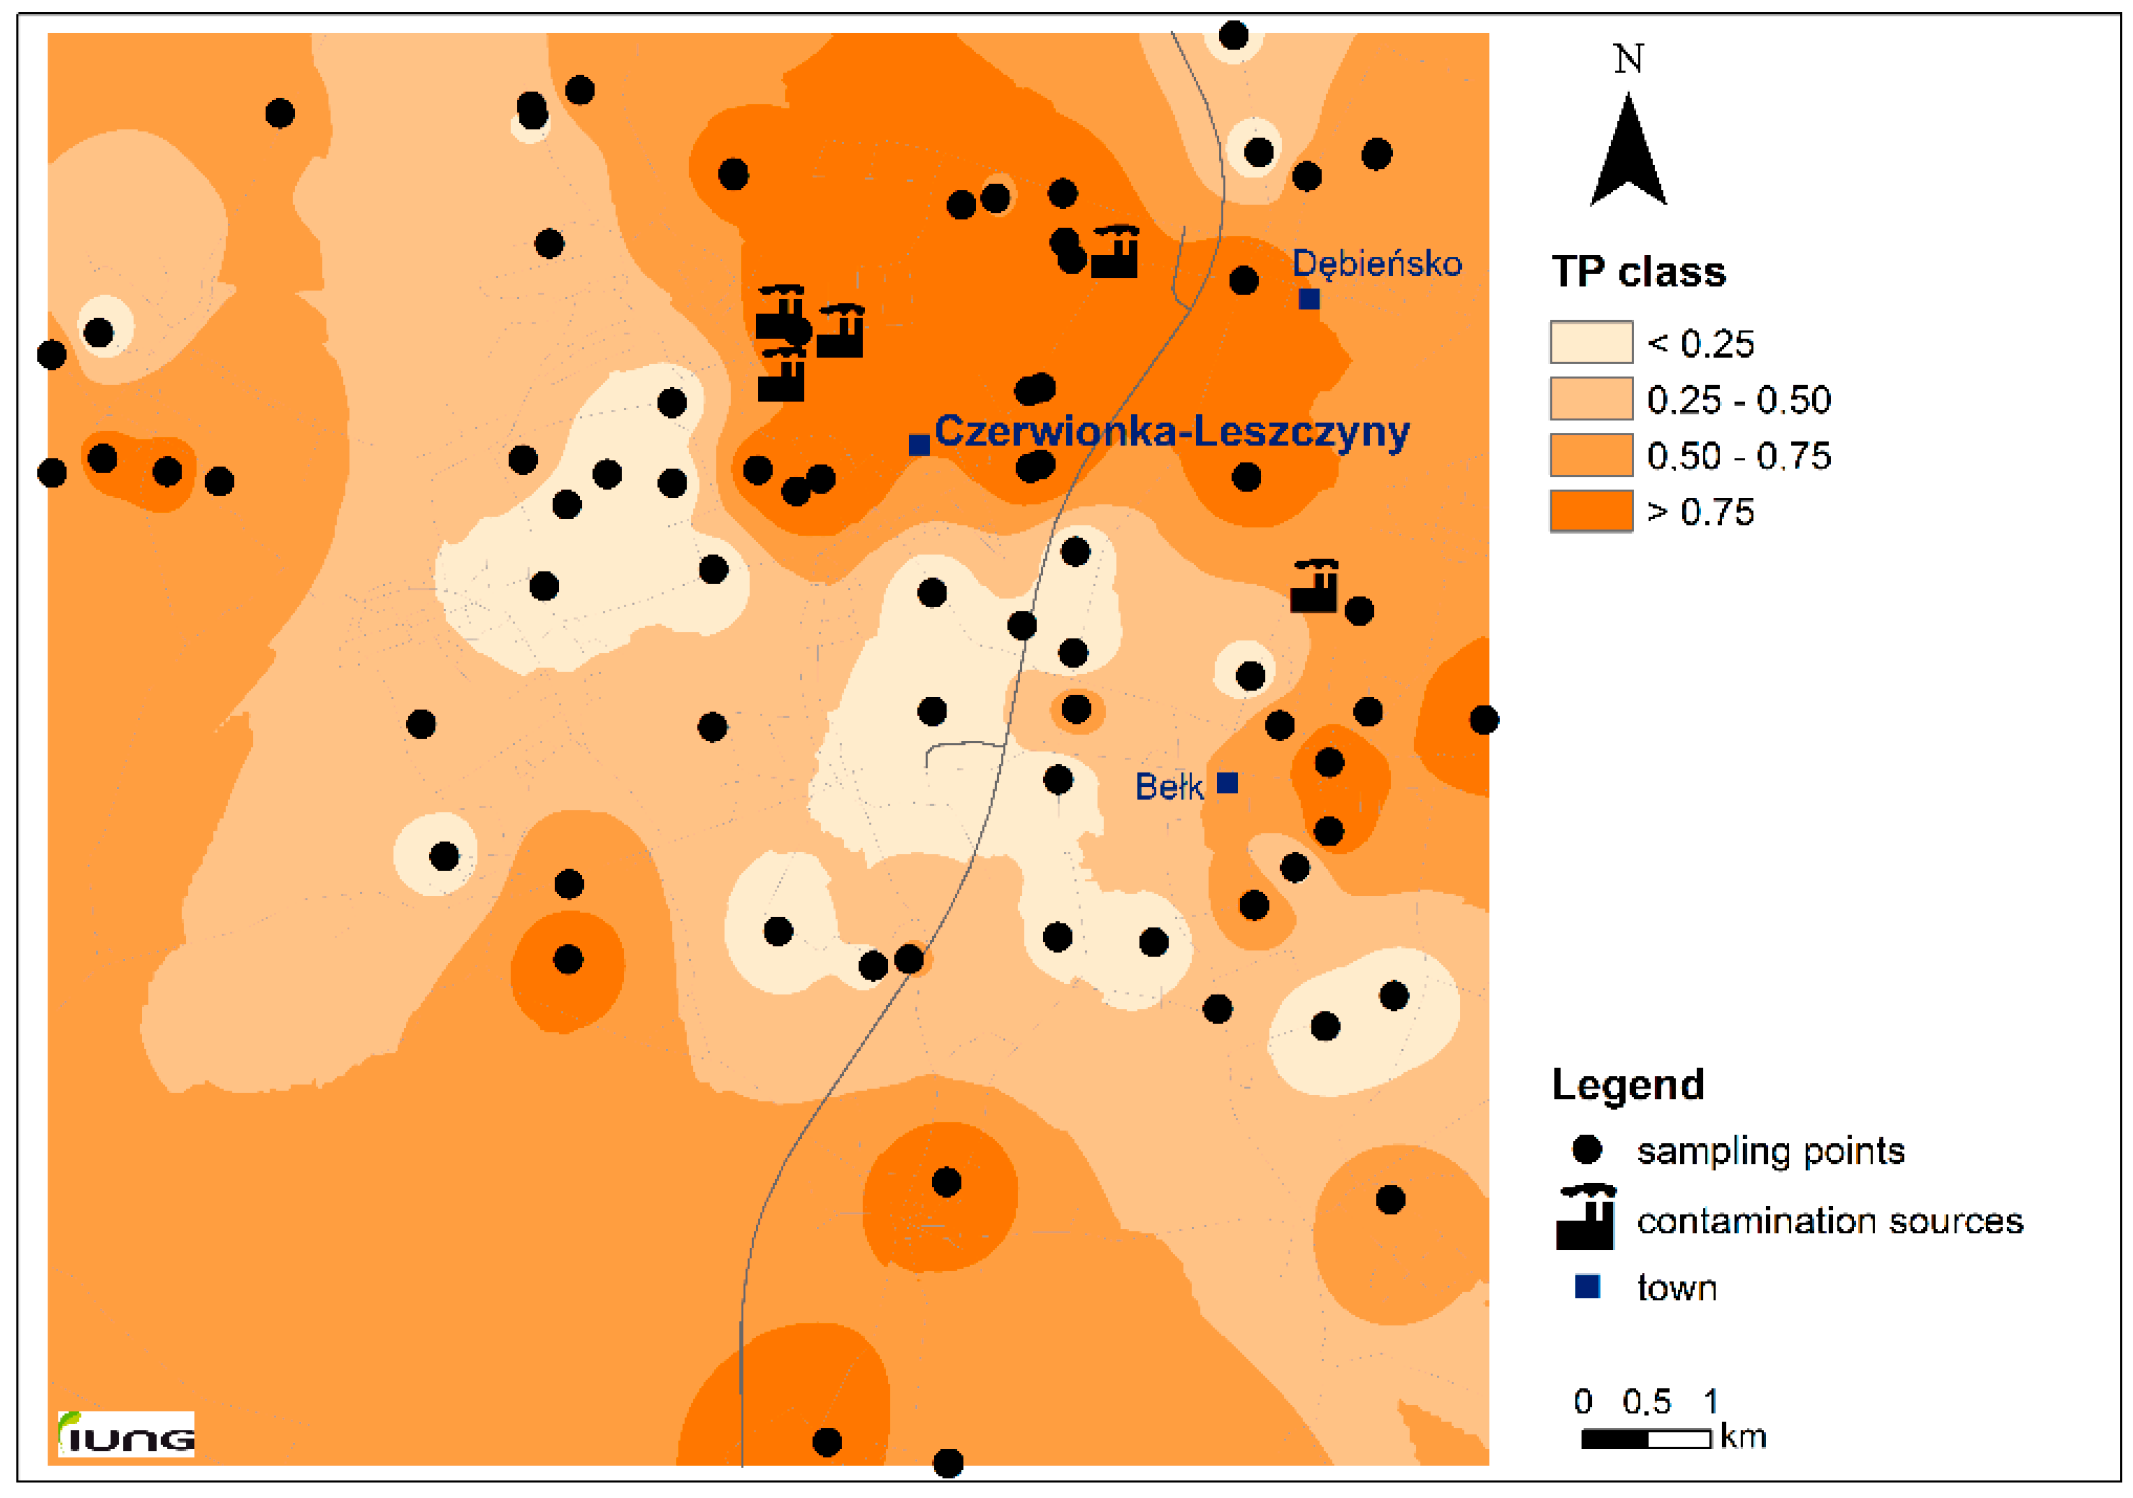
2.2. Evaluation of Potential Ecological Risk—Chemical Indexes
2.3. Evaluation of Potential Human Health Risk—Chemical Indexes
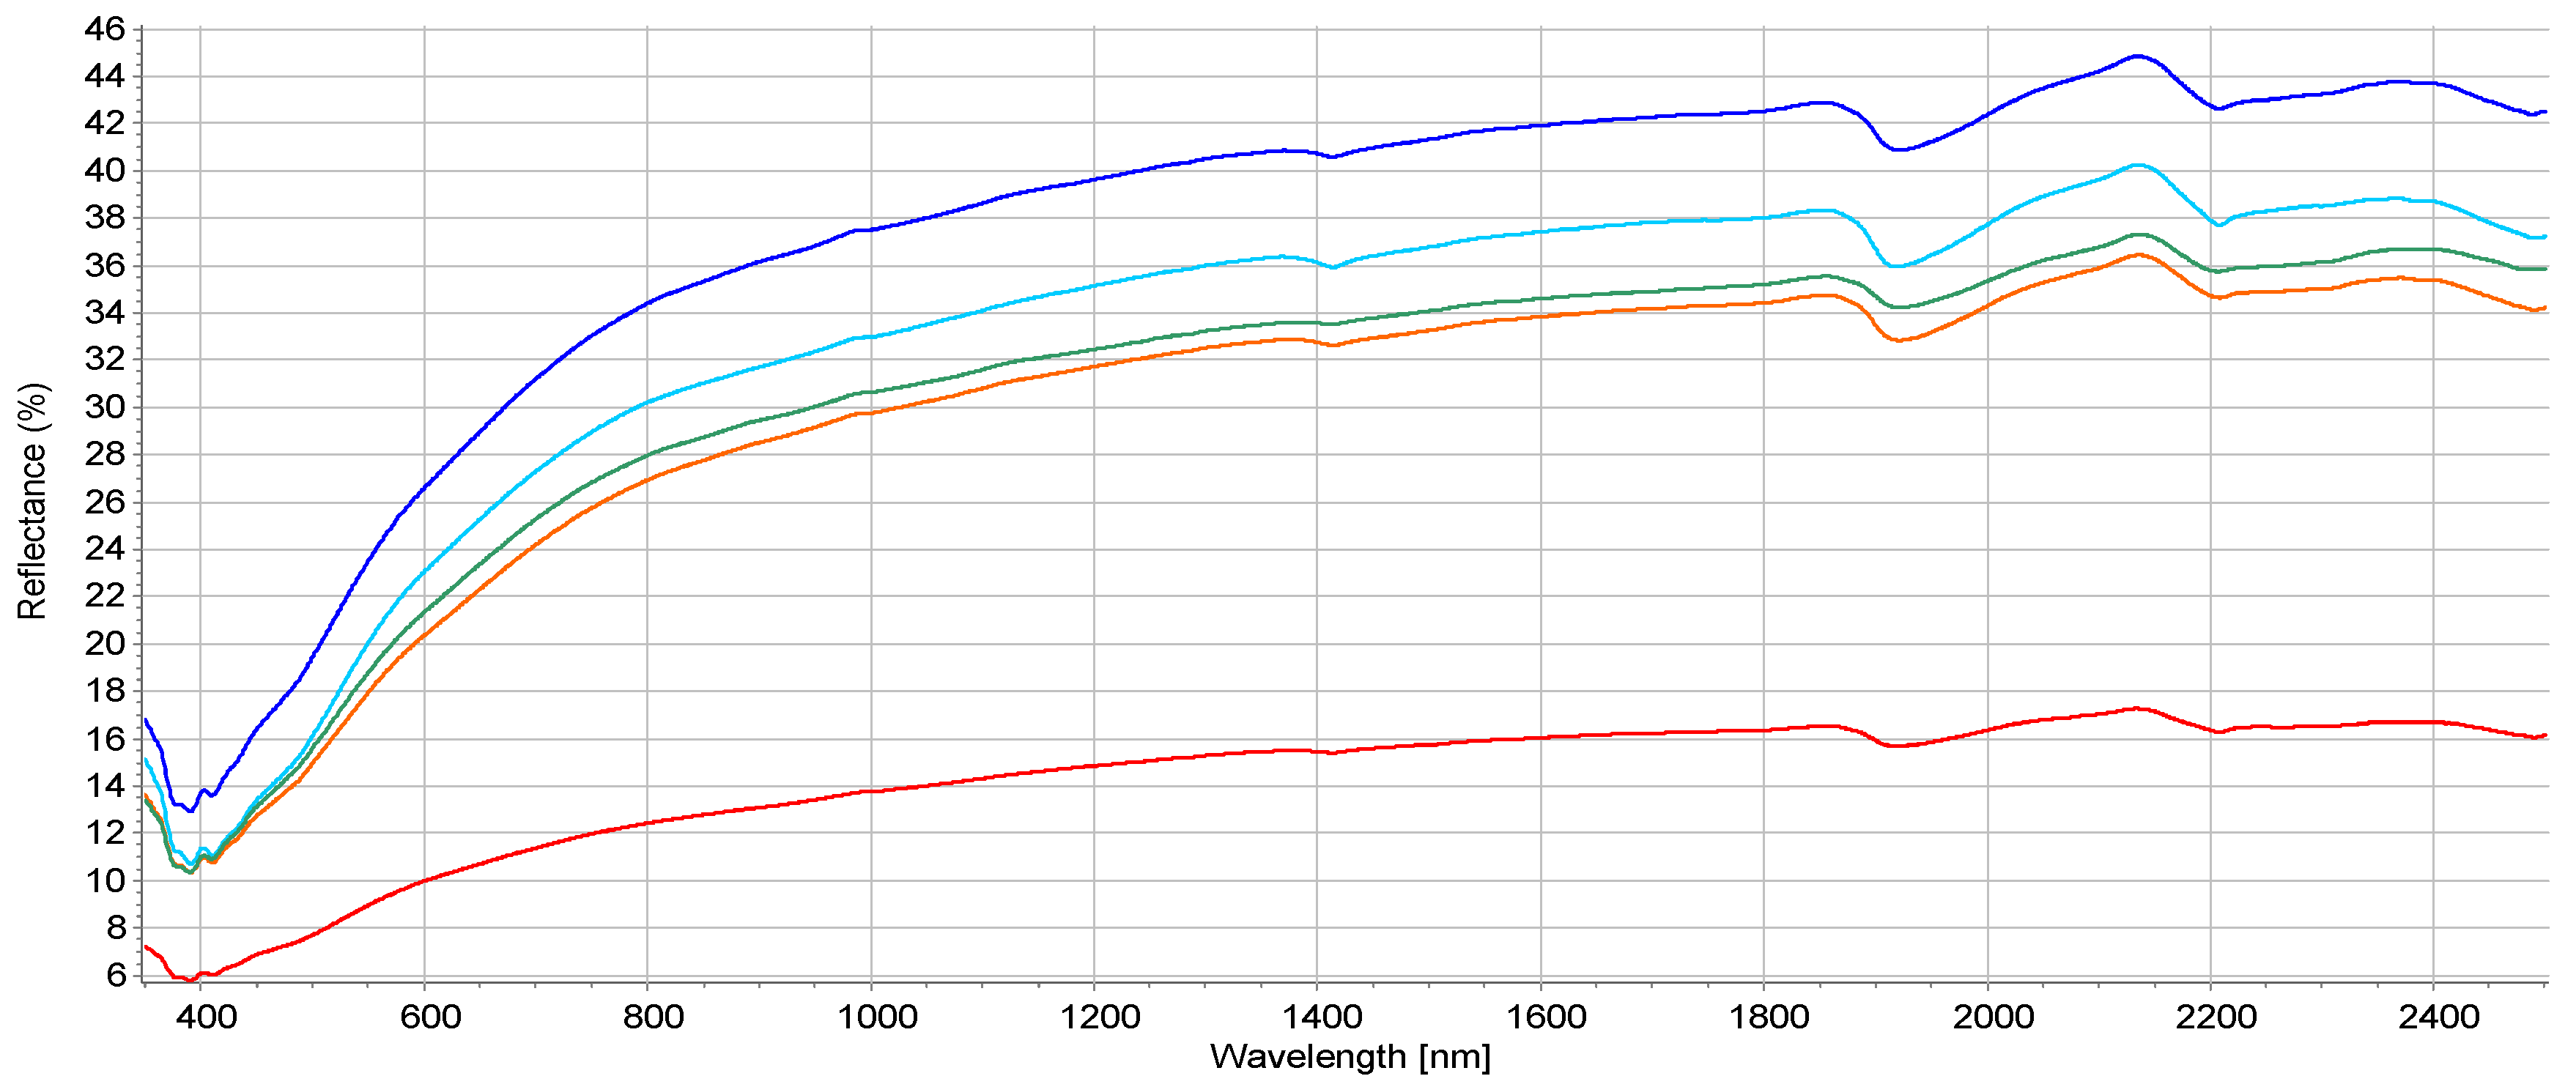
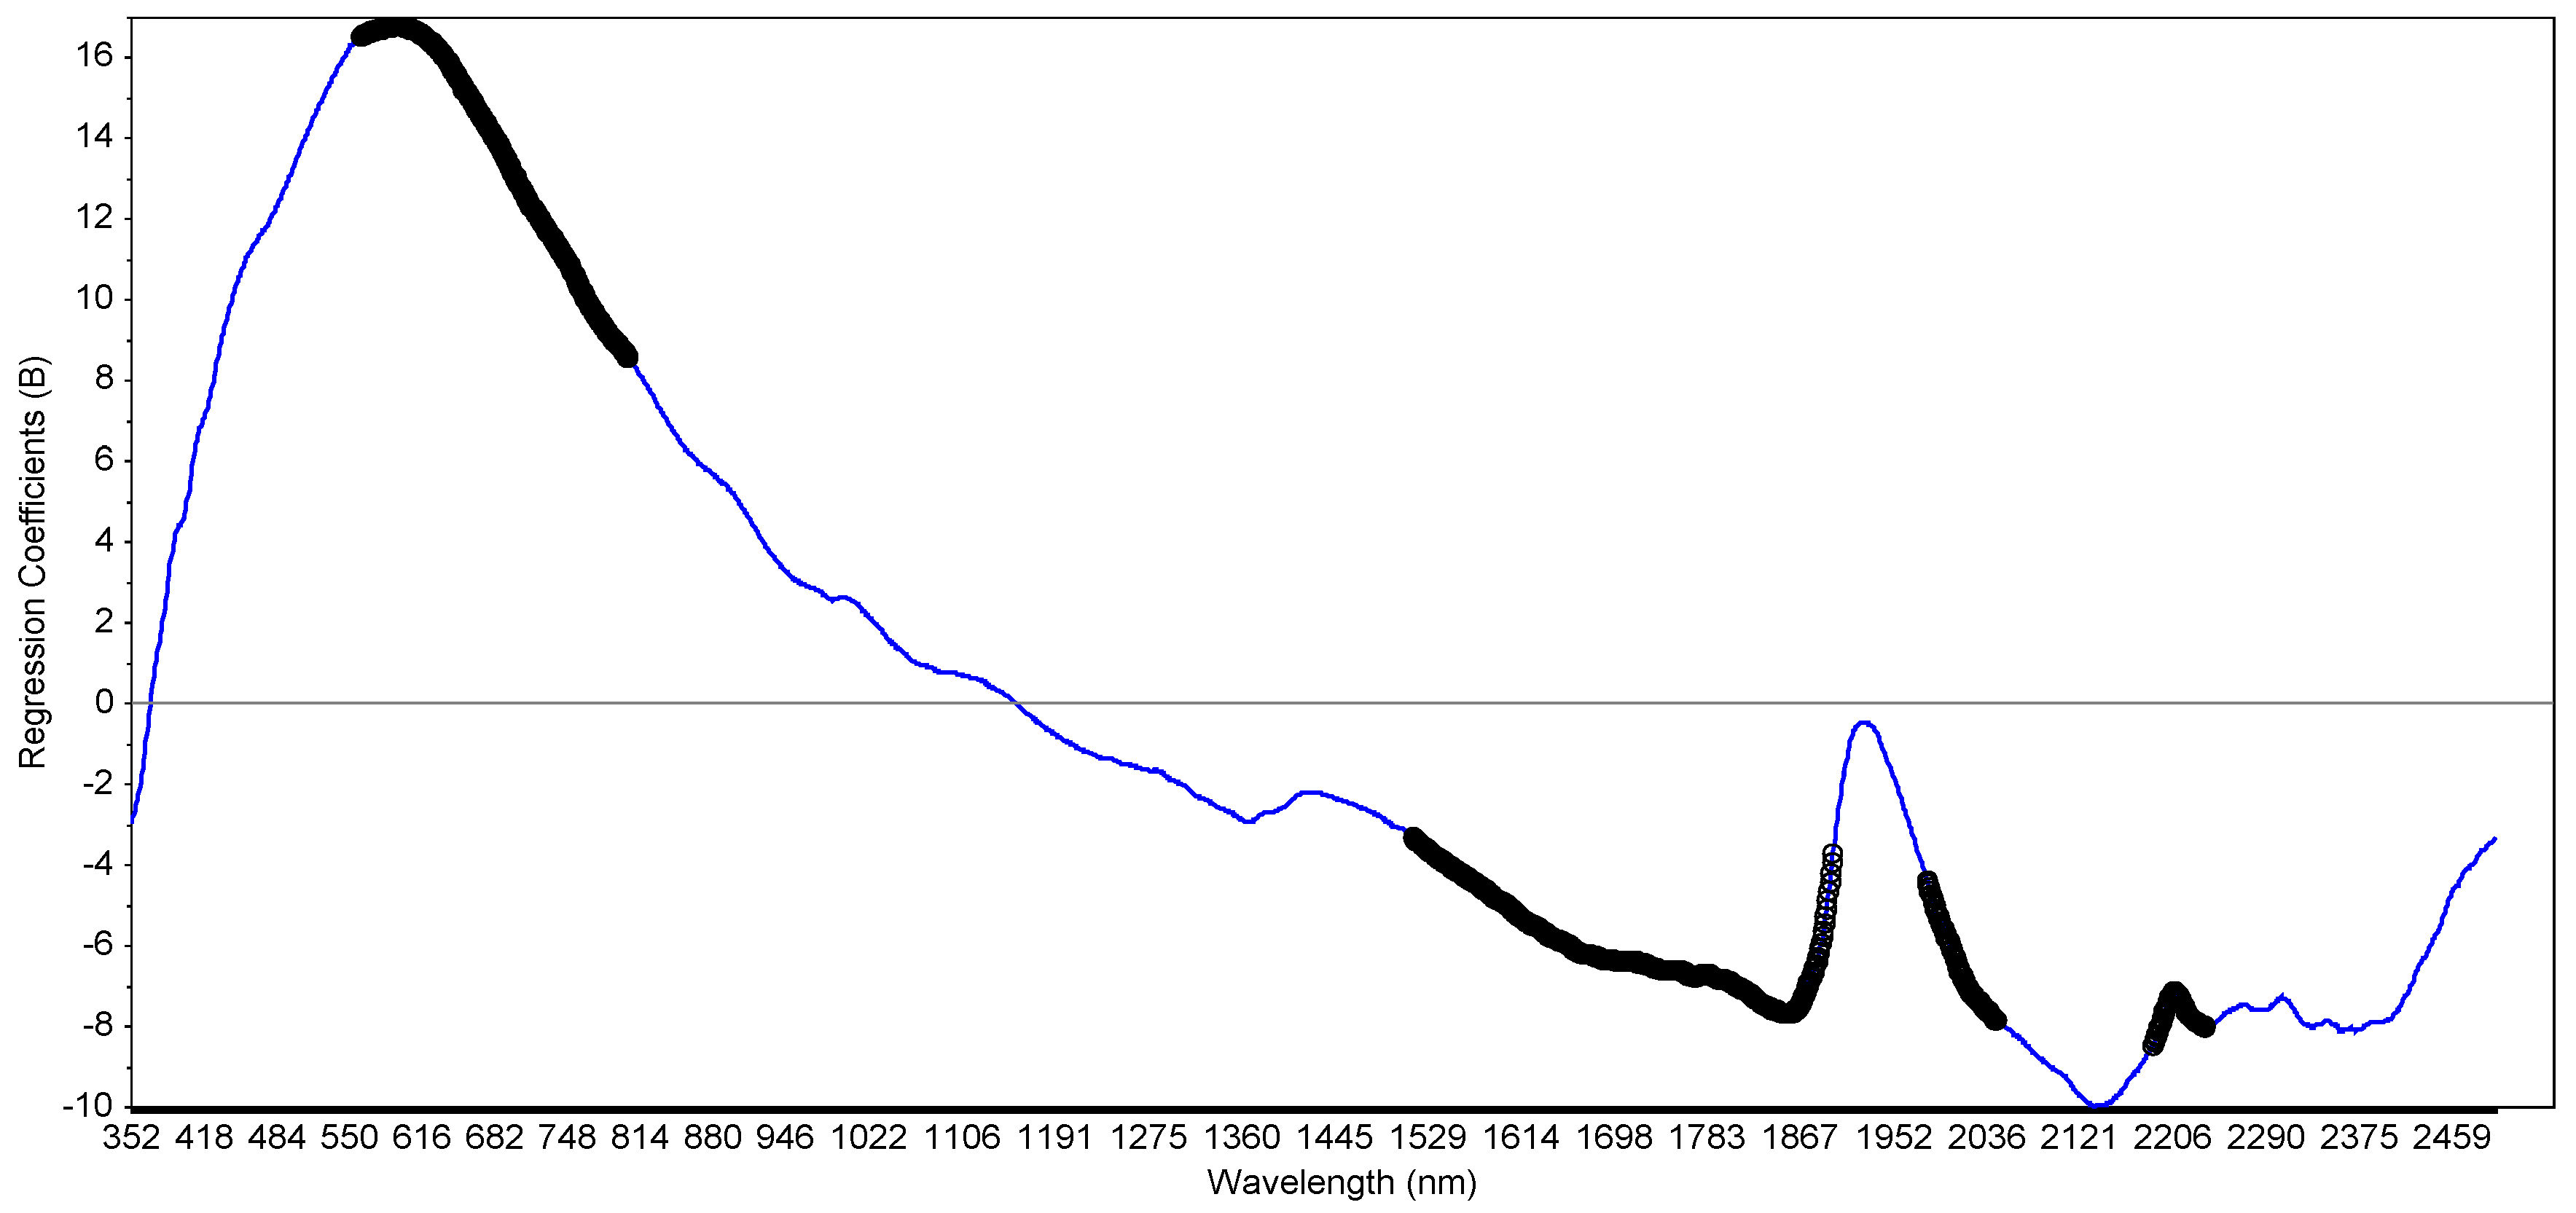
2.4. Application of VIS-NIR for Potential Ecological and Human Risk Prediction
3. Materials and Methods
3.1. Study Area Characterization
3.2. Soil Analysis
3.3. Potential Ecological and Human Health Risk Calculation
3.4. Environmental Risk Prediction Using VIS-NIR Spectroscopy
3.5. Statistical Evaluations
4. Conclusions
Author Contributions
Funding
Acknowledgments
Conflicts of Interest
References
- FAO and ITPS. Status of the world’s soil resources (SWSR)—main report. In Food and Agriculture Organization of the United Nations and Intergovernmental Technical Panel on Soils; FAO: Rome, Italy, 2015; p. 648. [Google Scholar]
- Cachada, A.; Pato, P.; Rocha-Santos, T.; Ferreira da Silva, E.; Duarte, A.C. Levels, sources and potential human health risks of organic pollutants in urban soils. Sci. Total Environ. 2012, 430, 184–192. [Google Scholar] [CrossRef] [PubMed]
- Cachada, A.; da Silva, E.F.; Duarte, A.C.; Pereira, R. Risk assessment of urban soils contamination: The particular case of polycyclic aromatic hydrocarbons. Sci. Total Environ. 2016, 551–552, 271–284. [Google Scholar] [CrossRef]
- Klimkowicz-Pawlas, A.; Smreczak, B.; Ukalska-Jaruga, A. The impact of selected soil organic matter fractions on the PAH accumulation in the agricultural soils from areas of different anthropopressure. Environ. Sci. Pollut. Res. 2017, 24, 10955–10965. [Google Scholar] [CrossRef] [PubMed]
- Maliszewska-Kordybach, B.; Smreczak, B.; Klimkowicz-Pawlas, A. Effects of anthropopressure and soil properties on the accumulation of polycyclic aromatic hydrocarbons in the upper layer of soils in selected regions of Poland. Appl. Geochem. 2009, 24, 1918–1926. [Google Scholar] [CrossRef]
- Peng, C.; Wang, M.; Zhao, Y.; Chen, W. Distribution and risk of polycyclic aromatic hydrocarbons in suburban and rural soils of Beijing with various land uses. Environ. Monit. Assess. 2016, 188, 162. [Google Scholar] [CrossRef]
- Wu, J.; Li, K.; Ma, D.; Yu, N.; Chai, C. Contamination, source identification, and risk assessment of polycyclic aromatic hydrocarbons in agricultural soils around a typical plant in Shandong, China. Hum. Ecol. Risk Assess. 2018, 24, 225–241. [Google Scholar] [CrossRef]
- Chaber, P.; Gworek, B. Surface horizons of forest soils for the diagnosis of soil environment contamination and toxicity caused by polycyclic aromatic hydrocarbons (PAHs). PLoS ONE 2020, 15, e0231359. [Google Scholar] [CrossRef]
- Umeh, A.C.; Duan, L.; Naidu, R.; Semple, K.T. Residual hydrophobic organic contaminants in soil: Are they a barrier to risk-based approaches for managing contaminated land? Environ. Int. 2017, 98, 18–34. [Google Scholar] [CrossRef] [Green Version]
- Ukalska-Jaruga, A.; Smreczak, B.; Klimkowicz-Pawlas, A. Soil organic matter composition as a factor affecting the accumulation of polycyclic aromatic hydrocarbons. J. Soil Sediment. 2019, 19, 1890–1900. [Google Scholar] [CrossRef] [Green Version]
- Klimkowicz-Pawlas, A.; Maliszewska-Kordybach, B.; Smreczak, B. Triad-based screening risk assessment of the agricultural area exposed to the long-term PAHs contamination. Environ. Geochem. Health 2019, 41, 1369–1385. [Google Scholar] [CrossRef]
- Bray, J.G.P.; Viscara Rossel, R.; McBratney, A.B. Diagnostic screening of urban soil contaminants using diffuse reflectance spectroscopy. Aust. J. Soil Res. 2009, 47, 433–442. [Google Scholar] [CrossRef]
- Jensen, J.; Mesman, M.; Bierkens, J.; Loibner, A.; Rutgers, M.; Bogolte, T.; Celis, R.; Dirven-van Breemen, E.M.; Erlacher, E.; Ehlers, C.; et al. Ecological Risk Assessment of Contaminated Land-Decision Support System for Site Specific Investigation; National Institute for Public Health and Environment (RIVM): Bilthoven, The Netherlands, 2006; No. 711701047. [Google Scholar]
- Dagnino, A.; Sforzini, S.; Dondero, F.; Fenoglio, S.; Bona, E.; Jensen, J.; Viarengo, A. A “Weight-of-Evidence” approach for the integration of environmental “Triad” data to assess ecological risk and biological vulnerability. Integr. Environ. Assess. 2008, 4, 314–326. [Google Scholar] [CrossRef] [PubMed]
- Dagnino, A.; Bo, T.; Copetta, A.; Feniglio, S.; Oliveri, C.; Bencivenga, M.; Felli, A.; Viarengo, A. Development and application of an innovative expert decision support system to manage sediments and to assess environmental risk in freshwater systems. Environ. Int. 2013, 60, 171–182. [Google Scholar] [CrossRef] [PubMed]
- Okparanma, R.N.; Coulon, F.; Mayr, T.; Mouazen, A.M. Mapping polycyclic aromatic hydrocarbon and total toxicity equivalent soil concentrations by visible and near-infrared spectroscopy. Environ. Pollut. 2014, 192, 162–170. [Google Scholar] [CrossRef] [PubMed] [Green Version]
- Moreno-Jiménez, E.; García-Gómez, C.; Oropesa, A.L.; Esteban, E.; Haro, A.; Carpena-Ruiz, R.; Tarazona, J.V.; Peñalosa, J.M.; Fernández, M.D. Screening risk assessment tools for assessing the environmental impact in an abandoned pyritic mine in Spain. Sci. Total Environ. 2011, 409, 692–703. [Google Scholar] [CrossRef] [PubMed]
- Cécillon, L.; Barthès, B.G.; Gomez, C.; Ertlen, D.; Genot, V.; Hedde, M.; Stevens, A.; Brun, J.J. Assessment and monitoring of soil quality using near-infrared reflectance spectroscopy (NIRS). Eur. J. Soil Sci. 2009, 60, 770–784. [Google Scholar] [CrossRef] [Green Version]
- Debaene, G. Visible and near-infrared spectroscopy in Poland: From the beginning to the Polish Soil Spectral Library. Polish J. Agron. 2019, 37, 3–10. [Google Scholar]
- Stenberg, B.; Viscarra Rossel, R.A.; Mouazen, A.M.; Wetterlind, J. Visible and near-infrared spectroscopy in soil science. In Advances in Agronomy; Sparks, D.L., Ed.; Elsevier Burlington Academic Press: Cambridge, MA, USA, 2010; Volume 107, pp. 163–215. [Google Scholar]
- Ozaki, Y.; Huck, C.W.; Ishikawa, A.; Ikehata, A.; Shinzawa, H. Near-infrared spectroscopy in biological molecules and tissues. In Encyclopedia of Biophysics; Roberts, G., Watts, A., European Biophysical Societies Association, Eds.; Springer: Berlin/Heidelberg, Germany, 2018. [Google Scholar]
- Ukalska-Jaruga, A.; Debaene, G.; Smreczak, B. Particle and structure characterization of fulvic acids from agricultural soil. J. Soil Sediment. 2018, 18, 2833–2843. [Google Scholar] [CrossRef]
- Debaene, G.; Pikuła, D.; Niedźwiecki, J. Use of VIS-NIRS for land management classification with a support vector machine and prediction of soil organic carbon and other soil properties. Cienc. Investig. Agrar. 2014, 41, 21–32. [Google Scholar] [CrossRef] [Green Version]
- Siebielec, G.; McCarty, G.W.; Stuczynski, T.I.; Reeves, J.B., III. Near- and Mid-Infrared Diffuse Reflectance Spectroscopy for measuring soil metal content. J. Environ. Qual. 2004, 33, 2056–2069. [Google Scholar] [CrossRef] [PubMed] [Green Version]
- Maliki, A.A.; Owens, G.; Hussain, H.M.; Al-Dahaan, S.; Al-Ansari, N. Chemometric methods to predict of Pb in urban soil from Port Pirie, South Australia, using spectrally active soil carbon. Commun. Soil Sci. Plant. Anal. 2018, 49, 1370–1383. [Google Scholar] [CrossRef] [Green Version]
- Okparanma, R.N.; Coulon, F.; Mouazen, A.M. Analysis of petroleum-contaminated soils by diffuse reflectance spectroscopy and sequential ultrasonic solvent extraction—gas chromatography. Environ. Pollut. 2014, 184, 298–305. [Google Scholar] [CrossRef] [PubMed] [Green Version]
- Cipullo, S.; Nawar, S.; Mouazen, A.M.; Campo-Moreno, P.; Coulon, F. Predicting bioavailability change of complex chemical mixtures in contaminated soils using visible and near-infrared spectroscopy and random forest regression. Sci. Rep. 2019, 9, 4492. [Google Scholar] [CrossRef]
- Douglas, R.K.; Nawar, S.; Alamar, M.C.; Coulon, F.; Mouazen, A.M. Rapid detection of alkanes and polycyclic aromatic hydrocarbons in oil-contaminated soil with visible near-infrared spectroscopy. Eur. J. Soil Sci. 2019, 70, 140–150. [Google Scholar] [CrossRef]
- Okparanma, R.N.; Mouazen, A.M. Visible and near-infrared spectroscopy analysis of a polycyclic aromatic hydrocarbon in soils. Sci. World J. 2013, 2, 160360. [Google Scholar] [CrossRef]
- Schwartz, G.; Ben-Dor, E.; Eshel, G. Quantitative assessment of hydrocarbon contamination in soil using reflectance spectroscopy: A “multipath” approach. Appl. Spectrosc. 2013, 67, 1323–1331. [Google Scholar] [CrossRef] [PubMed]
- Garcia, V.J.; Márquez, C.O.; Cedeño, A.; Montesdeoca, K.G. Assessing bioremediation of soils polluted with fuel oil 6 by means of diffuse reflectance spectroscopy. Resources 2019, 8, 36. [Google Scholar] [CrossRef] [Green Version]
- Debaene, G.; Bartmiński, P.; Niedźwiecki, T.; Miturski, T. Visible and near-infrared spectroscopy as a tool for soil classification and soil profile description. Pol. J. Soil Sci. 2017, 50, 1–10. [Google Scholar] [CrossRef] [Green Version]
- Rusco, E.; Jones, R.; Bidoglio, G. Organic Matter in the Soils of Europe: Present Status and Future Trends; Publications Office of the European Union: Luxembourg, 2001. [Google Scholar]
- Maliszewska-Kordybach, B.; Smreczak, B.; Klimkowicz-Pawlas, A.; Terelak, H. Monitoring of the total content of polycyclic aromatic hydrocarbons (PAHs) in arable soils in Poland. Chemosphere 2008, 73, 1284–1291. [Google Scholar] [CrossRef]
- Nadal, M.; Schuhmacher, M.; Domingo, J.L. Levels of PAHs in soil and vegetation samples from Tarragona County, Spain. Environ. Pollut. 2004, 132, 1–11. [Google Scholar] [CrossRef]
- Nam, J.J.; Thomas, G.O.; Jaward, F.M.; Steinnes, E.; Gustafsson, O.; Jones, K.C. PAHs background soils from Western Europe: Influence of atmospheric deposition and soil organic matter. Chemosphere 2008, 70, 1596–1602. [Google Scholar] [CrossRef] [PubMed]
- Thiombane, M.; Albanese, S.; Di Bonito, M.; Lima, A.; Zuzolo, D.; Rolandi, R.; Qi, S.; De Vivo, B. Source patterns and contamination level of polycyclic aromatic hydrocarbons (PAHs) in urban and rural areas of Southern Italian soils. Environ. Geochem. Health 2019, 41, 507–528. [Google Scholar] [CrossRef] [PubMed]
- Zhao, L.; Hou, H.; Shangguan, Y.; Cheng, B.; Xu, Y.; Zhao, R.; Zhang, Y.; Hua, X.; Huo, X.; Zhao, X. Occurrence, sources, and potential human health risk of polycyclic aromatic hydrocarbons in agricultural soils of the coal production area surrounding Xinzhou, China. Ecotox. Environ. Saf. 2014, 108, 120–128. [Google Scholar] [CrossRef] [PubMed]
- Holoubek, I.; Dusek, L.; Sanka, M.; Hofman, J.; Cupr, P.; Jarkovsky, J.; Zbiral, J.; Klanova, J. Soil burdens of persistent organic pollutants—their levels and risk. Part, I. Variation of concentration ranges according to different soil uses and locations. Environ. Pollut. 2009, 157, 3207–3217. [Google Scholar] [CrossRef] [PubMed]
- Duan, Y.; Shen, G.; Tao, S.; Hong, J.; Chen, Y.; Xue, M.; Li, T.; Su, S.; Shen, H.; Fu, X.; et al. Characteristics of polycyclic aromatic hydrocarbons in agricultural soils at a typical coke production base in Shanxi, China. Chemosphere 2015, 127, 64–69. [Google Scholar] [CrossRef]
- Huang, H.; Xing, X.; Zhang, Z.; Qi, S.; Yang, D.; Yuen, D.A.; Sandy, E.H.; Zhou, A.; Li, X. Polycyclic aromatic hydrocarbons (PAHs) in multimedia environment of Heshan coal district, Guangxi: Distribution, source diagnosis and health risk assessment. Environ. Geochem. Heath 2016, 38, 1169–1181. [Google Scholar] [CrossRef]
- Liu, G.; Guo, W.; Niu, J.; An, X.; Zhao, L. Polycyclic aromatic hydrocarbons in agricultural soils around the industrial city of Chanzhi, China: Characteristics, spatial distribution, hotspots, sources, and potential risks. J. Soil Sediment. 2017, 17, 229–239. [Google Scholar] [CrossRef]
- Hiller, E.; Lachká, L.; Jurkovič, Ĺ.; Vozár, J. Polycyclic aromatic hydrocarbons in urban soils from kindergartens and playgrounds in Bratislava, the capital city of Slovakia. Environ. Earth Sci. 2015, 73, 7147–7156. [Google Scholar] [CrossRef]
- Ciarkowska, K.; Gambus, F.; Antonkiewicz, J.; Koliopoulos, T. Polycyclic aromatic hydrocarbon and heavy metal contents in the urban soils in southern Poland. Chemosphere 2019, 229, 214–226. [Google Scholar] [CrossRef]
- Maliszewska-Kordybach, B. Polycyclic aromatic hydrocarbons in agricultural soils in Poland: Preliminary proposals for criteria to evaluate the level of soil contamination. Appl. Geochem. 1996, 11, 121–127. [Google Scholar] [CrossRef]
- Terelak, H.; Stuczynski, T.; Motowicka-Terelak, T.; Pietruch, C.Z.; Maliszewska-Kordybach, B. Monitoring of the Chemical Properties of Arable Soils in Poland in Years 2005–2007; Biblioteka Monitoringu Srodowiska: Warszawa, Poland, 2008; p. 135. (In Polish) [Google Scholar]
- EMEP. European Monitoring and Evaluation Programme on Air Emission. 2020. Available online: https://www.emep.int/ (accessed on 10 June 2020).
- Dz.U. Regulation of the Minister of the Environment of 1 September 2016 on the Conduct of the Assessment of Contamination of the Surface of the Earth. 2016. Available online: http://isap.sejm.gov.pl/isap.nsf/DocDetails.xsp?id=WDU20160001395 (accessed on 5 May 2020). (In Polish)
- Gómez-Gutiérez, A.; Garnacho, E.; Bayona, J.M.; Albaigés, J. Screening ecological risk assessment of persistent organic pollutants in Mediterranean sea sediment. Environ. Int. 2007, 33, 867–876. [Google Scholar] [CrossRef] [PubMed]
- Ginebreda, A.; Kuzmanovic, M.; Guasch, H.; López de Alda, M.; López-Doval, J.C.; Muñoz, I.; Ricart, M.; Romaní, A.M.; Sabater, S.; Barceló, D. Assessment of multi-chemical pollution in aquatic ecosystems using toxic units: Compound prioritization, mixture characterization and relationships with biological descriptors. Sci. Total Environ. 2014, 468–469, 715–723. [Google Scholar] [CrossRef] [PubMed]
- Posthuma, L.; Altenburger, R.; Backhaus, T.; Kortenkamp, A.; Müller, C.; Focks, A.; de Zwart, D.; Brack, W. Improved component-based methods for mixture risk assessment are key to characterize complex chemical pollution in surface waters. Environ. Sci. Eur. 2019, 31, 70. [Google Scholar] [CrossRef]
- EU. Coal-Tar Pitch, High Temperature. In Proceedings of the Summary of Risk Assessment Report, Environment, Maastricht, The Netherlands, May 2008; Available online: https://echa.europa.eu/documents/10162/13630/trd_rar_env_netherlands_pitch_en.pdf (accessed on 15 May 2020).
- Persoone, G.; Marsalek, B.; Blinova, I.; Törökne, A.; Zarina, D.; Manusadzianas, L.; Nalecz-Jawecki, G.; Tofan, L.; Stepanova, N.; Tothova, L.; et al. A practical and user-friendly toxicity classification system with microbiotests for natural waters and wastewaters. Environ. Toxicol. 2003, 18, 395–402. [Google Scholar] [CrossRef]
- Verbruggen, E.M.J. Environmental Risk Limits for Polycyclic Aromatic Hydrocarbons (PAHs)—For Direct Aquatic, Benthic, and Terrestrial Toxicity; National Institute for Public Health and the Environment (RIVM): Bilthoven, The Netherlands, 2012; No. 607711007. [Google Scholar]
- Nisbet, I.C.; LaGoy, P.K. Toxic equivalency factors (TEFs) for polycyclic aromatic hydrocarbons (PAHs). Regul. Toxicol. Pharm. 1992, 16, 290–300. [Google Scholar] [CrossRef]
- OECD. Considerations for Assessing the Risks of Combined Exposure to Multiple Chemicals. 2018. Available online: https://www.oecd.org/chemicalsafety/risk-assessment/considerations-for-assessing-the-risks-of-combined-exposure-to-multiple-chemicals.pdf (accessed on 15 May 2020).
- Canadian Council of Ministers of the Environment (CCME). Polycyclic aromatic hydrocarbons. In Canadian Soil Quality Guidelines for Protection of Environmental and Human Health; Canada Soil Quality Guidelines: Winnipeg, MB, Canada, 2010; Available online: http://ceqg-rcqe.ccme.ca (accessed on 15 May 2020).
- Carlon, C.; Alessandro, M.D.; Swartjes, F. Derivation Methods for Soil Screening Values in Europe. A Review and Evaluation of National Procedures Towards Harmonization; European Commission, Joint Research Centre: Ispra, Italy, 2007; p. 306, EUR 22805-EN. [Google Scholar]
- Debaene, G.; Niedźwiecki, J.; Pecio, A. Visible and near-infrared spectrophotometer for soil analysis: Preliminary results. Polish J. Agron. 2010, 3, 3–9. [Google Scholar]
- Ladoni, M.; Bahrami, H.A.; Alavipanah, S.K.; Norouzi, A.A. Estimating soil organic carbon from soil reflectance: A review. Precis. Agric. 2010, 11, 82–99. [Google Scholar] [CrossRef]
- Ben-Dor, E.; Patkin, K.; Banin, A.; Karnieli, A. Mapping of several soil properties using DAIS-7915 hyperspectral scanner data. A case study over clayey soils in Israel. Int. J. Remote Sens. 2002, 23, 1043–1062. [Google Scholar] [CrossRef]
- Soltani, I.; Fouad, Y.; Michot, D.; Bréger, P.; Dubois, R.; Cudennec, C. A near infrared index to assess effects of soil texture and organic carbon on soil water content. Eur. J. Soil Sci. 2018, 70, 151–161. [Google Scholar] [CrossRef] [Green Version]
- Demattê, J.A.M.; Campos, R.C.; Alves, M.C.; Fiorio, P.R.; Nanni, M.R. Visible-NIR reflectance: A new approach on soil evaluation. Geoderma 2004, 121, 95–112. [Google Scholar] [CrossRef]
- Workman, J., Jr.; Weyer, L. Practical Guide and Spectral Atlas for Interpretive Near-Infrared Spectroscopy; CRC Press: Boca Raton, FL, USA, 2012. [Google Scholar] [CrossRef]
- Debaene, G.; Niedźwiecki, J.; Pecio, A.; Żurek, A. Effect of the number of calibration samples on the prediction of several soil properties at the farm-scale. Geoderma 2014, 214–215, 114–125. [Google Scholar] [CrossRef]
Sample Availability: Samples are available from the authors. |


| Variable | Min | LQ | Mean | Median | UQ | Max | CoV |
|---|---|---|---|---|---|---|---|
| Basic soil Properties | |||||||
| Sand (%) | 49.0 | 67.0 | 71.8 | 70.7 | 78.2 | 90.6 | 12 |
| Silt (%) | 9.0 | 21.0 | 26.2 | 26.8 | 31.1 | 45.0 | 30 |
| Clay (%) | 0.0 | 1.0 | 1.9 | 1.9 | 2.7 | 6.0 | 73 |
| Corg (g kg−1) | 5.2 | 9.5 | 22.9 | 11.7 | 17.6 | 187.2 | 142 |
| pHKCl | 3.8 | 4.6 | 5.3 | 5.2 | 5.6 | 7.8 | 17 |
| TN (g kg−1) | 0.2 | 0.8 | 1.5 | 1.0 | 1.4 | 11.7 | 112 |
| PAHs(µg kg−1) | |||||||
| 2-ring | 19 | 45 | 297 | 61 | 94 | 5.4 × 10³ | 325 |
| 3-ring | 45 | 100 | 1631 | 173 | 313 | 40.2 × 10³ | 392 |
| 4-ring | 99 | 281 | 5460 | 569 | 1112 | 137.7 × 10³ | 407 |
| 5-ring | 55 | 144 | 2837 | 286 | 480 | 81.7 × 10³ | 430 |
| 6-ring | 26 | 89 | 1566 | 157 | 247 | 51.5 × 10³ | 446 |
| ΣPAHCarcin | 137 | 275 | 5383 | 543 | 950 | 153.6 × 10³ | 427 |
| ΣPAH4em | 37 | 134 | 2976 | 262 | 435 | 105.2 × 10³ | 466 |
| Σ16PAH | 311 | 624 | 11792 | 1252 | 2148 | 316.1 × 10³ | 410 |
| Isomer Ratios | |||||||
| Fln/(Fln + Pyr) | 0.41 | 0.57 | 0.58 | 0.58 | 0.59 | 0.67 | 5.4 |
| BaA/(BaA + Ch) | 0.26 | 0.37 | 0.41 | 0.43 | 0.46 | 0.53 | 14.5 |
| IndPyr/(IndPyr + BPer) | 0.17 | 0.49 | 0.51 | 0.52 | 0.53 | 0.80 | 12.2 |
| PAH | MPC | HQ | HQ > 1 (%) | ||||||
|---|---|---|---|---|---|---|---|---|---|
| Min | LQ | Mean | Median | UQ | Max | CoV | |||
| Napht | 100 | 0.19 | 0.45 | 2.97 | 0.61 | 0.94 | 54.3 | 325 | 24 |
| Anth | 200 | 0.01 | 0.03 | 1.06 | 0.06 | 0.11 | 33.2 | 458 | 7 |
| BaA | 100 | 0.14 | 0.31 | 8.56 | 0.69 | 1.26 | 245.9 | 436 | 38 |
| Ch | 200 | 0.10 | 0.26 | 4.22 | 0.47 | 0.90 | 108.2 | 404 | 23 |
| BbF | 100 | 0.09 | 0.82 | 11.12 | 1.32 | 2.40 | 258.3 | 396 | 62 |
| BkF | 100 | 0.09 | 0.25 | 6.37 | 0.54 | 0.82 | 200.1 | 462 | 20 |
| BaPyr | 100 | 0.10 | 0.41 | 10.89 | 0.96 | 1.38 | 407.5 | 479 | 45 |
| IndPyr | 200 | 0.05 | 0.21 | 3.84 | 0.37 | 0.59 | 117.4 | 439 | 18 |
| DahA | 100 | 0.01 | 0.07 | 0.77 | 0.14 | 0.25 | 22.1 | 382 | 8 |
| BPer | 200 | 0.04 | 0.19 | 3.61 | 0.34 | 0.51 | 129.1 | 465 | 16 |
| HI | - | 1.56 | 3.06 | 53.41 | 5.42 | 9.21 | 1522.9 | 422 | 23 |
| PAH | PNEC | TU | TU > 1 (%) | ||||||
|---|---|---|---|---|---|---|---|---|---|
| Min | LQ | Mean | Median | UQ | Max | CoV | |||
| Napht | 1000 | 0.019 | 0.045 | 0.30 | 0.06 | 0.09 | 5.43 | 325 | 5 |
| Acyn | 290 | 0.005 | 0.009 | 0.18 | 0.02 | 0.03 | 4.85 | 433 | 4 |
| Acen | 38 | 0.078 | 0.187 | 2.27 | 0.32 | 0.51 | 62.77 | 402 | 12 |
| Flu | 1000 | 0.003 | 0.008 | 0.12 | 0.01 | 0.02 | 2.46 | 394 | 4 |
| Phen | 1800 | 0.019 | 0.042 | 0.64 | 0.07 | 0.13 | 15.19 | 383 | 7 |
| Anth | 130 | 0.019 | 0.041 | 1.63 | 0.09 | 0.17 | 51.08 | 458 | 8 |
| Fln | 1500 | 0.025 | 0.079 | 1.39 | 0.16 | 0.31 | 31.43 | 399 | 7 |
| Pyr | 1000 | 0.027 | 0.079 | 1.68 | 0.18 | 0.35 | 44.34 | 412 | 7 |
| BaA | 79 | 0.182 | 0.390 | 10.83 | 0.88 | 1.59 | 311.37 | 436 | 43 |
| Ch | 550 | 0.035 | 0.093 | 1.54 | 0.17 | 0.33 | 39.36 | 404 | 8 |
| BbF | 280 | 0.033 | 0.293 | 3.97 | 0.47 | 0.86 | 92.25 | 395 | 23 |
| BkF | 270 | 0.035 | 0.092 | 2.36 | 0.20 | 0.30 | 74.11 | 462 | 8 |
| BaPyr | 53 | 0.184 | 0.770 | 20.55 | 1.82 | 2.60 | 768.87 | 480 | 66 |
| IndPyr | 130 | 0.081 | 0.319 | 5.90 | 0.56 | 0.91 | 180.62 | 439 | 22 |
| DahA | 54 | 0.027 | 0.127 | 1.43 | 0.26 | 0.45 | 40.87 | 382 | 14 |
| BPer | 170 | 0.050 | 0.224 | 4.24 | 0.40 | 0.60 | 151.86 | 465 | 22 |
| TUm | - | 1.26 | 2.88 | 59.04 | 5.70 | 9.51 | 1858.24 | 439 | 100 |
| PAH | MPC | Soil Samples in TP Class (%) | |||
|---|---|---|---|---|---|
| TP < 0.25 | 0.25 < TP < 0.50 | 0.50 < TP < 0.75 | 0.75 < TP < 1 | ||
| Napht | 690 | 93.2 | 1.4 | 1.4 | 4.1 |
| Acyn | 170 | 93.2 | 2.7 | 1.4 | 2.7 |
| Acen | 680 | 95.9 | 0.0 | 2.7 | 1.4 |
| Flu | 1600 | 95.9 | 0.0 | 4.1 | 0.0 |
| Phen | 3600 | 91.9 | 4.1 | 0.0 | 4.1 |
| Anth | 340 | 90.5 | 4.1 | 1.4 | 4.1 |
| Fln | 4800 | 93.2 | 2.7 | 0.0 | 4.1 |
| Pyr | 1800 | 87.8 | 5.4 | 2.7 | 4.1 |
| BaA | 190 | 66.2 | 17.6 | 8.1 | 8.1 |
| Ch | 1600 | 91.9 | 4.1 | 0.0 | 4.1 |
| BbF | 790 | 81.1 | 12.2 | 2.7 | 4.1 |
| BkF | 790 | 91.9 | 2.7 | 1.4 | 4.1 |
| BaPyr | 160 | 60.8 | 20.3 | 10.8 | 8.1 |
| IndPyr | 380 | 79.7 | 12.2 | 2.7 | 5.4 |
| DahA | 180 | 90.5 | 4.1 | 1.4 | 4.1 |
| BPer | 490 | 83.8 | 8.1 | 2.7 | 5.4 |
| Σ16PAH | - | 33.8 | 10.8 | 20.3 | 35.1 |
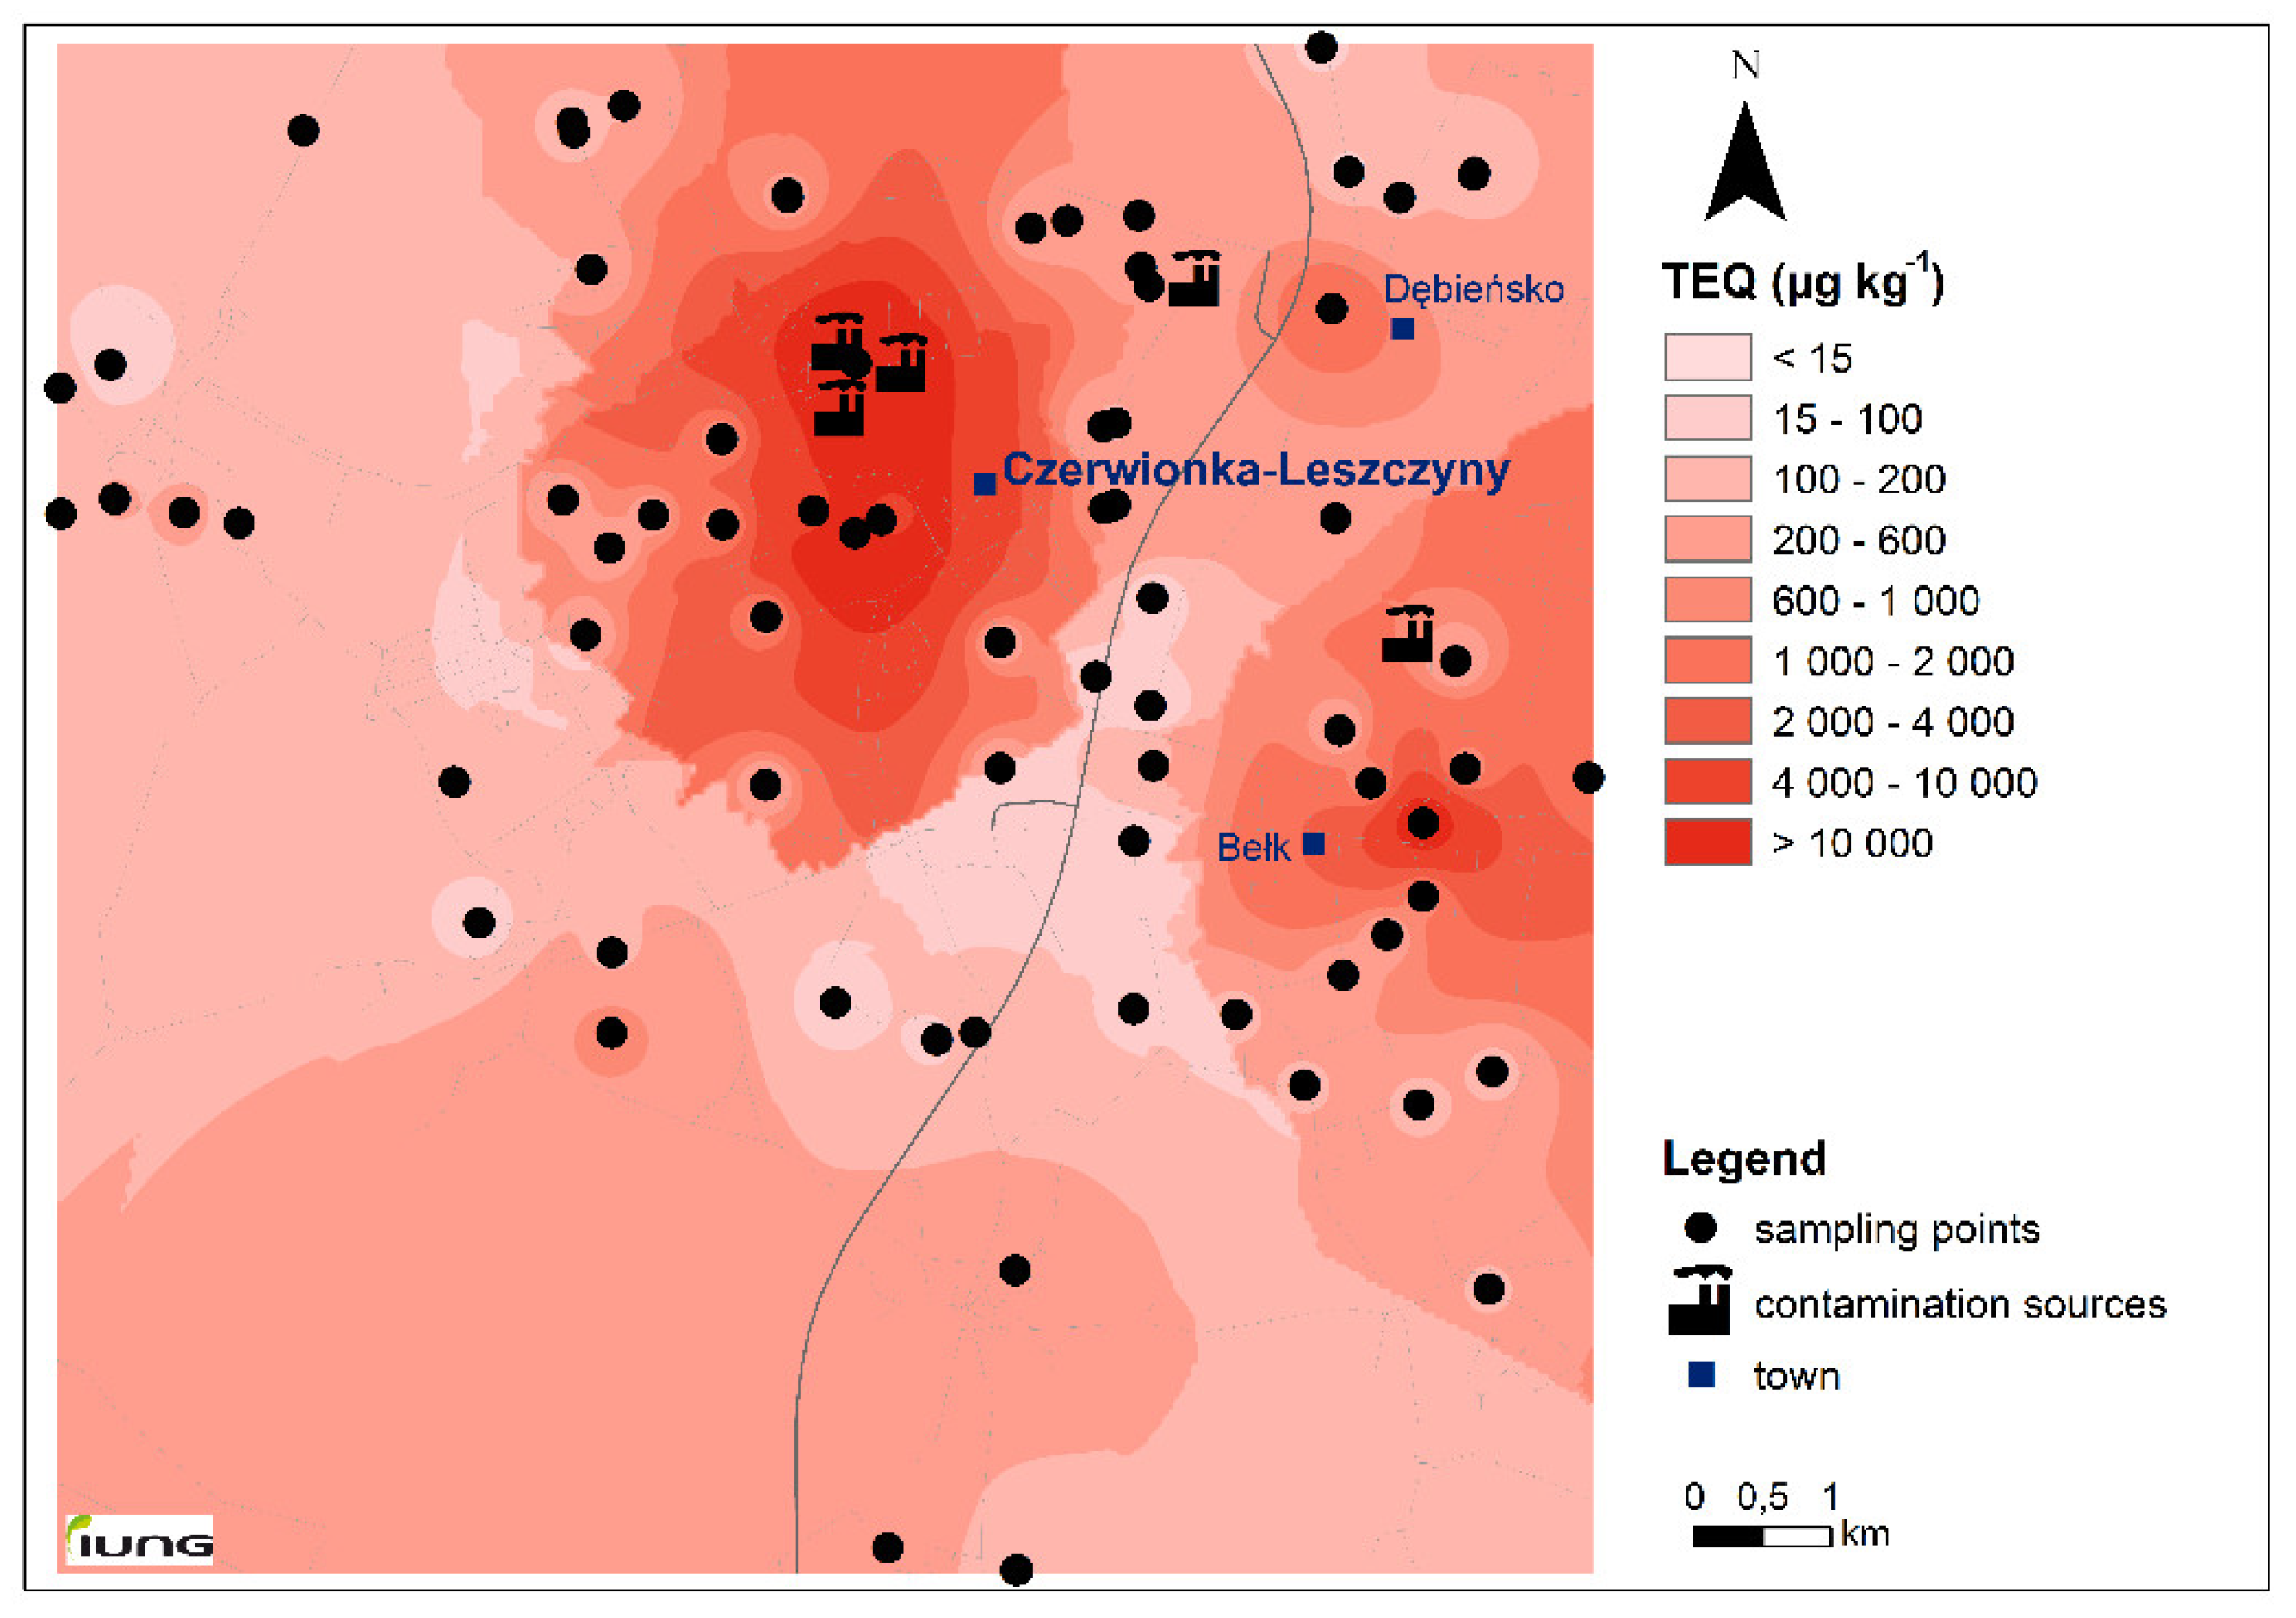
| PAHs | TEFs | TEQ | ||||||
|---|---|---|---|---|---|---|---|---|
| Min | LQ | Mean | Median | UQ | Max | CoV | ||
| Napht | 0.001 | 0.02 | 0.04 | 0.30 | 0.06 | 0.09 | 5.4 | 325 |
| Acyn | 0.001 | 0.001 | 0.003 | 0.05 | 0.01 | 0.01 | 1.4 | 433 |
| Acen | 0.001 | 0.003 | 0.007 | 0.09 | 0.01 | 0.02 | 2.4 | 402 |
| Flu | 0.001 | 0.003 | 0.008 | 0.12 | 0.01 | 0.02 | 2.5 | 394 |
| Phen | 0.001 | 0.03 | 0.08 | 1.16 | 0.13 | 0.23 | 27.3 | 382 |
| Anth | 0.01 | 0.02 | 0.05 | 2.12 | 0.12 | 0.22 | 66.4 | 457 |
| Fln | 0.001 | 0.04 | 0.12 | 2.08 | 0.24 | 0.47 | 47.1 | 399 |
| Pyr | 0.001 | 0.03 | 0.08 | 1.68 | 0.18 | 0.35 | 44.3 | 412 |
| BaA | 0.1 | 1.44 | 3.08 | 85.59 | 6.93 | 12.57 | 2459.8 | 436 |
| Ch | 0.01 | 0.19 | 0.51 | 8.45 | 0.94 | 1.81 | 216.5 | 404 |
| BbF | 0.1 | 0.91 | 8.19 | 111.08 | 13.24 | 23.98 | 2583.1 | 395 |
| BkF | 0.1 | 0.93 | 2.47 | 63.73 | 5.37 | 8.20 | 2000.9 | 462 |
| BaPyr | 1 | 9.77 | 40.81 | 1089.4 | 96.25 | 138.0 | 40,750.3 | 479 |
| IndPyr | 0.1 | 1.06 | 4.14 | 76.77 | 7.32 | 11.8 | 2348.1 | 439 |
| DahA | 1 | 1.48 | 6.84 | 77.11 | 13.96 | 24.50 | 2207.0 | 381 |
| BPer | 0.01 | 0.08 | 0.38 | 7.22 | 0.69 | 1.02 | 258.2 | 465 |
| Σ16PAH | - | 21 | 68 | 1527 | 151 | 225 | 52,531 | 456 |
| Index | Criterion | Class Number | ||||||
|---|---|---|---|---|---|---|---|---|
| FD | 1 | 2 | 3 | 4 | 5 | i | ||
| Σ16PAH | A | 58.1% | 25.0% | 75.0% | 64.9% | 66.7% | 66.7% | * |
| Σ16PAH | <600 µg kg−1 | 79.7% | - | - | - | - | - | |
| HI | B | 83.8% | 92.8% | 61.5% | 50% | - | - | |
| HI | < 10 | 85.1% | - | - | - | - | - | |
| TUm | C | 83.8% | 91.2% | 53.8% | 75% | - | - | |
| TUm | TUm < 10 | 87.9% | - | - | - | - | - | |
| TPm | D | 33.8% | 20% | 75% | 26.7% | 38.5% | - | |
| TPm | TPm < 0.5 | 71.6% | - | - | - | - | - | |
| TEQ | E | 70.3% | - | - | - | - | - | <100 |
| TEQ | E | 79.7% | - | - | - | - | - | <200 |
| TEQ | E | 94.6% | - | - | - | - | - | <600 |
| TEQ | E | 94.6% | - | - | - | - | - | <1000 |
| TEQ | E | 94.6% | - | - | - | - | - | <2000 |
| TEQ | E | 94.6% | - | - | - | - | - | <4000 |
| TEQ | E | 95.9% | - | - | - | - | - | <10,000 |
© 2020 by the authors. Licensee MDPI, Basel, Switzerland. This article is an open access article distributed under the terms and conditions of the Creative Commons Attribution (CC BY) license (http://creativecommons.org/licenses/by/4.0/).
Share and Cite
Klimkowicz-Pawlas, A.; Debaene, G. Screening Risk Assessment of Agricultural Areas under a High Level of Anthropopressure Based on Chemical Indexes and VIS-NIR Spectroscopy. Molecules 2020, 25, 3151. https://doi.org/10.3390/molecules25143151
Klimkowicz-Pawlas A, Debaene G. Screening Risk Assessment of Agricultural Areas under a High Level of Anthropopressure Based on Chemical Indexes and VIS-NIR Spectroscopy. Molecules. 2020; 25(14):3151. https://doi.org/10.3390/molecules25143151
Chicago/Turabian StyleKlimkowicz-Pawlas, Agnieszka, and Guillaume Debaene. 2020. "Screening Risk Assessment of Agricultural Areas under a High Level of Anthropopressure Based on Chemical Indexes and VIS-NIR Spectroscopy" Molecules 25, no. 14: 3151. https://doi.org/10.3390/molecules25143151
APA StyleKlimkowicz-Pawlas, A., & Debaene, G. (2020). Screening Risk Assessment of Agricultural Areas under a High Level of Anthropopressure Based on Chemical Indexes and VIS-NIR Spectroscopy. Molecules, 25(14), 3151. https://doi.org/10.3390/molecules25143151