Abstract
A new colorimetric and fluorescence probe NRSH based on Nile-red chromophore for the detection of biothiols has been developed, exhibiting high selectivity towards biothiols over other interfering species. NRSH shows a blue shift in absorption peak upon reacting with biothiols, from 587 nm to 567 nm, which induces an obvious color change from blue to pink and exhibits a 35-fold fluorescence enhancement at 645 nm in red emission range. NRSH displays rapid (<1 min) response for H2S, which is faster than other biothiols (>5 min). The detection limits of probe NRSH towards biothiols are very low (22.05 nM for H2S, 34.04 nM for Cys, 107.28 nM for GSH and 113.65 nM for Hcy). Furthermore, NRSH is low cytotoxic and can be successfully applied as a bioimaging tool for real-time monitoring biothiols in HeLa cells. In addition, fluorescence mechanism of probe NRSH is further understood by theoretical calculations.
1. Introduction
As important reactive sulfur species, small molecular biothiols, such as hydrogen sulfide (H2S), cysteine (Cys), homocysteine (Hcy) and glutathione (GSH), play important roles in physiological activities and pathological processes [1,2]. The abnormal levels of intracellular biothiols are closely related to many diseases, including neurotoxicity, cardiovascular diseases, liver damage, Alzheimer’s disease, cancer, and so on [3,4,5]. Therefore, developing hypersensitive methods of detecting biothiols is urgently required, which would be of great assistance to explore the intracellular behavior of biothiols in living organisms and special physiological environments.
Recently, due to high sensitivity and the capability of real-time imaging, fluorescence probes for biothiol detection have attracted more and more attention. A variety of fluorescence probes for biothiols have been devised based on various strategies, including deprotection of 2,4-dinitrobenzenesulfonyl (DNBS), cyclization reaction of aldehyde, Michael addition, thiol-halogen nucleophilic substitution, disulfide exchange reaction and others [6,7,8,9]. Among these strategies, the DNBS-based strategy stands out because of the unique sensitivity and high reactivity of DNBS group towards thiolate anion. Importantly, DNBS can be utilized to design turn-on fluorescence probes since the functional group could totally quench fluorescence [10,11,12,13,14]. On the other hand, multifarious fluorophores have been applied to detect biothiols, including naphtalimide, fluorescein, rhodamine, coumarin, and BODIPY. However, only a few of them could achieve ideal results towards biothiols in the long wavelength region [15,16,17,18,19]. Nile-red (9-(diethylamino)-5H-benzo[a]phenoxazin-5-one, NR), a dye used to stain in cells, is known to display a blue shift in emission wavelength with increasing hydrophobicity of the environment. Therefore, Nile-red and its derivatives have been used to bioassay because of their high molar-absorption coefficients and long-wavelength emissions [20,21,22,23,24,25,26,27,28].
Colorimetric and fluorescent probes have become a new hotspot owing to their remarkable advantages in fundamental study of analytical chemistry and photochemistry [29,30,31,32,33,34,35]. To date, a lot of colorimetric and fluorescent probes for biothiols have been developed [36,37,38,39,40]. Latterly, scientists have begun to design new fluorescent probes based on Nile-red fluorophore for detecting biothiols, and several good probes have been reported [41,42,43,44]. Cui’s group developed a fluorescent probe based on Nile-red for H2S detection [43]. The probe exhibits a high sensitivity and selectivity for H2S when compared with other small biothiols. Using acrylate group as a reaction site, Ge’s group constructs two NR-based probes for Cys detection [44]. In selectivity experiments, it is found that Hcy and GSH displayed slight fluorescence enhancement, and Cys could induce a remarkable enhancement.
However, the fluorescent probe based on Nile-red fluorophore for detecting more than one type of biothiols is rarely [45,46]. Herein a new colorimetric and fluorescent probe NRSH (2-O-(2,4-dinitrobenzenesulfonyl)-9-(diethylamino)-5H-benzo[a]phenoxazin-5-one) based on Nile-red fluorophore has been developed to detect the biothiols (Scheme 1). When the probe responds to biothiols, the DNBS group can be removed by mercapto nucleophilic reaction resulting in the generation of NR with strong red fluorescence emission. As we expected, NRSH can act as a colorimetric and long wavelength fluorescent sensor for biothiols. According to the response times of NRSH to biothiols, the probe can be a promising and effective tool to further discriminate H2S (<30 s) and Cys (>5 min) from Hcy/GSH (>15 min). In addition, the probe exhibits low detection limits towards biothiols. Most importantly, NRSH is low cytotoxic and can be applied as a bioimaging tool for real-time monitoring biothiols in HeLa cells.
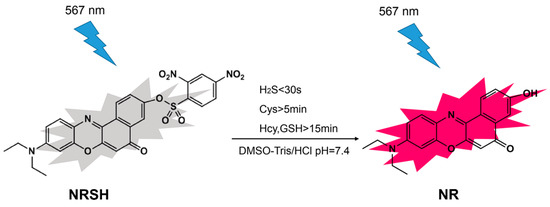
Scheme 1.
The fluorescence mechanism of NRSH probe.
2. Results and Discussion
2.1. Design of the Probe NRSH
NRSH has been designed as shown in Scheme 1, and characterized by HRMS and NMR spectroscopy. The detailed spectrum diagrams of structural characterization are shown in the supporting information (Figures S1–S3). The fluorophore NR is selected due to a large long wavelength fluorophore and typical intramolecular charge transfer (ICT) process [47,48,49,50], and DNBS is introduced by esterification reaction to form NRSH, which might feature a weak fluorescence owing to a characteristic photoinduced electron transfer (PET) process. In the presence of biothiols, such as Cys and GSH etc., DNBS can be removed by mercapto nucleophilic reaction resulting in the generation of NR with strong red fluorescence emission at, 645 nm. We anticipate that the probe can be used for detecting biothiols in living cell imaging. In this report, the fluorescent probe NRSH shows to be very effective in detecting biothiols, as expected.
2.2. Optical Properties
The spectral responses of NRSH toward Cys were firstly investigated upon the gradual addition of Cys (0–30 μM) in DMSO-Tris/HCl buffer (10 mM, pH = 7.4, 2:1, v/v). As shown in Figure 1a, NRSH shows a maximal absorption peak change from 587 nm (ε = 4.00 × 10⁴ M−1 cm−1) to 567 nm (ε = 3.42 × 10⁴ M−1 cm−1) in the above system. Simultaneously, the new absorption peak at 360 nm (ε = 1.69 × 10⁴ M−1 cm−1) is observed. The solution color changed clearly from blue to pink (Figure 1a inset). Along with the UV-vis changes, NRSH displays essential fluorescence emission enhancement at 645 nm upon the addition of Cys. After 2 equiv of Cys was added, the fluorescence is saturated and fluorescence intensity increased about 35-fold (Figure 1b). The responses of NRSH toward other biothiols were investigated in the same system as above (Figures S4–S6). The detection limit was calculated using the 3σ/k method reported in the literature [51], where σ is the standard deviation of blank measurement, which was determined from the fluorescence intensity of NRSH without biothiols for 11 repetitions, k is the slope between the emission intensity of 645 nm and the corresponding concentrations of biothiols). The corresponding detection limits based on the fluorescence titration are 22.05 nM for H2S, 34.04 nM for Cys, 107.28 nM for GSH and 113.65 nM for Hcy from 20 blank solutions (Figure S7). Notably, these results indicate that the probe is highly sensitive and may be suitable for detecting biothiols in living systems.
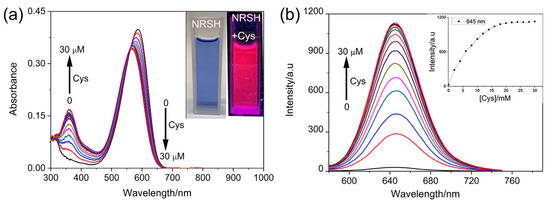
Figure 1.
(a) Absorption titration of probe (10 μM) toward Cys in DMSO-Tris/HCl buffer (10 mM, pH = 7.4 2:1, v/v), inset: color changes observed; (b) Fluorescence emission of probe toward Cys, inset: plot of the fluorescence intensity of 645 nm with the concentration of Cys; Conditions: incubating in the room temperature for 10 min, slit: excite = emission = 5 nm, λex = 567 nm.
The response times of NRSH to biothiols were investigated at room temperature. NRSH responds rapidly to H2S, and the sensing reaction can complete within 1 min (30 μM NaHS) in DMSO-Tris/HCl buffer. Other biothiols (30 μM), however, cannot complete reaction within 5 min (Figure 2a, Figure S8). The pseudo- first-order rate constants were determined by fitting the fluorescence intensities to the pseudo-first-order equation, and the values are calculated to be 7.17 × 10⁻³ s for H2S, 6.63 × 10⁻³ s for Cys, 1.43 × 10⁻³ s for GSH and 1.28 × 10⁻³ s for Hcy (Figure 2b). These results can be attributed to pKa value. The hydrosulfide anion (HS−) has low pKa value (~7.0), which is considered to be more nucleophilic than other biothiols in neutral medium; other biothiols have high pKa values (Cys 8.53, GSH 9.20, Hcy 10.00). Therefore, HS- can react faster than other biothiols.
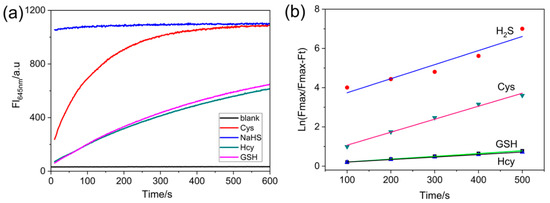
Figure 2.
(a) Time-dependent fluorescence intensity changes at 645 nm of probe (10 μM) in the absence or presence of biothiols (30 μM) in DMSO-Tris/HCl buffer (10 mM, pH = 7.4 2:1, v/v); (b) The pseudo-first-order kinetic plot of the reaction of probe (10 μM) with biothiols (30 μM). Conditions: incubating in the room temperature for 10 min, slit: excite = emission = 5 nm, λex = 567 nm.
To evaluate the selectivity toward biothiols, we measured the fluorescence response of NRSH towards other various analytes, and the turn-on fluorescence emission is observed only with the biothiols. Other analytes show negligible fluorescence changes (Figure 3a). These results feature that NRSH is highly selective towards biothiols. The digital photograph of probe NRSH with different analytes under ambient light and 365 nm UV lamp are shown in Figure 3b. Differentiated colors can be observed by naked eyes under ambient light, and the strong red fluorescence is obtained in addition of biothiols under 365 nm UV lamp. These results indicate that biothiols can be detected through colorimetric and turn-on fluorescence dual channels by probe NRSH. Furthermore, the pH effect was measured upon addition of biothiols into NRSH in a mixture of DMSO-buffer (2:1 v/v) with pH changing from 5.0 to 8.5 (Figure 4). The fluorescence intensity displays almost no change for NRSH alone in a wide pH range. These results indicate that NRSH is stable in this pH range. After addition of biothiols, the fluorescence intensity increases dramatically in the pH range of 6.0–8.0. These results indicate that NRSH is a promising molecular tool for biological applications under neutral conditions.
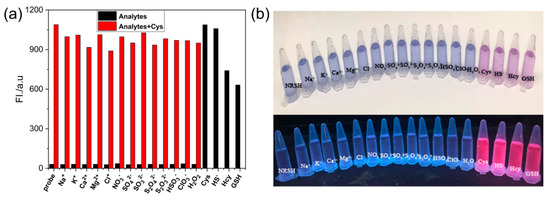
Figure 3.
(a) Fluorescence responses of NRSH (10 μM) in the presence of different analytes (black bars), followed by addition of Cys (30 μM) (red bars); (b) Photographs observed after the addition of various analytes to the solution of NRSH under nature light (up) and 365 nm UV light (down). Conditions: incubating in the room temperature for 10 min, slit: excite = emission = 5 nm, λex = 567 nm.
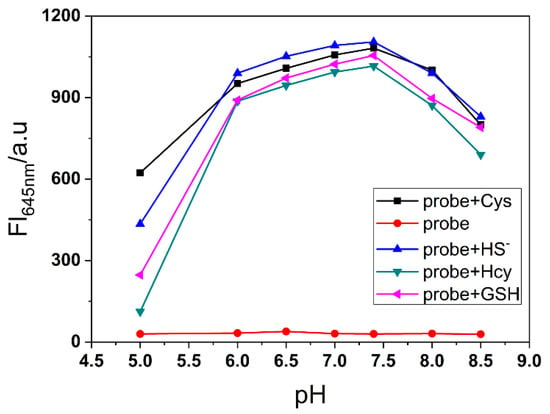
Figure 4.
The fluorescence intensity changes of NRSH at 645 nm (10 μM) with different pH values in the absence and presence of biothiols (30 μM for H2S and Cys; 100 μM for GSH and Hcy). Conditions: incubating in the room temperature for 10 min, slit: excite=emission = 5 nm, λex = 567 nm.
To confirm the detection mechanism, the absorption and emission spectra of NR, NRSH and the reaction solution of NRSH with Cys (30 μM) were obtained. The maximal absorption peak and the emission peak of reaction solution are in accordance with NR (Figure S9). Meanwhile, the reaction products of NRSH with Cys were marked in mass spectrum. It gives the mass peaks at m/z 335.1, which corresponds to [NR + H]+. On the other hand, the peak at m/z 288.3 is found, which might be the mass of [1 + H]+ (Scheme 2, Figure S9c). Based on these results, the sensing process of probe NRSH to biothiols is most likely the reaction process of thiolysis of the 2,4-dinitrobenzenesulfonyl ester.
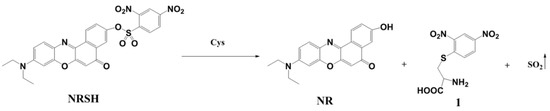
Scheme 2.
The sensing process of probe NRSH.
2.3. Cell Imaging
Furthermore, we proceeded to validate the feasibility of NRSH to image biothiols in living cells. Firstly, the cytotoxicity of NRSH was evaluated by an MTT assay in Hela cells incubated with different concentrations of NRSH (6.25, 12.5, 25, 50, 100 μM). These results suggest that NRSH is low-toxic to Hela cells even for 48 h with the concentration up to 100 μM (Figure 5a). Secondly, the real-time imaging capability of NRSH was tested by confocal microscope. It is clearly seen that red fluorescence gradually enhanced in the cells along with the increasing incubation time (Figure 5b). However, no intracellular red fluorescence exists after incubating the same time without probe (Figure S10). Thirdly, we conducted control experiments to trap intracellular thiols with NEM (10 mM). The HeLa cells were pretreated with NEM for 30 min followed by the addition of NRSH (10 μM). As expected, cells do show very weak fluorescence signal within the incubation time for 30 min (Figure S11). The living cells were then added Cys (100 μM), and the red fluorescence was quickly observed again within incubation time. These results indicate that the probe NRSH can easily penetrate cell membrane resulting in the fluorescent label, and that the fluorescence changes in living cells are indeed caused by biothiols.
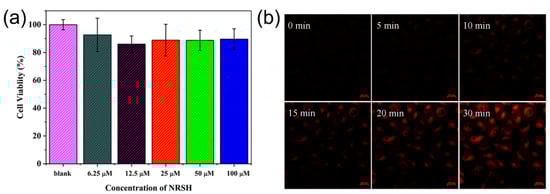
Figure 5.
(a) Cell viability values (%) estimated by MTT versus different incubation concentrations of NRSH. Hela cells were cultured for 48 h in the presence of NRSH (6.25, 12.5, 25, 50, 100 μM); The confocal microscopic images of NRSH (10 μM) in Hela cells with time: (b) The fluorescence imaging of endogenous Cys in living HeLa cells incubated with probe.
2.4. Computational Analysis
The molecular electrostatic potential (MEP) maps of NR and NRSH were calculated at DFT/B3YLP/6-311G** level in DMSO medium. MEP is an important parameter to explore intermolecular electrostatic interaction and to predict molecular properties. According to MEP maps in Figure 6, diethylamide moiety always shows blue MEP surface, which represents positive electrostatic potentials. In other words, this group is a strong electron-donating group. On the contrary, DNBS moiety in NRSH shows red MEP surface, indicating a strong electron-withdrawing group. Similarly, carbonyl group in two molecules also shows red MEP surface. In summary, all these MEP features are consistent with our design.
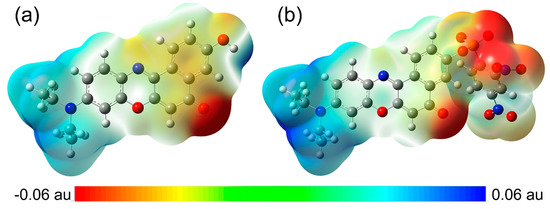
Figure 6.
Molecular electrostatic potential (MEP) maps for (a) NR and (b) NRSH.
The electron distribution in the frontier molecular orbitals were accomplished with TD-DFT/B3YLP/6-311G** calculation. And the distribution in HOMO and LUMO are shown in Figure 7. HOMO has the properties of electron donor because of the attraction to its electrons is relatively loose. While LUMO has the properties of electron acceptor because of its electron affinity is relatively strong. It can be easily seen that the contributions to the HOMOs of two compounds are largely located on the backbone of the four connected six-membered rings and diethylamide moieties. The electron densities in the LUMO of NR displays a similar distribution of the HOMO, and both the contributions to the two frontier orbitals are located on the whole NR, which corresponds to the activated ICT process. However, the contribution to the LUMO of NRSH is only located on DNBS group, which coincides with its strong electron-withdrawing property. Consequently, this distributive character indicates that an effective PET process occurs in the excited states of NRSH to suppress the fluorescence emission because it has strong quenching moiety DNBS. As a result, the distributive characters of theses frontier molecular orbitals are in accordance with the above optical properties experiments.
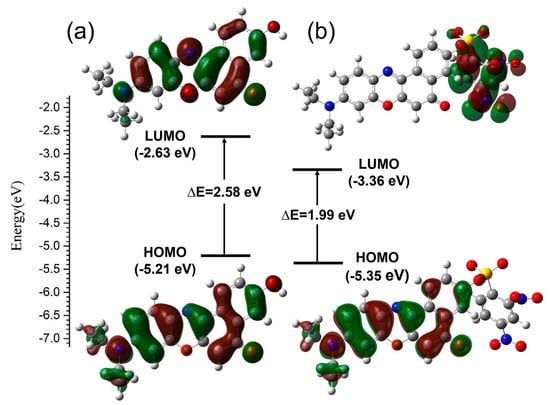
Figure 7.
Molecular orbital diagrams and excitation energies of NR (a) and NRSH (b).
The fluorescence emission spectra of NR and NRSH were accomplished with TD-DFT/B3YLP/6-311G** calculation, and the crucial results are listed in Table 1. According to the Kasha’s rule, fluorophor emits from the lowest state S1 [52]. As shown in Table 1 and Tables S1 and S2, the fluorescence emission wavelength (λfluo) at the first transition state (S0→S1) of NR is predicted at 622 nm (1.99 eV), which is overestimated by 0.07 eV when in comparison with the experimental data (645 nm, 1.92 eV) measured in DMSO. Moreover, the calculated λfluo value of NRSH (1381 nm) is out of the test range (200–900 nm) of the fluorescence spectrophotometer and the oscillator strengths (f) value (0.0001) is evidently less than 0.01, implying that forbidden transition occurs in the excited states of NRSH. Therefore, the theoretical calculation results basically conform with the data measured in the experiment.

Table 1.
Calculated fluorescence wavelengths (λfluo), oscillator strengths (f), molecular orbital transition contributions to the fluorescence emission spectra and experimental data for the S0 → S1 excited states of NR and NRSH.
In order to provide a further insight into electron excitation properties, hole-electron distribution analyses were carried out with Multiwfn 3.6 program [53,54]. From the Multiwfn manual, the opinion, “an electron leaves hole and goes to electron”, is used to depict the process of single-electron excitation [53]. As shown in Figure 8a,b (at default isosurface value 0.002), blue and green symbolize the hole distribution and electron distribution, respectively. In addition, the structures of two molecules are divided into 2 or 3 fragments for easy understanding. It can be observed that the trends of hole distributions for NR and NRSH are very similar from fragment 1 to fragment 2. The figure clearly shows that the overall charge transfer direction is from diethylamide group (fragment 1) to the four connected six membered rings moiety (fragment 2) for NR. However, for NRSH, almost all electron (99.6%) locates on the fragment 3 (DNBS group). Obviously, the electron excitation characters of NR and NRSH are corresponding to ICT process and PET process, respectively.
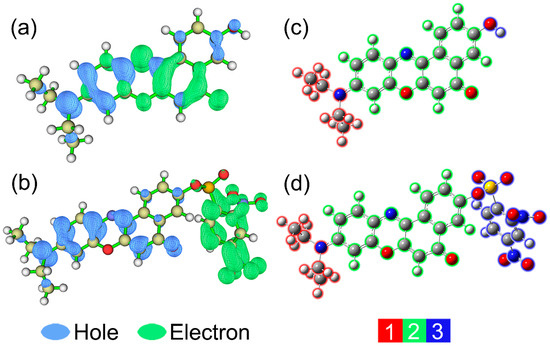
Figure 8.
Electron-hole distributions for the S0 to S1 transitions of (a) NR and (b) NRSH; fragment partitions for (c) NR and (d) NRSH.
In order to provide a quantitative analysis to figure out how many electrons transfer between different fragments, the interfragment charge transfer (IFCT) analyses were performed with Multiwfn 3.6 program [53], and the results are listed in Table 2 and Table 3. For NR, diethylamide (fragment 1) and carbonyl groups (fragment 3) donates 0.22362 and 0.01993 electrons to the four connected six-membered rings moiety (fragment 2), respectively. Therefore, the electron of fragment 2 totally increases by 0.24355 after the electron excitation. While for NRSH, fragment 1 and 2 all lose electrons and fragment 4 gains electrons. Notably, fragment 2 decreases by 0.74615 electrons after the electron excitation, which results in the fluorescence quenching. In conclusion, all theoretical calculation results are in good agreement with the experimental results.
Table 2.
Calculated variation of electron population number of each fragment of NR and NRSH.
Table 3.
Calculated net transferred electrons between fragments of NR and NRSH.
3. Experimental
3.1. Materials and Instrumentations
All solvents and reagents (analytical grade) were obtained commercially and used as received unless otherwise mentioned. Column-layer chromatographic silica gel was purchased from Qingdao Haiyang Chemical Co., Ltd. 1H and 13C-NMR spectra were collected in DMSO-d6 at 600 MHz frequency on AVANCE III HD 600 (Bruker Corporation, Rheinstetten, Germany) using TMS as an internal standard. High-resolution mass spectral analyses were carried out using Agilent1290/maXis impact (Bruker Corporation, Hamburg, Germany) at analytical and testing center of South China University of Technology. UV absorption spectra were recorded on a UV-2450 UV-Vis spectrophotometer (Shimadzu Corporation, Kyoto, Japan). Fluorescence measurements were performed using a F-4500 fluorescence spectrophotometer (Hitachi Corporation, Osaka, Japan) equipped with quartz cell of 10 mm path length. NR was synthesized by 5-(diethylamino)-2-nitrosophenol hydrochloride and 1,7-dihydroxynaphthalene based on a previously reported method [41].
3.2. Synthesis of NRSH
To an anhydrous dichloromethane solution (20 mL) containing NR (100 mg, 0.29 mmol) and triethylamine (0.50 mmol, 70 μL) was added dropwise 2,4-dinitrobenzenesulfonyl chloride (89 mg, 0.33 mmol) in dichloromethane (10 mL) at ice bath under the nitrogen atmosphere. The mixture was stirring for 6 h at room temperature, and then water was used to wash the resulting solution triply (30 mL × 3). The dichloromethane phase was dried over Na2SO4 for one night. After filtration and removal of the organic solvent, the product was purified with silica gel column chromatography by eluting with dichloromethane to yield an atrovirens solid (136 mg, 80%).
3.3. Measurement Procedures
The stock solution of NRSH (10 mM) was prepared by dissolving the required amount in analytical grade DMSO. Other analytes including NaCl, Na2SO4, Na2SO3, NaHSO3, Na2S2O3, Na2S2O4, Cys, Hcy, GSH, NaHS, KCl, MgCl2, CaCl2, H2O2 and NaClO were dissolved in deionized water to afford 10 mM aqueous solution. The stock solutions were made freshly and diluted to desirable concentrations. For a typical optical measurement, NRSH was diluted to 10 μM in DMSO-Tris/HCl buffer (10 mM, pH = 7.4, 2:1 v/v). The absorption and fluorescence spectra were recorded at room temperature. The fluorescence spectra were recorded under excitation at 567 nm. The slit size for excitation and emission was 5 nm, respectively.
3.4. Kinetic Studies
The reaction of probe with biothiols in DMSO-Tris/HCl buffer (10 mM, pH = 7.4 2:1, v/v) was monitored using the fluorescence intensity at 645 nm. The pseudo-first-order rate constant was determined by fitting the fluorescence intensity to the pseudo-first-order equation:
where Fmax and Ft were the fluorescence intensity at 645 nm at the maximum and at t time intensity, respectively. k was the pseudo-first-order rate constant. The pseudo-first-order plot for the reaction of probe (10 μM) with biothiols (30 μM) was calculated, and the slope of the line provided the pseudo-first-order rate constant.
3.5. Cell Image Experiment
HeLa cells were cultured in dulbecco’s modified eagle’s medium supplemented with 10% FBS 100 mg/mL penicillin and 100 mg/mL streptomycin in a 5% CO2, water saturated incubator at 37 °C, and then cells were seeded on cover glass bottom confocal dish and continuously incubated at 37 °C in a 5% CO2 atmosphere for 24 h (0.5% DMSO was controlled in the cell culture process). The cells were washed three times with PBS buffer solution, and observed by the confocal laser scanning microscopy. Red fluorescence was excited at 565 nm, and the emission was recorded from the red channel (600–750 nm).
3.6. Computation Details
The geometry optimization for the ground state structures of NR and NRSH were accomplished with density functional theory (DFT) calculations at B3YLP/6-311G** level. The frequency analyses were calculated, and no imaginary frequencies were observed, which confirmed that the optimized geometries were the local minima on the potential energy surface. Also, then the time-dependent density functional theory (TD-DFT) calculations were executed for the two optimized structures (Figures S12 and S13) at exited states, and the Cartesian coordinates are available in Tables S3 and S4. Ten lowest singlet states were used to calculate to ensure the accuracy of the results. Multiwfn 3.6 program [53] were used to analyze the charge transfer characteristics. To consider the solvent effect of DMSO, all calculations were in Solvent Model Density (SMD) model [55]. All the calculations mentioned above were implemented by Gaussian 09W program [56].
4. Conclusions
In summary, a new colorimetric and fluorescent probe NRSH based on Nile-red for the detection of biothiols has been reported. NRSH exhibits high sensitivity and selectivity toward biothiols. NRSH has faster response time to H2S (<1 min) and lower detection limits to biothiols than most reported articles (Table S5). However, the complete reaction of NRSH to other biothiols requires at least 7 min in the same conditions. These results may provide a way to distinguish between biothiols. Furthermore, NRSH is low-cytotoxic and can be used for real-time detect biothiols by cell fluorescence imaging in living cells, which demonstrates its potential usefulness as a molecular tool for tracking biothiols. We expect that the probe can help us to monitor the level of biothiols in a biological environment and reveal the mysteries of biological processes.
Supplementary Materials
The following materials are available online. Figure S1. 1H-NMR spectrum of NRSH. Figure S2. 13C-NMR spectrum of NRSH. Figure S3. HR-MS spectrum of NRSH. Figure S4. a) Fluorescent emission of probe toward GSH; b) plot of the fluorescent intensity of 645 nm with the concentration of GSH. Figure S5. (a) Fluorescent emission of probe toward Hcy; (b) plot of the fluorescent intensity of 645 nm with the concentration of Hcy. Figure S6. (a) Fluorescent emission of probe toward HS−; (b) plot of the fluorescent intensity of 645 nm with the concentration of HS−. Figure S7. Linear relationship of fluorescence intensity at 645 nm as a function of the concentration of biothiols: (a) Cys, (b) GSH, (c) Hcy, (d) HS−. Figure S8. The fluorescence intensity changes at 645 nm of NRSH along with time in the presence of a) Hcy and b) GSH. Figure S9. The UV-vis absorption spectra (a) and the fluorescence spectra (b) of NRSH, NR and the mixture of NRSH and Cys. (c) The MS spectra of reaction mixture of NRSH with Cys. Figure S10. HeLa cells were incubated without probe NRSH. Figure S11. The first row: Hela cells were pretreated with NEM for 30 min and further incubated in the presence of NRSH, the second row: Hela cells were further incubated with Cys after pretreatment with NEM and NRSH. Table S1. Excitation energies and oscillator strengths for NR. Table S2. Excitation energies and oscillator strengths for NRSH: Table S3. Atomic coordinates for NR. Table S4. Atomic coordinates for probe NRSH. Table S5 A comparison about our probe with some reported work.
Author Contributions
Conceptualization, Z.-Y.X. and L.Z.; methodology, B.Z. and L.Z.; software, X.R. and Z.-Z.M.; validation, X.R. and Z.-Y.X.; formal analysis, J.-W.Y., B.Z., Z.-Y.X. and X.R.; writing—original draft preparation, Z.-Y.X. and X.R.; writing—review and editing, X.R. and L.Z.; funding acquisition, L.Z. All authors have read and agreed to the published version of the manuscript.
Funding
This work was financially supported by Guangdong Provincial Department of Science and Technology (Grant No.: 2016A010121004).
Conflicts of Interest
The authors declare no conflict of interest.
References
- Li, Y.; Liu, W.; Zhang, P.; Zhang, H.; Wu, J.; Ge, J.; Wang, P. A fluorescent probe for the efficient discrimination of Cys, Hcy and GSH based on different cascade reactions. Biosens. Bioelectron. 2017, 90, 117–124. [Google Scholar] [CrossRef] [PubMed]
- Zhang, H.; Xu, L.; Chen, W.; Huang, J.; Huang, C.; Sheng, J.; Song, X. Simultaneous discrimination of cysteine, homocysteine, glutathione, and H2S in living cells through a multisignal combination strategy. Anal. Chem. 2018, 91, 1904–1911. [Google Scholar] [CrossRef] [PubMed]
- Chao, J.; Li, M.; Liu, Y.; Zhang, Y.; Huo, F.; Yin, C. Fluorescence detection and imaging in zebrafish and Arabidopsis thaliana based on Cys/Hcy breaking space effect. Sens. Actuators B 2019, 298, 126844. [Google Scholar] [CrossRef]
- Kang, J.; Huo, F.; Yao, Y.; Yin, C. A high signal-to-background ratio H2S-specific fluorescent probe based on nucleophilic substitution and its bioimaging for generation H2S induced by Ca2+ in vivo. Dyes Pigm. 2019, 171, 107755. [Google Scholar] [CrossRef]
- Wang, J.; Wen, Y.; Huo, F.; Yin, C. Based ‘successive’ nucleophilic substitution mitochondrial-targeted H2S red light emissive fluorescent probe and its imaging in mice. Sens. Actuators B 2019, 297, 126773. [Google Scholar] [CrossRef]
- Jiao, X.; Li, Y.; Niu, J.; Xie, X.; Wang, X.; Tang, B. Small-molecule fluorescent probes for imaging and detection of reactive oxygen, nitrogen, and sulfur species in biological systems. Anal. Chem. 2017, 90, 533–555. [Google Scholar] [CrossRef]
- Jung, H.S.; Chen, X.; Kim, J.S.; Yoon, J. Recent progress in luminescent and colorimetric chemosensors for detection of thiols. Chem. Soc. Rev. 2013, 42, 6019–6031. [Google Scholar] [CrossRef]
- Lee, S.; Li, J.; Zhou, X.; Yin, J.; Yoon, J. Recent progress on the development of glutathione (GSH) selective fluorescent and colorimetric probes. Coord. Chem. Rev. 2018, 366, 29–68. [Google Scholar] [CrossRef]
- Niu, L.; Chen, Y.; Zheng, H.; Wu, L.; Tung, C.; Yang, Q. Design strategies of fluorescent probes for selective detection among biothiols. Chem. Soc. Rev. 2015, 44, 6143–6160. [Google Scholar] [CrossRef]
- Hong, J.; Feng, W.; Feng, G. Highly selective near-infrared fluorescent probe with rapid response, remarkable large Stokes shift and bright fluorescence for H2S detection in living cells and animals. Sens. Actuators B 2018, 262, 837–844. [Google Scholar] [CrossRef]
- Li, Y.; Wang, K.; Liu, B.; Lu, X.; Li, M.; Ji, L.; Mao, Z. Mitochondria-targeted two-photon fluorescent probe for the detection of biothiols in living cells. Sens. Actuators B 2018, 255, 193–202. [Google Scholar] [CrossRef]
- Sedgwick, A.C.; Gardiner, J.E.; Kim, G.; Yevglevskis, M.; Lloyd, M.D.; Jenkins, A.T.A.; Bull, S.D.; Yoon, J.; James, T.D. Long-wavelength TCF-based fluorescence probes for the detection and intracellular imaging of biological thiols. Chem. Commun. 2018, 54, 4786–4789. [Google Scholar] [CrossRef]
- Wang, L.; Yang, X.F.; Zhao, M. A 4-methylumbelliferone-based fluorescent probe for the sensitive detection of captopril. J. Fluoresc. 2009, 19, 593–599. [Google Scholar] [CrossRef] [PubMed]
- Zhang, S.; Wang, Q.; Liu, X.; Zhang, J.; Yang, X.F.; Li, Z.; Li, H. Sensitive and selective fluorescent probe for selenol in living cells designed via a pKa shift strategy. Anal. Chem. 2018, 90, 4119–4125. [Google Scholar] [CrossRef] [PubMed]
- Bu, L.; Chen, J.; Wei, X.; Li, X.; Ågren, H.; Xie, Y. An AIE and ICT based NIR florescent probe for cysteine and homocysteine. Dyes Pigm. 2017, 136, 724–731. [Google Scholar] [CrossRef]
- Jiang, X.; Zhang, J.; Shao, X.; Zhao, W. A selective fluorescent turn-on NIR probe for cysteine. Org. Biomol. Chem. 2012, 10, 1966–1968. [Google Scholar] [CrossRef] [PubMed]
- Liu, K.; Shang, H.; Kong, X.; Lin, W. A novel near-infrared fluorescent probe with a large Stokes shift for biothiol detection and application in in vitro and in vivo fluorescence imaging. J. Mater. Chem. B 2017, 5, 3836–3841. [Google Scholar] [CrossRef] [PubMed]
- Meng, Y.L.; Xin, Z.H.; Jia, Y.J.; Kang, Y.F.; Ge, L.P.; Zhang, C.H.; Dai, M.Y. A near-infrared fluorescent probe for direct and selective detection of cysteine over homocysteine and glutathione. Spectrochim. Acta Part A 2018, 202, 301–304. [Google Scholar] [CrossRef]
- Zhang, X.; Liu, J.; Ma, W.; Yang, M. Near-infrared fluorescence of π-conjugation extended benzothiazole and its application for biothiol imaging in living cells. J. Mater. Chem. B 2016, 4, 6662–6669. [Google Scholar] [CrossRef]
- Black, S.L.; Stanley, W.A.; Filipp, F.V.; Bhairo, M.; Verma, A.; Wichmann, O.; Sattler, M.; Wilmanns, M.; Schultz, C. Probing lipid- and drug-binding domains with fluorescent dyes. Biorg. Med. Chem. 2008, 16, 1162–1173. [Google Scholar] [CrossRef]
- Fan, J.; Guo, S.; Wang, S.; Kang, Y.; Yao, Q.; Wang, J.; Gao, X.; Wang, H.; Du, J.; Peng, X. Lighting-up breast cancer cells by a near-infrared fluorescent probe based on KIAA1363 enzyme-targeting. Chem. Commun. Camb. 2017, 53, 4857–4860. [Google Scholar] [CrossRef] [PubMed]
- Jiang, X.; Guan, J.; Bian, H.; Xiao, Y. A cinnamoyl substituted Nile Red-based probe to detect hydrazine. Tetrahedron Lett. 2017, 58, 2351–2354. [Google Scholar] [CrossRef]
- Kong, X.; Dong, B.; Zhang, N.; Wang, C.; Song, X.; Lin, W. A unique red-emitting two-photon fluorescent probe with tumor-specificity for imaging in living cells and tissues. Talanta 2017, 174, 357–364. [Google Scholar] [CrossRef] [PubMed]
- Li, K.; Chen, F.; Zhang, S.; Shi, W.; Han, D.; Cai, C.; Chen, C.X. A nile red-based near-infrared fluorescent probe for endogenous hydrogen polysulfides in living cells. Anal. Methods 2017, 9, 6443–6447. [Google Scholar] [CrossRef]
- Park, S.; Kubota, Y.; Funabiki, K.; Shiro, M.; Matsui, M. Near-infrared solid-state fluorescent naphthooxazine dyes attached with bulky dibutylamino and perfluoroalkenyloxy groups at 6- and 9-positions. Tetrahedron Lett. 2009, 50, 1131–1135. [Google Scholar] [CrossRef]
- Rostron, K.A.; Lawrence, C.L. Nile Red Staining of Neutral Lipids in Yeast. Methods Mol. Biol. 2017, 1560, 219–229. [Google Scholar] [PubMed]
- Takeshita, T.; Takeda, K.; Ota, S.; Yamazaki, T.; Kawano, S. A Simple Method for Measuring the Starch and Lipid Contents in the Cell of Microalgae. Cytologia 2015, 80, 475–481. [Google Scholar] [CrossRef]
- Wichmann, O.; Gelb, M.H.; Schultz, C. Probing phospholipase A2 with fluorescent phospholipid substrates. ChemBioChem 2007, 8, 1555–1569. [Google Scholar] [CrossRef]
- Jiang, X.; Yu, H.; Zhao, J.; Sun, C.; Xie, Y.; Xiao, L. A colorimetric chemosensor based on new water-soluble PODIPY dye for Hg2+ detection. Chin. Chem. Lett. 2015, 26, 1241–1245. [Google Scholar] [CrossRef]
- Lee, J.; Lee, Y.J.; Ahn, Y.J.; Choi, S.; Lee, G.J. A simple and facile paper-based colorimetric assay for detection of free hydrogen sulfide in prostate cancer cells. Sens. Actuators B 2018, 256, 828–834. [Google Scholar] [CrossRef]
- Murugesan, K.; Jeyasingh, V.; Lakshminarayanan, S.; Govindaraj, T.S.; Paulraj, M.S.; Narayanan, S.; Piramuthu, L. Electron-deficient tripodal amide based receptor: An exclusive turn-on fluorescent and colorimetric chemo sensor for cyanide ion. Spectrochim. Acta Part A 2018, 198, 309–314. [Google Scholar] [CrossRef] [PubMed]
- Tsumura, S.; Enoki, T.; Ooyama, Y. A colorimetric and fluorescent sensor for water in acetonitrile based on intramolecular charge transfer: D-(π-A)2-type pyridine-boron trifluoride complex. Chem. Commun. Camb. 2018, 54, 10144–10147. [Google Scholar] [CrossRef] [PubMed]
- Wang, L.; Zhuo, S.; Cao, D. A colorimetric and fluorescent probe based on michael acceptor type diketopyrrolopyrrole for cyanide detection. J. Fluoresc. 2017, 27, 1587–1594. [Google Scholar] [CrossRef] [PubMed]
- Yang, Z.; Fu, K.; Yu, J.; Zhou, P.; Cheng, Z. A colorimetric and fluorescent indicator for Hg2+ detection based on cinnamamide group-containing rhodamine derivative. J. Fluoresc. 2018, 28, 905–911. [Google Scholar] [CrossRef]
- Zhang, J.; Peng, A.; Lv, Y.; Zhang, Y.; Wang, X.; Zhang, G.; Tian, Z. A colorimetric fluorescent probe for SO2 derivatives-bisulfite and sulfite at nanomolar level. J. Fluoresc. 2017, 27, 1767–1775. [Google Scholar] [CrossRef]
- Feng, S.; Fang, Y.; Feng, W.; Xia, Q.; Feng, G. A colorimetric and ratiometric fluorescent probe with enhanced near-infrared fluorescence for selective detection of cysteine and its application in living cells. Dyes Pigm. 2017, 146, 103–111. [Google Scholar] [CrossRef]
- Qi, S.; Liu, W.; Zhang, P.; Wu, J.; Zhang, H.; Ren, H.; Ge, J.; Wang, P. A colorimetric and ratiometric fluorescent probe for highly selective detection of glutathione in the mitochondria of living cells. Sens. Actuators B 2018, 270, 459–465. [Google Scholar] [CrossRef]
- Wang, Y.; Zhu, M.; Jiang, E.; Hua, R.; Na, R.; Li, Q.X. A simple and rapid turn on ESIPT fluorescent probe for colorimetric and ratiometric detection of biothiols in living cells. Sci. Rep. 2017, 7, 4377. [Google Scholar] [CrossRef]
- Zhang, X.; Yan, Y.; Hang, Y.; Wang, J.; Hua, J.; Tian, H. A phenazine-barbituric acid based colorimetric and ratiometric near-infrared fluorescent probe for sensitively differentiating biothiols and its application in TiO2 sensor devices. Chem. Commun. 2017, 53, 5760–5763. [Google Scholar] [CrossRef]
- Zhao, B.; Yang, B.; Hu, X.; Liu, B. Two colorimetric and ratiometric fluorescence probes for hydrogen sulfide based on AIE strategy of alpha-cyanostilbenes. Spectrochim. Acta Part A 2018, 199, 117–122. [Google Scholar] [CrossRef]
- Liu, X.D.; Fan, C.; Sun, R.; Xu, Y.J.; Ge, J.F. Nile-red and Nile-blue-based near-infrared fluorescent probes for in-cellulo imaging of hydrogen sulfide. Anal. Bioanal. Chem. 2014, 406, 7059–7070. [Google Scholar] [CrossRef] [PubMed]
- Lu, J.; Song, Y.; Shi, W.; Li, X.; Ma, H. A long-wavelength fluorescent probe for imaging reduced glutathione in live cells. Sens. Actuators B 2012, 161, 615–620. [Google Scholar] [CrossRef]
- Tang, C.; Zheng, Q.; Zong, S.; Wang, Z.; Cui, Y. A long-wavelength-emitting fluorescent turn-on probe for imaging hydrogen sulfide in living cells. Sens. Actuators B 2014, 202, 99–104. [Google Scholar] [CrossRef]
- Yang, X.Z.; Wei, X.R.; Sun, R.; Xu, Y.J.; Ge, J.F. Benzoxazine-based fluorescent probes with different auxochrome groups for cysteine detection. Spectrochim. Acta Part A 2020, 226, 117582. [Google Scholar] [CrossRef] [PubMed]
- Niu, H.; Ni, B.; Chen, K.; Yang, X.; Cao, W.; Ye, Y.; Zhao, Y. A long-wavelength-emitting fluorescent probe for simultaneous discrimination of H2S/Cys/GSH and its bio-imaging applications. Talanta 2019, 196, 145–152. [Google Scholar] [CrossRef]
- Lan, J.S.; Zeng, R.F.; Liu, Y.; Xiang, Y.W.; Jiang, X.Y.; Liu, L.; Xie, S.S.; Ding, Y.; Zhang, T. A near-infrared Nile red fluorescent probe for the discrimination of biothiols by dual-channel response and its bioimaging applications in living cells and animals. Analyst 2019, 144, 3676–3684. [Google Scholar] [CrossRef]
- Sarkar, N.; Das, K.; Nath, D.N.; Bhattacharyya, K. Twisted charge transfer processes of Nile red in homogeneous solutions and in faujasite zeolite. Langmuir 1994, 10, 326–329. [Google Scholar] [CrossRef]
- Datta, A.; Mandal, D.; Pal, S.K.; Bhattacharyya, K. Intramolecular Charge Transfer Processes in Confined Systems. Nile Red in Reverse Micelles. J. Phys. Chem. B 1997, 101, 10221–10225. [Google Scholar] [CrossRef]
- Krishna, M.M.G. Excited-State Kinetics of the Hydrophobic Probe Nile Red in Membranes and Micelles. J. Phys. Chem. A 1999, 103, 3589–3595. [Google Scholar] [CrossRef]
- Hazra, P.; Chakrabarty, D.; Chakraborty, A.; Sarkar, N. Intramolecular charge transfer and solvation dynamics of Nile Red in the nanocavity of cyclodextrins. Chem. Phys. Lett. 2004, 388, 150–157. [Google Scholar] [CrossRef]
- Mei, Q.; Shi, Y.; Hua, Q.; Tong, B. Phosphorescent chemosensor for Hg2+ based on an iridium(iii) complex coordinated with 4-phenylquinazoline and carbazole dithiocarbamate. RSC Adv. 2015, 5, 74924–74931. [Google Scholar] [CrossRef]
- Klán, P.; Wirz, J. Photochemistry of Organic Compounds: From Concepts to Practice; John Wiley & Sons: Hoboken, NJ, USA, 2009; p. 40. [Google Scholar]
- Lu, T.; Chen, F. Multiwfn: A multifunctional wavefunction analyzer. J. Comput. Chem. 2012, 33, 580–592. [Google Scholar] [CrossRef] [PubMed]
- Liu, Z.; Lu, T.; Chen, Q. An sp-hybridized all-carboatomic ring, cyclo [18] carbon: Electronic structure, electronic spectrum, and optical nonlinearity. Carbon 2020, 165, 461–467. [Google Scholar] [CrossRef]
- Marenich, A.V.; Cramer, C.J.; Truhlar, D.G. Universal Solvation Model Based on Solute Electron Density and on a Continuum Model of the Solvent Defined by the Bulk Dielectric Constant and Atomic Surface Tensions. J. Phys. Chem. B 2009, 113, 6378–6396. [Google Scholar] [CrossRef]
- Frisch, M.J.; Trucks, G.W.; Schlegel, H.B.; Scuseria, G.E.; Robb, M.A.; Cheeseman, J.R.; Scalmani, G.; Barone, V.; Mennucci, B.; Petersson, G.A.; et al. Gaussian 09, Revision, B.01; Gaussian, Inc.: Wallingford, CT, USA, 2010. [Google Scholar]
Sample Availability: Samples of the compounds are not available from the authors. |


Publisher’s Note: MDPI stays neutral with regard to jurisdictional claims in published maps and institutional affiliations. |
© 2020 by the authors. Licensee MDPI, Basel, Switzerland. This article is an open access article distributed under the terms and conditions of the Creative Commons Attribution (CC BY) license (http://creativecommons.org/licenses/by/4.0/).