Article

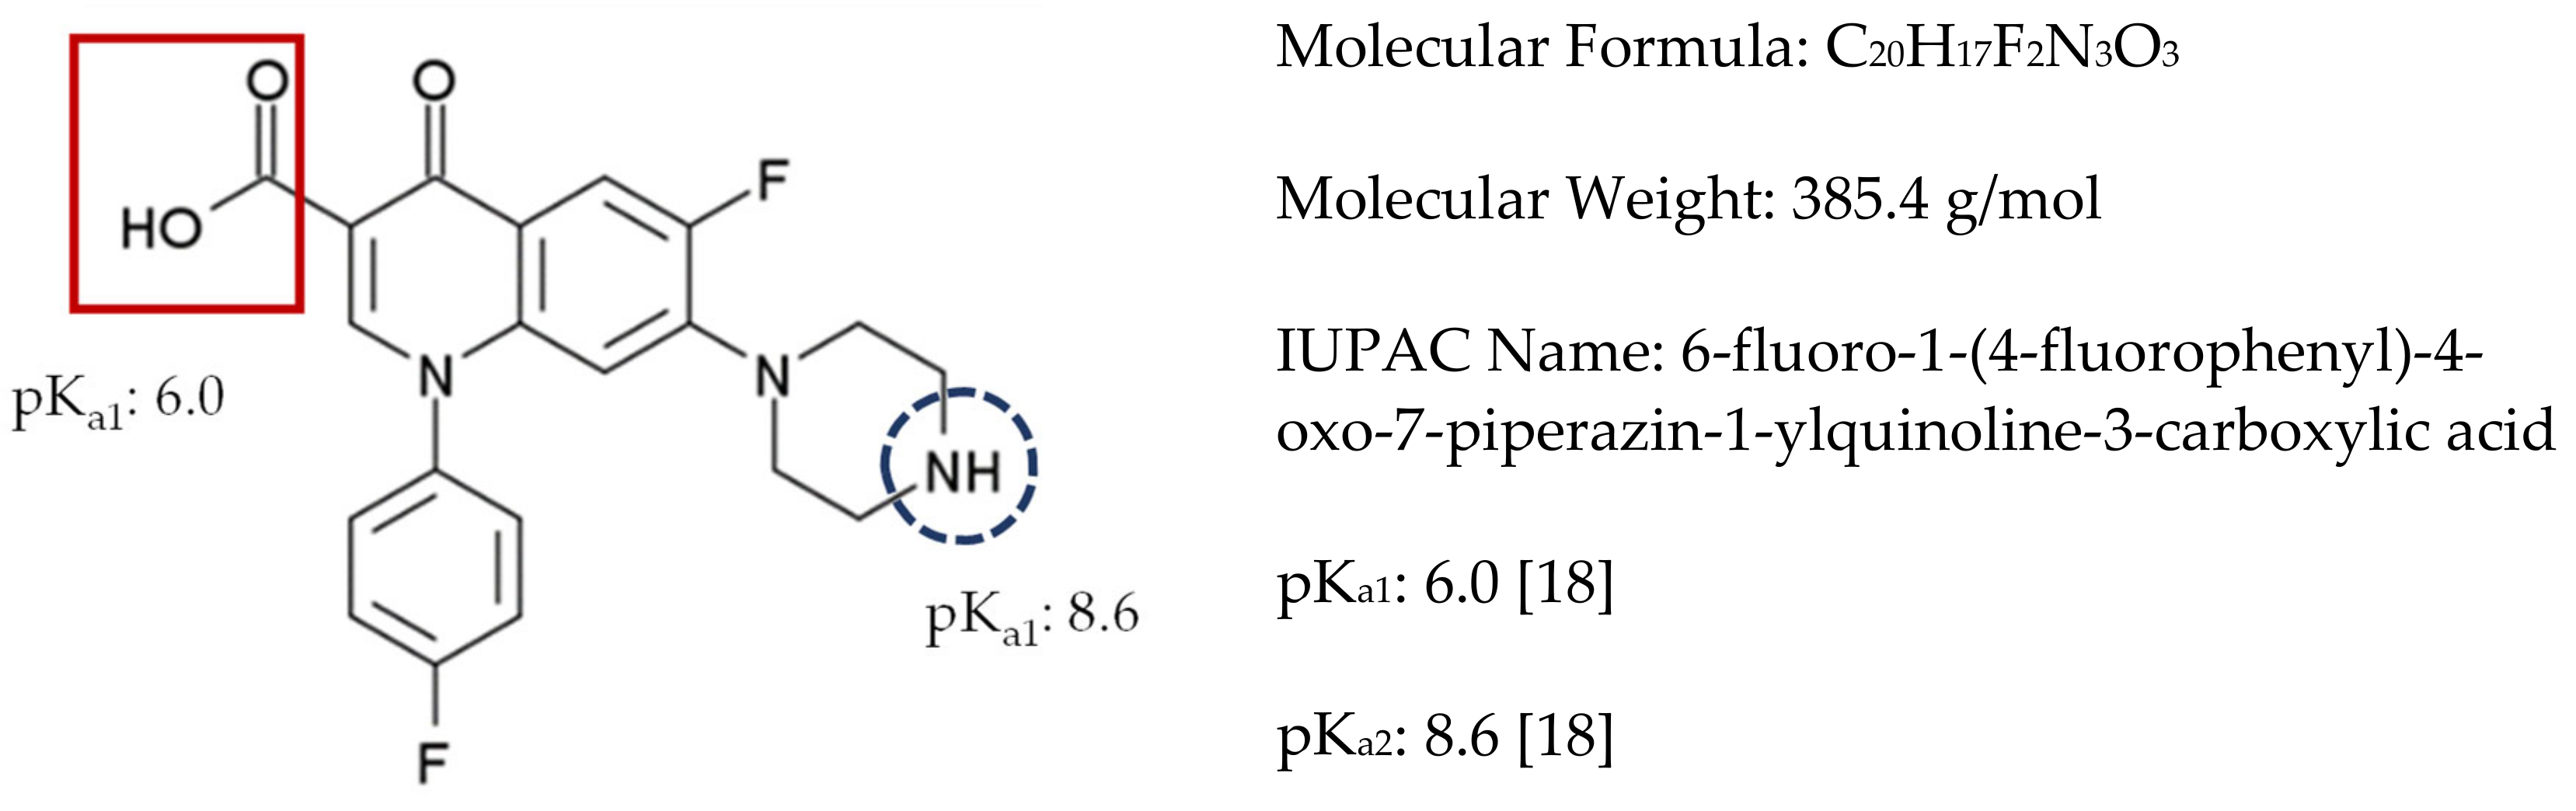
A Comparison between Different Agro-wastes and Carbon Nanotubes for Removal of Sarafloxacin from Wastewater: Kinetics and Equilibrium Studies

Department of Chemistry and Earth Sciences, College of Arts and Sciences, Qatar University, Doha 2713, Qatar
*
Author to whom correspondence should be addressed.
Molecules 2020, 25(22), 5429; https://doi.org/10.3390/molecules25225429
Submission received: 30 September 2020 / Revised: 11 November 2020 / Accepted: 17 November 2020 / Published: 19 November 2020

Abstract

:
In the current study, eco-structured and efficient removal of the veterinary fluoroquinolone antibiotic sarafloxacin (SARA) from wastewater has been explored. The adsorptive power of four agro-wastes (AWs) derived from pistachio nutshells (PNS) and Aloe vera leaves (AV) as well as the multi-walled carbon nanotubes (MWCNTs) has been assessed. Adsorbent derived from raw pistachio nutshells (RPNS) was the most efficient among the four tested AWs (%removal ‘%R’ = 82.39%), while MWCNTs showed the best adsorptive power amongst the five adsorbents (%R = 96.20%). Plackett-Burman design (PBD) was used to optimize the adsorption process. Two responses (‘%R’ and adsorption capacity ‘qe’) were optimized as a function of four variables (pH, adsorbent dose ‘AD’ (dose of RPNS and MWCNTs), adsorbate concentration [SARA] and contact time ‘CT’). The effect of pH was similar for both RPNS and MWCNTs. Morphological and textural characterization of the tested adsorbents was carried out using FT-IR spectroscopy, SEM and BET analyses. Conversion of waste-derived materials into carbonaceous material was investigated by Raman spectroscopy. Equilibrium studies showed that Freundlich isotherm is the most suitable isotherm to describe the adsorption of SARA onto RPNS. Kinetics’ investigation shows that the adsorption of SARA onto RPNS follows a pseudo-second order (PSO) model.

1. Introduction

Environmental pollution has reached worrying levels. Water pollution, specifically, is one of the most critical threats that living beings have ever faced, if not the most challenging of all. The extensive use of antibiotics within either a therapeutic or veterinary context has resulted in a crisis in the long run. Antibiotics can reach the water systems via three major routes: (1) drug production sites, (2) run-offs from the point-of-care locations and the wastewater treatment plants (WWTPs); and (3) the improper disposal of pharmaceutically active materials, including human and veterinary medication residues, as well as the personal care products [1,2]. If existing even as traces, the occurrence of antibiotics in wastewater is responsible for several ecological and health problems [3,4,5].
Fluoroquinolone antibiotics (FQs) represent an enormous category of antibiotics with a common bicyclic core (quinolone structure) and a fluorine atom. FQs are active against both Gram positive and Gram-negative bacteria [6]. Being the most detectable category of antimicrobials in water, FQs’ occurrence, fate and removal have been widely investigated [7,8,9,10,11,12]. Sarafloxacin (SARA, Figure 1) is a FQ antibiotic that acts by preventing the activity of DNA gyrase and is used for the treatment of bacterial infections caused by Escherichia coli in poultry, pigs, rabbits and dogs. SARA is also used for the treatment of cases of furunculosis, vibriosis and the enteric redmouth disease in Salmonidae [13,14,15].
Traces of SARA in the aquatic environment were attributed to animal excretions. SARA was reported to be a persistent antibacterial agent that exists mainly in the deeper layers of the sediment even after 180 days, an issue that implies a resistance to degradation [16,17]. The negative impact of existence of SARA in the aquatic systems is not only restricted to the health of humans and animals, but on the long run, it might result in the development of new strains of antibiotic-resistant microorganisms.
Therefore, finding a suitable approach for removal of SARA is crucial. Many investigations for removal of SARA from contaminated samples were reported using different approaches including mainly photocatalytic degradation, photolysis, adsorption and combinations of these approaches [17,18,19,20,21,22,23,24,25]. Being simple and easy to manipulate with the opportunity of being performed utilizing available materials with no production of toxic byproducts, adsorption is usually seen as one of the most promising approaches for wastewater treatment. Common adsorbents include conventional materials (e.g., commercially available activated carbons and alumina), natural materials (e.g., clay and sand), agro-wastes (AWs) both in their raw format and as activated carbons (ACs) following thermal treatment, hybrid materials, industrial waste products, graphene, carbon xerogels, and carbon nanotubes (CNTs) [2,20,21,22,23,24,25,26,27,28,29,30,31,32,33,34,35].
AWs are composed mainly of lignin and cellulose. These two components are rich in a variety of functional groups (e.g., hydroxyl moieties) and an elevated carbon content. Moreover, AWs possess favorable properties such as high surface area, pore size and volume, and hence are considered as ideal adsorbents for variety of contaminants. On the other hand, adsorbents such as CNTs possess remarkable physicochemical properties, such as a compact structure with a possibility for surface modification, an issue that enables their use for depollution of wastewater [2,36,37,38]. Table 1 shows a summary of the adsorption-based approaches for the removal of SARA from aqueous solutions, spiked seawater and wastewater together with the achieved %removal (%R), adsorption capacity (qe, mg/g) and the reported kinetics and isotherm models.
Nonetheless, the use of adsorption as a removal approach and the development of novel adsorbents for treating FQs’ contaminated water samples (especially when SARA is the contaminant) might not be as anticipated. Moreover, optimized removal of FQs using multivariate-based approaches is still in a need for major improvements [24,39,40]. Therefore, in the current approach, adsorptive removal of SARA from artificially contaminated water samples and utilizing the adsorptive power of two AWs (pistachio nutshells ‘PNS’ and Aloe vera leaves ‘AV’) both in their raw format and following thermal treatment at 500 °C as well as multi-walled carbon nanotubes (MWCNTs) will be the target. Offering compelling advantages in terms of saving time, resources, and minimizing waste with a superb quality of data, coupling of the environmental bioremediation to a multivariate-based statistical platform should be replacing the traditional univariate-based approaches.
As can be observed form Table 1, most of the reported approaches, if not all, were based on using mainly synthetic or commercially available materials. Moreover, most of these approaches were univariate based. Therefore, the novelty of this approach and to the best of our knowledge stems from using a factorial design for maximizing the adsorptive power of upcycled naturally occurring AWs as well as MWCNTs. Utilization of AWs as waste removers hits two targets; bioremediation of wastewater and protecting the environment from tons of wastes that would represent a burden if not properly disposed.
Plackett-Burman design (PBD) will be the factorial design of choice to evaluate and hence optimize the four variables affecting the adsorption of SARA from the tested samples. Achieving the highest %R and maximizing qe(mg/g) of the selected adsorbent(s) will be the chief targets [41,42,43]. An assessment of surface properties of the five adsorbents in terms of texture, surface area, pore size and volume, and existence of functional moieties will be performed using the respective characterization approach (Fourier transform infrared (FT-IR) and Raman spectroscopies, scanning electron microscopy (SEM) and Brunauer-Emmett-Teller (BET) analyses). Thermal properties of tested adsorbents will be explored using thermogravimetric analysis (TGA). Isotherms and kinetics of adsorption of SARA will be investigated using the appropriate models.

2. Results

2.1. Assessment of the Adsorptive Power of the Tested Adsorbents

An initial assessment of the performance of the four adsorbents (obtained from AWs) was gauged using two measures: %R and qe and employing Equations (1) and (2), respectively. Table 2 reveals the comparison conclusions under the same conditions. As per the displayed results, RPNS had the best adsorptive power among the tested AWs as indicated by the values of %R and qe. Consequently, RPNS will be further utilized in the supervening investigations and its performance will be further optimized using PBD. Similarly, the performance of MWCNTs as adsorbent will be optimized using the same design:
% R =   C 0 C e C 0   ×   100 % ,
        q e =   C 0 C e W   V ,
where C 0 (mg L−1) denotes the initial concentration of [SARA] solution, C e is the concentration of the [SARA] solution at equilibrium, V stands to the volume of the solution (L), and W is the weight of the adsorbent used (g).

2.2. Factorial Design

PBD was chosen to optimize the measured responses (%R and qe) as a function of the four variables. In addition to the advantages of being a multivariate approach, PBD offers other pros such as detecting the statistically significant variables from a relatively large number of factors affecting a process (2–47 variables). Moreover, and in addition to being an efficient approach when only main variables are concerned, PBD is one of the most commonly used approaches for testing method robustness [28,29,41,42,43]. The proposed experimental setup is shown in Table 3 in terms of coded/un-coded variables together with the variable levels (higher, lower and mid-levels). The detailed experimental scenario is shown in Table 4 together with measured values of both responses and the predicted values as calculated by Minitab®19.

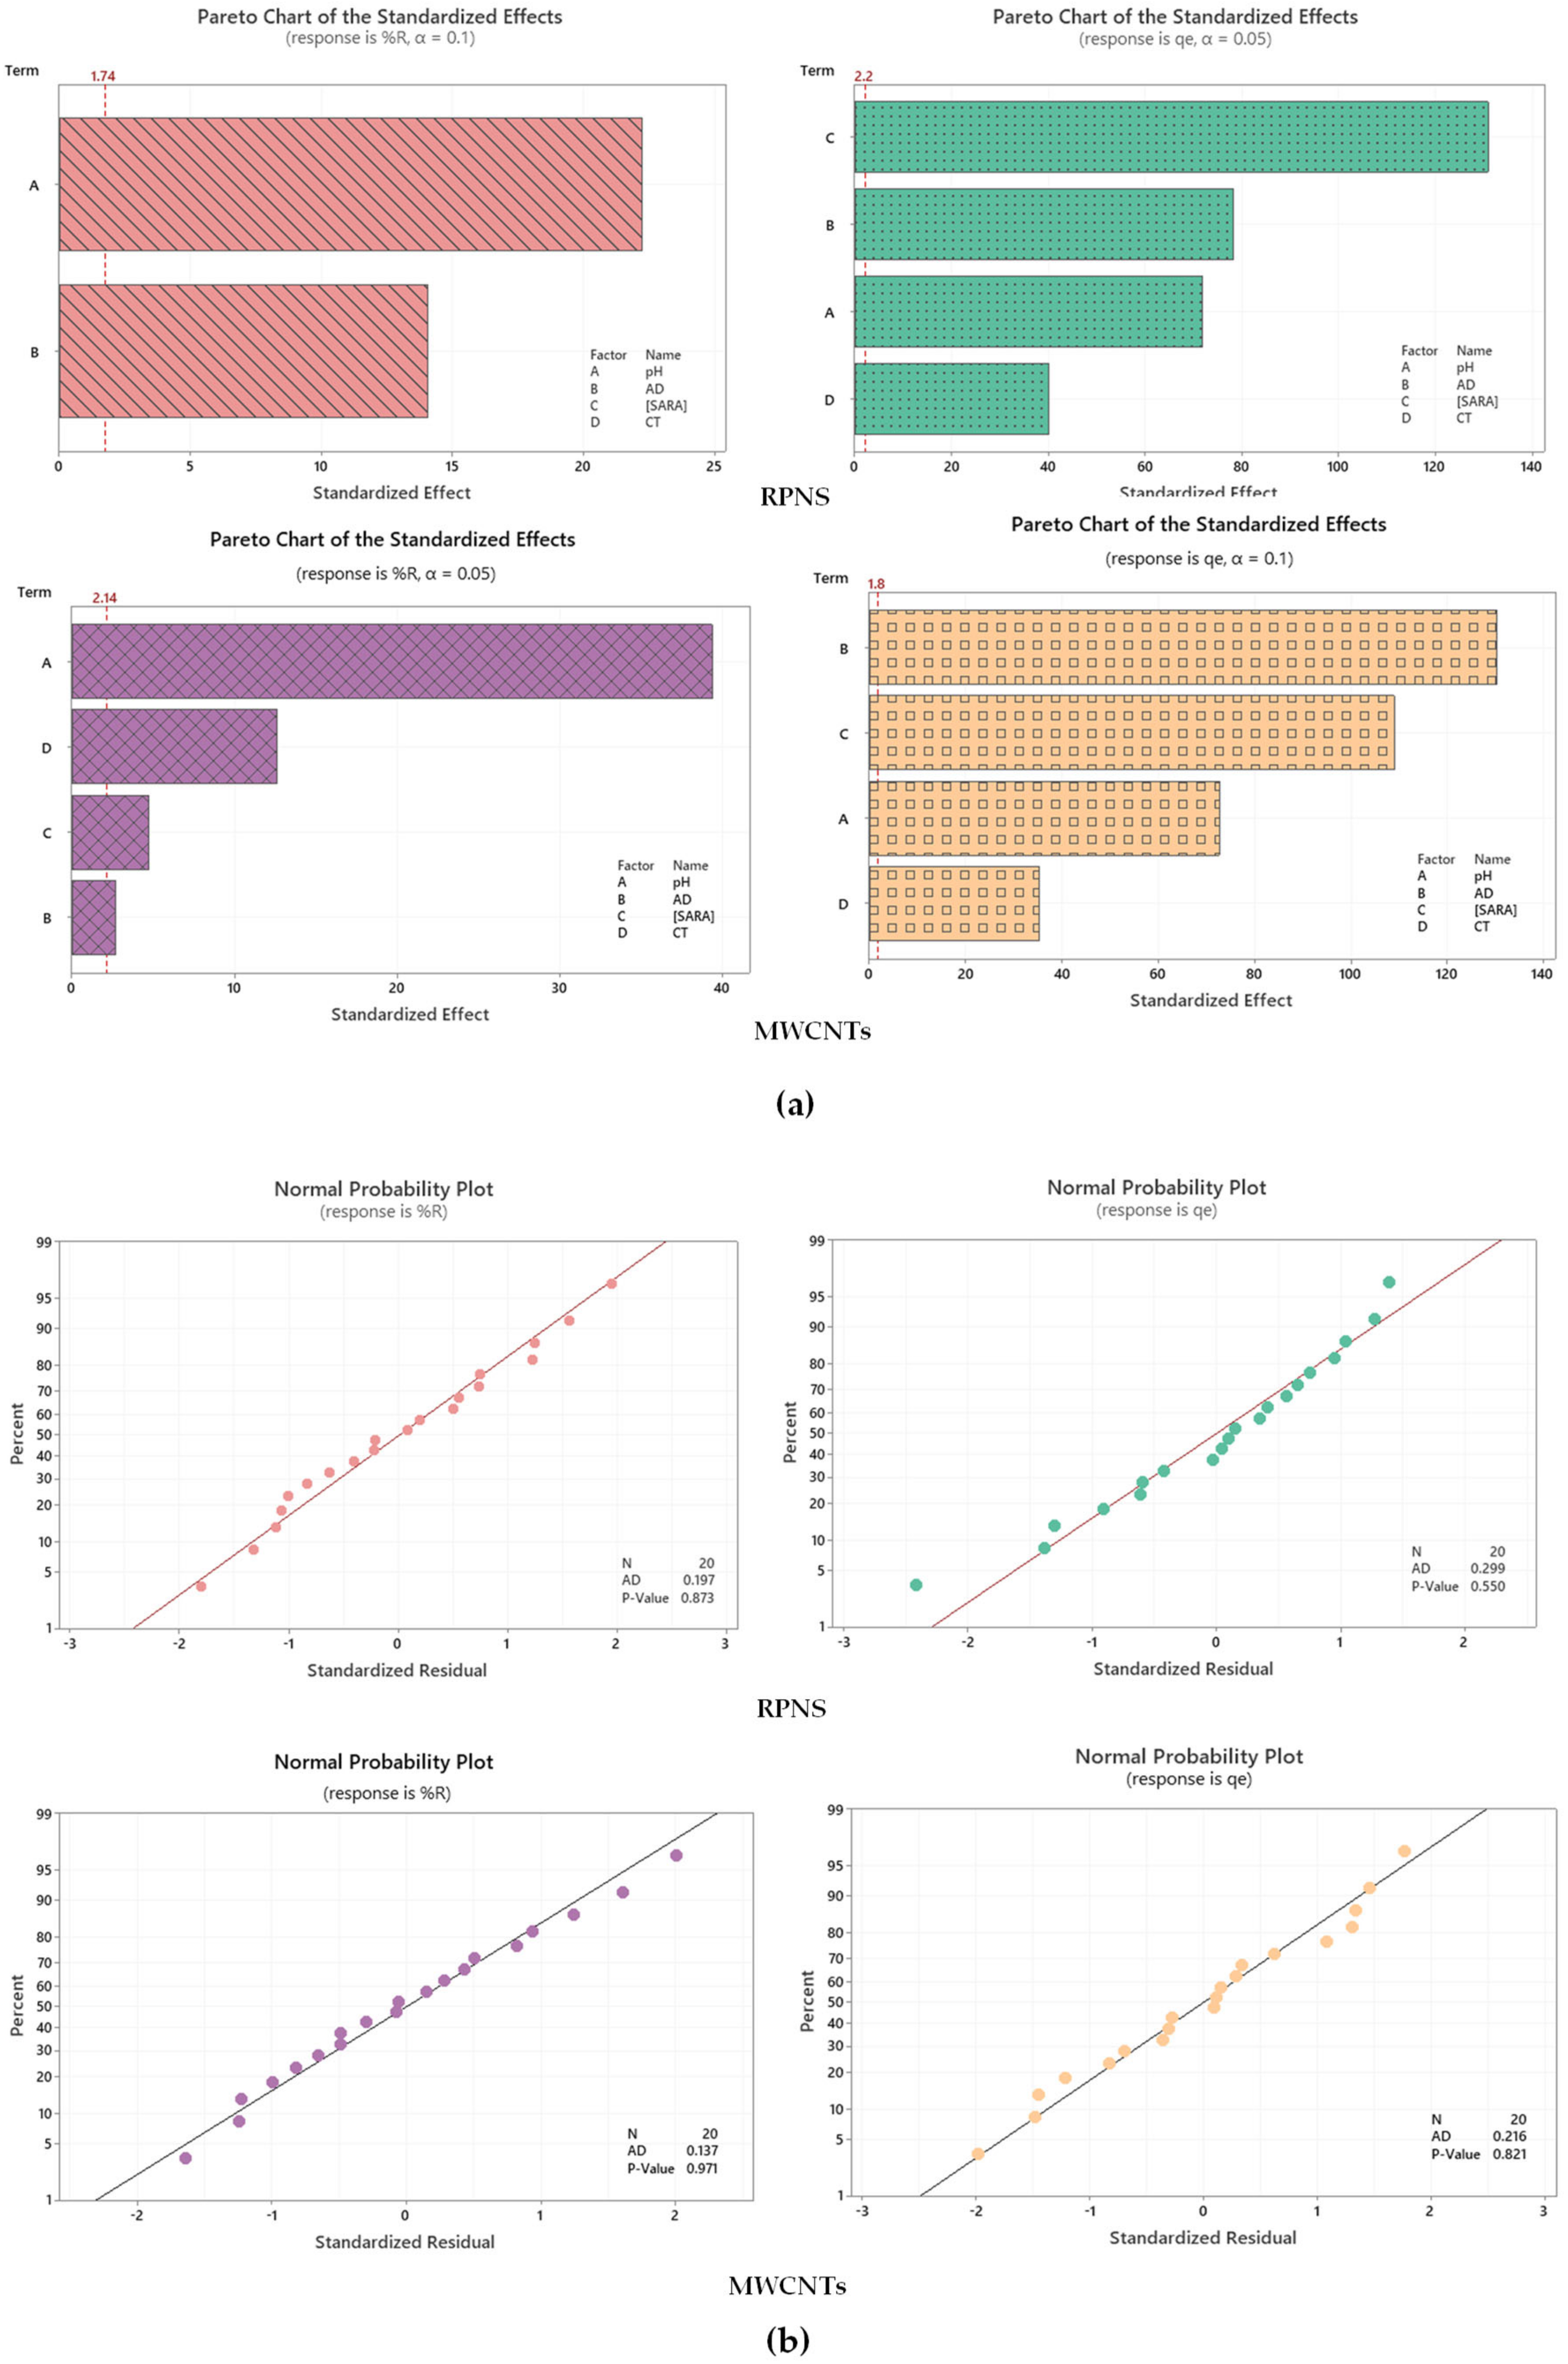
2.3. Assessment of Statistically Significant Independent Variables

Statistical significance of the tested variables (shown in Table 3 and Table 4) was assessed using a combination of quality charts (mainly Pareto chart of standardized effects to denote the magnitude of each variable, Figure 2) in conjunction with the analysis of variance (ANOVA), Table 5. As revealed in Figure 2a—upper left panel where RPNS is the tested adsorbent and the %R is the measured response, pH(A) was the most statistically significant variable, followed by the dose of RPNS(B). Other charts such as normal plot of standardized effects was used to decide upon both the magnitude and the direction of the studied factors—Figures are not shown. Results from these graphs show that the pH has a negative influence on the %R in case of RPNS. In case of adsorption capacity (qe) being the measured response—Figure 2a—upper right panel, all the four variables were statistically significant with [SARA] being the most influencing variable followed by the effect of the dose of RPNS. The situation is a bit different using MWCNTs as an adsorbent, where %R is mainly affected by pH(A) and CT (D) and qe is mainly influenced by AD (B) and [SARA].
Normal probability plots as an example for residual plots are shown in the lower panel (Figure 2b) for both adsorbents. As shown, the p-value was >0.05 and the Anderson-Darling statistic (A–D) was relatively low, implying that obtained data follow a normal distribution [44].
Findings of the ANOVA testing at 95.0 confidence interval (95.0 CI) further confirm the previous conclusions for the statistical significance of the assessed variables. As shown in Table 5, the magnitude of the F-value increases with the increase in the magnitude of the variable’s impact. The significance level (p-value) is <0.05 for statistically significant variables. In this itinerary, the lack-of-fit was statistically insignificant with a p-value >0.05 insinuating the good fit. It is essential to state that regression of measured responses was done versus central points (Ct Pt), together with assessed variables using Box-Cox response transformation [45]. Stepwise analysis implementing backward elimination of terms (α to remove = 0.1) was used in case of %R. The regression outcome is shown in Equations (3)–(6):
√%R(RPNS) = 9.852 − 0.5996 pH + 0.02525 AD,
qe^0.45868(RPNS) = 1.9552 − 0.11712 pH − 0.008492 AD + 0.028427 [SARA] + 0.002375 CT − 0.11314 Ct Pt,
%R^1.5(MWCNTs)= 1450.5 − 134.11 pH + 0.607 AD − 2.154 [SARA] + 1.564 CT + 2.1 Ct Pt,
ln(qe)(MWCNTs) = 2.4965 − 0.19256 pH − 0.023006 AD + 0.038492 [SARA] + 0.003400 CT + 0.09626 Ct Pt,
Regression equations (Equations (3)–(6)) confirm the previously mentioned effects of the tested variables in terms of magnitude and direction. For example, the impact of pH on both responses, %R and qe (for each adsorbent) was similar, in contrast to AD which had a positive effect on %R compared to a negative effect in case of qe.
Summaries of both models exhibited in Equations (3)–(6) show that the coefficient of determination (R2) value was comparatively high (R2 = 97.60% and 99.96% in case of RPNS and 99.20% and 99.96% in case of MWCNTs) and akin to the value of R2–adjusted (R2 adj) = 97.32% and 99.94% in case of RPNS and 98.92% and 99.95% in case of MWCNTs), signifying the linearity of the regression models. The capability of models to predict the new observations was signified by the high values of R2–predicted (R2 pred = 96.41%, 99.92% in case of RPNS and 98.53%, 99.90% in case of MWCNTs). This conclusion could be further corroborated by the low values of relative error (RE) exhibited in Table 4.

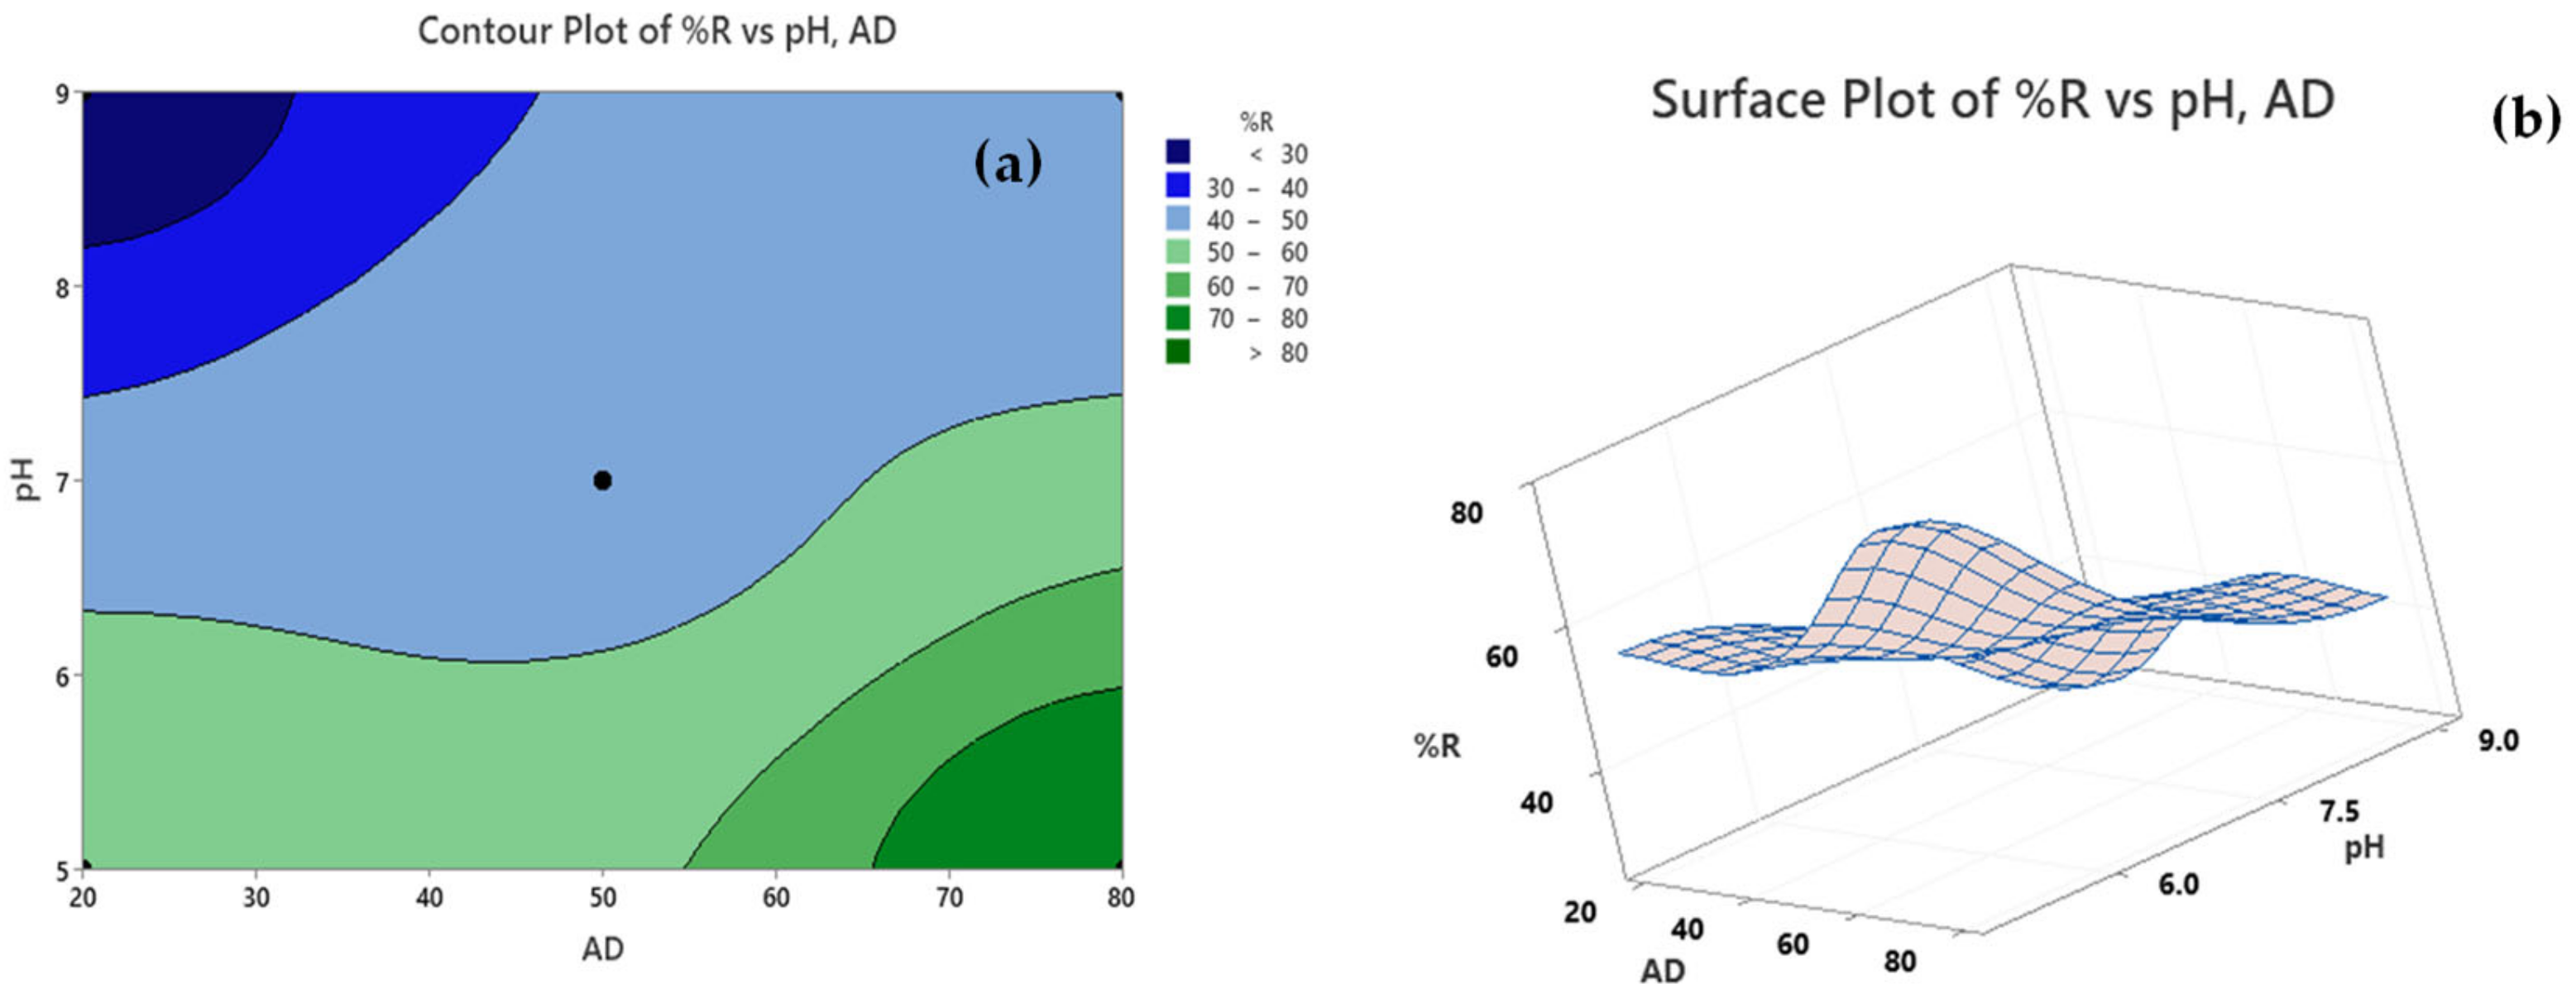
2.4. Contour and Surface Plots

An investigation of how the fitted response values correlate to two continuous variables based on the regression equations is symbolized by the contour plot (Figure 3a). Shown plot signifies a 2D—view in which all the points having the same response are associated to produce a contour line and reflect the impact of pH and AD on %R. As per the attached legend, the dark green region denotes a zone where maximum %R can be achieved using an AD of 65–80 mg/50 mL and at pH of 5.0–<6.0. Another approach to establish the relation between the response values and the operating conditions is the 3D—representation of response via surface plots. Compared to the contour plots, surface plots provide a better understanding for the response surface. Figure 3b shows that maximum %R (elevated ridge) can be achieved employing an AD of ~65–80 mg/50 mL and pH value of 5.5–6.0.

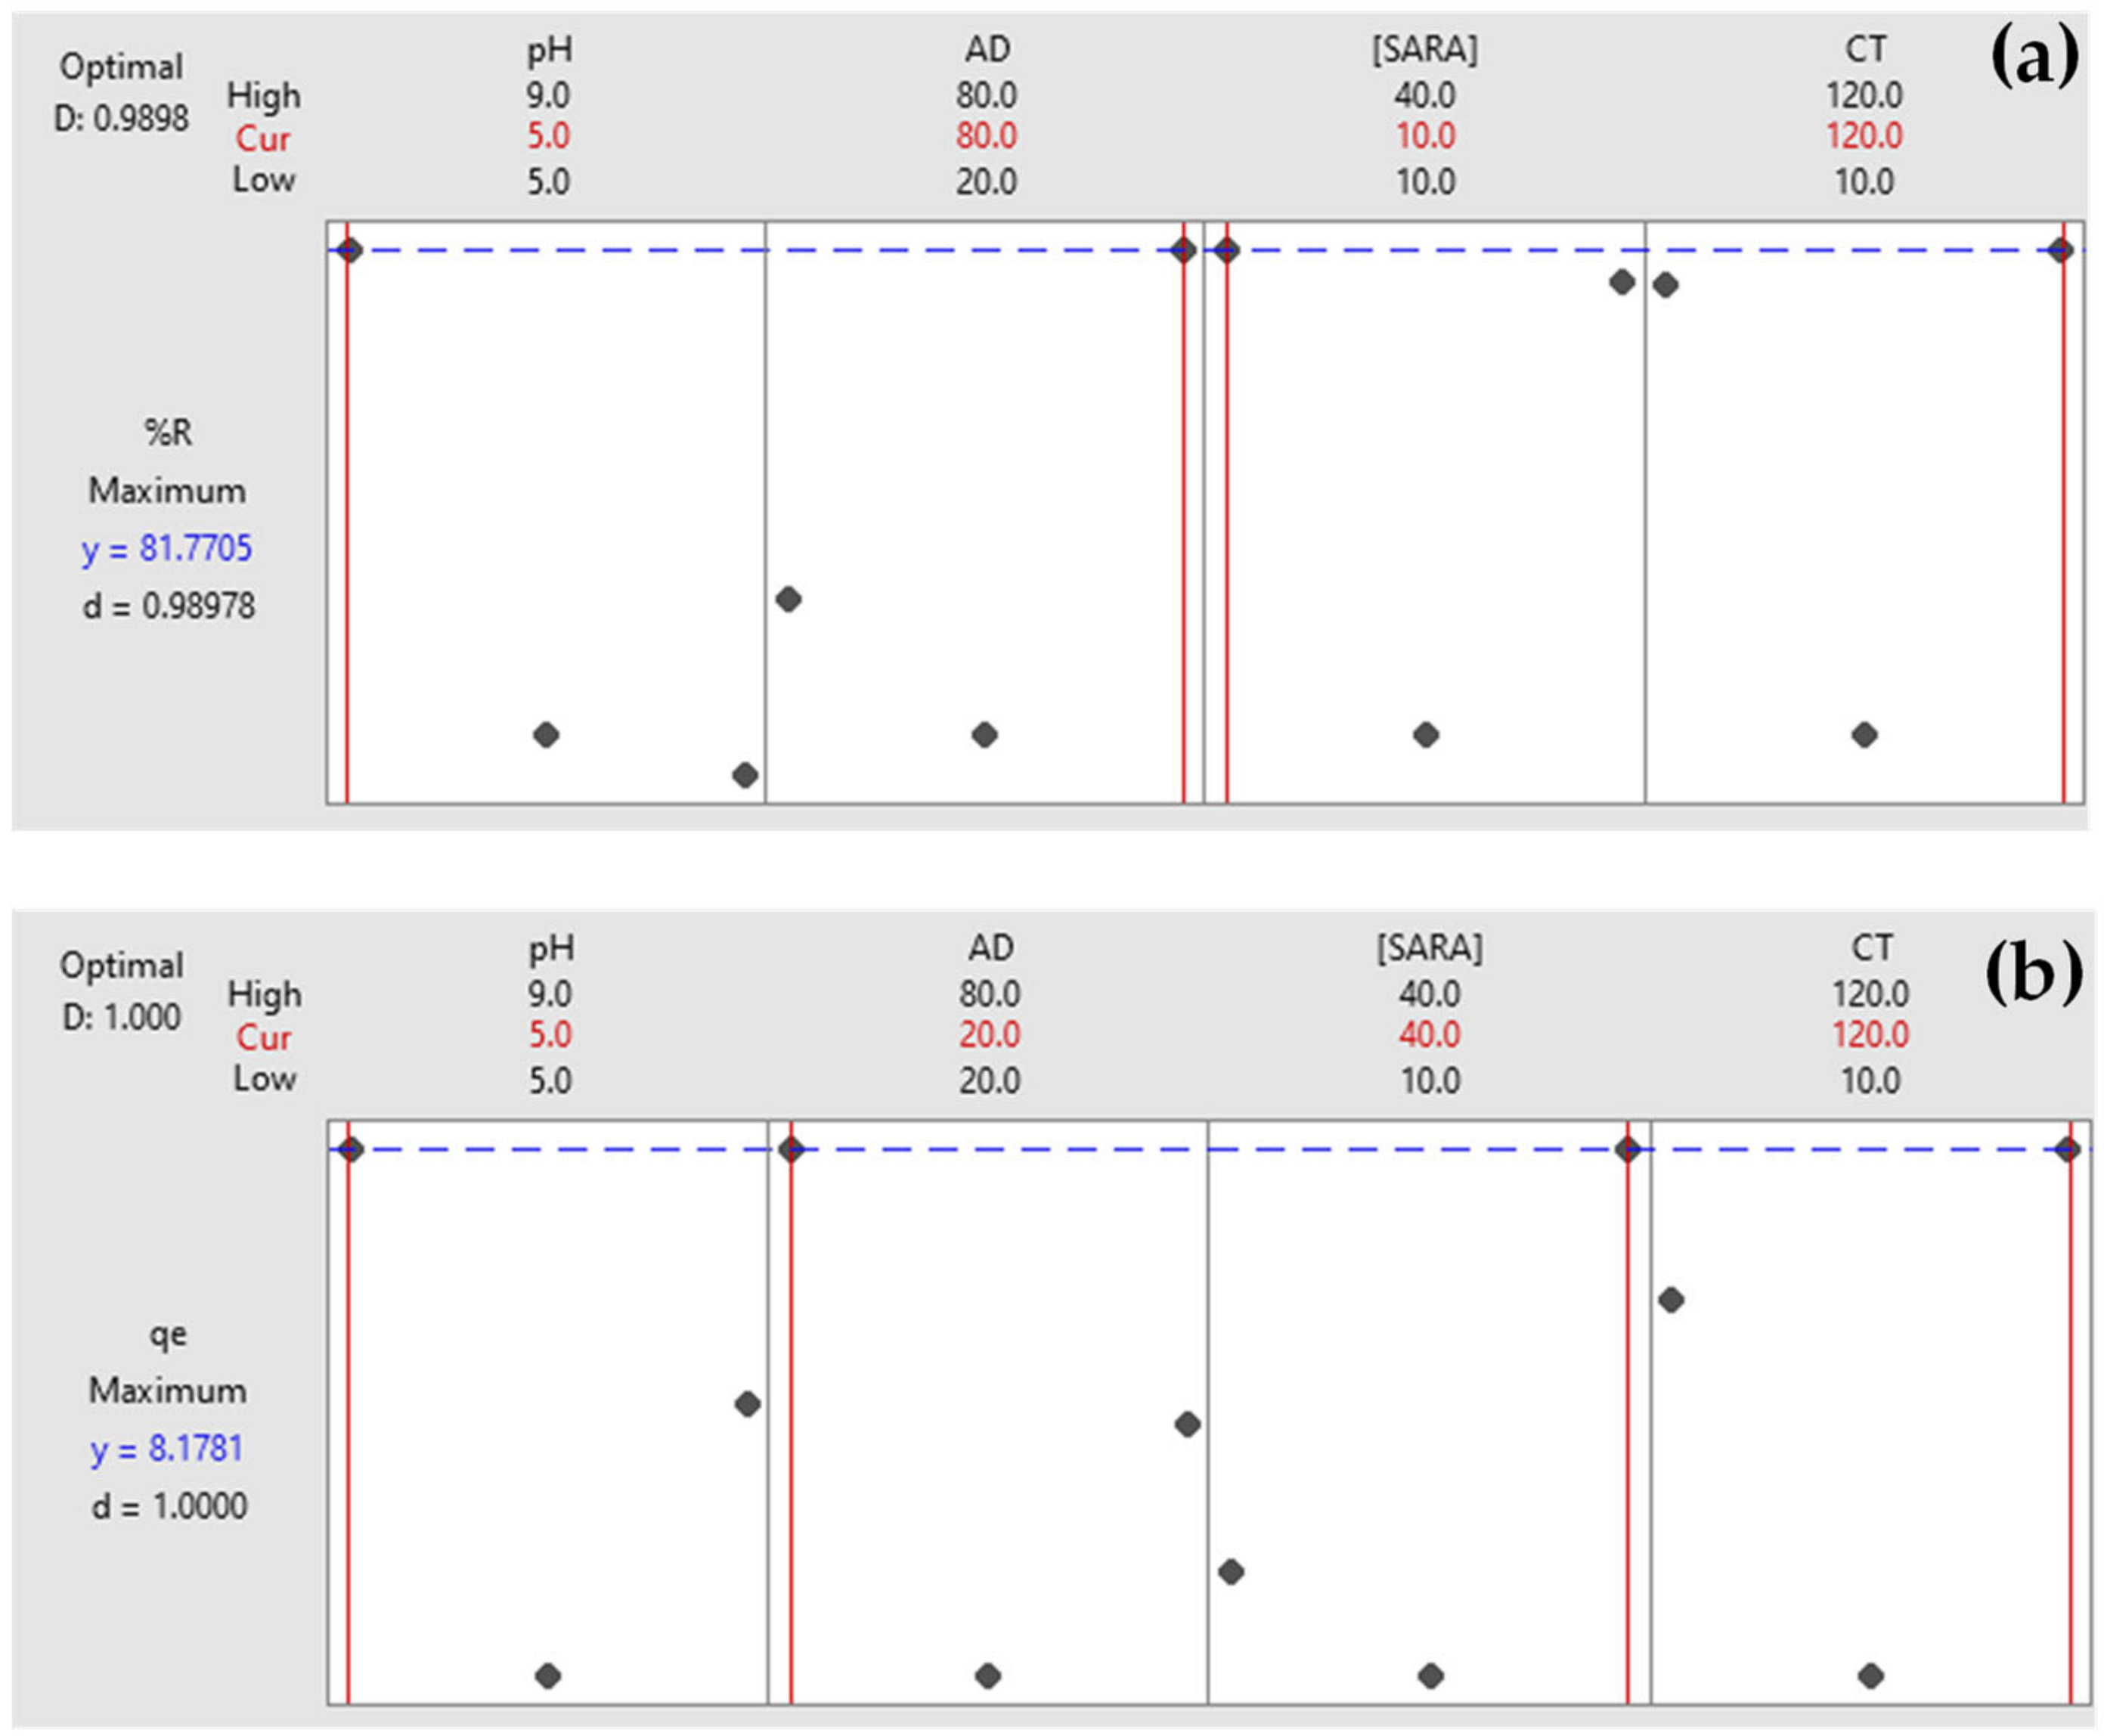
2.5. Response Optimization

Figure 4 shows optimization plots for both responses using RPNS as an adsorbent. The target was set to maximize each response. Variable limits that achieve the maximum of each response are shown as ‘Cur’. For example, to achieve a %R of 81.77% for a [SARA] = 10 ppm using RPNS, a blend of pH 5.0, AD = 80 mg/50 mL and CT = 120 min. would produce a high desirability value (d) = 0.9898, implying the favorability of the selected variable levels [46]. To achieve a %R of 99.64% using MWCNTs, the same blend of variables achieved a desirability of 1.0000. Similarly, to achieve qe = 8.17 and 20.52 mg/g using RPNS and MWCNTs, respectively, variable limits should be kept at pH 5.0, AD = 20 mg/50 mL and CT = 120 min. for [SARA] = 40 ppm.

2.6. Characterization of Tested Adsorbents

2.6.1. Thermal Characteristics

Thermal stability of raw AWs and MWCNTs was investigated using thermogravimetric analysis (TGA, Figure 5). TGA analysis shows that MWCNTs are thermally stable and no weight loss could be observed along the temperature range of 100 and up to 700 °C. Weight loss was only observed after 700 °C [47]. This finding implies that the adsorption of SARA onto MWCNTs might occur via physisorption. In case of RPNS, the overall weight loss could be attributed to the loss of mainly oxygen and carbon in RPNS. Multistep decomposition occurs as follows: (1) vaporization of free water (5.349%) at a range of 25–150 °C, (2) loss of crystalline water at ~200 °C, and (3) loss of the organic matter (carbon-based functional groups) at the range of 200–400 °C. In case of ADAV, similar behavior could be observed where water loss was observed at the same range up to 150 °C followed by loss of organic matter up to 600 °C and finally carbonization of the polymeric material up to 800 °C. Findings of TGA, therefore, implies the absence of thermally labile functionalities following carbonization, an issue that explains the diminished adsorptive power of thermally treated AWs compared to the raw biomasses and the possible involvement of chemisorption in case of the former biosorbents [27,28,48,49]. The adsorption mechanism will be further investigated in the next sections.

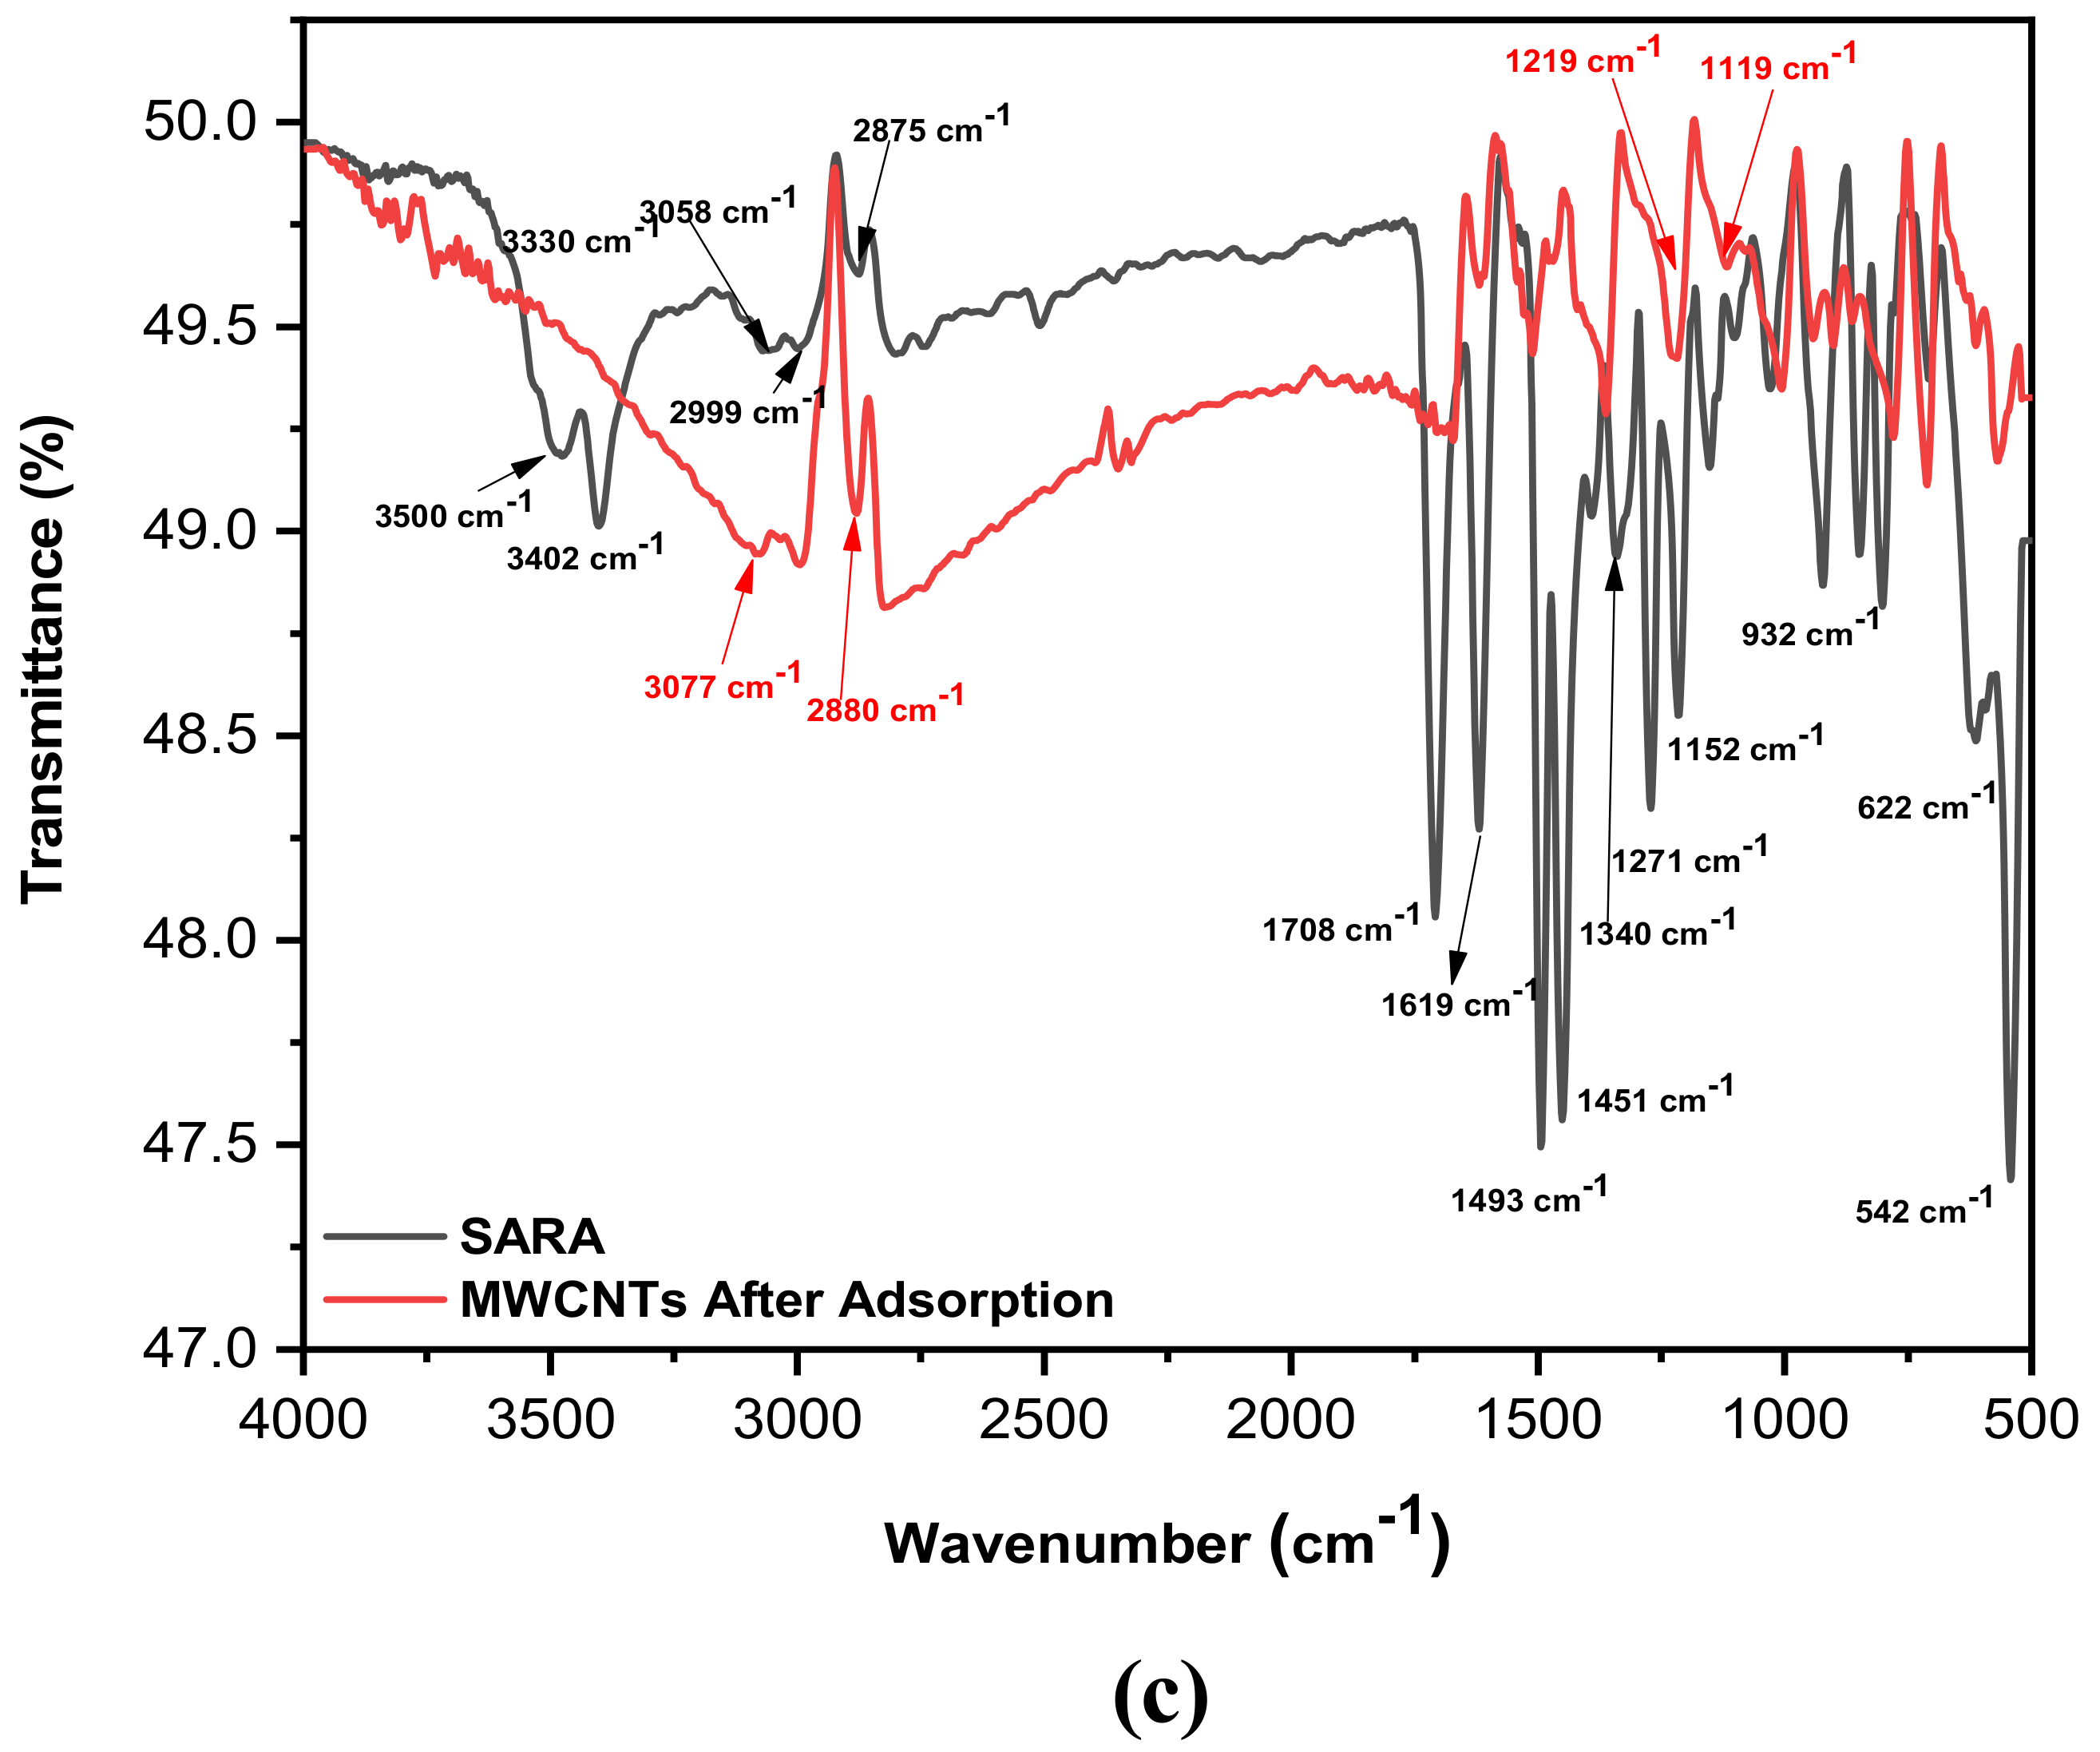
2.6.2. Functional Groups and Adsorption Mechanism

The functional groups on the surface of both types of adsorbents (AWs and MWCNTs) were determined using FT-IR. Figure 6a (upper panel) shows a screening of the functional moieties in the five adsorbents before the adsorption of SARA. As previously reported, agricultural biomasses are of a lignocellulosic nature (composed mainly of lignin, cellulose and hemicellulose). With a high content of functional groups (especially hydroxyl either aliphatic or aromatic, carbonyl, carboxyl, and amino functionalities) and an elevated carbon content, lignocellulosic biomasses are considered as ideal adsorbents [50].
Raw (non-thermally treated) biomasses (RPNS and ADAV) show almost identical spectra with different intensities [27,28]. The peak at 3330 cm−1 is evidently attributed to the -OH stretching vibrations and signifies the existence of polysaccharides. Existence of chemisorbed water (especially in ADAV) on both cellulose and lignin can also explain the broad peak at 3330 cm−1. Both adsorbents showed symmetric and asymmetric C-H stretching vibrations of the lignocellulosic content at 2846 and 2917 cm−1 implying the presence of either CH2 or CH3 groups or both moieties. The peak at 1740 cm−1 could be assigned to the carbonyl moiety from esters or lactones. A peak at 1620 cm−1 can be assigned to the -OH bending vibration of absorbed water. The peak at 1024 cm−1 represents the C-O stretching vibration in lignin, cellulose and hemicellulose [51].
Thermally treated biomasses (TTPNS500 and TTAV500) show a complete disappearance of some peaks and shifting in the positions of others compared to the raw adsorbents. Peak at 1458 cm−1 can be attributed to the CH2 deformation stretching in lignin and the carbohydrate complex. The sharp peak at 874 cm−1 could be assigned to the C–H (out of plane) glucose ring moiety in cellulose and hemicellulose and for the guaiacyl rings in lignin [52,53,54]. MWCNTs, on the other hand, show almost no functionalities. This difference in existence of functional groups was further motivating to study the adsorption mechanism.
On the other hand, SARA ‘the adsorbate’, shows peaks at ~3500 and 3058 cm−1 which could be attributed to O-H stretching vibration, intermolecular H-bonded. A prominent peak at 3402 cm−1 could be assigned to the N–H stretching vibration of the imino- or the piperazinyl moieties. Peaks at 2999, 2875 cm−1 could be assigned to aromatic, cyclic enes (υ = CH and Ar-H). The peak at 1708 cm−1 can be assigned to the C=O stretching vibration of the carboxylic acid. Peak at 1619 cm−1 could be due to N–H bending vibration of the quinolines moiety. The peaks at 1493 and 1451 cm−1 might be assigned to the stretching vibration of the O-C-O group. The C-F stretching vibration can be seen at 1000–1152 cm−1 [55,56].
Adsorption of SARA onto the surface of RPNS and MWCNTs was investigated after adsorption and was indicated by the appearance of new functionalities on the tested adsorbent’s surface or shifting of the existing functional groups due to chemical bonding or physisorption on the surface, Figure 6b,c. This change was more prominent in case of MWCNTs, where the pristine adsorbent and as indicated had almost no peaks. Figure 6c shows that all peaks of SARA stay the same but with less intensity following the adsorption of SARA onto the surface of MWCNTs.
In case of RPNS, the spectrum of SARA at the fingerprint region 500–1500 cm−1 stays the same with less intense peaks following the adsorption onto RPNS. A new weak peak at 3070 cm−1 appears after adsorption with almost complete disappearance of the peaks attributed to the O-H stretching vibrations from both SARA and pristine RPNS. Another peak which was attributed to the C=O stretching vibration of the carboxylic acid in SARA and the carbonyl moiety from esters or lactones has shifted to 1743 cm−1 implying the involvement of this moiety in the binding process.
As previously reported [18], SARA is of an ampholytic nature with a pKa value of 6.0 for the carboxylic moiety and 8.6 for nitrogen atom in the piperazinyl ring (Figure 1). Therefore, and as seen in Table 3 and Table 4, the impact of pH on the removal power (%R) of RPNS was studied at three levels: 5.0, 7.0 and 9.0 ± 0.2. At a pH value <6.0, SARA exists mainly in the cationic form with a small amount of zwitterionic form. On the other hand, when pH is in the range of 6.0 < pH < 8.6, the three forms of SARA happen together with the zwitterionic form being the major component, and the amount of cationic form subsides with the rise of pH, whereas the amount of anions increases with the increase of pH. When the pH > 8.6, SARA exists mainly in the anionic form, together with a small amount of zwitterionic form. On the other hand, RPNS shows a point-of-zero-charge (PZC) of 5.0 (Figure 7) [57,58,59]. So, at low pH values (<5.0), the adsorbent surface will be positively charged. Therefore, the best adsorption should be attained between pH 5.0–6.0.

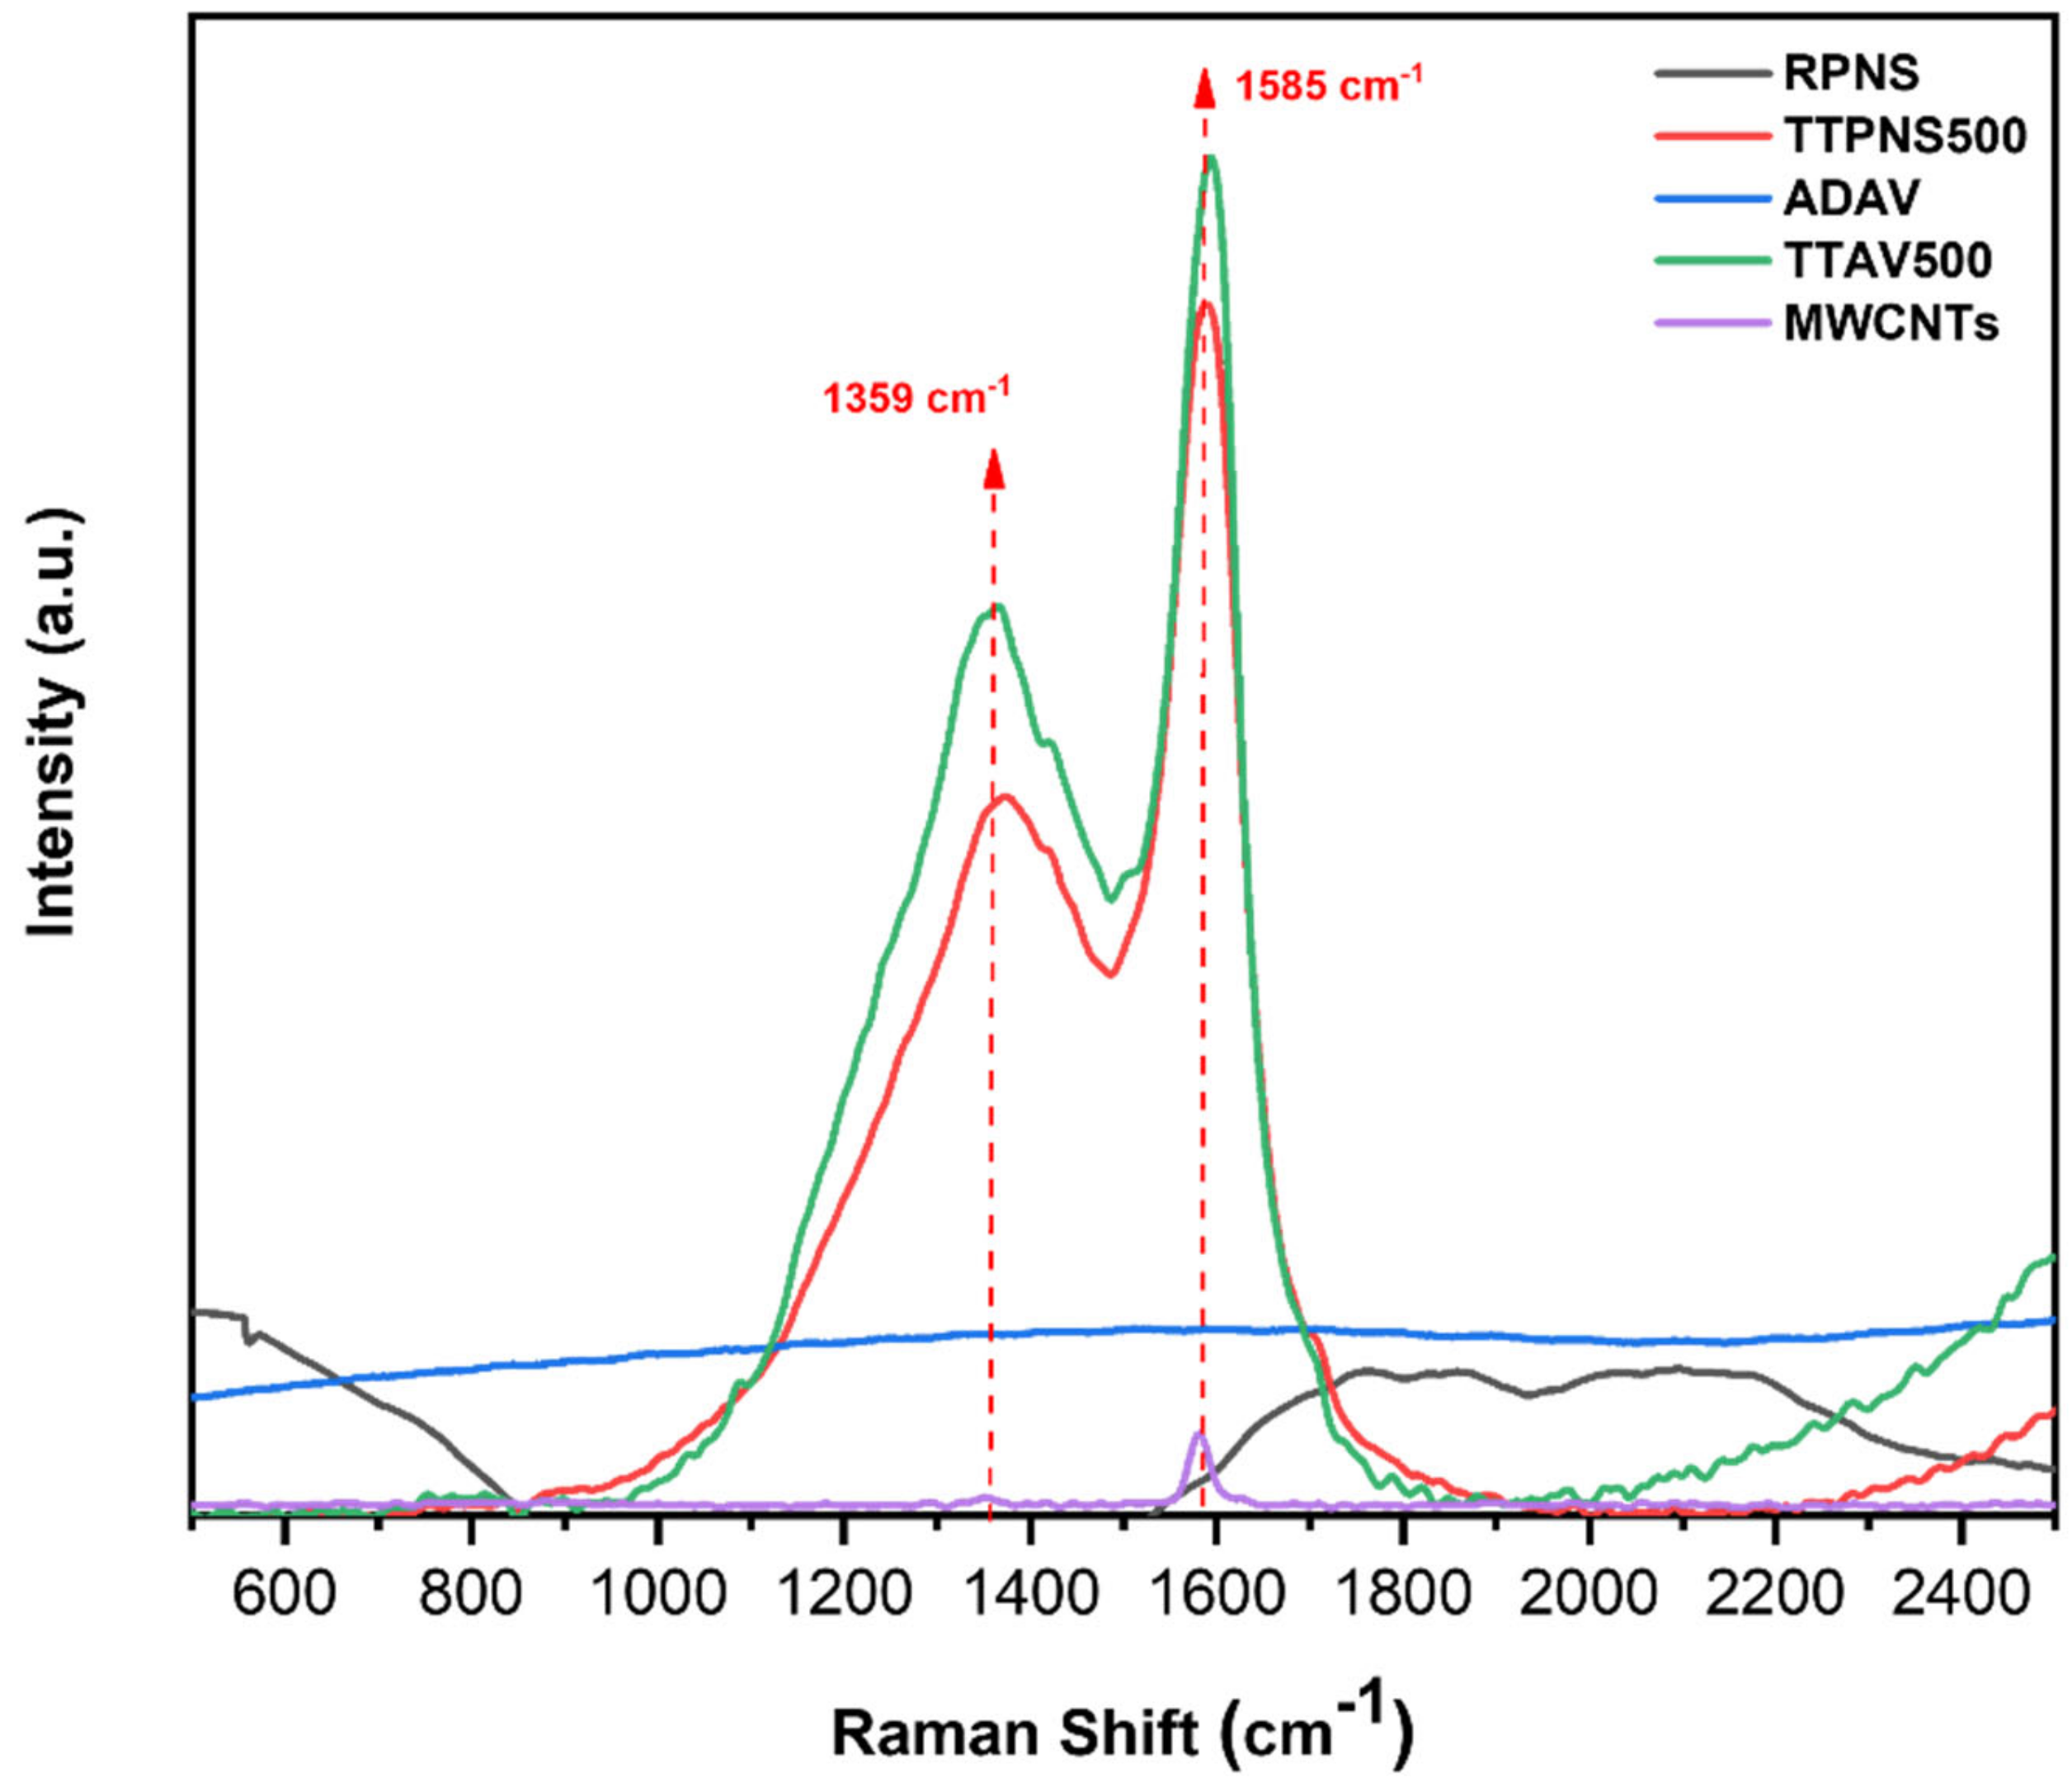
2.6.3. Raman Analysis

Raman spectra of raw, thermally treated biomasses at 500 °C, and MWCNTs are presented in Figure 8. As can be seen from the revealed spectra, only the thermally treated samples and the MWCNTs show two types of bands: a band at 1351 cm−1 (D-band) and a band at 1585 cm−1 (G-band). On the other hand, the spectra of raw AWs do not show such bands (except for RPNS where the existence of such peaks might be attributed to exposure of nutshells to some sort of thermal treatment before being sold though being labelled non-roasted). The appearance of these two bands in general could be attributed to the carbonaceous nature of the thermally treated AWs and the MWCNTs. While the D-band reflects the characteristics of the carbon lattice including defects and sizes, the G-band detects the stretching of C-C for the sp2 system. Nevertheless, the D-band does not signify the chemical structure of the carbon material. Table 6 shows the intensity ratio of ID:IG for all five sorbents. As can be seen, the ratio was highest in case of TTAV500 followed by RPNS500 and then the RPNS. This finding implies the conversion of the AWs into carbonaceous material and that the thermal treatment process might have increased the defect states in carbon, a case which is not found in MWCNTs inferring less defects.

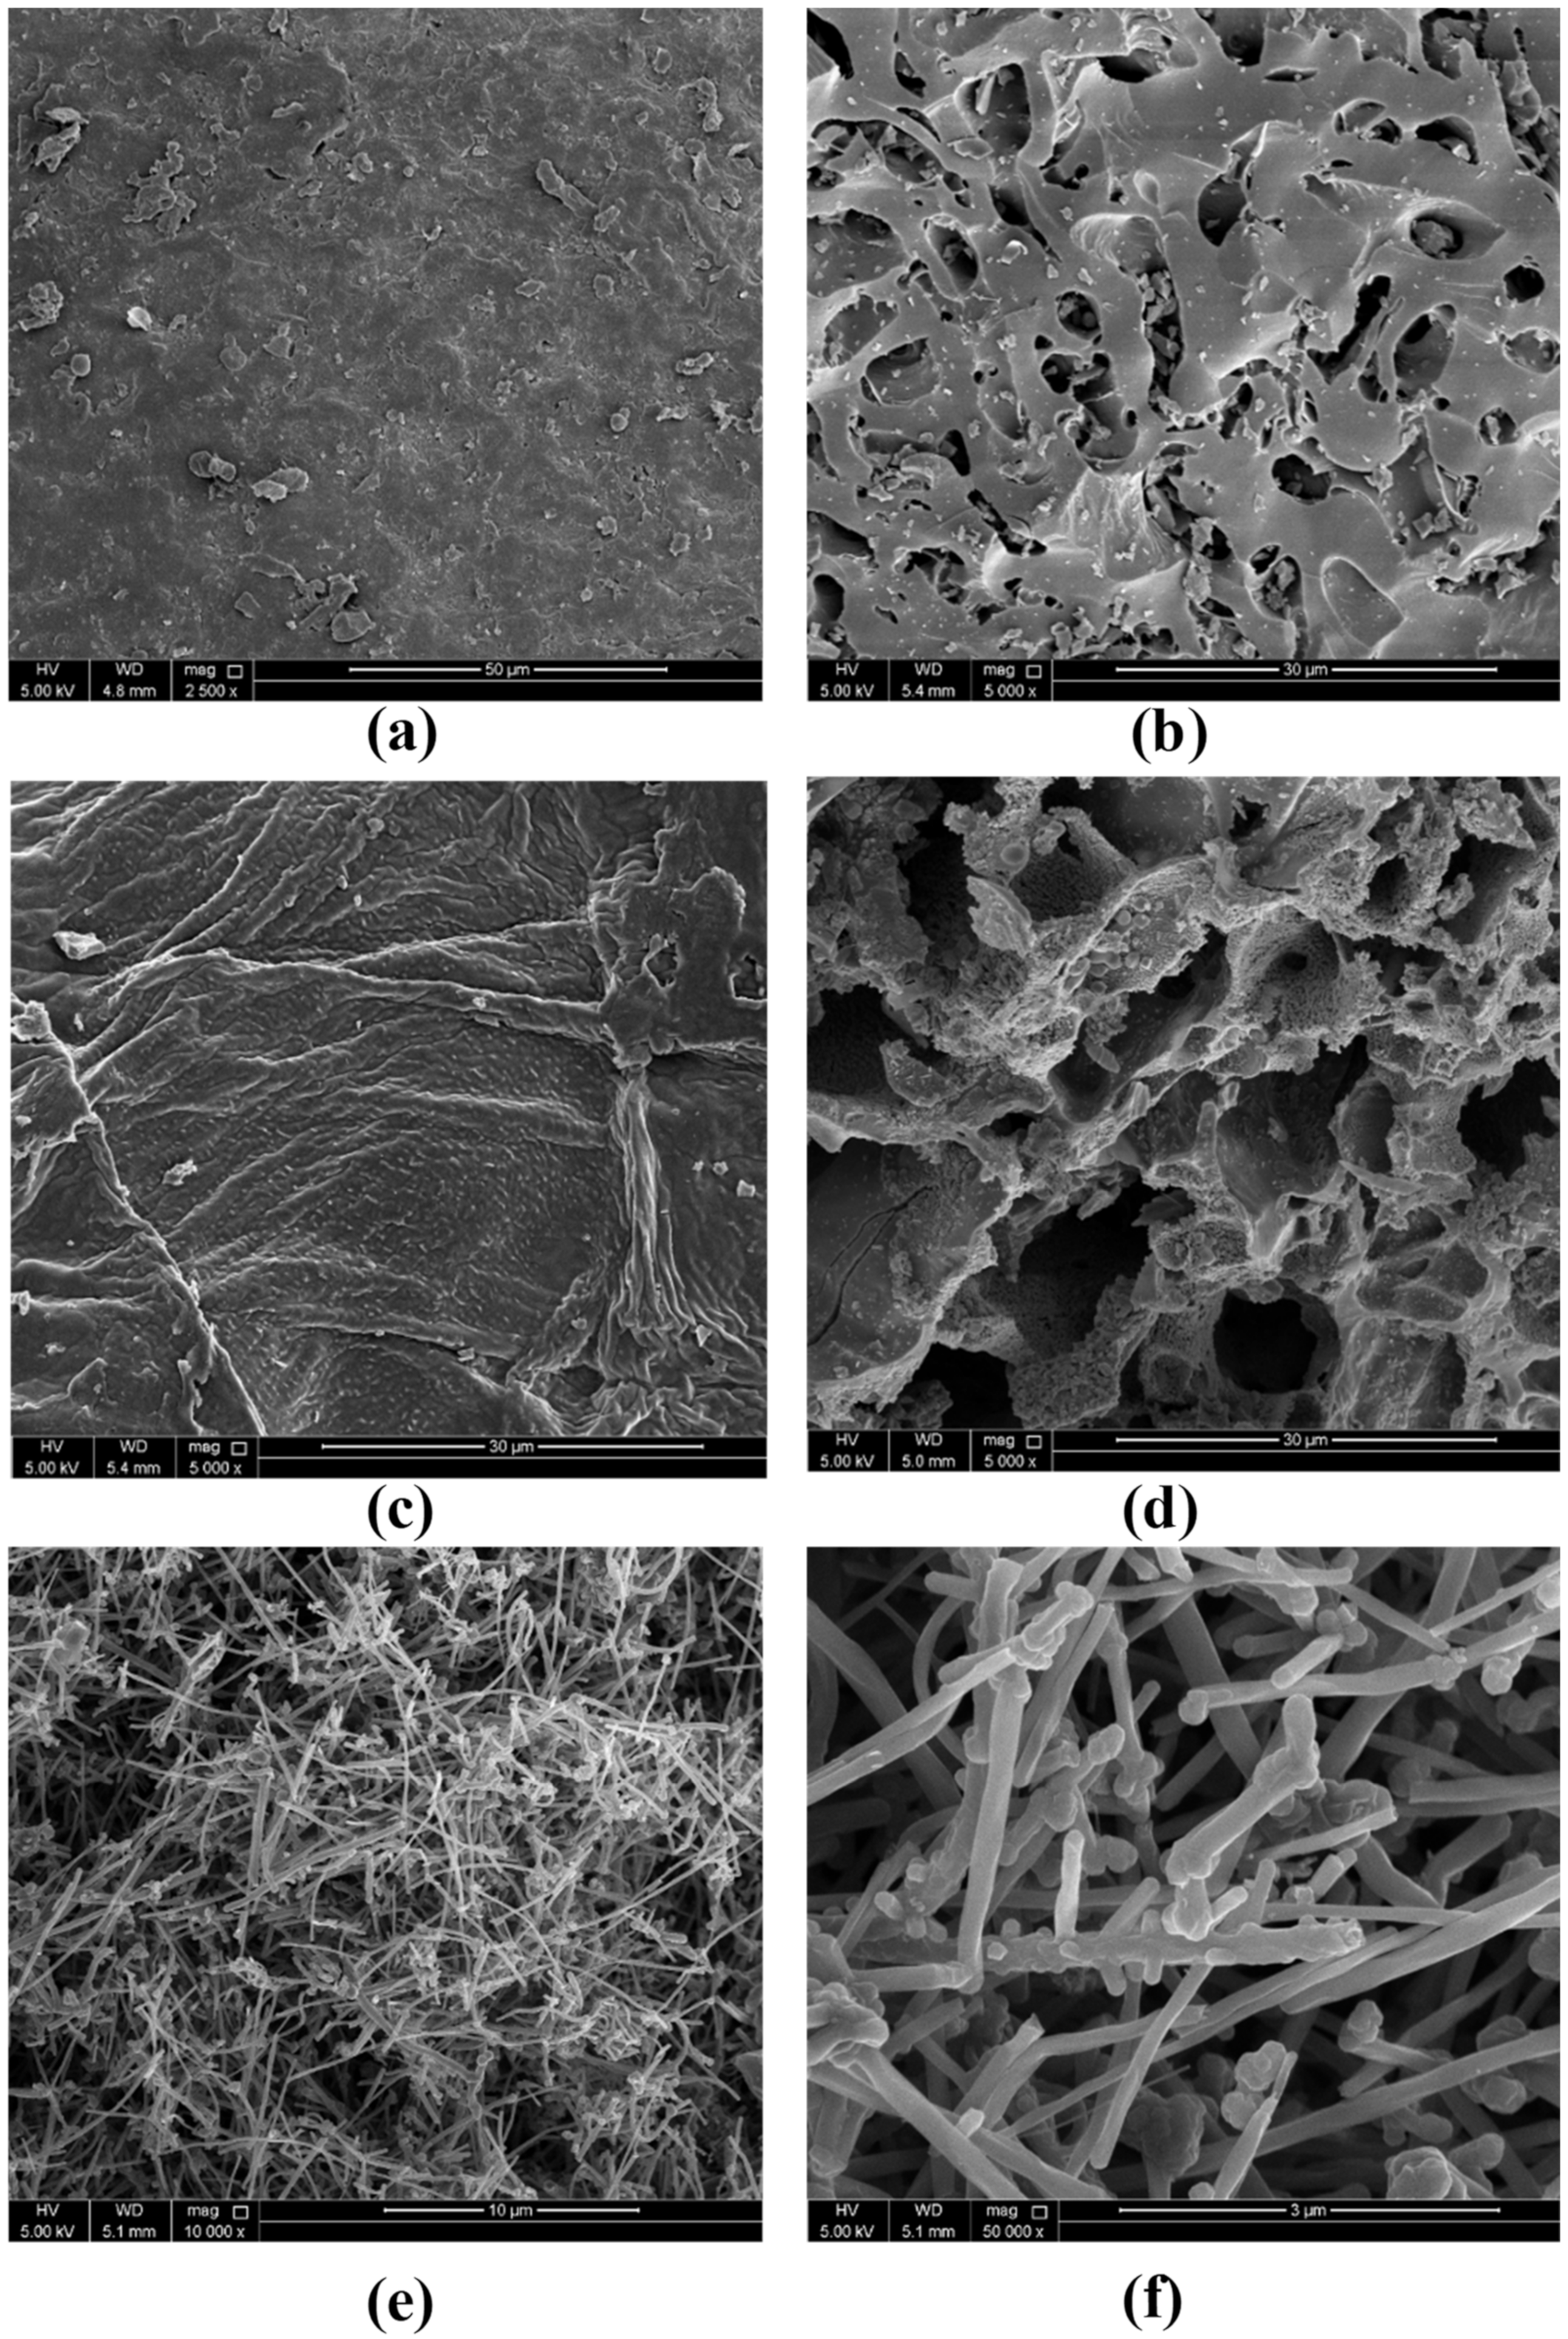
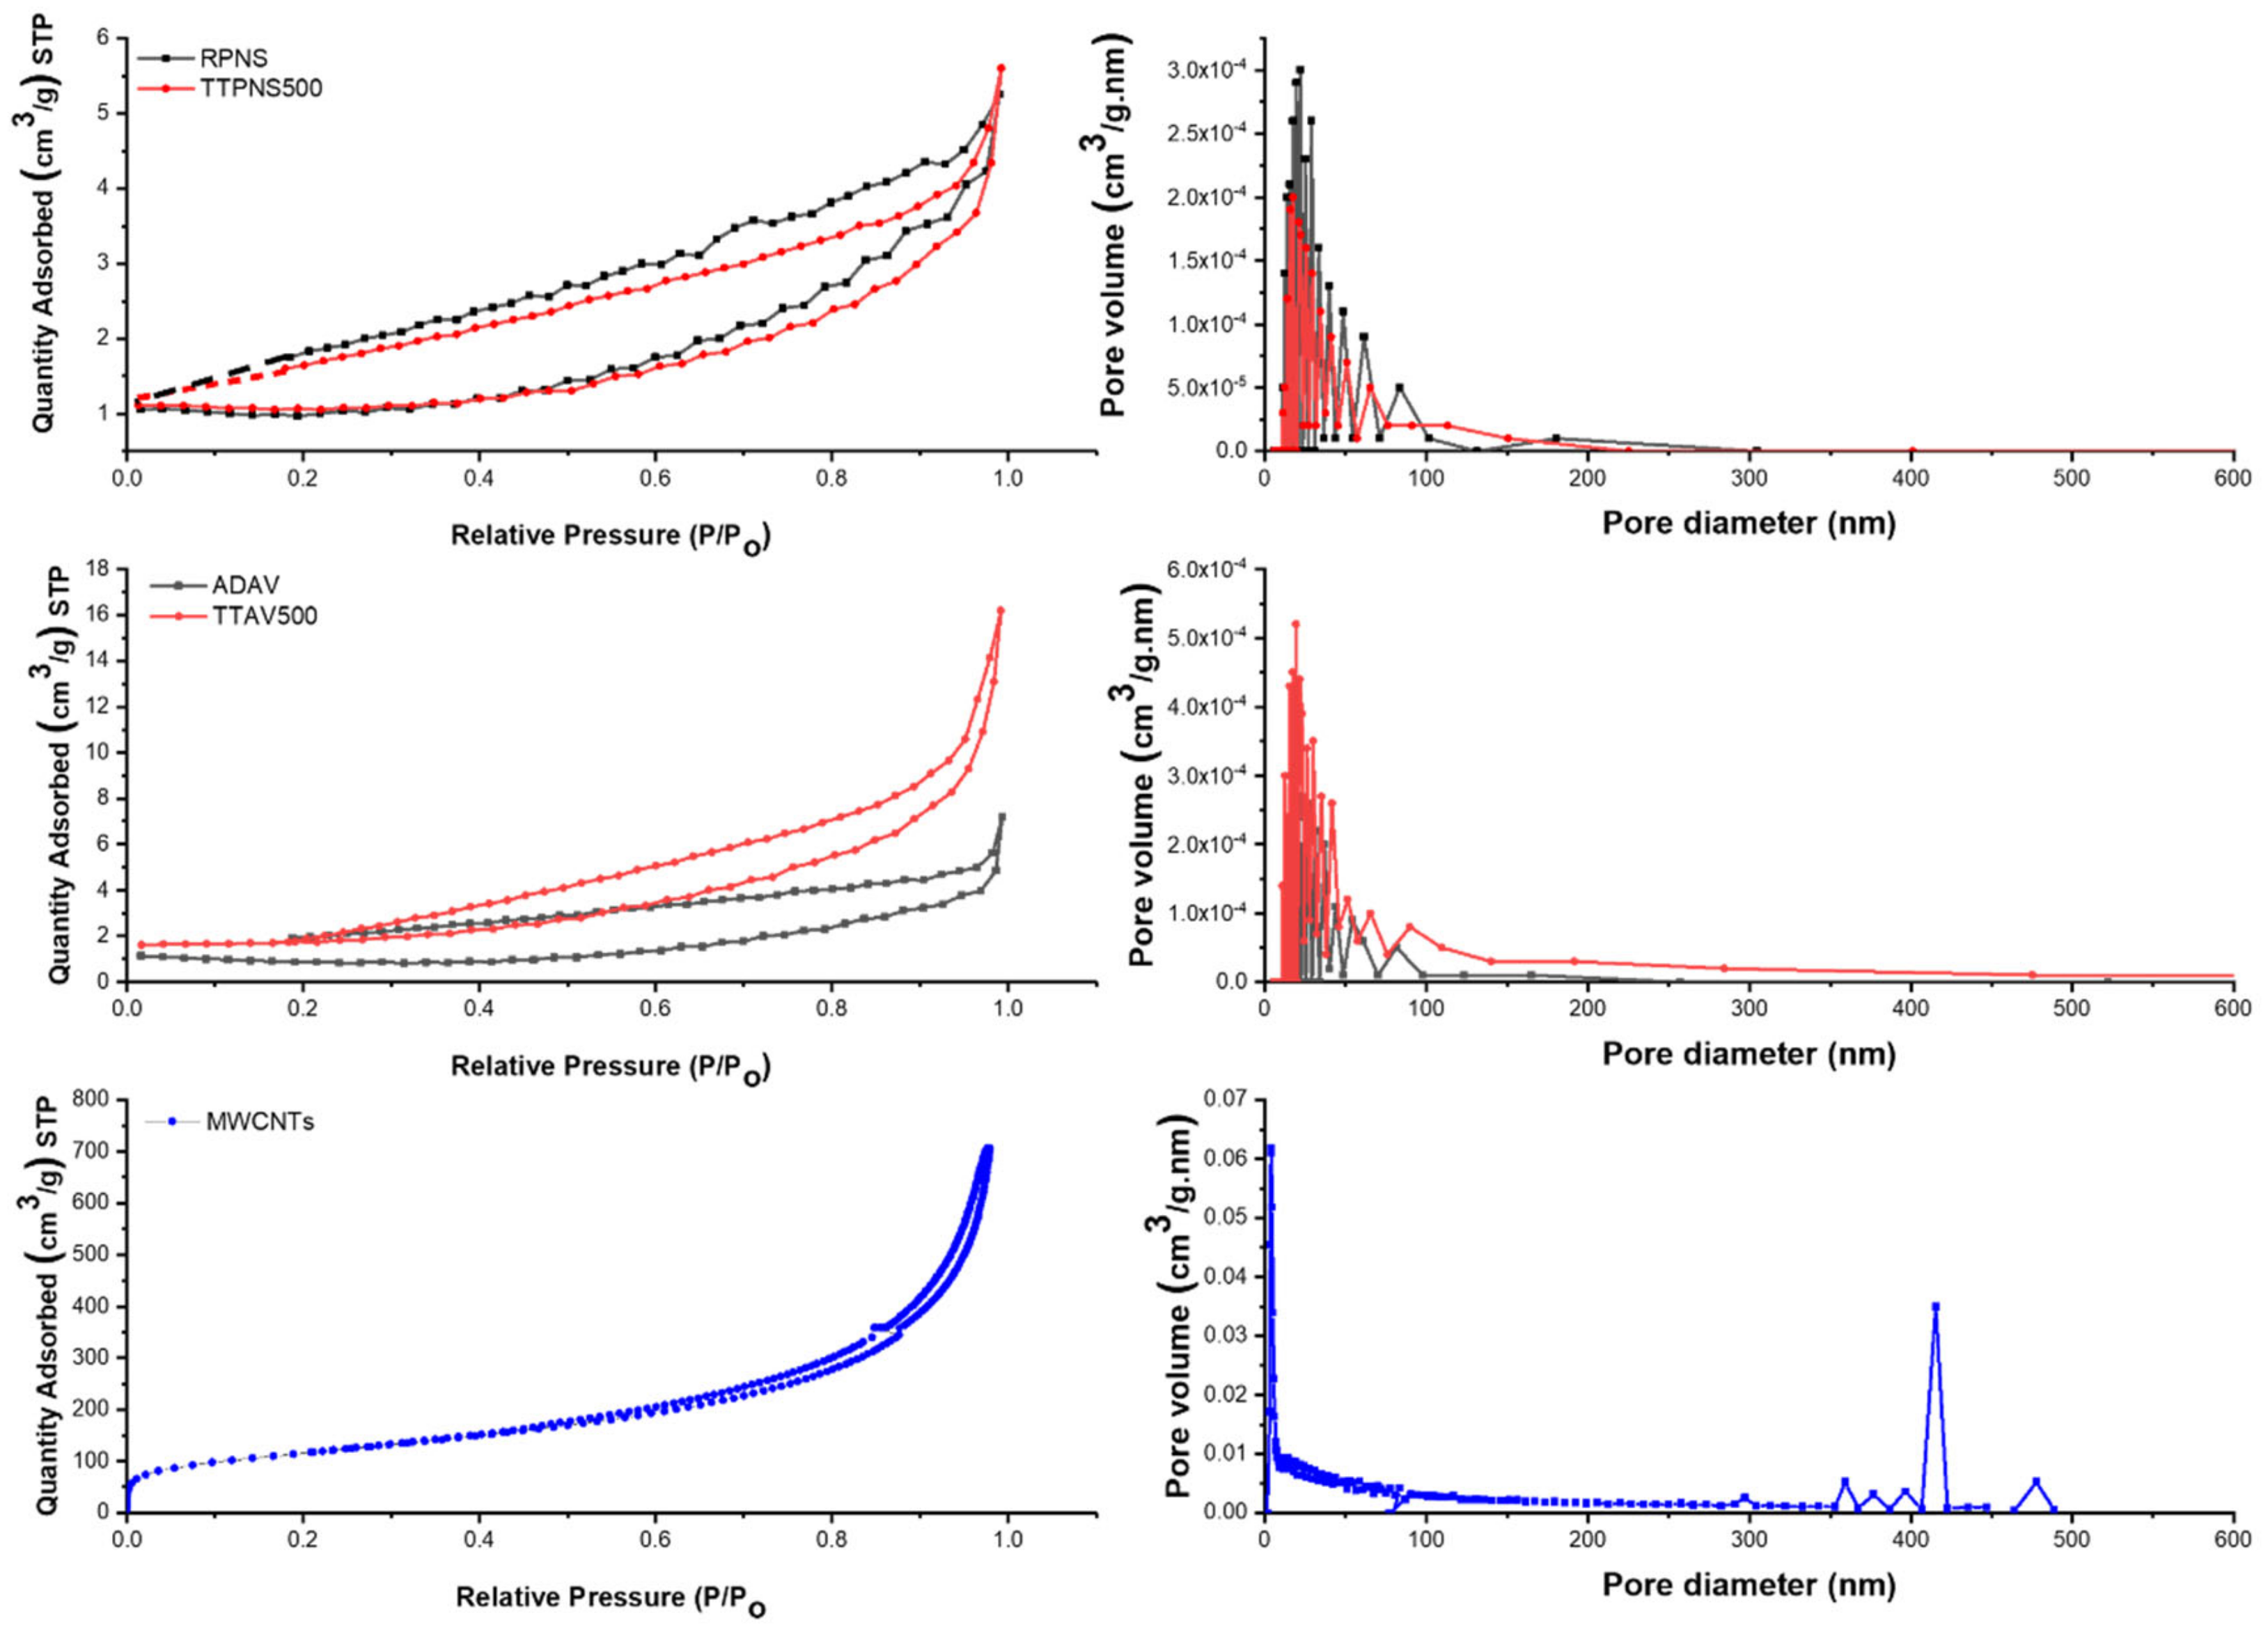
2.6.4. Morphology Characteristics

Surface morphological characteristics were investigated using SEM together with BET analyses. Figure 9 shows the SEM micrographs of the five tested adsorbents. A common feature in raw AWs was the smooth meso- to macroporous surface (Figure 10). On the contrary, the thermally treated AWs showed a porous surface with mainly mesopores. Table 6 shows that the surface area (SA) of the MWCNTs was at least six times higher than the highest SA for the AWs and around 122 times higher compared to the SA of ADAV. Similarly, the pore volume for MWCNTs was much higher compared to any of the AWs. Yet, and as shown in Figure 10, MWCNTs has few pores and the exiting pores are mainly macroporous. These findings together with the FT-IR analysis confirm that adsorption of SARA onto RPNS is mainly controlled by the chemical structure of the adsorbent’s surface, in contrast to the MWCNTs where adsorption is controlled by the SA of the adsorbent.
Figure 10 shows that the BET adsorption isotherm was of type IV in case of MWCNTs, implying the occurrence of monolayer-multilayer adsorption followed by capillary condensation. It is noteworthy to mention that the initial part of type IV is similar to type II which occurs in case of non-porous surfaces like that of MWCNTs. The hysteresis loop is of H3 type inferring the formation of loose masses of plate-like particles forming slit-like pores. Like MWCNTs, the other four adsorbents show type IV BET isotherm. Also, similar to MWCNTs, adsorbents from PNS show H3 loop, while those from AV leaves show H4 loop inferring the existence of narrow slit-like pores as well as particles with internal voids of irregular shape, hollow spheres and broad size distribution [60].

2.7. Equilibrium and Kinetics Studies

The data in Table 2 show that RPNS and ADAV have the best removal efficiency for SARA compared to the thermally treated samples. The noteworthy to mention observation is that RPNS and ADAV are raw materials that are rich in C-O-C and C-OH groups as reported in the FT-IR section. Therefore, we expect that there are interactions between SARA and oxygen rich groups, which could be physical due to intermolecular forces or chemical due to the interaction of carboxylic or amine groups in SARA with OH groups on the surface of dried biomass. In this section, we are going to investigate the adsorption isotherms and kinetics.

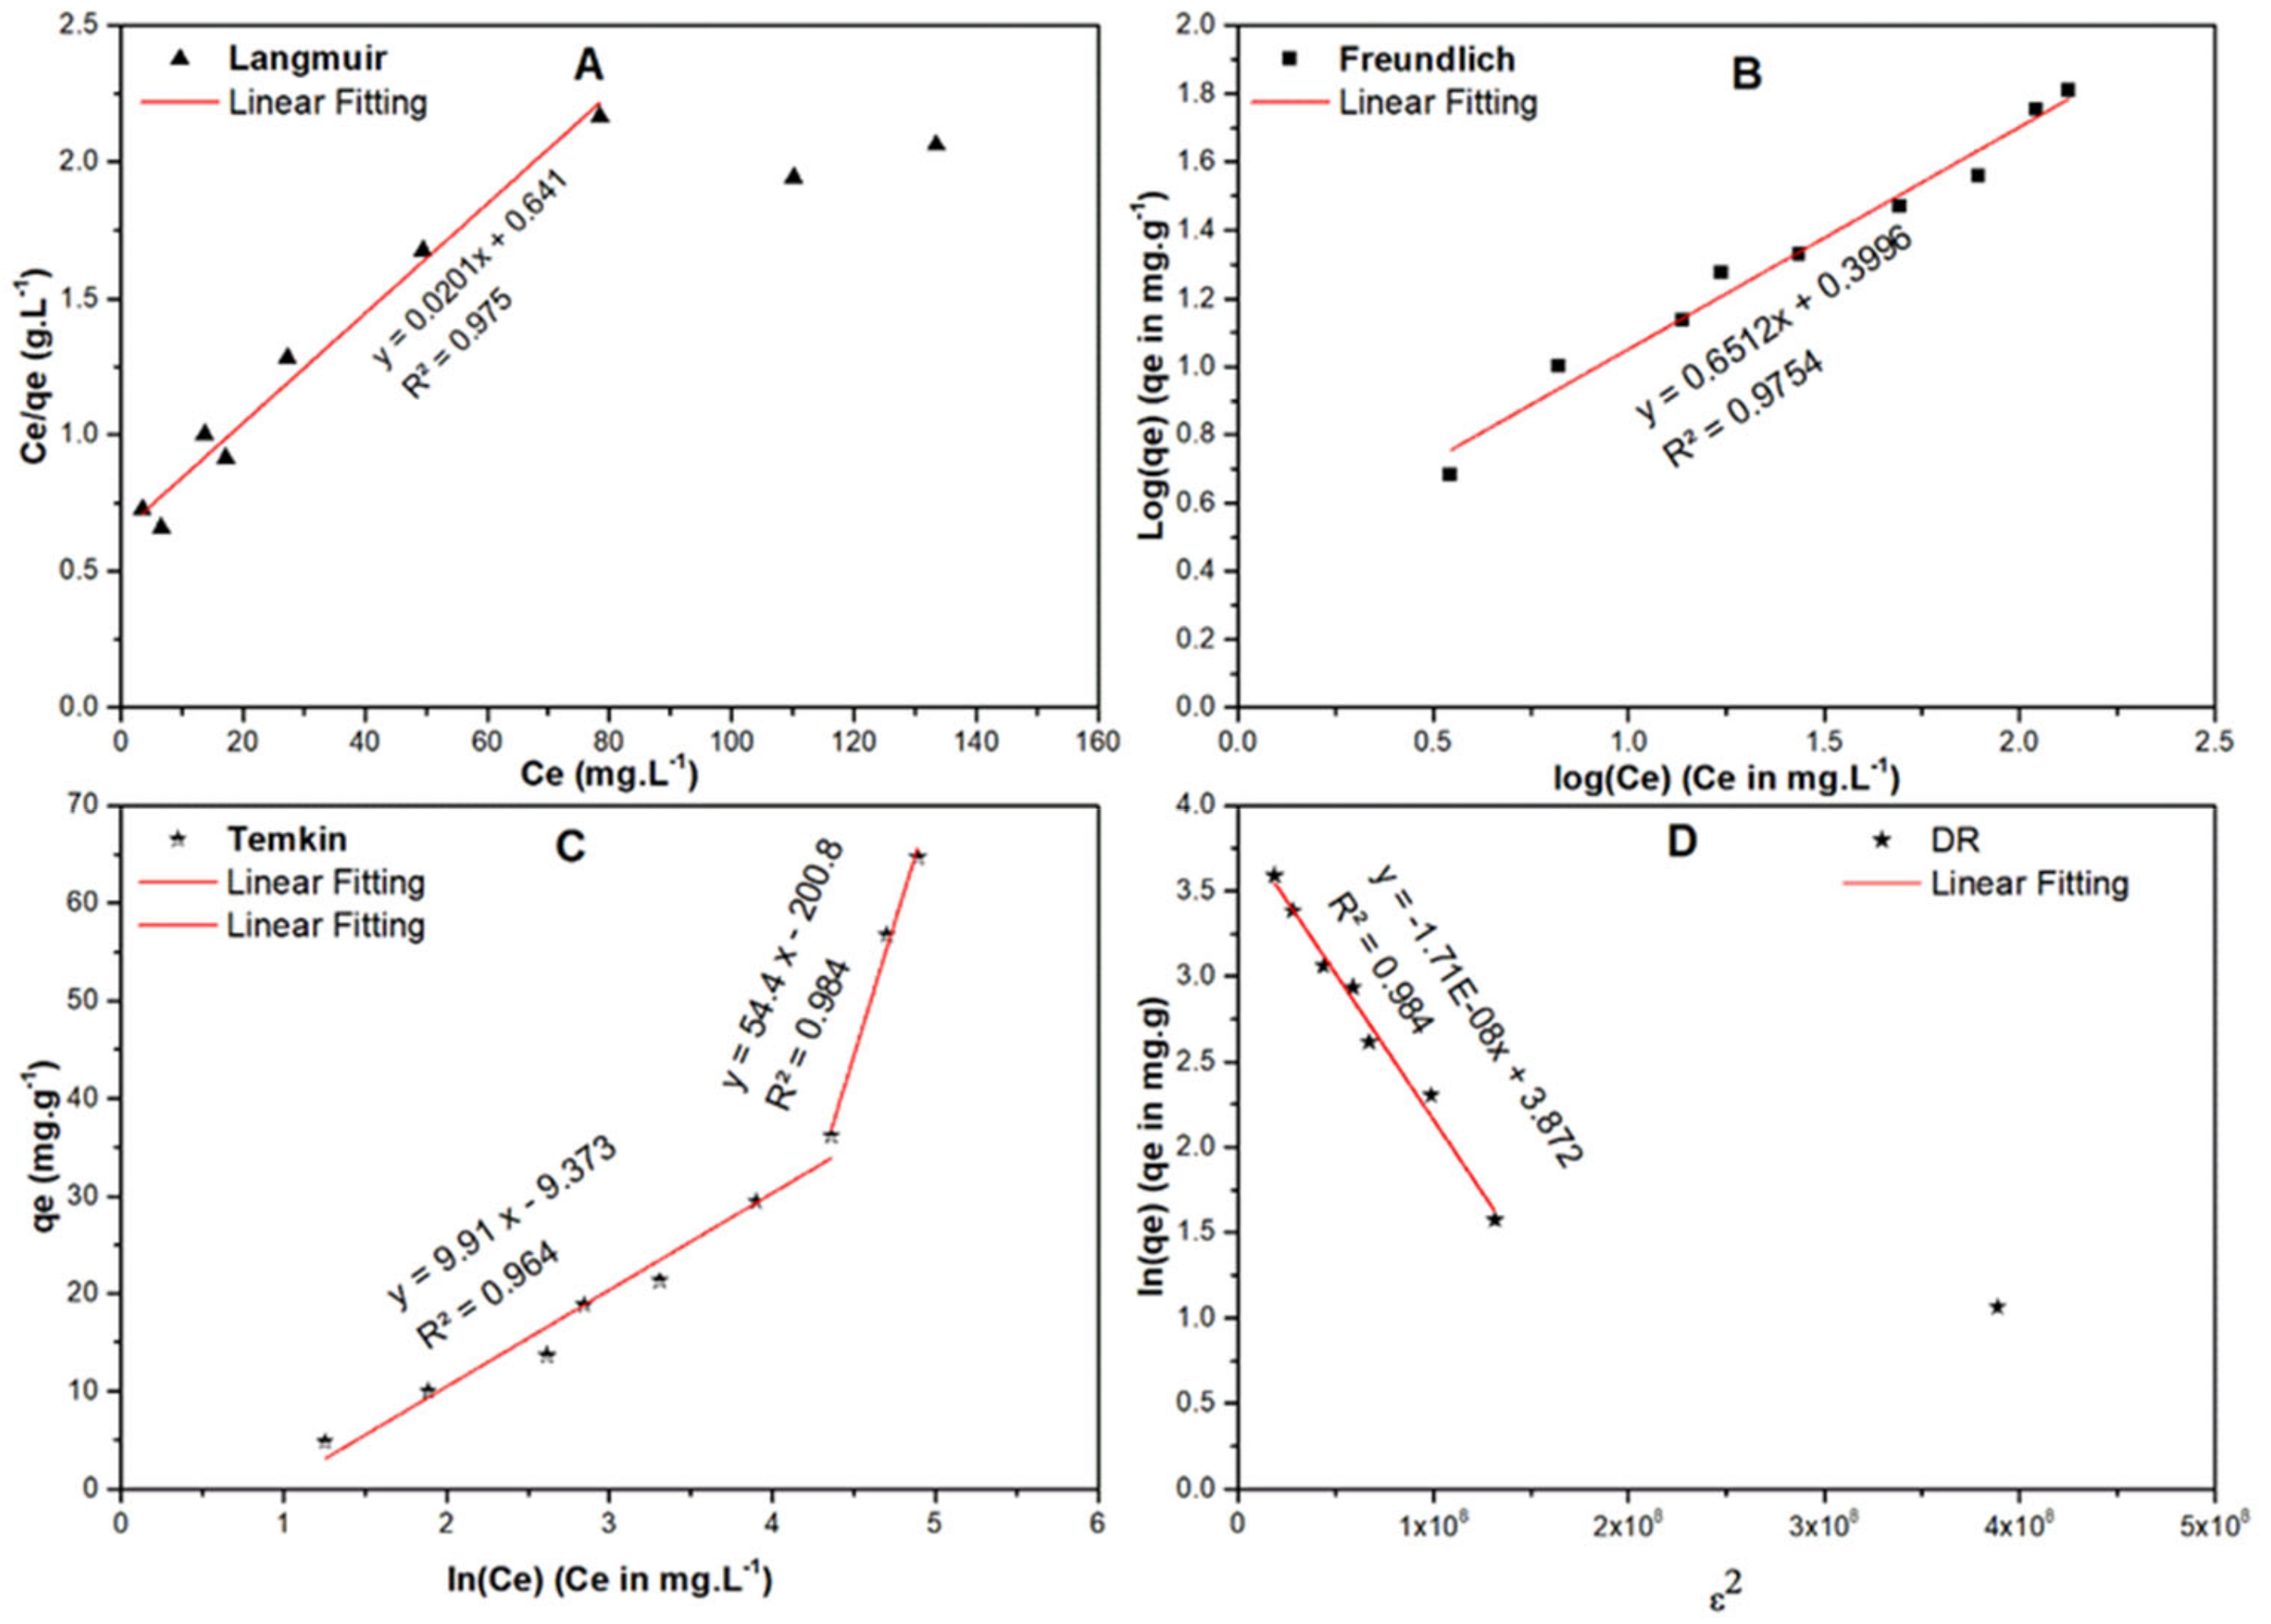
2.7.1. Equilibrium Isotherms

Adsorption isotherms express the specific relationship between the degree of accumulation on the adsorbent surface and the concentration of the adsorbate at a constant temperature. Langmuir, Freundlich, Temkin and Dubinin-Radushkevich (DR) isotherms have been used in the current investigation to study the adsorption of SARA onto RPNS from an aqueous solution [61,62,63,64]. These four isotherms are used extensively in most of the adsorption investigations.
Langmuir isotherm has three assumptions: (I) the adsorption energy is constant across all sites, (II) each molecule occupies only one site and no interaction between the molecules, finally (III) the adsorption is localized. Langmuir isotherm has been represented by Equation (7) and Figure 11a. The later shows a linear response up to a certain limit (80 ppm).
q e = q m   K L   C e 1 K L   C e
where qm is the maximum adsorption capacity and KL is Langmuir equilibrium coefficient. In addition, the Langmuir equation can be stated using the following dimensionless equation:
R L = 1 1 + K L   C 0
where RL is separation factor and C0 (mg/L) is the initial concentration. Based on previous reports, the adsorption favorability is dependent on the value of RL. In general, if RL is >1, the adsorption process is unfavorable, if RL = 1, adsorption is linear and with a value between 0–1, the adsorption is favorable (occurs spontaneously) and if it equals zero, adsorption is irreversible. The calculated RL value in the current investigation was <1 and tends to be zero at high concentration, implying that the adsorption process was spontaneous and at high concentration becomes irreversible with maximum adsorption (qmax) = 49.75 mg/g.
The Freundlich isotherm is a pure empirical approach and is used to describe heterogeneous surface energies as given by Equation (9):
q e =   K F C e 1 n
Here, Ce is the equilibrium concentration of SARA (mg/L); qe is the amount of SARA adsorbed/unit mass (mg·g−1), KF (mole·g−1)(L·mole−1)1/n and1/n are Freundlich coefficients (Figure 11b and Table 7). The Freundlich plot (Figure 11b) showed a good fit with an R2 = 0.975, 1/n = 0.651 and n = 1.536. Therefore, the adsorption potential (A = nRT) = 3.85 kJ and hence any SARA molecule with a potential energy <3.85 kJ will be adsorbed onto the surface of RPNS and reactions tend to be irreversible and favorable. These data confirm that Freundlich isotherm is more suitable to describe the adsorption process of SARA onto RPNS.
The Temkin isotherm (Figure 11c) gives an idea about the adsorbate-adsorbent interactions. As per this isotherm, the heat of adsorption of all the molecules in the layer decreases linearly with the adsorbent-adsorbate interactions. The data revealed in Table 7 show that there are two regions; the first one is less than equilibrium concentration (90 ppm), in which the sorption energy is 250 J/mol, while the other region is where the concentration is higher than 90 ppm and in which the sorption energy is 45.5 J/mol. This finding implies that the adsorption of SARA onto RPNS goes over two stages; first stage could be attributed to chemical adsorption to form one layer (confirmed by Langmuir isotherm) and the second is attributed to the physical interaction to form multilayers and this could interpret the isotherms of Langmuir and Freundlich.
Finally, the DR isotherm (Figure 11d) is built on the potential theory. The figure shows two regions; one at very low concentration, which could be attributed to ion exchange as revealed by the sorption energy (equals 15.981 kJ/mol), and the other region is physisorption where the sorption energy is 5.423 kJ/mol as shown in Table 7. In addition, the maximum capacity in the very low region is 6.23 mg/g, while the maximum capacity in the other region is 48.04 mg/g which is aligned with Langmuir maximum capacity.

2.7.2. Kinetic Studies

Four kinetic models; namely pseudo-first order (PFO), pseudo-second order (PSO), Elovich and Weber-Morris (WM) were applied to simulate the kinetics of the adsorption of SARA onto RPNS. Figure 12a,b show the plots of ln (qeqt) and time/qt vs time for the PFO and PSO kinetic models, respectively. The calculated parameters of the two models are listed in Table 8. By comparing the R2 values of the two models, it could be concluded that the experimental data were in good agreement with the PSO model (R2 = 0.993). Therefore, the reaction is represented as follows:
S A R A + R P N S   k       S A R A R P N S
According to the Elovich model shown in Figure 12c, the initial adsorption is very high 7.1 × 10³ mg·g−1·min−1. The Weber-Morris (WM) intraparticle diffusion model (Figure 12d) reveals many significant facts. First, there is another mechanism that controls the diffusion beside the intra-particle diffusion. Second, the diffusion occurs in two stages, starting with high diffusion rate (=2.19 mg·g−1·min−0.5) with less boundary layer equals 19.02 mg/g, then the diffusion rate decreases when the boundary layer equals 26.16 mg/g.

3. Materials and Methods

3.1. Materials and Reagents

All reagents and chemicals were of analytical grade and were used without further purification. Ultrapure water (18.2 MΩ) was used to prepare and dilute needed solutions. SARA and hydrochloric acid were procured from Sigma–Aldrich (Eschenstrasse, Taufkirchen, Germany). Multi-walled carbon nanotubes (MWCNTs, 90% carbon basis, D x L 110 – 170 nm × 5 – 9 µm) was also from Sigma-Aldrich but produced in Japan. Ammonium dihydrogen orthophosphate and sodium hydroxide were purchased from BDH Laboratory Supplies (Poole, UK). Raw adsorbents (RPNS) were purchased from local hypermarkets in Doha-Qatar, while fresh and green AV were collected from a backyard located in Doha, Qatar.

3.2. Equilibrium and Kinetic Studies

The equilibrium studies for the adsorption of SARA onto RPNS were done using a 500-ppm stock solution of SARA. Dilutions of the stock solution; 5–350 ppm were prepared in deionized water and the pH was adjusted to pH 5.00 ± 0.20 using phosphate buffer solution. Equal quantities of RPNS (0.050 g ± 0.005) were added to 15 mL of the previously prepared solutions. The prepared solutions were then shaken using an automatic shaker at 150 rpm for 2 h. then filtered. The absorbance of the filtrate was measured at 318 nm. On the other hand, the kinetics studies were done by mixing a 200 mL SARA drug solution (100 ppm, pH 5.00 ± 0.20) and ~1.0 g of RPNS with shaking, and one sample was taken at different time range over a time span of 90 min.

3.3. Instrumentation and Software

A diode array UV-Vis spectrophotometer (Agilent, Santa Clara, CA, USA) with 10 mm matched quartz cells was used to measure the absorbance of the aqueous solutions before and after adding the different adsorbents. A ST8 benchtop centrifuge (Thermo Scientific, Waltham, MA, USA) was used to separate the supernatant. The pH of the prepared solutions was adjusted using a Jenway pH meter (Jenway, Staffordshire, UK). Minitab®19 software was provided by Minitab Inc. (State College, PA, USA). The software was used to make the list of experiments according to the selected design. FT-IR spectroscopy (Bruker Alpha, Billerica, MA, USA) was used to explore the functional groups on the adsorbent’ surface before and following the adsorption process. Raman spectroscopy (Thermo Scientific, Waltham, MA, USA) was used to examine the formation of carbonaceous materials following the thermal treatment at 500 °C. Surface morphology was examined using scanning electron microscope (SEM, FEI, Quanta 200, Thermo Scientific) and energy dispersive X-ray spectroscopy (EDX, Thermo Scientific). Thermal stability of prepared adsorbents was inspected using a thermal gravimetric analyzer (TGA400, PerkinElmer, Waltham, MA, USA). Thermogravimetric analysis was performed under N2 with a heating rate of 10 °C/min. Measurements of surface area, pore size, and volume were performed using a Micromeritics ASAP2020 accelerated surface area and porosimetry system. Degassing of samples was initially applied, followed by studying N2 adsorption-desorption.

3.4. Preparation of the AWs’ Derived Adsorbents

As mentioned, pistachios were purchased from the local hypermarkets in Doha-Qatar. The packet label showed that pistachios are non-salted and non-roasted. RPNS and TTPNS500 were prepared as previously reported [27]. Briefly, the green kernels were cleared from the nutshells and the later were rinsed with distilled water several times. Washed nutshells were dried in the oven at 60 °C for five consecutive days, grinded, sieved, and then split into two allotments. The first part was preserved in tightly closed bottles in the desiccator and marked as RPNS. The other part was burnt in the oven at 500 °C and labelled as TTPNS500. Similarly, ADAV and TTAV500 were prepared as previously described [28]. In brief, the collected leaves were washed several times with water. The insider gel was taken off and leaves were re-washed again with distilled water. Leaves were cut into smaller pieces and left in shade for 5 days. Further oven drying was made at 50 °C for 2 h. Dry leaves were then pulverized and divided into two parts; the first is kept in sealed containers and labelled as ADAV. The second was exposed to thermal treatment at 500 °C for 2 h and labelled as TTAV500.

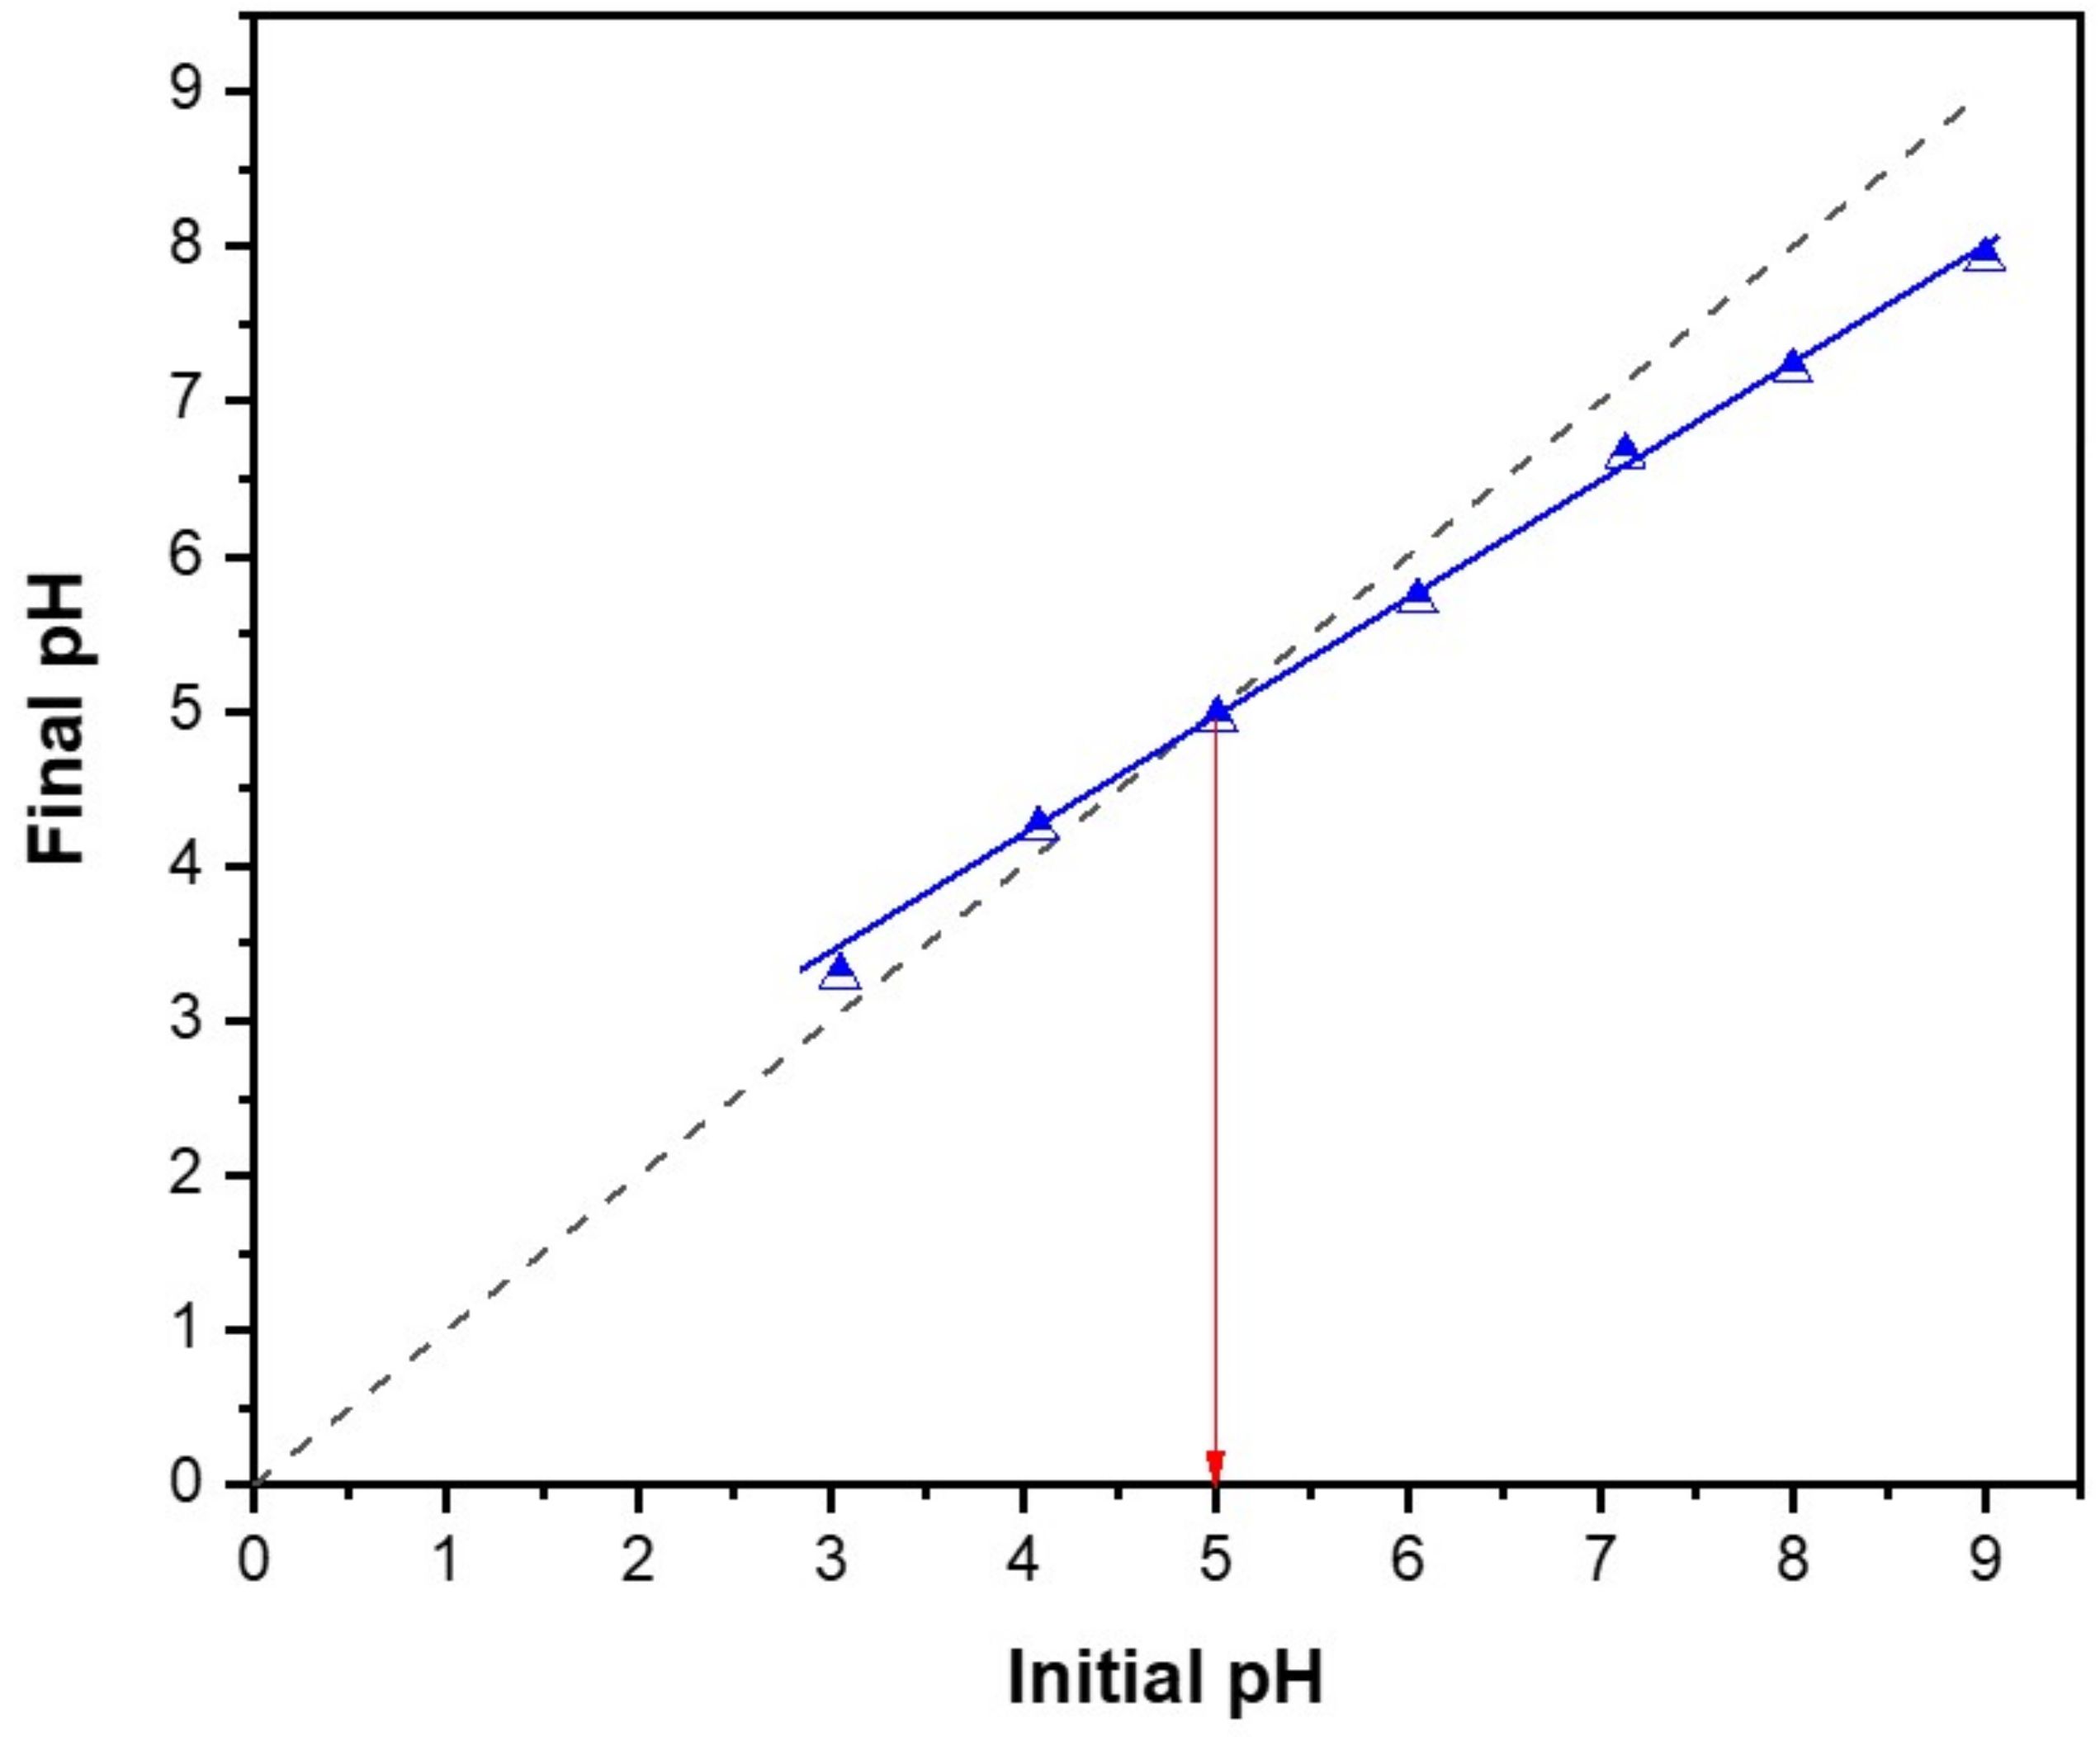
3.5. Determination of the Point of Zero Charge of RPNS

The pH drift method was used in this work to determine the point of zero charge (pHPZC) of the RPNS sample [56,57,58]. The samples were prepared by adding 1.0 g of RPNS to each flask of seven Erlenmeyer flasks containing 50 mL of 0.01 M NaCl. The pH within each flask was adjusted to values ranging from 3.0 to 9.0 ± 0.2 using either 0.10 M NaOH or 0.1 M HCl followed by shaking for 24 h. using an automatic shaker with speed 150 rpm. Finally, the final pH of the solution was measured and then plotted against the initial pH and the intersection point of the obtained curve was chosen to be the point of zero charge, pHPZC of the RPNS sample.

3.6. Plackett-Burman Design (PBD)

In the current study, AWs and MWCNTs were investigated as adsorbents for the removal of the veterinary FQ antibiotic (SARA) from the contaminated water samples. PBD was the design of choice for optimizing the removal efficiency of the tested adsorbents. Four independent variables (pH, [SARA], AD, and CT) were varied as per the variable limits stated in Table 3. Two dependent variables; %R and qe, (mg/g) were measured as a function of the four variables. The design pattern implicated conducting 20 basic runs (comprising eight Ct Pt) in one replicate over two blocks. The factorial limits which were chosen carefully in order to get the maximum responses as well as the full design matrix are shown in Table 3 and Table 4 [28,29,42]. Experimental values for dependent variables were calculated using the formulas described by Equations (1) and (2), and the obtained values are listed in Table 4. Predicted values as obtained by Minitab®19 are also listed in Table 4. A comparison between the experimental and theoretical values was performed based on the values of the relative error (RE).

4. Conclusions

The present work has elaborated on the efficiency of waste-derived materials as potential adsorbents for the antibiotic SARA from contaminated water samples. A comparison between upcycled waste materials derived from pistachio nutshells (PNS) and Aloe vera leaves (AV) both raw and thermally treated from one hand and the MWCNTs on the other hand was conducted. Plackett-Burman design (PBD) was executed to decide upon variables’ levels and significance on two responses (%R and qe). Four variables were therefore considered; pH, [SARA] initial concentration, AD and CT. Statistical analysis proved that the adsorption of SARA was suppressed by increasing the pH and that the region of pH 5.0–6.0 is the region where maximum adsorption could be observed. Morphological and textural characterization of adsorbents’ surface showed that the surface of waste-derived materials in their raw format had a plenty of functional moieties, in contrast to the thermally treated adsorbents and the MWCNTs. This observation together with the BET analysis show that adsorption in case of raw waste materials would probably be attributed to chemisorption. However, physisorption cannot be excluded. In case of MWCNTs, adsorption was mainly physisorption. Equilibrium studies as indicated by the Temkin isotherm show that the adsorption of SARA onto RPNS goes over two stages; chemisorption to form one layer (confirmed by Langmuir isotherm) and then a physical interaction to form multilayers. Freundlich isotherm shows that the adsorption of SARA onto RPNS was irreversible and favorable. Adsorption kinetics was best-fitted to the pseudo-second-order model, and adsorption isotherms were best described by the Elovich model. All in all, both RPNS and MWCNTs were proved to be efficient adsorbents for SARA with MWCNTs being superior with a %R of 96.20%.

Author Contributions

Conceptualization, M.E.-A., A.S.E.-S., K.A.A.-S. and A.A.I.; methodology, M.E.-A., A.A.I., and A.S.E.-S.; software, M.E.-A. and A.S.E.-S.; validation, M.E.-A., A.S.E.-S., K.A.A.-S. and A.A.I.; formal analysis, M.E.-A., A.S.E.-S. and A.A.I.; investigation, A.S.E.-S., A.E. and A.A.I.; resources, M.E.-A., K.A.A.-S. and S.A.-M.; data curation, M.E.-A., A.S.E.-S. and A.A.; writing—original draft preparation, M.E.-A. and A.A.I.; writing—review and editing, M.E.-A., A.S.E.-S., K.A.A.-S. and A.A.I.; visualization, A.S.E.-S. and A.E.; supervision, M.E.-A., A.S.E.-S., S.A.-M. and K.A.A.-S.; project administration, M.E.-A.; funding acquisition, M.E.-A., S.A.-M. and K.A.A.-S. All authors have read and agreed to the published version of the manuscript.

Funding

This research was funded by Qatar University, Collaborative grant number QUCG-CAS-19/20-3. All statements made herein are solely the responsibility of the authors.

Acknowledgments

The project members would like to extend their special thanks to the Central Lab Unit (CLU) at Qatar University.

Conflicts of Interest

The authors declare no conflict of interest.

Abbreviations

Activated carbons (ACs); Adsorption capacity (qe); Adsorbent dose (AD); Air-dried Aloe vera leaves (ADAV); Aloe vera leaves (AV); Analysis of variance (ANOVA); Anderson-Darling statistic (A-D); Agro-wastes (AWs); Brunauer–Emmett–Teller (BET); Carbon nanotubes (CNTs); Central points (Ct Pt); Coefficient of determination (R2); Concentration of sarafloxacin ([SARA]); Confidence interval (CI); Contact time (CT); Degrees of freedom (DF); Deoxyribonucleic acid (DNA); Dubinin-Radushkevich (DR); Fluoroquinolone antibiotics (FQs); Fourier transfer infrared spectroscopy (FT-IR spectroscopy); Initial drug concentration ([SARA]) (C); International Union of Pure and Applied Chemistry (IUPAC); Langmuir Surface Area (SA); Magnetized metal-organic framework (MOF) (Fe3O4/MIL-101(Fe)); Mean of Squares (MS); Mesoporous carbon nanoparticles (MCNs); Molecularly imprinted polymer nanoparticles (NanoMCN@MIPs); Multi-walled carbon nanotubes (MWCNTs); Nonimprinted polymer nanoparticles (NanoMCN@NIPs); Percentage removal (%R); Pistachio nutshells (PNS); Plackett-Burman design (PBD); Point-of-zero-charge (PZC); Polydopamine-coated graphene oxide/Fe3O4 (PDA@GO/Fe3O4); Powdered activated carbon (PAC); Pseudo-first order (PFO); Pseudo-second order (PSO); Raw pistachio nutshells (RPNS); Relative error (RE); Sarafloxacin (SARA); Scanning electron microscope (SEM); Sum of squares (SS); Thermally treated AV leaves at 500 °C (TTAV500); Thermally treated PNS at 500 °C (TTPNS500); Thermogravimetric analysis (TGA); Wastewater treatment plants (WWTPs); Weber-Morris (WM).

References

  1. Pukšec, T.; Leahy, P.; Foley, A.; Markovska, N.; Duić, N. Sustainable development of energy, water and environment systems 2016 (SDEWES2016). Renew. Sust. Energ. Rev. 2018, 82, 1685–1690. [Google Scholar] [CrossRef]
  2. El-Gendy, A.; El-Shafie, A.S.; Issa, A.; Al-Meer, S.; Al-Saad, K.; El-Azazy, M. Carbon-based materials (CBMS) for determination and remediation of antimicrobials in different substrates: Wastewater and infant foods as examples. In Carbon-Based Material for Environmental Protection and Remediation; Bartoli, M., Frediani, M., Rosi, L., Eds.; IntechOpen: London, UK, 2020; Available online: https://www.intechopen.com/books/carbon-based-material-for-environmental-protection-and-remediation/carbon-based-materials-cbms-for-determination-and-remediation-of-antimicrobials-in-different-substrates (accessed on 22 September 2020). [CrossRef]
  3. Sarmah, A.K.; Meyer, M.T.; Boxall, A.B.A. A global perspective on the use, sales, exposure pathways, occurrence, fate and effects of veterinary antibiotics (VAs) in the environment. Chemosphere 2006, 65, 725–759. [Google Scholar] [CrossRef] [PubMed]
  4. Couto, C.F.; Lange, L.C.; Amaral, M.C.S. Occurrence, fate and removal of pharmaceutically active compounds (PhACs) in water and wastewater treatment plants—A review. J. Water Process Eng. 2019, 32, 100927. [Google Scholar] [CrossRef]
  5. Watkinson, A.J.; Murby, E.J.; Kolpin, D.W.; Costanzo, S.D. The occurrence of antibiotics in an urban watershed: From wastewater to drinking water. Sci. Total Environ. 2009, 407, 2711–2723. [Google Scholar] [CrossRef] [PubMed]
  6. Heeb, S.; Fletcher, M.P.; Chhabra, S.R.; Diggle, S.P.; Williams, P.; Cámara, M. Quinolones: From antibiotics to autoinducers. FEMS Microbiol. Rev. 2011, 35, 247–274. [Google Scholar] [CrossRef] [PubMed] [Green Version]
  7. Huang, C.H.; Renew, J.E.; Smeby, K.L.; Pinkerston, K.; Sedlak, D.L. Assessment of potential antibiotic contaminants in water and preliminary occurrence analysis. Water Resour. 2001, 120, 30–40. [Google Scholar]
  8. Carabineiro, S.; Thavorn-Amornsri, T.; Pereira, M.; Serp, P.; Figueiredo, J. Comparison between activated carbon, carbon xerogel and carbon nanotubes for the adsorption of the antibiotic ciprofloxacin. Catal. Today 2012, 186, 29–34. [Google Scholar] [CrossRef]
  9. Dong, S.; Sun, Y.; Wu, J.; Wu, B.; Creamer, A.E.; Gao, B. Graphene oxide as filter media to remove levofloxacin and lead from aqueous solution. Chemosphere 2016, 150, 759–764. [Google Scholar] [CrossRef]
  10. Peng, H.; Pa, B.; Wu, M.; Liu, Y.; Zhang, D.; Xing, B. Adsorption of ofloxacin and norfloxacin on carbon nanotubes: Hydrophobicity-and structure-controlled process. J. Hazard. Mater. 2012, 233, 89–96. [Google Scholar] [CrossRef]
  11. Dan, A.; Xiaomeng, Z.; Yunv, D.; Chunxing, C.; Yang, Y. Occurrence and removal of quinolone, tetracycline, and macrolide antibiotics from urban wastewater in constructed wetlands. J. Clean. Prod. 2020, 252, 119677. [Google Scholar]
  12. Ran, Y.; Liang, C.; Rong, S.; Peng, L.; Naibiao, S. Quantification of ultra-trace levels of fluoroquinolones in wastewater by molecularly imprinted solid phase extraction and liquid chromatography triple quadrupole mass. Environ. Technol. Innov. 2020, 19, 100919. [Google Scholar]
  13. Chansiripornchai, N.; Sasipreeyajan, J. Efficacy of sarafloxacin in broilers after experimental infection with Escherichia coli. Vet. Res. Commun. 2002, 26, 255–262. [Google Scholar] [CrossRef] [PubMed]
  14. WHO/FAO. FAO Fisheries Technical Paper 469: Responsible Use of Antibiotics in Aquaculture; World Health Organization: Geneva, Switzerland, 2005; Available online: http://www.fao.org/3/a-a0282e.pdf (accessed on 20 September 2020).
  15. EMEA [European Agency for the Evaluation of Medicinal Products]. Committee for Veterinarian Medicinal Products. Sarafloxacin (Salmonidae); Summary Report (1). 1997. Available online: EMEA/MRL/160/96-FINAL (accessed on 20 September 2020).
  16. Hektoen, H.; Berge, J.A.; Hormazabal, V.; Yndestad, M. Resistance of antimicrobial agents in marine sediments. Aquaculture 1995, 133, 175–184. [Google Scholar] [CrossRef]
  17. Jie, Z.; Qiang, H.; Xiaolong, Z.; Xiao, G.; Qiang, S.; Yan, L.; Binghua, Y.; Qian, Z.; Dionysios, D.D. Fabrication of CQDs/Bi5Nb3O15 nanocomposites for photocatalytic degradation of veterinary pharmaceutical sarafloxacin. Catal. Today 2019, in press. [Google Scholar]
  18. Deivasigamani, P.; Premasis, S.; Marc, L.; Mohan, A.; Maheswari, S.Z.; Michael, S. Photolysis of difloxacin and sarafloxacin in aqueous systems. Chemosphere 2009, 77, 739–746. [Google Scholar]
  19. Souvik, K.; Deivasigamani, P.; Marc, L.; Michael, S. In vitro residual anti-bacterial activity of difloxacin, sarafloxacin and their photoproducts after photolysis in water. Environ. Pollut. 2009, 157, 2722–2730. [Google Scholar]
  20. Fu, H.; Li, X.B.; Wang, J.; Lin, P.F.; Chen, C.; Zhang, X.J.; Suffet, I.H. Activated carbon adsorption of quinolone antibiotics in water: Performance, mechanism, and modeling. J. Environ. Sci. 2017, 56, 145–152. [Google Scholar] [CrossRef]
  21. Hao, W.; Yating, S.; Xiaozhen, G.; Shuangli, Z.; Juanli, D.; Hongping, J.; Lina, H.; Liming, D. Determination and removal of sulfonamides and quinolones from environmental water samples using magnetic adsorbents. J. Sep. Sci. 2016, 39, 4398–4407. [Google Scholar]
  22. Feng, T.; Daming, S.; Jinsuo, G.; Qian, Z.; Xiaochun, W.; Fei, T.; Xie, Q.; Jingwen, C. Preparation of molecularly imprinted polymer nanoparticles for selective removal of fluoroquinolone antibiotics in aqueous solution. J. Hazard. Mater. 2013, 244, 750–757. [Google Scholar]
  23. Feng, T.; Min, L.; Suyu, R. Preparation of poly dopamine coated graphene oxide/Fe3O4 imprinted nanoparticles for selective removal of fluoroquinolone antibiotics in water. Sci. Rep. 2017, 7, 5735. [Google Scholar]
  24. Abdolraouf, S.; Mohsen, N. Removal of sarafloxacin from aqueous solution by a magnetized metal-organic framework; Artificial neural network modeling. Polyhedron 2020, 179, 114342. [Google Scholar]
  25. Xiangyu, G.; Chufan, K.; Hongliang, H.; Yanjiao, C.; Chongli, Z. Exploration of functional MOFs for efficient removal of fluoroquinolone antibiotics from water. Microporous Mesoporous Mater. 2019, 286, 84–91. [Google Scholar]
  26. Al-Saad, K.; El-Azazy, M.; Issa, A.A.; Al-Yafie, A.; El-Shafie, A.S.; Al-Sulaiti, M.; Shomar, B. Recycling of date pits into a green adsorbent for removal of heavy metals: A fractional factorial design-based approach. Front. Chem. 2019, 7, 552. [Google Scholar] [CrossRef] [PubMed] [Green Version]
  27. El-Azazy, M.; El-Shafie, A.S.; Ashraf, A.; Issa, A.A. Eco-structured biosorptive removal of basic fuchsin using pistachio nutshells: A definitive screening design-based approach. Appl. Sci. 2019, 9, 4855. [Google Scholar] [CrossRef] [Green Version]
  28. El-Azazy, M.; Dimassi, S.; El-Shafie, A.S.; Issa, A. Bio-waste Aloe vera leaves as an efficient adsorbent for titan yellow from wastewater: Structuring of a novel adsorbent using Plackett-Burman factorial design. Appl. Sci. 2019, 9, 4856. [Google Scholar] [CrossRef] [Green Version]
  29. El-Azazy, M.; El-Shafie, A.S.; Issa, A.A.; Al-Sulaiti, M.; Al-Yafie, J.; Shomar, B.; Al-Saad, K. Potato peels as an adsorbent for heavy metals from aqueous solutions: Eco-structuring of a green adsorbent operating Plackett–Burman design. J. Chem. 2019, 2019, 4926240. [Google Scholar] [CrossRef] [Green Version]
  30. El-Azazy, M.; Kalla, R.N.; Issa, A.A.; Al-Sulaiti, M.; El-Shafie, A.S.; Shomar, B.; Al-Saad, K. Pomegranate peels as versatile adsorbents for water purification: Application of Box–Behnken design as a methodological optimization approach. Environ. Prog. Sustain. Energy. 2019, 38, 13223. [Google Scholar] [CrossRef]
  31. Hassan, S.S.; El-Shafie, A.S.; Zaher, N.; El-Azazy, M. Application of pineapple leaves as adsorbents for removal of rose bengal from wastewater: Process optimization operating face-centered central composite design (FCCCD). Molecules 2020, 25, 3752. [Google Scholar] [CrossRef]
  32. Jordan, B.N.; Francisco, H.M.L.; Erik, G.P.S.; Fermin, G.V. Evaluation of adsorption processes of metal ions in multi-element aqueous systems by lignocellulosic adsorbents applying different isotherms: A critical review. Chem. Eng. J. 2019, 357, 404–420. [Google Scholar]
  33. Al-Saad, K.; Issa, A.A.; Idoudi, S.; Shomar, B.; Al-Ghouti, M.A.; Al-Hashimi, N.; El-Azazy, M. Smart synthesis of trimethyl ethoxysilane (TMS) functionalized core–shell magnetic nanosorbents Fe3O4@SiO2: Process optimization and application for extraction of pesticides. Molecules 2020, 25, 4827. [Google Scholar] [CrossRef]
  34. Huijun, H.; Yongpan, L.; Shaohong, Y.; Jie, L.; He, X.; Zhihong, T. A Review on recent treatment technology for herbicide atrazine in contaminated environment. Int. J. Environ. Res. Public Health. 2019, 16, 5129. [Google Scholar]
  35. Yan, C.; Chunping, Y.; Huijun, H.; Guangming, Z.; Kun, Z.; Zhou, Y. Biosorption of Pb(II) ions from aqueous solutions by waste biomass from biotrickling filters: Kinetics, isotherms, and thermodynamics. J. Environ. Eng. 2015, 142, C4015001. [Google Scholar]
  36. Huijun, H.; Xiang, Z.; Chen, X.; Chen, H.; Huang, H.; Wen, M.; Yang, C. Biosorption of Cd(II) from synthetic wastewater using dry biofilms from biotrickling filters. Int. J. Environ. Sci. Technol. 2017, 15, 1491–1500. [Google Scholar]
  37. Kim, H.; Hwang, Y.S.; Sharma, V.K. Adsorption of antibiotics and iopromide onto single-walled and multiwalled carbon nanotubes. Chem. Eng. J. 2014, 255, 23–27. [Google Scholar] [CrossRef]
  38. Yang, W.; Lu, Y.; Zheng, F.; Xue, X.; Li, N.; Liu, D. Adsorption behavior and mechanisms of norfloxacin onto porous resins and carbon nanotube. Chem. Eng. J. 2012, 179, 112–118. [Google Scholar] [CrossRef]
  39. Seyed, D.A.; Hossein, K.; Jalil, J.; Amir, H.M. Experimental design and response surface modeling for optimization of fluoroquinolone removal from aqueous solution by NaOH-modified rice husk. Desalination Water Treat. 2016, 57, 16456–16465. [Google Scholar]
  40. Olivia, A.A.; Medhat, A.A.; Marianne, N.; Maissa, Y.S. Adsorptive removal of fluoroquinolones from water by pectin functionalized magnetic nanoparticles: Process optimization using a spectrofluorimetric assay. ACS Sustain. Chem. Eng. 2017, 5, 133–145. [Google Scholar]
  41. Elazazy, M.S. Factorial design and machine learning strategies: Impacts on pharmaceutical analysis. In Spectroscopic Analyses; Zafar, F., Ed.; IntechOpen: London, UK, 2017; Available online: https://www.intechopen.com/books/spectroscopic-analyses-developments-and-applications/factorial-design-and-machine-learning-strategies-impacts-on-pharmaceutical%20analysis (accessed on 10 September 2020).
  42. Elazazy, M.S.; El-Hamshary, M.; Sakr, M.; Al-Easa, H.S. Plackett-Burman and Box-Behnken designs as chemometric tools for micro-determination of L-Ornithine. Spectrochim. Acta A Mol. Biomol. Spectrosc. 2018, 193, 397–406. [Google Scholar] [CrossRef]
  43. Aly, H.; El-Shafie, A.S.; El-Azazy, M. Utilization of 7-chloro-4-nitrobenzo-2-oxa-1,3- diazole (NBD-Cl) for spectrochemical determination of L-ornithine: A multivariate optimization-assisted approach. RSC Adv. 2019, 9, 22106–22115. [Google Scholar] [CrossRef] [Green Version]
  44. Anderson, T.W.; Darling, D.A. A test of goodness of fit. J. Am. Stat. Assoc. 1954, 49, 765–769. [Google Scholar] [CrossRef]
  45. Box, G.E.P.; Cox, D.R. An analysis of transformations. J. R. Stat. Soc. B. 1964, 26, 211–252. [Google Scholar] [CrossRef]
  46. Derringer, G.; Suich, R. Simultaneous optimization of several response variables. J. Qual. Technol. 1980, 12, 214–219. [Google Scholar] [CrossRef]
  47. Hanbali, G.; Jodeh, S.; Hamed, O.; Bol, R.; Khalaf, B.; Qdemat, A.; Samhan, S. Enhanced ibuprofen adsorption and desorption on synthesized functionalized magnetic multiwall carbon nanotubes from aqueous solution. Materials 2020, 13, 3329. [Google Scholar] [CrossRef] [PubMed]
  48. Pathak, P.D.; Mandavgane, S.A.; Kulkarni, B.D. Characterizing fruit and vegetable peels as bioadsorbents. Curr. Sci. 2016, 110, 2114–2123. [Google Scholar] [CrossRef]
  49. Horn, M.M.; Martins, V.C.A.; Plepis, A.M.D. Interaction of anionic collagen with chitosan: Effect on thermal and morphological characteristics. Carbohydr. Polym. 2009, 77, 239–243. [Google Scholar] [CrossRef]
  50. Ralph, J.; Lapierre, C.; Boerjan, W. Lignin structure and its engineering. Curr. Opin. Biotech. 2019, 56, 240–249. [Google Scholar] [CrossRef]
  51. Kacurakova, M.; Capek, P.; Sasinkova, V.; Wellner, N.; Ebringerova, A. FT-IR study of plant cell wall model compounds: Pectic polysaccharides and hemicelluloses. Carbohydr. Polym. 2000, 43, 195–203. [Google Scholar] [CrossRef]
  52. Huang, A.; Zhou, Q.; Liu, J.; Fei, B.; Sun, S. Distinction of three wood species by Fourier transform infrared spectroscopy and two-dimensional correlation IR spectroscopy. J. Mol. Struct. 2008, 883, 160–166. [Google Scholar] [CrossRef]
  53. Evans, P.A. Differentiating “hard” from “soft” woods using Fourier transform infrared and Fourier transform Raman spectroscopy. Spectrochim. Acta A Mol. Spectrosc. 1991, 47, 1441–1447. [Google Scholar] [CrossRef]
  54. Sills, D.L.; Gossett, J.M. Using FTIR to predict saccharification from enzymatic hydrolysis of alkali pretreated biomasses. Biotechnol. Bioeng. 2012, 109, 353–362. [Google Scholar] [CrossRef]
  55. Kurrey, R.; Mahilang, M.; Deb, M.K.; Nirmalkar, J.; Shrivas, K.; Pervez, S.; Rai, M.K.; Rai, J. A direct DRS-FTIR probe for rapid detection and quantification of fluoroquinolone antibiotics in poultry egg-yolk. Food Chem. 2019, 270, 459–466. [Google Scholar] [CrossRef] [PubMed]
  56. Silverstein, R.M.; Webster, F.X. Spectrometric Identification of Organic Compounds, 6th ed.; John Wiley and Sons: New York, NY, USA, 2002. [Google Scholar]
  57. Şentürk, I.; Alzein, M. Adsorptive removal of basic blue 41 using pistachio shell adsorbent—Performance in batch and column system. Sustain. Chem. Pharm. 2020, 16, 100254. [Google Scholar] [CrossRef]
  58. Ferro-García, M.A.; Rivera-Utrilla, J.; Bautista-Toledo, I.; Moreno-Castilla, C. Adsorption of humic substances on activated carbon from aqueous solutions and their effect on the removal of Cr (III) ions. Langmuir 1998, 14, 1880–1886. [Google Scholar] [CrossRef]
  59. Kuśmierek, K.; Świątkowski, A. Removal of chlorophenols from aqueous solutions by sorption onto walnut, pistachio and hazelnut shells. Pol. J. Chem. Technol. 2015, 17, 23–31. [Google Scholar] [CrossRef] [Green Version]
  60. Thommes, M.; Kaneko, K.; Neimark, A.V. Physisorption of gases, with special reference to the evaluation of surface area and pore size distribution (IUPAC Technical Report). Pure Appl. Chem. 2015, 87, 1052–1069. [Google Scholar] [CrossRef] [Green Version]
  61. Langmuir, I. Adsorption of gases on glass, mica and platinum. J. Am. Chem. Soc. 1918, 40, 1361–1403. [Google Scholar] [CrossRef] [Green Version]
  62. Guo, X.; Wang, J. Comparison of linearization methods for modeling the Langmuir adsorption isotherm. J. Mol. Liq. 2019, 296, 111850. [Google Scholar] [CrossRef]
  63. Araújo, C.S.T.; Almeida, I.L.S.; Rezende, H.C.; Marcionilio, S.M.L.O.; Léon, J.J.L.; de Matos, T.N. Elucidation of mechanism involved in adsorption of Pb (II) onto Lobeira fruit (Solanum lycocarpum) using Langmuir, Freundlich and Temkin isotherms. Microchem. J. 2018, 137, 348–354. [Google Scholar] [CrossRef]
  64. Moussavi, G.; Barikbin, B. Biosorption of chromium (VI) from industrial wastewater onto pistachio hull waste biomass. Chem. Eng. J. 2010, 162, 893–900. [Google Scholar] [CrossRef]
Figure 1. Chemical structure of SARA together with the physicochemical relevant data.
Molecules 25 05429 g001
Figure 2. (a) Pareto chart of standardized effects; and (b) Probability plots for the two measured responses. For each panel, %R is shown on the Left while qe is the Right panel. Represented data were obtained following response transformation.
Molecules 25 05429 g002
Figure 3. (a) Contour and (b) Surface plots for %R using RPNS.
Molecules 25 05429 g003
Figure 4. Optimization plots for (a) %R and (b) qe using RPNS.
Molecules 25 05429 g004
Figure 5. TGA/dTA analysis of RPNS, ADAV, and MWCNTs.
Molecules 25 05429 g005
Figure 6. (a) FT-IR spectra of tested adsorbents before adsorption, (b) SARA and RPNS after adsorption and (c) SARA and MWCNTs after adsorption.
Molecules 25 05429 g006aMolecules 25 05429 g006b
Figure 7. Determination of the pHpzc of the RPNS sample.
Molecules 25 05429 g007
Figure 8. Raman spectra of the tested adsorbents.
Molecules 25 05429 g008
Figure 9. SEM micrographs of (a) RPNS, (b) TTPNS500, (c) ADAV, (d) TTAV500, (e) MWCNTs 10 µm magnification and (f) MWCNTs 3 µm magnification.
Molecules 25 05429 g009
Figure 10. BET analysis of the five adsorbents.
Molecules 25 05429 g010
Figure 11. Adsorption isotherms of SARA onto RPNS including (A) Langmuir, (B) Freundlich, (C) Temkin, and (D) Dubinin-Radushkevich (DR).
Molecules 25 05429 g011
Figure 12. (A) First order, (B) second order, (C) Elovich and (D) intra-particle diffusion (WM) curves of adsorption of SARA onto RPNS.
Molecules 25 05429 g012
Table 1. Reported adsorption – based methods for removal of SARA.
AdsorbentAnalytical Approach UsedKinetics ModelIsotherm ModelSurface Area (m2/g)qe (mg/g)%RReferences
Raw pistachio nutshells (RPNS) [A]
Thermally treated PNS at 500 °C (TTPNS500) [B]
Air-dried Aloe vera leaves (ADAV) [C]
Thermally treated AV leaves at 500 °C (TTAV500) [D]
Multi-walled carbon nanotubes (MWCNTs) [E]
Plackett-Burman design (PBD)PSO *Freundlich4.24 [A]
76.94 [B]
3.94 [C]
7.56 [D]
482 [E]
49.75 [A]82.39% [A]
96.20% [E]
Current approach
Powdered activated carbon (PAC)Univariate analysisPSO *FreundlichND **12080–96%[20]
Molecularly imprinted polymer nanoparticles (nanoMCN@MIPs) [A]
Nonimprinted polymer nanoparticles NanoMCN@NIPs [B]
Mesoporous carbon nanoparticles MCNs [C]
Univariate analysisND **ND **126 [A]
102 [B]
622 [C]
ND **Deionized water
“>90% [A]
30-40% [B and C]”
Spiked seawater
“>90% [A]”
[22]
Polydopamine-coated graphene oxide/Fe3O4 (PDA@ GO/Fe3O4) imprinted nanoparticles coupled with magnetic separationUnivariate analysisPSO *Langmuir50.3470.9>95%[23]
Magnetized metal-organic framework (MOF) (Fe3O4/MIL-101(Fe))Response surface methodology (RSM)ND **Langmuir1624.9181.31>93%[24]
MIL-101(Cr)–SO3H a stable mesoporous MOF with polar –SO3H groups in the structureUnivariate analysisND **ND **ND **898.2ND **[25]
* PSO: Pseudo second order, ** ND: Not determined.
Table 2. An assessment of the performance of the four adsorbents obtained by upcycling of the AWs in terms of %R and qe. The experimental conditions are pH = 7.00 ± 0.20, initial drug concentration [SARA] = 40 ppm, adsorbent dose (AD) = 50 mg/15 mL, and contact time (CT) = 30 min. The obtained values of %R and qe shown were determined utilizing Equations (1) and (2).
Candidate Adsorbent%Rqe (mg/g)
Upcycled AWs
RPNS63.457.614
TTPNS5007.8710.944
ADAV29.153.498
TTAV5002.1010.252
Table 3. Assessed factors together with their upper (+1), lower (−1) and mid-levels.
Factors−10+1
pH (A, pH unit)5.07.09.0
Adsorbent Dose (AD, B, mg/15 mL)20.050.080.0
Initial Drug Concentration ([SARA], C, ppm)10.025.040.0
Contact Time (CT, D, min.)10.065.5120.0
Table 4. Experimental (measured) and predicted values of the two responses using RPNS and MWCNTs as adsorbents. Difference between experimental and predicted values is expressed as the relative error (RE).
VariablesRPNSMWCNTs
Trial NopHAD[SARA]CT%R Obs. *%R Pred. **RE ***qe Obs. *qe Pred. **RE ***%R Obs. *%R Pred. **RE ***qe Obs. *qe Pred. **RE ***
019(+)20(-)10(-)10(-)26.7024.890.071.151.090.0538.7339.660.022.052.050
029(+)20(-)40(+)10(-)21.7523.660.084.224.020.0533.5532.480.036.476.530.01
035(-)20(-)10(-)120(+)58.0456.670.023.603.470.0496.2097.190.016.596.460.02
047(0)50(0)25(0)65(0)47.2947.090.0042.362.290.0373.9770.50.053.603.590.00
059(+)80(+)40(+)10(-)41.4840.690.022.102.030.0337.1636.610.011.651.640.01
065(-)80(+)10(-)10(-)75.5179.250.051.081.000.0887.6987.790.001.101.120.02
079(+)80(+)10(-)120(+)46.2244.150.050.670.600.1261.3659.430.030.770.750.03
085(-)80(+)40(+)10(-)79.0077.040.033.993.830.0482.2683.130.013.643.550.03
097(0)50(0)25(0)65(0)49.1247.090.042.452.290.0771.9470.50.023.603.590.00
109(+)80(+)10(-)120(+)40.6044.150.080.650.600.0858.9759.430.010.740.750.01
115(-)20(-)40(+)120(+)51.7454.810.067.928.180.0394.7792.780.0219.9520.520.03
127(0)50(0)25(0)65(0)48.3547.090.032.202.290.0468.7570.50.023.613.590.01
137(0)50(0)25(0)65(0)45.1947.090.042.102.290.0870.4070.50.003.573.590.01
145(-)20(-)10(-)10(-)55.5054.570.022.332.450.0585.7585.180.014.494.450.01
157(0)50(0)25(0)65(0)46.8447.090.012.192.290.0468.3470.50.033.513.590.02
167(0)50(0)25(0)65(0)49.7247.090.052.212.290.0370.7670.50.003.543.590.01
177(0)50(0)25(0)65(0)45.7847.090.032.182.290.0572.1370.50.023.613.590.06
187(0)50(0)25(0)65(0)44.5947.090.052.192.290.0467.5970.50.043.683.590.03
195(-)80(+)40(+)120(+)82.3979.530.034.935.110.0394.6795.270.015.145.160.00
209(+)20(-)40(+)120(+)25.8525.050.035.175.320.0348.2150.340.049.649.500.01
* Obs: observed readings; ** Pred.: predicted readings; *** RE = ǀ (Measured value - Actual value)/Actual value ǀ.
Table 5. Analysis of variance (ANOVA) for the transformed responses for both adsorbents.
RPNS
Response%Rqe
SourceDF *Adj SS *Adj MS *F-ValueP-ValueDF *Adj SS *Adj MS *F-ValueP-Value
Model224.138312.0692345.400.00063.658340.609725342.190.000
Blocks 10.012660.01266110.940.000
Linear224.138312.0692345.400.00042.773540.693396075.220.000
pH117.254517.2545493.800.00010.589080.589085161.320.000
AD16.88386.8838197.010.00010.696910.696916106.100.000
[SARA] 11.952241.9522417104.890.000
CT 10.183250.183251605.590.000
Error170.03980.03981.150.300130.047480.04748416.020.000
Curvature10.59400.0349 10.001480.00011
Lack-of-Fit80.33420.04181.520.28460.000370.000060.380.868
Pure Error80.22000.0275 70.001120.00016
Total1924.7323 193.65982
MWCNTs
Response%Rqe
SourceDF *Adj SS *Adj MS *F-ValueP-ValueDF *Adj SS *Adj MS *F-ValueP-Value
Model5968610193722347.940.000511.96042.392097091.840.000
Linear4968590242147434.910.000411.91602.978998831.840.000
pH18632858632851550.520.00011.77981.779845276.690.000
AD1397639767.140.01815.71615.7161216946.620.000
[SARA]1125301253022.510.00014.00044.0004411860.150.000
CT18879988799159.490.00010.41960.419571243.890.000
Curvature120200.040.85210.04450.04448131.860.000
Error147795557 140.00470.00034
Lack-of-Fit621733620.520.78360.00260.000431.600.262
Pure Error85622703 80.00210.00027
Total19976405 1911.9652
*DF is degrees of freedom, SS is sum of squares, and MS is mean of squares.
Table 6. Raman and Brunauer-Emmett-Teller (BET) analyses of RPNS, TTPNS500, ADAV, TTAV500 and thermally treated RPAL.
ParametersRPNSTTPNS500ADAVTTAV500MWCNTs
Raman ID: IG Ratio0.610.650.240.670.11
Langmuir surface area (SA) (m2/g)4.2476.943.947.56482.01
Total pore volume (cm3/g)0.00820.00720.01120.02611.0778
Average pore radius (°A)61.789.898.680.852.8
Table 7. General and linearized equation of Langmuir, Freundlich, Temkin and Dubinin-Radushkevich isotherms, beside their parameters for the adsorption of SARA on RPNS.
IsothermEquations (Generalized/ Linearized Forms)ParametersValue
Langmuir q e = q m   K L   C e 1 K L   C e
C e q e = 1 q m   K L + C e q m
q m (mg/g)49.75
K L (L·mole−1)0.0314
R20.975
Freundlich q e = K F C e 1 n
log q e = log K F + 1 n log C e
1 n 0.651
K F (mole/g) (L/mole)1/n2.509
R20.9785
Temkin q e = R T b T   ln A T   C e
q e = R T b T ln A T + R T b T ln C e
b T (J/mole)250.045.54
A T (L/mole)0.3890.025
R20.9640.984
DR ln ( q e ) = ln q m β ϵ 2 β 1.7 × 10−81.98 × 10−9
ϵ = R T 1 + 1 C e E (kJ/mole)5.42315.891
q m (mg/g)48.046.23
E = 1 2 β R20.984
Table 8. The kinetics study results corresponding to Figure 12.
ModelsParameterValue
Pseudo-first order (PFO)
     ln q e q t = ln q e k 1 t
K1 (min−1)0.021
qe (mg/g)8.868
R20.889
Pseudo-second order (PSO)
     t q e =   1 k 2 q e 2 + 1 q e t
Where K2 is rate constant (g·mg−1·min−1)
K2 (g·mg−1·min−1)0.162
qe(mg/g)13.94
R20.999
Elovich equation is q t = 1 β ln α β + 1 β ln t is used to predict the sorption mechanism, where qt is adsorbed quantity at time t; while α and β are initial sorption concentration rate (mg·g−1·min−1), and desorption constant (g/mg), respectively.Α7.1 × 10³
Β0.392
R20.978
Weber-Morris intraparticle diffusion model is used to study the formed layers around the adsorbent and rate-controlling step, which is expressed as q t = K I t 0.5 + C , where KI is intraparticle diffusion rate constant (mg·g−1·min−0.5), and C is the boundary thickness effect. KI2.190.55
C19.0226.16
R20.9340.898
Publisher’s Note: MDPI stays neutral with regard to jurisdictional claims in published maps and institutional affiliations.

