Abstract
Excessive food consumption and insufficient exercise lead to the prevalence of metabolic syndrome in modern life, which consequently increases the risk of many chronic diseases. Magnesium lithospermate B (MLB) from Danshen has been demonstrated to improve metabolic changes in high-fat diet–fed rats with metabolic syndrome. In this study, Mg2+ in MLB was successfully replaced with Zn2+ to form zinc lithospermate B (ZLB) complex. MLB (10 mg/kg /day) and ZLB of various concentrations (1, 2.5, 5, and 10 mg/kg/day) were prepared and examined for their therapeutic effects on metabolic syndrome induced in rats fed with a high-fat diet. The results showed that both MLB and ZLB were able to recover or alleviate the abnormal physiological states of high-fat diet–fed rats including weight gain, epididymal fat accumulation, fatty liver, retarded blood lipid and glucose metabolism putatively caused by insulin resistance, and elevated levels of proinflammatory cytokine, leptin, and oxidative stress. In an overall view of the animal study, the effectiveness of ZLB supplementation seemed to be better than that of MLB supplementation for the recovery of high-fat-fed rats from metabolic syndrome.
1. Introduction
Metabolic syndrome is an emerging health problem worldwide. It is clinically defined by a group of metabolic risk determinants, including central obesity, hypertension, dyslipidemia, glucose intolerance, and insulin resistance [1,2,3,4]. Among the risk determinants, insulin resistance represents a central player in the development of metabolic syndrome [5]. Thus, an improvement of insulin sensitivity in vulnerable subjects seems to be an adequate therapeutic approach for the treatment of metabolic syndrome.
Clinical and experimental findings indicate that changes of dietary habit and lifestyle along with supplement with nutraceuticals have benefits against metabolic syndrome [2]. Increasing evidence shows that many herbal extracts and natural compounds have been implicated in the treatment of metabolic syndrome [6,7,8,9,10,11,12,13]. Particularly, Salvia miltiorrhiza (Danshen), a traditional Chinese medicine used for more than 2000 years, has been frequently prescribed to patients with cardiovascular and metabolic diseases, including diabetes [14,15,16,17,18,19,20].
Lithospermate B (LSB) is the most abundant polyphenolic compound in the soluble extracts of Danshen [18]. Its inhibitory effect on Na+,K+-ATPase is suggested to be possibly responsible for the cardiovascular effects of Danshen [21]. Natural occurring LSB, termed MLB, is a salt formed as a result of the incorporation of Mg2+ with the four oxygen atoms of the carboxyl groups originated from the four caffeic acid fragments [21]. In vitro, the binding metal, Mg2+ on LSB could be replaced with transition metals, such as Zn2+, Cr3+, Mn2+, Co2+, and Ni2+, and these transition metal–LSB complexes were found to be more effective in inhibiting Na+/K+-ATPase than LSB and MLB [22].
Previously, we reported that MLB was able to improve metabolic changes in high-fat diet–fed rats with metabolic syndrome [23]. In this study, we aimed to develop a metal complex with LSB for the potential treatment of metabolic syndrome better than MLB. In light of the safety concern for oral administration with transition metals, zinc ion, an important trace element for human health, was used to complex with LSB. To test its relative efficacy, Zn–LSB complexes (ZLB) of various concentrations as well as MLB were prepared and subjected to the evaluation of therapeutic effects on metabolic syndrome in a rat model induced by high-fat diet (HFD).
2. Results
2.1. Preparation and Identification of LSB Complexed with Mg2+ or Zn2+
Mg-LSB (MLB) and Zn-LSB (ZLB) were prepared by incorporating LSB with Mg2+ and Zn2+, respectively. To confirm the success of incorporation, LSB, MLB, and ZLB were subjected to HPLC/UV and MS analyses (Figure 1). LSB and MLB were identified by comparing with the HPLC/UV profiles and MS data published previously [24,25]. ZLB was identified by comparing its fragmentation pattern, m/z 780 → 736 (673 − 2 + 65) with the MLB fragmentation pattern, m/z 739 → 695 (673 − 2 + 24). MLB and ZLB of high purity as detected in the HPLC/UV chromatograms were used in the following animal study.
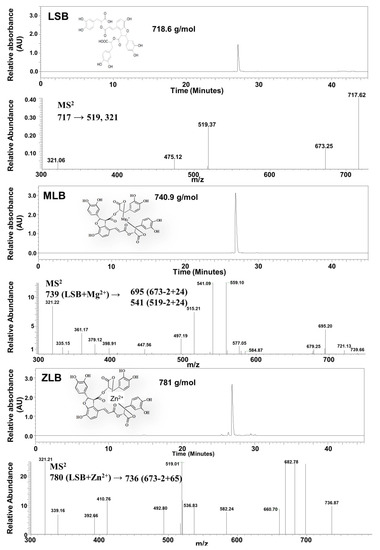
Figure 1.
Identification of magnesium lithospermate B (MLB) and zinc lithospermate B (ZLB) by HPLC and LC−MS. Lithospermate B (LSB), MLB, and ZLB were detected by HPLC spectrum at 280 nm and confirmed by mass spectrometric analyses on the basis of fragmentation patterns of LSB published previously [24,25].
2.2. Effects of MLB and ZLB on Appetite and Weight Gain of Rats
In the duration of 30 days, the food intake of rats fed with an HFD was found to be higher than that of rats fed with normal diet regardless of whether MLB or ZLB was supplemented daily (Figure 2). Apparently, supplementation of MLB or ZLB to rats did not upset their appetite. Correspondingly, the body weights of rats fed with an HFD were detected to increase steadily in comparison with those of rats fed with normal diet (Table 1). The increase of body weight in rats fed with an HFD was substantially reduced when MLB or ZLB was supplemented. The reduction in body weight gain by ZLB supplementation was found to be dose dependent in the concentration ranging from 1 to 10 mg/kg BW/day.
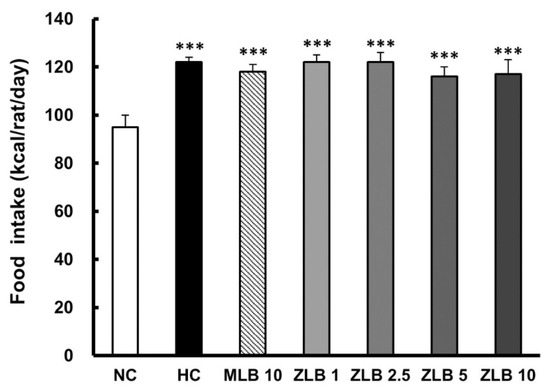
Figure 2.
Effects of MLB and ZLB on appetite and weight gain. Food intake was recorded for a month. NC, normal diet control; HC, high-fat-diet (HFD) control; MLB10, HFD with 10 mg/kg/day of MLB; ZLB1, ZLB2.5, ZLB5, and ZLB10, HFD with 1, 2.5, 5, and 10 mg/kg/day of ZLB. Values are expressed as mean ± SD (n = 6 per group). ***P < 0.001 vs. NC group.

Table 1.
Effects of MLB and ZLB on weight gain (g) in rats fed a normal diet or a high-fat diet for 4 weeks.
2.3. Effects of MLB and ZLB on Epididymal Fat and Liver Injury
The weight of epididymal fat of rats fed with an HFD was found to be significantly higher than that of rats fed with normal diet (Figure 3A). The upsurge of epididymal fat in rats fed with an HFD was substantially abridged when MLB or ZLB was supplemented, and the abridgement of epididymal fat by ZLB supplementation was observed to be dose dependent. As expected, the adipocytes in the epididymal fat of rats fed with an HFD were enlarged in comparison with those of rats fed with a normal diet, and the enlarged adipocytes became smaller by the supplementation of MLB or ZLB dose dependently (Figure 3B).
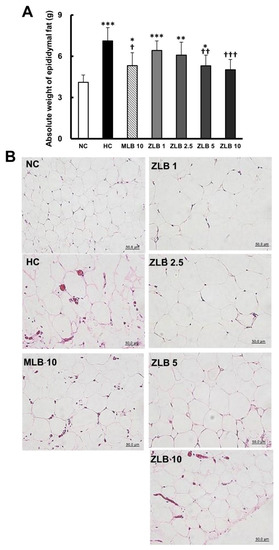
Figure 3.
Effects of MLB and ZLB on epididymal fat. The rats were sacrificed at the end of the experiment (a month). Weight of the epididymal fat was measured (A), and representative photomicrographs of epididymal fat tissues are shown at a magnification of ×400 (B). NC, normal diet control; HC, high-fat-diet (HFD) control; MLB10, HFD with 10 mg/kg/day of MLB; ZLB1, ZLB2.5, ZLB5, and ZLB10, HFD with 1, 2.5, 5, and 10 mg/kg/day of ZLB. Values are expressed as mean ± SD (n = 6 per group). *P < 0.05, **P < 0.01, and ***P < 0.001 vs. NC group; †P < 0.05, ††P < 0.01, and †††P < 0.001 vs. HC group.
The weight of the liver of rats fed with an HFD was found to be significantly higher than that of rats fed with normal diet; however, the upsurge in liver weight could be partially reduced when MLB or ZLB was supplemented (Figure 4A). Morphological examination of the liver showed that substantial fat was deposed in the hepatocytes of rats fed with an HFD, and the abnormal hepatocytes became larger and their color turned from red to white (Figure 4B). The size and color of hepatocytes of rats fed with an HFD could be substantially recovered by the supplementation of MLB or ZLB. The levels of hepatic cholesterol (Figure 4C) and triacylglycerol (Figure 4D) of rats fed with an HFD were significantly elevated when compared with those of rats fed with normal diet, and the elevated levels were dose-dependently diminished by the supplementation of ZLB. Meanwhile, the levels of aspartate transaminase (AST) and alanine transaminase (ALT) in plasma of HFD-fed rats were detected to be higher than those of normal rats, and MLB or ZLB supplementation seemed to significantly reduce these two levels of enzymatic activities back to the control levels of normal rats (Table 2).
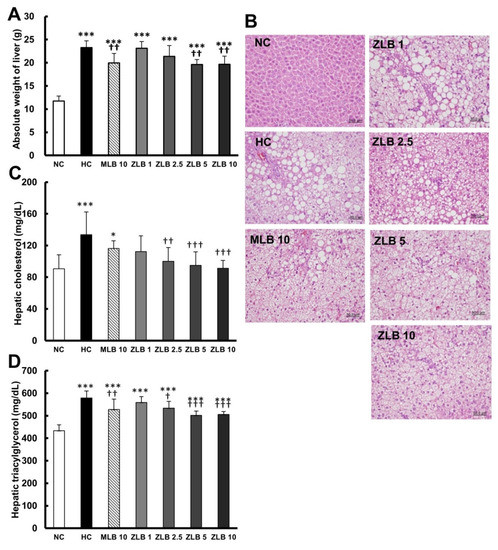
Figure 4.
Effects of MLB and ZLB on lipid deposition in the liver. Weight of the liver was measured (A), and representative photomicrographs of liver tissues are shown at a magnification of ×400 (B). The levels of cholesterol (C) and triacylglycerol (D) in the liver tissues were measured. NC, normal diet control; HC, high-fat-diet (HFD) control; MLB10, HFD with 10 mg/kg/day of MLB; ZLB1, ZLB2.5, ZLB5, and ZLB10, HFD with 1, 2.5, 5, and 10 mg/kg/day of ZLB. Values are expressed as mean ± SD (n = 6 per group). *P < 0.05, ***P < 0.001 vs. NC group; †P < 0.05, ††P < 0.01, and †††P < 0.001 vs. HC group.
Table 2.
Effects of ZLB on biochemical parameters in rats fed a normal diet or a high-fat diet for 4 weeks.
2.4. Effects on Kidney Indices and Lipid Metabolism
To understand the safety of ZLB, two kidney indices, blood urea nitrogen (BUN) and creatinine were detected; and the data showed that these two indices were not significantly affected in rat blood regardless of the supplementation of MLB or ZLB (Table 2). The levels of total cholesterol, triacylglycerol, and non-HDL-cholesterol in the plasma of HFD-fed rats were detected to be significantly raised in comparison with those of normal rats. The raised levels of these three lipid contents were mostly adjusted back to normal levels by the supplementation of MLB or ZLB. In contrast, the plasma HDL level of HFD-fed rats was obviously lowered compared to that of normal rats, and the low HDL level could be rescued back to the normal level by the supplementation of MLB or ZLB.
2.5. Effects on Glucose Metabolism
To examine glucose tolerance in rats, glycemia stabilization was detected at the end of the third week. A relatively slow rate of glycemia stabilization was observed in rats fed with an HFD in comparison with rats fed with normal diet (Table 3 and Figure 5A). The rate of glycemia stabilization in HFD-fed rats could be dose-dependently enhanced by ZLB supplementation. Fasting glucose and serum insulin were detected at the end of the fourth week. The results showed that both fasting glucose and serum insulin in HFD-fed rats were found to be higher than those in normal rats, and the higher levels of fasting glucose and serum insulin could be reduced by the supplementation of MLB or ZLB (Figure 5B,C). Furthermore, the level of homeostatic model assessment for insulin resistance (HOMA-IR) in HFD-fed rats was significantly higher than that in normal rats (Figure 5D), indicating HFD-fed rats were prediabetic and insulin resistance. However, the high level of HOMA-IR was significantly decreased by the supplementation of MLB or ZLB.
Table 3.
Effects of MLB and ZLB on the glucose tolerance the levels of blood glucose were measured every 30 min for 2 h three weeks after administration of MLB or ZLB.
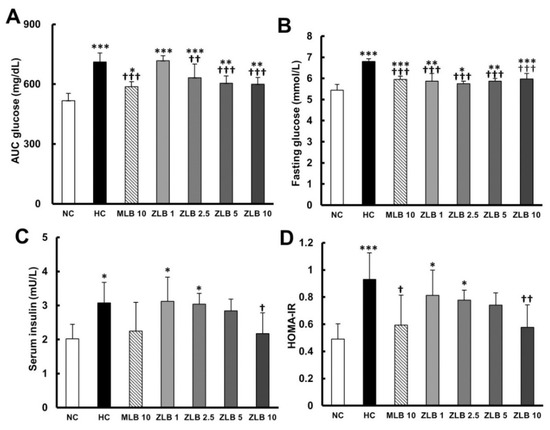
Figure 5.
Effects of MLB and ZLB on glucose metabolism. The glucose tolerance test was carried out three weeks after administration of MLB or ZLB. The levels of blood glucose were measured every 30 min for 2 h, and the area under the curve (AUC) of the blood glucose curve is depicted (A). The levels of fasting blood glucose (B) and insulin (C) were measured at the end of the experiment (4 weeks). The homeostatic model assessment for insulin resistance (HOMA-IR) data were calculated and depicted (D). NC, normal diet control; HC, high-fat-diet (HFD) control; MLB10, HFD with 10 mg/kg/day of MLB; ZLB1, ZLB2.5, ZLB5, and ZLB10, HFD with 1, 2.5, 5, and 10 mg/kg/day of ZLB. Values are expressed as mean ± SD (n = 6 per group). *P < 0.05, **P < 0.01, and ***P < 0.001 vs. NC group; †P < 0.05, ††P < 0.01, and †††P < 0.001 vs. HC group.
2.6. Effects on Intracellular Signaling in Lipid and Glucose Metabolism
To examine the intracellular signal transduction of lipid and glucose metabolism affected by insulin, marker proteins in liver tissues were detected by Western blotting (Figure 6A). The results showed that protein expression levels of SREBP1c and CD36 (regulating fatty acid lipid metabolism) were enhanced in liver tissues of HFD-fed rats in comparison with those of normal rats, and the enhanced levels could be diminished by the supplementation of MLB or ZLB dose dependently (Figure 6B,C). The protein expression levels of IRS-1 and PI3-k p85α transmitting signals for insulin) declined in liver tissues of HFD-fed rats in comparison with those of normal rats, and the declined levels could be rescued by the supplementation of MLB or ZLB dose dependently (Figure 6D,E).
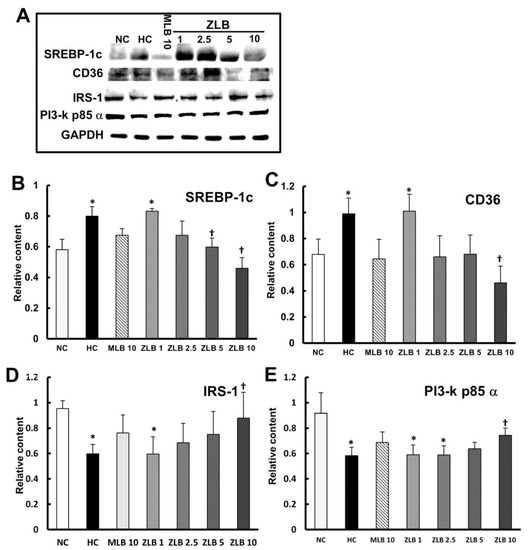
Figure 6.
Effects of MLB and ZLB on intracellular signaling in metabolism. Marker proteins for liver lipid and glucose metabolism were detected by Western blotting (A). GAPDH was used as an internal standard. The blots of SREBP1c (B), CD36 (C), IRS-1 (D), and PI3-kp85α (E) are calculated and shown in the bar chart. NC, normal diet control; HC, high-fat-diet (HFD) control; MLB10, HFD with 10 mg/kg/day of MLB; ZLB1, ZLB2.5, ZLB5, and ZLB10, HFD with 1, 2.5, 5, and 10 mg/kg/day of ZLB. Values are expressed as mean ± SD (n = 6 per group). *P < 0.05 vs. NC group and †P < 0.05 vs. HC group.
2.7. Effects on Proinflammatory and Oxidative Stress
Chronic inflammation is a crucial index in metabolic syndromes. As expected, the plasma levels of tumor necrosis factor α (TNFα) and leptin that were elevated in HFD-fed rats compared with those of normal rats (Table 2) in accord with a previous study showing that obesity and insulin resistance would increase the plasma level of proinflammatory cytokines and adipokines [26]. Similarly, the elevated levels of TNFα and leptin in HFD-fed rats were significantly reduced by the supplementation of MLB or ZLB.
Thiobarbituric acid reactive substances (TBARS), byproducts of lipid peroxidation, are indicators of oxidative stress. In this study, malondialdehyde (MDA), a byproduct of lipid peroxidation, was measured as an indicator of oxidative stress. The results showed that the level of oxidative stress in rats fed with an HFD for a month was significantly higher than that in rats fed with normal diet, and the higher level of oxidative stress was alleviated by the supplementation of MLB or ZLB (Figure 7).
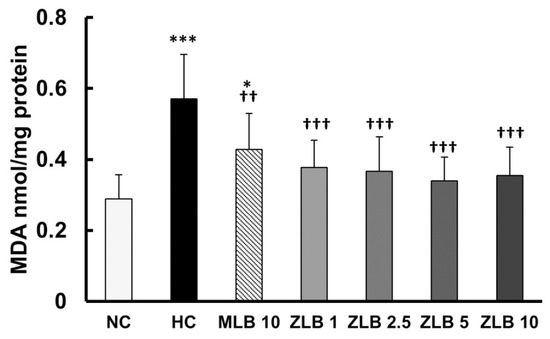
Figure 7.
Effects of MLB and ZLB on oxidation stress. Malondialdehyde (MDA), a byproduct of lipid peroxidation, was measured by a thiobarbituric acid reactive substances (TBARS) assay as an indicator of oxidative stress. NC, normal diet control; HC, high-fat-diet (HFD) control; MLB10, HFD with 10 mg/kg/day of MLB; ZLB1, ZLB2.5, ZLB5, and ZLB10, HFD with 1, 2.5, 5, and 10 mg/kg/day of ZLB. Values are expressed as mean ± SD (n = 6 per group). *P < 0.05 and ***P < 0.001 vs. NC group; ††P < 0.01 and †††P < 0.001 vs. HC group.
2.8. Zinc Concentration
The rat serum samples were subjected to the analysis of zinc concentration. The results showed that Zn2+ level decreased in the HFD group compared with the control group. After ZLB administration, the Zn2+ level was elevated dose dependently, particularly, ZLB 5 and ZLB 10 groups showed significant elevation in serum Zn2+ concentration (Figure 8).
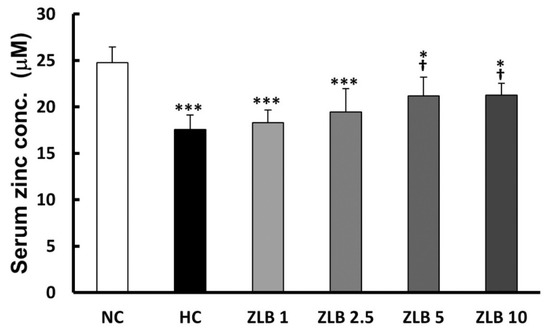
Figure 8.
Serum Zn2+ concentration after ZLB administration. The serum Zn2+ concentration was measured by a zinc colorimetric assay kit. NC, normal diet control; HC, high-fat-diet (HFD) control; ZLB1, ZLB2.5, ZLB5, and ZLB10, HFD with 1, 2.5, 5, and 10 mg/kg/day of ZLB. Values are expressed as mean ± SD (n = 6 per group). *P < 0.05 and ***P < 0.001 vs. NC group; †P < 0.05 vs. HC group.
3. Discussion
In this study, obesity, hyperglycemia, hyperlipidemia, insulin resistance, and hepatic steatosis were induced in rats by feeding an HFD for a month. These abnormal physiological states were significantly relieved by the supplementation of MLB or ZLB dose dependently. In an overall view of the animal study, the effectiveness of ZLB supplementation seemed to be better than that of MLB supplementation for the recovery from metabolic syndrome. The pharmacological effects of MLB or ZLB were presumably attributable to the enhancement of lipid and glucose metabolism as well as the improvement of insulin sensitivity. Insulin resistance is regarded as a primary causative factor and pathophysiological basis of metabolic syndrome; and it has been demonstrated that increasing insulin sensitivity could significantly alleviate those diseases associated with metabolic syndromes [27]. The findings suggest that ZLB as well as MLB may be an alternative nutraceutical with beneficial effects against metabolic syndrome. Of course, more investigation should be executed before their clinical applications.
Metabolic syndrome is associated with a cluster of pathological conditions, such as low-grade chronic inflammation and oxidation states [28,29]. Polyphenolic compounds, the most widely distributed secondary metabolites in plants, show biological activities in the alleviation of the chronic inflammation and oxidation states [30]. Curcumin and resveratrol are two well-known polyphenolic compounds displaying anti-oxidant and anti-inflammatory activity resulting in the improvement of metabolic syndrome [31,32]. LSB is a derivative of a caffeic acid tetramer, showing anti-oxidative and free-radical scavenging activities [33,34,35,36,37,38,39]. Thus, the LSB backbone of the ZLB and MLB is assumed to be the central player for protecting from metabolic syndrome. Because of the low bioavailability of LSB [24,39,40,41], its effect alone against metabolic syndrome was not investigated in this study. Alternatively, the beneficial effects of ZLB and MLB may come from the increase of their bioavailability. Since their dynamic bioavailability was not measured, this assumption requires further investigation.
There were interesting findings in the current study. It appeared that ZLB and MLB shared comparable protection against metabolic syndrome. Other than the LSB backbone, zinc and magnesium are the candidates for the discrepancy between ZLB and MLB. Zinc is known in balancing the oxidant/anti-oxidant system and also in improving insulin resistance [42]. Furthermore, zinc and magnesium have direct and indirect effects on the secretion and signal transduction of insulin and in the development of insulin resistance [43,44]. Possibly, the complexed zinc or magnesium ion might be released from ZLB or MLB after intravenous injection into the rodents. Therefore, the protective effects of ZLB or MLB may be secondary to the dissociation reaction of salt–LSB complexes. However, this hypothesis was not addressed in the current study.
Danshen is an essential and reliable herb or food for health promotion [17]. Other than polysaccharides and tanshinones, using an HFD rat model, our findings further provide evidence showing that the polyphenolic compounds, ZLB and MLB, represent alternative ingredients of Danshen in the protection against metabolic syndrome. Although there is still a lack of a fully mechanistic exploration, current findings suggest that the LSB backbone and zinc/magnesium ion may be mediators of the protection. Moreover, the bioavailability of the salt form of LSB complexes is another concern. Despite the encouraging findings of ZLB and MLB against metabolic syndrome, the detailed underlying mechanisms warrant further investigation.
4. Materials and Methods
4.1. Preparation of LSB Complexed with Mg2+ and Zn2+
LSB was purchased from KO DA Pharmaceutical Co., Ltd. (Taoyuan, Taiwan). Mg-LSB (MLB) or Zn-LSB (ZLB) complex was prepared by incorporating LSB with Mg2+ or Zn2+ according to the protocol developed previously [22]. Briefly, LSB was dissolved in 1 mL of H2O to a final concentration of 10 mM, and then mixed with 10 mM of Mg(OH)2 or Zn(OH)2 to form MLB or ZLB. MLB and ZLB were dried by lyophilization and stored at 4 °C. Prior to utilization in the following studies, MLB and ZLB were dissolved in H2O to desired concentrations.
4.2. HPLC/UV and LC−MSn Analyses of LSB, MLB, and ZLB
Solutions of LSB, MLB, and ZLB were filtered through a 0.22 μm polyvinylidene difluoride (PVDF) membrane filter (Pall Corporation, Glen Cove, NY, USA) and subjected to HPLC analysis. The HPLC system coupled to a model 600E photodiode array detector (Waters Corporation, Milford, MA, USA) was performed using a Syncronis C18 column (4.6 × 250 mm inner diameter, 5 µm, Thermo Scientific, Waltham, MA, USA) with an eluting gradient as follows: 5% acetonitrile for 0–5 min; linear gradient from 5% to 70% acetonitrile for 5–35 min; 70% acetonitrile for 35–45 min. The acetonitrile solution used in the eluting gradient contained 0.5% acetic acid. The ultraviolet (UV) absorbance was detected at 280 nm. Mass spectrometric analysis was performed on a linear trap quadrupole tandem mass spectrometer (Thermo Electron, San Jose, CA, USA) equipped with an electrospray ionization interface and connected to a Surveyor LC system (Thermo Electron, Waltham, MA, USA) with a 5 μL sample loop. The analytes were separated under the same condition used for HPLC analysis. Negative ESI mode was firstly scanned ranging from m/z 150 to 1500. The other scans were set as the data-dependent MSn scan using the high-purity helium (>99.99%) as the collision gas and the relative collision energy of 30%.
4.3. Animal and Drug Administration
Male Sprague–Dawley rats of weight 150–170 g were obtained from BioLASCO, Taiwan Co., Ltd. (Taipei, Taiwan) and adapted for 1 week before experiments. Animals were kept in a standard, controlled room of 23 ± 2 °C, 60% ± 10% humidity, and 12 h light/dark cycle and fed with a standard chow diet (calories provided by 28.5% protein, 13.5% fat, and 58% carbohydrate, 5001 Rodent LabDiet, St. Louis, MO, USA) or a high-fat diet (HFD, calories provided by 16% protein, 39.4% fat, and 44.6% carbohydrate, high-fat 5S8X Rodent TestDiet, St. Louis, MO, USA) for a month. Animals were randomly divided into seven groups (n = 6 per group): (1) NC group (fed with standard chow diet); (2) HC group (fed with an HFD); (3) MLB 10 group (fed with an HFD and administered with 10 mg/kg BW/day of MLB; (4) ZLB 1 group (fed with an HFD and administered with 1 mg/kg BW/day of ZLB); (5) ZLB 2.5 group (fed with an HFD and administered with 2.5 mg/kg BW/day of ZLB); (6) ZLB 5 group (fed with an HFD and administered with 5 mg/kg BW/day of ZLB); (7) ZLB 10 group (fed with an HFD and administered with 10 mg/kg BW/day of ZLB). The animal experiments were approved by the Institutional Animal Care and Use Committee of the National Chung−Hsing University with the IACUC Approval Number: 103-31.
4.4. Intraperitoneal Glucose Tolerance Test and Homeostatic Model Assessment Index
Intraperitoneal glucose tolerance test (IPGTT) was carried out three weeks after MLB or ZLB administration. After fasting for 12 h, rats were treated with glucose solution 2 g/kg BW via intraperitoneal injection. The glycemia was examined by using the ACCU-CHEK® active glucose meter with test strips (Roche, Mannheim, Germany) at 0, 30, 60, 90, and 120 min. The area under the curve (AUC) of the glycemia level was calculated for glucose tolerance. Insulin resistance was observed from fasting glucose and insulin level by calculating via the homeostatic model assessment for insulin resistance (HOMA-IR) index formula. HOMA-IR = fasting insulin (FPI: mU/L) × fasting glucose (FPG: mmol/L)/22.5 [45].
4.5. Liver Lipid Extraction and Measurement
Liver lipids were extracted by following the protocol developed previously [46]. Liver tissues were homogenized in 0.15 M NaCl (Sigma-Aldrich, St. Louis, MO, USA), and the tissue pulps were mixed with chloroform/methanol (2:1, v/v) (Sigma-Aldrich). After centrifugation at 400× g for 5 min, the supernatants containing liver lipids were collected. Immediately, the supernatants were measured with an enzymatic colorimetric assay (Human Gesellschaft für Biochemica und Diagnostica mbH, Wiesbaden, Germany) to examine the levels of hepatic cholesterol and triacylglycerol.
4.6. Analysis of Blood Biochemistry
After MLB or ZLB administration for four weeks, the rats were fasted overnight and sacrificed. Whole-blood samples were collected to analyze blood biochemistry. The levels of aspartate transaminase (AST), alanine transaminase (ALT), blood urine nitrogen (BUN), creatinine, total cholesterol (TC), triacylglycerol (TAG), high-density lipoprotein cholesterol (HDL-C), and non-HDL-C were analyzed by automated standardized procedures (Hitachi 717). The levels of insulin (Mercodia AB, Uppsala, Sweden), tumor necrosis factor-α (TNF-α), and leptin (Quantikine R&D Systems, Minneapolis, MN, USA) were measured by rat enzyme-linked immunosorbent assay (ELISA) kits.
4.7. Histological Examination
The epididymal fat and liver were removed from rats and collected for further examination. These tissue specimens were fixed in 10% formalin solution and embedded in paraffin. Then the tissue specimens were stained with hematoxylin and eosin (H&E). Histological images were taken by a digital camera (Cannon EOS 600D, Tokyo, Japan) under a light microscope (Olympus, BX43, Tokyo, Japan).
4.8. Tissue Preparation and Western Blot Analysis
After the rats were scarified, the gastrocnemius muscle and liver were quickly frozen in liquid nitrogen, and stored at −80 °C. The tissues were homogenized with the T-PER™ tissue protein extraction buffer (Pierce Biotechnology, Thermo-Fisher, Rockford, IL, USA) containing 1% protease inhibitor cocktail and 1% phosphatase inhibitor cocktail (Calbiochem, Merck Millipore, Darmstadt, Germany). The protein samples in the supernatants were collected after centrifugation at 15,000× g at 4 °C for 10 min, and analyzed by Western blotting with primary antibodies detecting IRS-1 (1:1000, GeneTex, San Antonio, TX, USA), PI3-k p85 α (1:1000; Cell Signaling Technology, Beverly, MA, USA), SREBP1c, CD36 (1:1000; Novus Biologicals, Littleton, CO, USA), and Glyceraldehyde 3-phosphate dehydrogenase (GAPDH, 1:20,000; Merck Millipore), and then detected with secondary antibodies (anti-rabbit or anti-mouse IgG HRP-conjugated). The blots were quantified by chemiluminescence with MiniChemi I system (Beijing Sage Creation Science, Beijing, China), and then normalizing with GAPDH. The relative protein intensity was expressed as folds of the content in the NC group.
4.9. Thiobarbituric Acid Reactive Substances Assay
A part of the frozen liver tissue was homogenized in PBS at a concentration of 50 mg/mL, and the supernatant was measured by the thiobarbituric acid reactive substances (TBARS) assay kit (BioAssay System, Hayward, CA, USA) to detect the level of malondialdehyde (MDA) generated from lipid hydroperoxide as an indicator of lipid peroxidation. To normalize the MDA level, total-protein contents in the samples were measured by a protein assay reagent (Bio-Rad, Hercules, CA, USA).
4.10. Zinc Concentraction Assay
The Zn2+ level of the serum was assayed with a zinc colorimetric assay kit (BioVision, Milpitas, CA, USA). The serum samples were deproteinized by 7% trichloroacetic acid (TCA) solution with a 1:1 ratio (serum: 7% TCA). The supernatants were mixed with zinc-detection reagents and subsequently detected at 560 nm.
4.11. Statistical Analysis
The data were presented as mean values ± standard deviation (SD). The differences were analyzed by one-way analysis of variance (ANOVA) followed by Duncan’s post-hoc testing. Statistical calculations were performed by SigmaStat (version 3.5). A level of p < 0.05 was considered to be statistically significant.
5. Conclusions
Previously, MLB was demonstrated to improve metabolic changes in high-fat diet–fed rats with metabolic syndrome. In this study, we replaced Mg2+ in MLB with Zn2+ to form the ZLB complex. The therapeutic effects of ZLB supplementation were shown to be better than those of MLB supplementation for the recovery of high-fat-fed rats from metabolic syndrome. It seems that ZLB possesses a great potential to be developed as a beneficial supplement for patients suffering from metabolic syndrome.
Author Contributions
Animal experiments: S.-K.H., Y.-J.C., and W.-Y.C.; preparation and identification: S.-K.H., N.-H.L., and M.-R.L.; data analysis: N.-H.L. and W.-Y.C; project design and writing: S.-K.H., W.-Y.C., and J.T.C.T. All authors have read and agreed to the published version of the manuscript.
Funding
The work was supported by a grant to JTC Tzen of National Chung-Hsing University (NCHU-102D604).
Conflicts of Interest
All authors declare no conflicts of interest.
References
- Grundy, S.M.; Brewer, H.B.J.; Cleeman, J.I.; Smith, S.C.J.; Lenfant, C. National Lung, Heart, and Blood Institute; Association American Heart. Definition of Metabolic Syndrome: Report of the National Heart, Lung, and Blood Institute/American Heart Association Conference on Scientific Issues Related to Definition. Arterioscl. Throm. Vas. 2004, 24, e13–e18. [Google Scholar]
- Moore, J.X.; Chaudhary, N.; Akinyemiju, T. Metabolic Syndrome Prevalence by Race/Ethnicity and Sex in the United States, National Health and Nutrition Examination Survey, 1988–2012. Prev. Chronic. Dis. 2017, 14, E24. [Google Scholar] [CrossRef] [PubMed]
- Expert Panel on Detection, Evaluation, and Treatment of High Blood Cholesterol in Adults. Executive Summary of the Third Report of the National Cholesterol Education Program (NCEP) Expert Panel on Detection, Evaluation, and Treatment of High Blood Cholesterol in Adults (Adult Treatment Panel III). JAMA 2001, 285, 2486–2497. [Google Scholar] [CrossRef] [PubMed]
- Silva Figueiredo, P.; Inada, A.C.; Ribeiro Fernandes, M.; Granja Arakaki, D.; Freitas, K.C.; Avellaneda Guimarães, R.C.; Aragão do Nascimento, V.; Aiko Hiane, P. An Overview of Novel Dietary Supplements and Food Ingredients in Patients with Metabolic Syndrome and Non-Alcoholic Fatty Liver Disease. Molecules 2018, 23, 877. [Google Scholar] [CrossRef] [PubMed]
- Mottillo, S.; Filion, K.B.; Genest, J.; Joseph, L.; Pilote, L.; Poirier, P.; Rinfret, S.; Schiffrin, E.L.; Eisenberg, M.J. The Metabolic Syndrome and Cardiovascular Risk a Systematic Review and Meta-Analysis. J. Am. Coll. Cardiol. 2010, 56, 1113–1132. [Google Scholar] [CrossRef]
- Giglio, R.V.; Patti, A.M.; Nikolic, D.; Li Volti, G.; Al-Rasadi, K.; Katsiki, N.; Mikhailidis, D.P.; Montalto, G.; Ivanova, E.; Orekhov, A.N.; et al. The Effect of Bergamot on Dyslipidemia. Phytomedicine 2016, 23, 1175–1181. [Google Scholar] [CrossRef]
- Wang, A.; Wang, C.Z.; Wu, J.A.; Osinski, J.; Yuan, C.S. Determination of Major Ginsenosides in Panax Quinquefolius (American Ginseng) Using High-Performance Liquid Chromatography. Phytochem. Anal. 2005, 16, 272–277. [Google Scholar] [CrossRef]
- Yin, J.; Zhang, H.; Ye, J. Traditional Chinese Medicine in Treatment of Metabolic Syndrome. Endocr. Metab. Immune 2008, 8, 99–111. [Google Scholar] [CrossRef]
- Basu, A.; Sanchez, K.; Leyva, M.J.; Wu, M.; Betts, N.M.; Aston, C.E.; Lyons, T.J. Green Tea Supplementation Affects Body Weight, Lipids, and Lipid Peroxidation in Obese Subjects with Metabolic Syndrome. J. Am. Coll. Nutr. 2010, 29, 31–40. [Google Scholar] [CrossRef]
- Sicinska, P.; Pytel, E.; Macczak, A.; Koter-Michalak, M. The Use of Various Diet Supplements in Metabolic Syndrome. Postep. Hig. Med. Dosw. 2015, 69, 25–33. [Google Scholar] [CrossRef]
- Miura, T.; Itoh, C.; Iwamoto, N.; Kato, M.; Kawai, M.; Park, S.R.; Suzuki, I. Hypoglycemic Activity of the Fruit of the Momordica Charantia in Type 2 Diabetic Mice. J. Nutr. Sci. Vitaminol. 2001, 47, 340–344. [Google Scholar] [CrossRef] [PubMed]
- Pandey, K.B.; Rizvi, S.I. Plant Polyphenols as Dietary Antioxidants in Human Health and Disease. Oxid. Med. Cell. Longev. 2009, 2, 270–278. [Google Scholar] [CrossRef] [PubMed]
- Ooi, E.M.; Watts, G.F.; Ng, T.W.; Barrett, P.H. Effect of Dietary Fatty Acids on Human Lipoprotein Metabolism: A Comprehensive Update. Nutrients 2015, 7, 4416–4425. [Google Scholar] [CrossRef] [PubMed]
- Tan, Y.; Lao, W.; Xiao, L.; Wang, Z.; Xiao, W.; Kamal, M.A.; Seale, J.P.; Qu, X. Managing the Combination of Nonalcoholic Fatty Liver Disease and Metabolic Syndrome with Chinese Herbal Extracts in High-Fat-Diet Fed Rats. Evid. Based Compl. Alt. Med. 2013, 2013, 306738. [Google Scholar] [CrossRef]
- Hu, X.; Wang, M.; Bei, W.; Han, Z.; Guo, J. The Chinese Herbal Medicine FTZ Attenuates Insulin Resistance Via IRS1 and PI3K in Vitro and in Rats with Metabolic Syndrome. J. Transl. Med. 2014, 12, 47. [Google Scholar] [CrossRef]
- Tan, Y.; Kamal, M.A.; Wang, Z.Z.; Xiao, W.; Seale, J.P.; Qu, X. Chinese Herbal Extracts (SK0506) as a Potential Candidate for the Therapy of the Metabolic Syndrome. Clin. Sci. 2011, 120, 297–305. [Google Scholar] [CrossRef]
- Wang, L.; Ma, R.; Liu, C.; Liu, H.; Zhu, R.; Guo, S.; Tang, M.; Li, Y.; Niu, J.; Fu, M.; et al. Salvia Miltiorrhiza: A Potential Red Light to the Development of Cardiovascular Diseases. Curr. Pharm. Des. 2017, 23, 1077–1097. [Google Scholar] [CrossRef]
- Huang, M.; Xie, Y.; Chen, L.; Chu, K.; Wu, S.; Lu, J.; Chen, X.; Wang, Y.; Lai, X. Antidiabetic Effect of the Total Polyphenolic Acids Fraction from Salvia Miltiorrhiza Bunge in Diabetic Rats. Phytother. Res. 2012, 26, 944–948. [Google Scholar] [CrossRef]
- Zhang, W.; Zheng, L.; Zhang, Z.; Hai, C.X. Protective Effect of a Water-Soluble Polysaccharide from Salvia Miltiorrhiza Bunge on Insulin Resistance in Rats. Carbohydr. Polym. 2012, 89, 890–898. [Google Scholar] [CrossRef]
- Jiang, R.W.; Lau, K.M.; Hon, P.M.; Mak, T.C.; Woo, K.S.; Fung, K.P. Chemistry and Biological Activities of Caffeic Acid Derivatives from Salvia Miltiorrhiza. Curr. Med. Chem. 2005, 12, 237–246. [Google Scholar] [CrossRef]
- Tzen, J.T.; Jinn, T.R.; Chen, Y.C.; Li, F.Y.; Cheng, F.C.; Shi, L.S.; She, H.K.h.; Chen, B.C.; Hsieh, V.; Tu, M.L. Magnesium Lithospermate B Possesses Inhibitory Activity on Na+,K+-ATPase and Neuroprotective Effects against Ischemic Stroke. Acta Pharmacol. Sin. 2007, 28, 609–615. [Google Scholar] [CrossRef] [PubMed]
- Lin, N.H.; Chung, T.Y.; Li, F.Y.; Chen, H.A.; Tzen, J.T. Enhancing the Potency of Lithospermate B for Inhibiting Na+/K+-ATPase Activity by Forming Transition Metal Ion Complexes. Acta Pharmacol. Sin. 2013, 34, 893–900. [Google Scholar] [CrossRef] [PubMed]
- Chen, Y.J.; Lo, Y.H.; Chen, Y.T.; Lai, N.W.; Lin, N.H.; Chung, T.Y.; Chen, W.Y.; Tzen, J.T.C. Magnesium Lithospermate B Improves Metabolic Changes in High-Fat Diet-Fed Rats with Metabolic Syndrome. J. Funct. Foods 2015, 14, 163–173. [Google Scholar] [CrossRef]
- Chung, T.Y.; Lin, N.H.; Li, Y.C.; Chen, T.Y.; Kuo, P.C.; Chen, W.Y.; Tzen, J.T.C. Detection of Lithospermate B in Rat Plasma at the Nanogram Level by LC/MS in Multi Reaction Monitoring Mode. J. Food Drug Anal. 2018, 26, 353–361. [Google Scholar] [CrossRef] [PubMed]
- Li, X.; Yu, C.; Sun, W.; Lu, J.; Xuan, L.; Wang, Y. Liquid Chromatography/Tandem Mass Spectrometry for the Determination of Magnesium Lithospermate B in Beagle Dog Serum. J. Pharm. Biomed Anal. 2005, 38, 107–111. [Google Scholar] [CrossRef] [PubMed]
- Filková, M.; Haluzík, M.; Gay, S.; Šenolt, L. The Role of Resistin as a Regulator of Inflammation: Implications for Various Human Pathologies. J. Clin. Immunol. 2009, 133, 157–170. [Google Scholar] [CrossRef]
- Moller, D.E. New Drug Targets for Type 2 Diabetes and the Metabolic Syndrome. Nature 2001, 414, 821–827. [Google Scholar] [CrossRef]
- Chiva-Blanch, G.; Badimon, L. Effects of Polyphenol Intake on Metabolic Syndrome: Current Evidences from Human Trials. Oxid. Med. Cell. Longev. 2017, 2017, 5812401. [Google Scholar] [CrossRef]
- Fuentes, E.; Fuentes, F.; Vilahur, G.; Badimon, L.; Palomo, I. Mechanisms of Chronic State of Inflammation as Mediators That Link Obese Adipose Tissue and Metabolic Syndrome. Mediators. Inflamm. 2013, 2013, 136584. [Google Scholar] [CrossRef]
- Patti, A.M.; Al-Rasadi, K.; Giglio, R.V.; Nikolic, D.; Mannina, C.; Castellino, G.; Chianetta, R.; Banach, M.; Cicero, A.F.G.; Lippi, G.; et al. Natural Approaches in Metabolic Syndrome Management. Arch. Med. Sci. 2018, 14, 422–441. [Google Scholar] [CrossRef]
- Tariq, S.; Imran, M.; Mushtaq, Z.; Asghar, N. Phytopreventive Antihypercholesterolmic and Antilipidemic Perspectives of Zedoary (Curcuma Zedoaria Roscoe.) Herbal Tea. Lipids Health Dis. 2016, 15, 39. [Google Scholar] [CrossRef] [PubMed]
- Mendez-del Villar, M.; Gonzalez-Ortiz, M.; Martinez-Abundis, E.; Perez-Rubio, K.G.; Lizarraga-Valdez, R. Effect of Resveratrol Administration on Metabolic Syndrome, Insulin Sensitivity, and Insulin Secretion. Metab. Syndr. Relat. Disord. 2014, 12, 497–501. [Google Scholar] [CrossRef] [PubMed]
- Fung, K.P.; Wu, J.; Zeng, L.H.; Wong, H.N.; Lee, C.M.; Hon, P.M.; Chang, H.M.; Wu, T.W. Lithospermic Acid B as an Antioxidant-Based Protector of Cultured Ventricular Myocytes and Aortic Endothelial Cells of Rabbits. Life Sci. 1993, 53, PL189–PL193. [Google Scholar] [PubMed]
- Soung, D.Y.; Rhee, S.H.; Kim, J.S.; Lee, J.Y.; Yang, H.S.; Choi, J.S.; Yokozawa, T.; Han, Y.N.; Chung, H.Y. Peroxynitrite Scavenging Activity of Lithospermate B from Salvia Miltiorrhiza. J. Pharm. Pharmacol. 2003, 55, 1427–1432. [Google Scholar] [CrossRef] [PubMed]
- Kamata, K.; Noguchi, M.; Nagai, M. Hypotensive Effects of Lithospermic Acid B Isolated from the Extract of Salviae Miltiorrhizae Radix in the Rat. Gen. Pharmacol. 1994, 25, 69–73. [Google Scholar] [CrossRef]
- Jin, C.J.; Yu, S.H.; Wang, X.M.; Woo, S.J.; Park, H.J.; Lee, H.C.; Choi, S.H.; Kim, K.M.; Kim, J.H.; Park, K.S.; et al. The Effect of Lithospermic Acid, an Antioxidant, on Development of Diabetic Retinopathy in Spontaneously Obese Diabetic Rats. PLoS ONE 2014, 9, e98232. [Google Scholar] [CrossRef]
- Quan, W.; Liu, F.; Zhang, Y.; Xie, C.; Wu, B.; Yin, J.; Wang, L.; Zhang, W.; Zhang, X.; Wu, Q. Antidepressant-Like Effects of Magnesium Lithospermate B in a Rat Model of Chronic Unpredictable Stress. Pharm. Biol. 2015, 53, 1168–1175. [Google Scholar] [CrossRef]
- Choi, H.G.; Tran, P.T.; Lee, J.H.; Min, B.S.; Kim, J.A. Anti-Inflammatory Activity of Caffeic Acid Derivatives Isolated from the Roots of Salvia Miltiorrhiza Bunge. Arch. Pharm. Res. 2018, 41, 64–70. [Google Scholar] [CrossRef]
- Li, X.; Yu, C.; Sun, W.; Liu, G.; Jia, J.; Wang, Y. Simultaneous Determination of Magnesium Lithospermate B, Rosmarinic Acid, and Lithospermic Acid in Beagle Dog Serum by Liquid Chromatography/Tandem Mass Spectrometry. Rapid Commun. Mass Spectrom. 2004, 18, 2878–2882. [Google Scholar] [CrossRef]
- Li, X.C.; Yu, C.; Sun, W.K.; Liu, G.Y.; Jia, J.Y.; Wang, Y.P. Pharmacokinetics of Magnesium Lithospermate B after Intravenous Administration in Beagle Dogs. Acta Pharmacol. Sin. 2004, 25, 1402–1407. [Google Scholar]
- Zhang, Y.; Akao, T.; Nakamura, N.; Duan, C.L.; Hattori, M.; Yang, X.W.; Liu, J.X. Extremely Low Bioavailability of Magnesium Lithospermate B, an Active Component from Salvia Miltiorrhiza, in Rat. Planta. Med. 2004, 70, 138–142. [Google Scholar] [PubMed]
- Zhang, Z.; Zhou, F.; Liu, X.; Zhao, M. Particulate Nanocomposite from Oyster (Crassostrea Rivularis) Hydrolysates via Zinc Chelation Improves Zinc Solubility and Peptide Activity. Food Chem. 2018, 258, 269–277. [Google Scholar] [CrossRef] [PubMed]
- Cruz, K.J.C.; de Oliveira, A.R.S.; Morais, J.B.S.; Severo, J.S.; Mendes, P.M.V.; de Sousa Melo, S.R.; de Sousa, G.S.; Marreiro, D.D.N. Zinc and Insulin Resistance: Biochemical and Molecular Aspects. Biol. Trace Elem. Res. 2018, 186, 407–412. [Google Scholar] [CrossRef] [PubMed]
- Rodríguez-Morán, M.; Guerrero-Romero, F. Oral magnesium supplementation improves insulin sensitivity and metabolic control in type 2 diabetic subjects: A randomized double-blind controlled trial. Diabetes Care. 2003, 26, 1147–1152. [Google Scholar] [CrossRef]
- Wallace, T.M.; Levy, J.C.; Matthews, D.R. Use and Abuse of HOMA Modeling. Diabetes Care 2004, 27, 1487–1495. [Google Scholar] [CrossRef]
- Folch, J.; Lees, M.; Sloane Stanley, G.H. A Simple Method for the Isolation and Purification of Total Lipides from Animal Tissues. J. Biol. Chem. 1957, 226, 497–509. [Google Scholar]
Sample Availability: Sample of Danshen is available from the authors. |


© 2020 by the authors. Licensee MDPI, Basel, Switzerland. This article is an open access article distributed under the terms and conditions of the Creative Commons Attribution (CC BY) license (http://creativecommons.org/licenses/by/4.0/).