Next Article in Journal
Selected Pharmaceuticals in Different Aquatic Compartments: Part I—Source, Fate and Occurrence
Next Article in Special Issue
DNA-Binding and Anticancer Activity of Binuclear Gold(I) Alkynyl Complexes with a Phenanthrenyl Bridging Ligand
Previous Article in Journal
Trastuzumab Conjugated Superparamagnetic Iron Oxide Nanoparticles Labeled with 225Ac as a Perspective Tool for Combined α-Radioimmunotherapy and Magnetic Hyperthermia of HER2-Positive Breast Cancer
Previous Article in Special Issue
Chemistry and Some Biological Potential of Bismuth and Antimony Dithiocarbamate Complexes
 
 
Erratum published on 16 June 2021, see Molecules 2021, 26(12), 3662.
Article

Biological and Spectroscopic Investigations of New Tenoxicam and 1.10-Phenthroline Metal Complexes

1
School of Agricultural, Forestry, Food and Environmental Sciences, University of Basilicata, Viale dell’Ateneo Lucano 10, 85100 Potenza, Italy
2
Department of Chemistry, Faculty of Science, Zagazig University, Zagazig 44519, Egypt
3
Department Tanning Materials and Leather Technology, Centre of Excellence, National Research Centre, El-Buhouth St., Dokki, Cairo 12622, Egypt
4
Department of Basic Science, Zagazig Higher Institute of Engineering and Technology, Zagazig 44519, Egypt
*
Author to whom correspondence should be addressed.
Molecules 2020, 25(5), 1027; https://doi.org/10.3390/molecules25051027
Submission received: 5 February 2020 / Revised: 20 February 2020 / Accepted: 24 February 2020 / Published: 25 February 2020
(This article belongs to the Special Issue Metal Coordination Complexes for Biomedical Applications)

Abstract

:
In the present work, tenoxicam (H2Ten) reacted with Mn(II), Co(II), Ni(II), Cu(II) and Zn (II) ions in the presence of 1.10-phenthroline (Phen), forming new mixed ligand metal complexes. The properties of the formed complexes were depicted by elemental analyses, infrared, electronic spectra, proton nuclear magnetic resonance (1H NMR), mass spectrometry, thermogravimetric (TGA) and differential thermogravimetric (DTG) analysis, molar conductance and magnetic moment. IR spectra demonstrated that H2Ten acted as a neutral bidentate ligand, coordinated to the metal ions via the pyridine-N and carbonyl group of the amide moiety, and Phen through the nitrogen atoms. Kinetic thermodynamics parameters activation energy (E*), enthalpy of activation (ΔH*), entropy of activation (ΔS*), Gibbs, free energy (ΔG*) associated to the complexes have been evaluated. Antibacterial screening of the compounds was carried out in vitro against Clavibacter michiganensis, Xanthomonas campestris and Bacillus megaterium. Antifungal activity was performed in vitro against Monilinia fructicola, Penicillium digitatum and Colletotrichum acutatum. The possible phytotoxic effect of the studied compounds was also investigated on Solanum lycopersicum (tomatoes) and Lepidium sativum (garden cress) seeds. The anticancer activity was screened against cell cultures of HCT-116 (human colorectal carcinoma), HepG2 (human hepatocellular carcinoma) and MCF-7 (human breast adenocarcinoma).

Graphical Abstract

1. Introduction

Recently, non-steroidal anti-inflammatory drugs have been pursued due to their potential applications and biological properties. Presently, non- steroidal anti- inflammatory drugs (NSAIDs) are used as therapeutic treatment [1]. Oxicam is a class of NSAID family, which can be closely attached to plasma proteins and react with metal ions, forming complexes [2]. The formation of oxicam complexes with various metal ions promotes their anti-inflammatory and antimicrobial effects more than free ligands [3,4,5,6]. Tenoxicam (H2Ten), (Scheme 1A) is the most studied species of this family and is often used for treating various musculoskeletal and joint disorders, rheumatoid arthritis, knee osteoarthritis, acute gout, and relief of post- surgical inflammation [7,8]. H2Ten has a ring of five-membered heteroatoms that innervates the clinical activity of the drug. Generally, H2Ten behaves like a bidentate ligand when it is coordinated with the metal ions by the pyridyl ring amide oxygen and nitrogen atom [9,10]. Several studies in human cancer cell lines and animal models, as well as epidemiological and clinical studies, proposed that NSAIDs require precise antineoplastic activity [11,12,13]. Nitrogen based ligands are used in the synthesis and design of compounds for biological, chemotherapeutic, and pharmacological applications, such as anti-rheumatics and anti-histamines [14]. The 1,10-Phenanthroline (Phen) (Scheme 1B) is an efficient chelating nitrogen donor ligand, which produces stable complexes in a solution with metal ions [14] and has additional properties for complexes because it contains heteroaromatic and aromatic groups.
Our research goal was to evaluate the cytotoxicity effect of some new mixed ligand complexes of Mn(II), Co(II), Ni(II), Cu(II), and Zn(II) with H2Ten and Phen, against three types of tumor cell lines: HCT-116 (human colorectal carcinoma), HepG2 (human hepatocellular carcinoma), and MCF-7 (human breast adenocarcinoma). Whereas, their antimicrobial activity was evaluated against three phytopathogenic fungi: Monilinia fructicola (G. Winter) Honey, Penicillium digitatum (Pers.) Sacc., and Colletotrichum acutatum J.H. Simmonds, and three bacterial strains: Clavibacter michiganensis corrig. (Smith) Davis et al., Xanthomonas campestris, and Bacillus megaterium (Pammel) Dowson. Phytotoxicity assay was performed against Solanum lycopersicum L. (tomatoes) and Lepidium sativum L. (cress). The following physical properties were tested for the mixed ligand complexes: elemental analyses, conductivity, magnetic susceptibility measurements in order to establish its molecular formula, infrared spectroscopy (IR), ultra-violet visible spectroscopy (UV–Vis.), proton nuclear magnetic resonance (1H NMR), mass spectra, and thermal analyses.

2. Results and Discussion

The results of elemental analysis for H2Ten and Phen ligands and their complexes (Table S1) were in good agreement with the calculated values, and showed that the reaction of H2Ten and Phen with various metal salts in (1:1:1) molar ratio gives complexes with stoichiometric 1:1:1 (H2Ten: Phen: M). The complexes are insoluble in common organic solvents, but soluble in dimethyl formamide (DMF) and dimethyl sulfoxide (DMSO). The molar conductance values for (A), (B), (C), (D), and (E) chelates were found to be 172.20, 174.00, 157.39, 171.42, and 176.30 S cm2 mol−1, respectively. The relatively high values indicate the ionic nature of these chelates and they are of the type 1:1:1 electrolyte [15,16,17]. The magnetic moment values are done and reported in Table 1. (A), (B), (C), (D) complexes have μeff values 5.44, 5.10, 3.30, and 1.70 B.M, respectively, which assumes a high spin octahedral geometries [16,17,18,19]. On the other hand, (E) complex is diamagnetic and has octahedral geometry structure.

2.1. FT-IR Spectra

The IR spectra of the free ligands H2Ten and Phen and their chelates are indexed in Table 1. The free H2Ten spectrum suggested a strong broad band centered at 3432 cm−1 function of O-H stretching [20,21,22,23,24]. The amplitude of the O-H band is symptomatic of formation hydrogen bond [25]. The strong band appeared at 1635 cm−1, which assigned to the carbonyl stretching vibration of the secondary amide group (–CO–NH–) in the free H2Ten (Figure S1). This band is shifted to lower frequency (8–35 cm−1) or to higher frequency (5-8 cm−1), demonstrating the participation of the C=O of the amide moiety in chelate configuration [16,17,18]. The stretching vibration of ν(C=N) of the pyridyl nitrogen placed at 1599 cm−1 is assigned to the coordination of the pyridyl nitrogen is special through an alternate (7–66) cm−1 at a lower wave numbers [24,25]. It is found that the vibration of asymmetrical and symmetrical stretching ν(SO2) is a strong band that appears at 1327 cm−1 and 1040 cm−1, respectively, the two SO2 bands move at higher or lower frequencies in complexes [26]. Since the SO2 group is not implicated in metal bonding, this change at higher or lower frequencies must be correlated to the important hydrogen bonding effects. It has become comprehensible that, in all cases, H2Ten acted as a chelate bi dentate ligand via the oxygen atom of the amide group and nitrogen atom of the pyridyl ring (Scheme 2) [18].
The free Phen ring vibration peak was at 1586 cm−1 and the Phen peak in the chelates was in the range of 1510–1524 cm−1, indicating that the Phen was matched with metal ions by the two atoms of nitrogen and indicated that the Phen had behaved as a bidentate ligand [27]. The bonding is also proven via the presence of new bands of diverse intensity in the IR spectra of the complexes manifestation at 627–423 cm−1 assigned to ν(M-O) and ν(M-N) stretching vibrations, respectively [28,29]. It might also be noted that these vibration bands are absent in the infrared spectra of H2Ten as well as Phen ligand.

2.2. UV–Visible Spectra

Figure 1 displayed the UV-Vis spectra of the organized mixed ligand complexes (A), (B), (C), (D), and (E) in DMSO solvent in the region of 200–800 nm. Free H2Ten ligand showed off three maximum absorption bands at 241, 257, and 383 nm which may also be assigned to π- π* and n-π* transitions, respectively (Table 2) [30]. Phen accords two bands at 273 and 350 nm, which assigned to π-π* and n-π* transitions within C=N group, respectively [28,31,32]. When ligands were chelating with metal ions, there were motivating change in the electronic properties of the system. New bands can be detected in the visible region due to the charge transfer interaction of ligand to metal (L→M) or metal to ligand (M→L) in the 510–560 nm range, which can help us to get a lot of information about the geometric structure of mixed ligand complexes [32]. The absorbance spectrum of the complex (A) shows a band identified at 615 nm that can be assigned to the transition 6A1g4T1g(4G) [32]. For (B) complex spectrum showed a band at 620 nm that can be assigned to the transition 4T1g(F) →4T1g (P) in favor of octahedral geometry [33]. The (C) complex showed absorption band at 605 nm, which may be assigned to 3A2g3T1g(P) transition and supporting distorted octahedral geometry [33]. The band observed at 630 nm for(D) complex may be assigned to 2B1g 2Eg transition with the magnetic moment (1.70 B.M.) is very close to spin value (1.73 B.M.) expected for an octahedral geometry [34].

2.3. 1H NMR Spectra

The assignments of the most important signals in the 1H NMR spectra of H2Ten, Phen, and their metal complexes are recorded in Table S2. H2Ten confirmed singlet peak at 13.80 ppm for OH enolate (Figure 2), aromatic-H signals at 7.29–8.32, at 8.34 for- NH amine, and singlet at 2.51 for –CH3 methyl group. The signals at 7.26–8.81 ppm (m, Ar-H) assigned to aromatic protons observed in Phen ligand. All signals in the complexes move to the lower fields increasingly compared to H2Ten and Phen ligands. Water molecules were assigned signs with points in the range of 3.09–4.46 ppm with an integration corresponding to protons in all metal complexes [35]. By matching the main peaks of H2Ten and Phen with the complexes, the difference in the chemical substance is related to the coordination of the H2Ten pyridine nitrogen that modifies the electronic environment around the neighborhood proteins (Figure 2). In addition, the change in aromatic protons can be the donation of electronic density of metal ions in chelating [36]. Similar 1H NMR spectral studies of paramagnetic complexes have been advanced in their reports on paramagnetic Cu(II) complexes. In addition, the 1H NMR spectra of paramagnetic Mn(II), Co(II), Ni(II), and Cu(II) complexes have been studied [37,38].

2.4. Mass Spectra

The proposition molecular formulas of metal complexes were confirmed by paralleling their molecular formulas weights with m/z values. The mass spectra of complexes (Figure S2) displayed that the molecular ion peaks at m/z = amu with the calculated molecular weights of 714 (42.54%), 700 (9.06%), 748 (25.88%), 723 (55.05%), and 688 (17.59) for (A), (B), (C), (D), (E), and (F) complexes, respectively. This information is in precise settlement with the respective molecular formulation of metallic complexes. The fragmentation sample and mass spectrum of (C) complicated as representative example, is depicted in Figure S2. The molecular ion peak [a] appeared at m/z = 784 (25.88%) loses 2H2O to give [b] at m/z = 748 (13.53%) and it loses 1.5H2O to give [c] at m/z = 757 (17.19%). The molecular ion peak [a] loses C2H7O4 to give [d] at m/z = 689 (24.50%) and it loses C4H8O5 to give [e] at m/z = 648 (17.28%). The molecular ion peak [a] loses C2H6O3.5 to give fragment [f] at m/z = 698 (24.81%) and it loses C2H4O2.5 to give fragment [g] at m/z = 716 (61.38%). The molecular ion peak [a] loses OH to give [h] at m/z = 767 (9.05%) and it loses H4O2.5 to give [i] at m/z = 740 (25.00%), [a] loses CH7O2 to give [j] at m/z = 733 (25.81%) and it loses H3O2 to give [k] at m/z = 749 (41.47%). In addition, [a] loses C3H7O3 to give [l] at m/z = 693 (29.97%) (Scheme 3).

2.5. Thermal Analysis Studies

To assert the structures and compositions thermogravimetric (TGA) and differential thermogravimetric (DTG) analysis were executed for mixed ligand complexes (A), (B), (C), (D), and (E). The measurements were executed below nitrogen surroundings in the temperature range of 25–1000 °C. Their consultant thermo grams are refined in Figure 3. Possible thermal decay patterns for complexes are revealed in Table 3. The study of the thermo grams of the complexes provision several observations. The establish weight losses have been in settlement with the theoretical losses. The thermal evaluation of H2Ten has been accounted in the literature [28,39]. TG curve exhibits Phen decomposed at two steps with mass loss 9.02 and 90.98% corresponding to H2O and 4C2H2+C4H2+N2, respectively (Table 3). TGA of (A), (B), (C) and (D) complexes exhibited three decomposition steps. The first step occur at 124, 63, 120 and 129 οC as maximum temperatures, respectively, and the mass loss lattice water were 5.04, 2.50, 6.85 and 4.91% respectively. The second step for the four complexes occurred at 208, 212, 258 and 203 οC as maximum temperatures, respectively, with the weight loss 30.30, 30.80, 27.35 and 29.80% corresponding to the loss of 6C2H2+2NO molecules for the four complexes. The third step with 447, 611, 251, 347, 349 and 309 οC maximum temperatures and a weight loss 53.15, 54.76, 52.92 and 47.48% corresponding to the loss of H2Ten molecule giving MnO+C, CoO+C, NiO+2C, and CuO+4C as final products. TGA curve of the (E) complex exhibit two main decomposition steps. The first step occurs at 217 οC maximum temperature with a weight loss of 31.32%, corresponding to the loss of Phen and the coordinated water molecules. The second step with 439 οC maximum temperature and a weight loss of 53.98%, corresponding to the loss of H2Ten molecule giving ZnO+2C as final product.
Based on thermal curves, two techniques [40,41] were used to assess kinetic thermodynamics parameters activation energy (E*), the enthalpy of activation (ΔH*), the entropy of activation (ΔS*), Gibbs, free energy change of the decomposition (ΔG*). The parameters (E*, A, ΔH*, ΔS*, and ΔG*) associated to the complexes have been evaluated graphically (Figure S3), and the evaluated data are tabulated in Table 4. The ΔG* values were positive for the complexes, enlightening that the thermal decomposition was a non-spontaneous process, the complexes the complexes being thermally stable [42]. The ΔS* values were instituted to be negative. The negative values of the ΔS* fixed that the activated complexes had a more ordered structure than the reactants, or that the reaction used to be slower than the normal [42]. The positive values of ΔH* intended that the decomposition manner was once endothermic.

2.6. Antimicrobial Efficiency

2.6.1. Antifungal Activity

The possible fungicidal activity of tenoxicam and its metal complexes was determined against three serious phytopathogens (P. digitatum, C. acutatum and M. fructicola) compared to positive control Azoxystrobin (0.8 µL/mL) as demonstrated in Table 5. Generally, all tested substances showed antifungal effect in a dose dependent manner.
In particular, the highest significant antifungal effect against P. digitatum has been observed in case of H2Ten (100 ppm), (A: 100 and 50 ppm), (B: 100 ppm), (C: 100 ppm), and (E: 100 ppm), whereas the lowest significant effect has been observed in case of (C: 50 ppm), compared to positive control. Regarding C. acutatum, the highest significant effect has been observed in case of (A: 100 and 50 ppm) and (C: 100 ppm) insignificantly with positive control, whereas the lowest significant effect has been observed in case of H2Ten (50 ppm). On the other hand, the highest significant antifungal effect against M. fructicola has been observed in case of (A: 100 and 50 ppm), (B: 100 ppm), and (C: 100 ppm), whereas the lowest significant effect has been observed in case of H2Ten (50 ppm) and (E: 50 ppm).

2.6.2. Antibacterial Activity

The results of the antibacterial test showed that the tested ligand and its metal complexes were able to inhibit the growth of X. campestris in a dose dependent manner. In particular, the highest significant effect was observed in the case of (A and C) at 250 ppm insignificantly with Tetracycline (1600 μg.mL−1), whereas the lowest effect was observed in the case of (E) at 100 ppm (Figure 4). Regarding C. michiganensis and B. megaterium, Tetracycline (1600 μg.mL−1) showed the highest significant effect, followed by (A) at 250 ppm, whereas there is no effect observed for other studied compounds.

2.6.3. Mode of Action

The antimicrobial activity of the studied metal complexes could be due to the chemical structures of free ligand itself and the toxic nature of some metal ions [43,44]. On the other hand, the attachment between the parent ligand and the metal ions through the chelation process has reduced the polarity of some metal ions by sharing its positive charge with the donor groups, and possibly the π-electron delocalization within the whole chelate ring system [44]. Based on the above discussed mechanism, it is strongly hypothesized that the chelation process was able to increase the permeability of the microbial cell walls and the lipophilic nature of metal complexes, which lead to their penetration to the peptidoglycan layer of the plasma membrane, and later on lead to the complete cell death [43,45].

2.7. Phytotoxicity Assay

The studied compounds exhibited highly phytotoxic effect against all tested plants (S. lycopersicum and L. sativum) at all tested concentrations. In particular, the tested free ligand and their metal complexes negatively affected the seed germination (SG) and radical elongation (RE) of the above-mentioned tested plants compared to the control treatment. On the other hand, H2Ten at 100 ppm showed moderate phytotoxic effect similar to the control treatment. The obtained results indicated the need for future research on the possible use of the newly prepared metal complexes in controlling different phytopathogens, and also in the pharmaceutical industry.

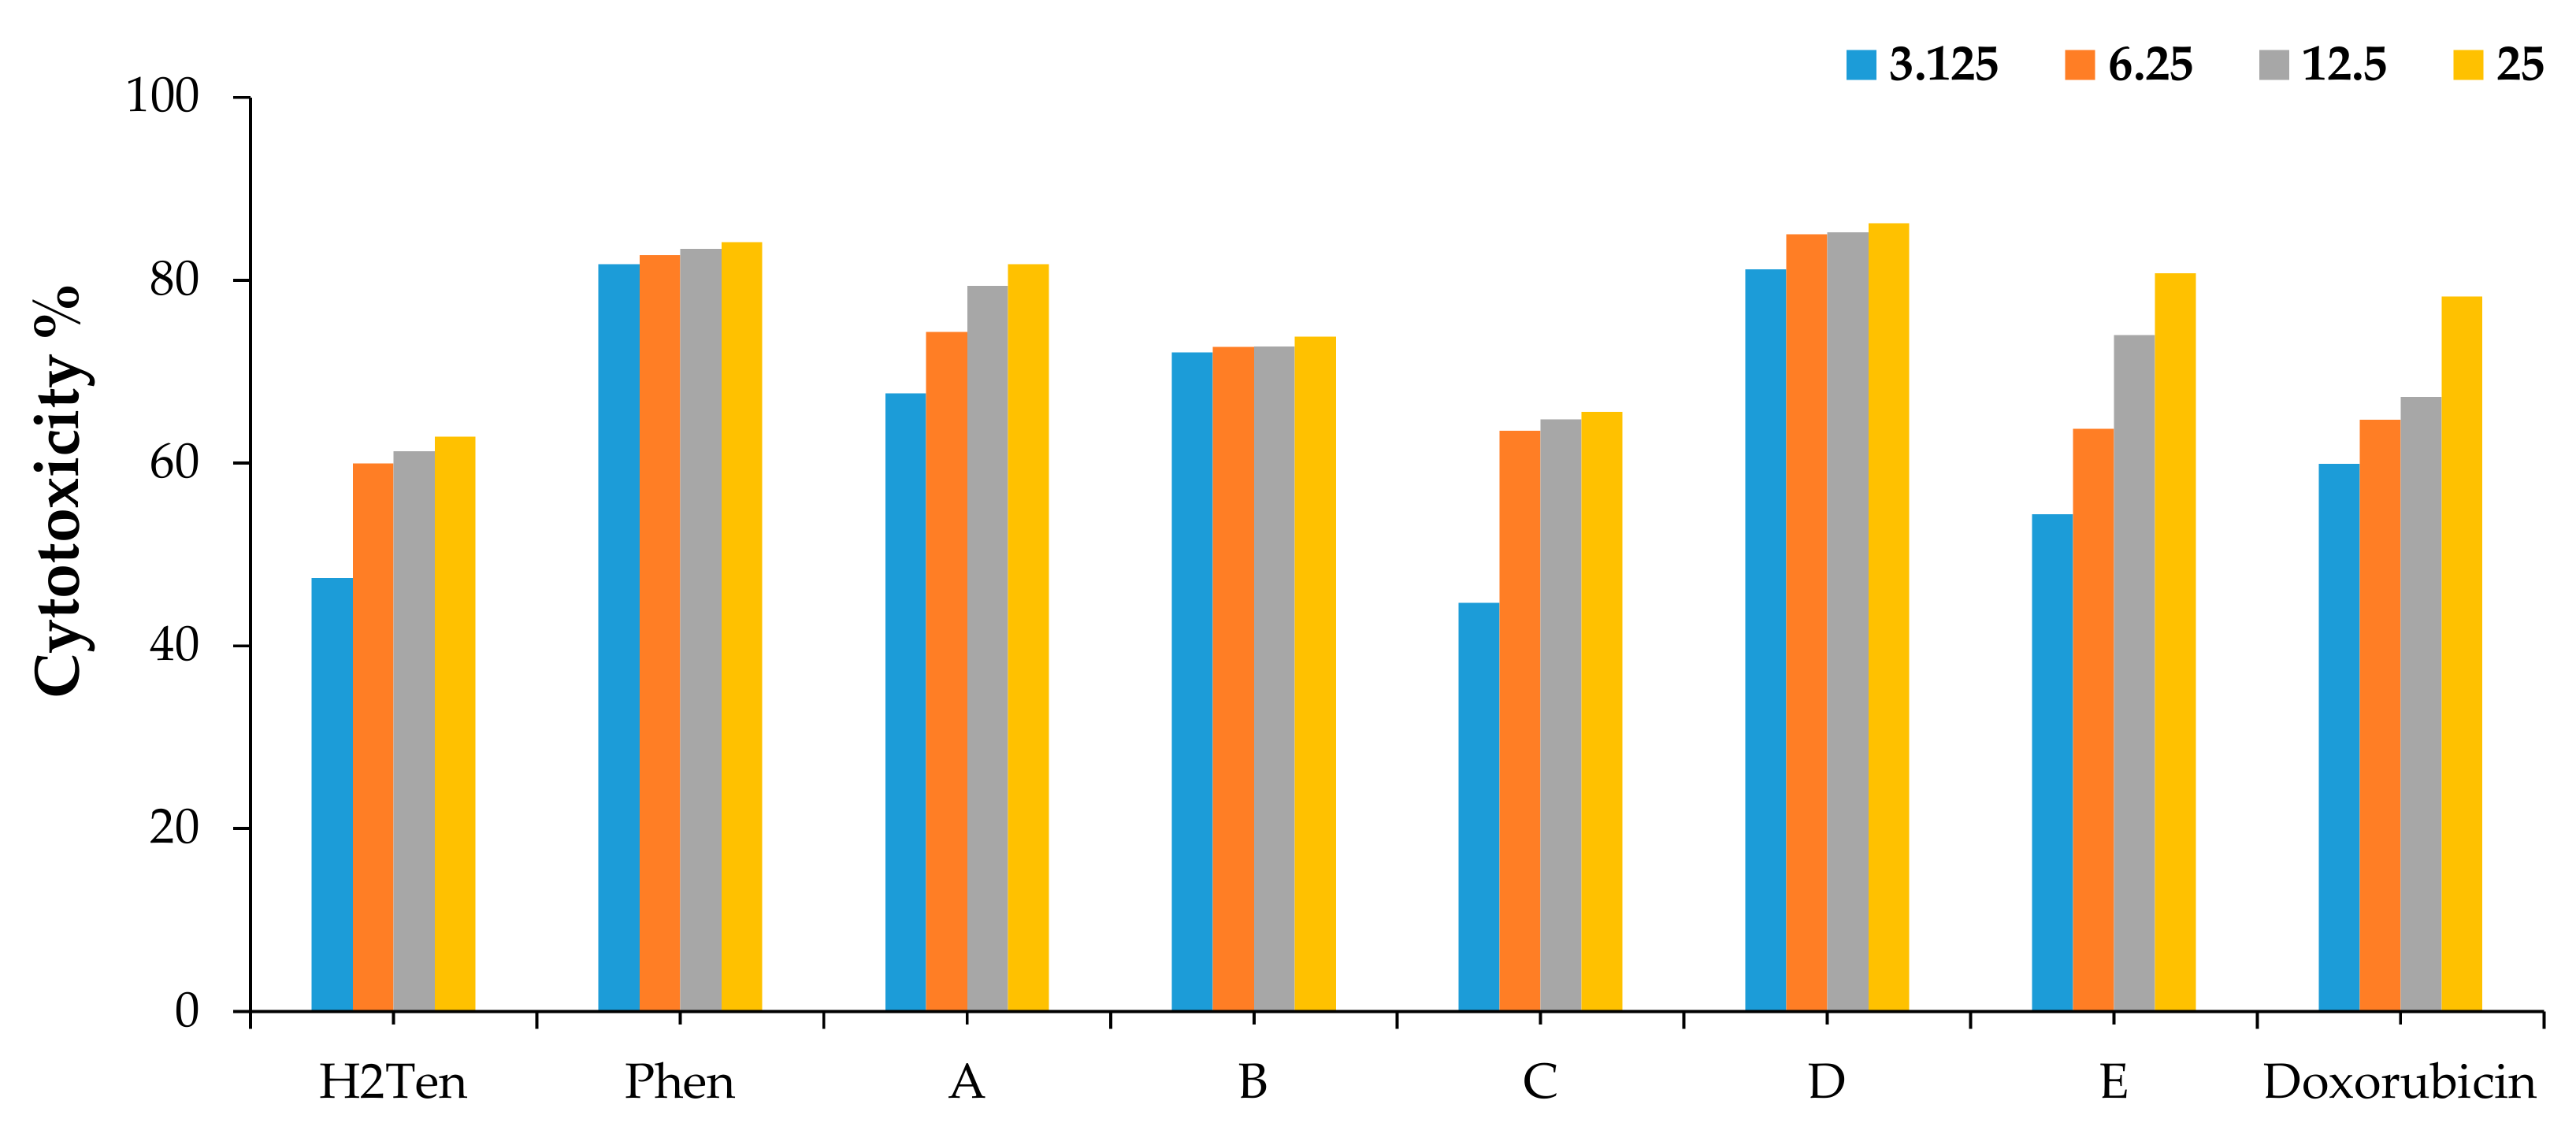
2.8. Cytotoxicity Screening

The compounds were examined in vitro for their activity against HCT-116, HepG2, and MCF-7 human cancer cells using the MTT assay. The percentages of intact cells were calculated and compared to those of the control. Activities of these compounds against the three carcinoma cell lines were compared to the activity of doxorubicin as well (Table 6). All compounds suppressed the three cancer cells in a dose-dependent manner (Figure 5, Figure 6 and Figure 7). In case of HCT-116 human colorectal carcinoma cells, the data showed that compounds Phen, (A), (B), and (D) more potent cytotoxic compounds, and the compounds H2Ten, (C), and (E) are slightly less active compared to doxorubicin. For MCF-7 human breast cancer cells, the compounds Phen and (A), (B), (E), and (D) are more potent cytotoxic compounds, while the two compounds H2Ten and (C) are slightly less active compared to doxorubicin. In case of HepG2 human liver carcinoma cells, two compounds Phen and (D), were more potent than the reference drug (H2Ten) and the rest of the compounds (A), (B), (C), and (E) were slightly less active against HepG2 compared to doxorubicin.

3. Experimental

3.1. Chemicals, Materials, and Biological Species

The analytical reagents grade tenoxicam has been purchased from Egyptian International Pharmaceutical Industries Company (EIPICO). The chemicals 1,10-phenanthroline monohydrate, ethanol, MnCl2.H2O, CoCl2.6H2O, Ni(CH3COO)2.2H2O, CuCl2.2H2O, and ZnCl2.H2O (from Fluka and Aldrich Chemical Company) were used without further purification. HCT-116 (human colorectal carcinoma), HepG2 (human hepatocellular carcinoma) and MCF-7 (human breast adenocarcinoma) cell lines were purchased from the American Type Culture Collection (Rockville, MD, USA).

3.2. Synthesis of New Metal Complexes

The Pale orange [Mn(H2Ten)(Phen)(H2O)2]Cl2.2H2O, complex (A) was prepared by mixing 1 mmol (0.337 g) of H2Ten and 1 mmol (0.156 g) of Phen in 30 mL absolute ethanol with 1 mmol (0.14393 g) of MnCl2.H2O in 20mL ethanol. The mixture was refluxed for 3 h and the precipitate was filtered off and dried under vacuum over anhydrous CaCl2. The green, Pale green, Dark green and Pale yellow solid complexes [Co(H2Ten)(Phen)(H2O)2]Cl2.H2O, (B), [Ni(H2Ten)(Phen)(H2O)2](CH3COO)2.3H2O, (C), [Cu(H2Ten)(Phen)(H2O)2]Cl2.2H2O, (D), and [Zn(H2Ten)(Phen)(H2O)2]Cl2, (E) were prepared in a similar method described above by using CoCl2.6H2O, Ni(CH3COO)2.2H2O, CuCl2.2H2O, and ZnCl2.H2O, respectively.

3.3. Instruments

FT-IR spectra in KBr discs were recorded in the range from 4000–400 cm−1 with FT-IR 460 PLUS Spectrophotometer. Electronic spectra were carried out using UV-3101PC Shimadzu. The absorption spectra were recorded as solutions in DMSO-d6. 1H NMR spectra were recorded on Varian Mercury VX-300 NMR Spectrometer using DMSO-d6 as solvent. The elemental analyses were performed using a Perkin Elmer 2400 CHN elemental analyzer. TGA and differential thermal gravimetric analysis (DTG) measurements were done under N2 atmosphere within the temperature range from room temperature to 1000 οC using TGA-50H Shimadzu, the mass of sample was accurately weighted out in an aluminum crucible. The percentage of the metal ions were determined gravimetrically by transforming the solid products into metal oxide, and also determined by using atomic absorption method. Spectrometer model PYE-UNICAM SP 1900 fitted with the corresponding lamp was used for this purposed Mass spectra were recorded on GCMS-QP-1000EX Shimadzu (ESI-70ev) in the range from 0–1090. Room temperature magnetic susceptibilities of the powdered samples were done on a Sherwood scientific magnetic balance using Gouy balance at room temperature using Hg[Co(CSN)4] as calibrant. Melting points were recorded on a Buchi apparatus. All measurements were carried out at ambient temperature with freshly prepared solutions. The molar conductance of 1 × 10⁻³ M solutions of the ligands and their complexes in DMF was measured at room temperature using CONSORT K410.

3.4. Antimicrobial Investigation

3.4.1. Antifungal Activity

Tested fungal isolates. The tested phytopathogenic fungi were monoconidic isolates of M. fructicola, P. digitatum and C. acutatum. They were stored at 4 °C as pure cultures in the mycotheca of the School of Agricultural, Forestry, Food, and Environmental Sciences (SAFE) of Basilicata University, Potenza, Italy. The fungal species were recultured on potato dextrose agar (PDA) at 24 ± 2 °C. All tested fungi were previously identified by morphological and molecular methods based on polymerase chain reaction (PCR) and sequences analysis using Basic Local Alignment Search Tool software (BLAST- Bethesda, Rockville, MD, USA).
Fungicidal assay. The possible fungicidal activity of the studied ligands and their metal complexes was evaluated following incorporation method at two different concentrations (250 and 250 and 125 µg/mL) into potato dextrose agar (PDA) medium at 45 °C [46]. Fungal disk (0.5 cm) from 96 h fresh culture was inoculated in the center of each Petri dish. All plates were incubated at 22 ± 2 °C for 96 h in darkness conditions and the diameter of the fungal mycelium was measured in mm. The PDA plates without any treatment were inoculated with fungal disks as control. Fungi toxicity was expressed as percentage of growth inhibition (PGI) and calculated according to the Equation (1) [47] compared to Azoxystrobin (0.8 µL/mL), a large spectrum fungicide, as control according to the international limit of microbicide standards:
PGI   % =   100   ×   GC GT GC
where PGI is the percentage of growth inhibition, GC is the average diameter of fungal mycelium in PDA (control), and GT is the average diameter of fungal mycelium on the EO-treated PDA dish.

3.4.2. Antibacterial Activity

Tested bacterial isolates. The tested bacterial strains were C. michiganensis, X. campestris and B. megaterium, have been conserved as pure cultures in the collection of SAFE, University of Basilicata, Potenza, Italy.
Bactericidal assay. The antibacterial activity test has been carried out following the disc diffusion method [48]. The bacterial suspension of each strain was prepared in sterile distilled water incorporated into soft agar (0.7%) adjusted by Turbidimetry (Biolog, USA) at 108 colony form unit (CFU) mL−1 corresponding to 0.2 nm optical density (OD). Four mL of soft agar and bacterial suspension (9:1 v/v) was poured into Petri dish (Ø 90 mm) containing 10 mL KB media. Blank Discs (Ø6 mm) (OXOID, Milan, Italy) were placed over KB-plate surfaces and 20 µL from each compound were applied over the discs at the following concentrations: 125 and 250 µg/mL. Tetracycline was used as positive control at 1600 μg mL−1. All plates were incubated at 37 ± 2 °C for 24 hrs and the bactericidal activity has been evaluated by measuring the diameter of inhibition zones (mm). All tested treatments have been carried out in triplicates.

3.5. Phytotoxicity Assay

A bioassay based on SG and RE was carried out to evaluate the possible phytotoxic effect of the studied compounds on S. lycopersicum and L. sativum seeds [43,49]. Seeds were sterilized in 3% H2O2 solution for 1 min and then were rinsed twice with deionized sterile water (dH2O). Seeds were placed either in dH2O (control) or the above mentioned compounds and were shaken gently for 2 hrs. The tested concentrations were 100, 250, 500, 1000, and 2000 ppm. All seeds were subsequently transferred into 15 mm × 100 mm Petri dishes containing one piece of filter paper (Ø90 mm, Whatman No.1). Ten seeds of each species were evenly spaced on top of the filter paper and moistened with 2 mL of dH2O, or different compounds, and sealed with Parafilm. All petri dishes were incubated in a growth chamber at 24 ± 2 °C with 60% relative humidity in dark conditions for 96 h. The number of germinated seeds was counted and the radical length was measured in cm. The experiment has been conducted in triplicate and the germination index (G.I.) was calculated using the Equation (2):
G.I. % = [(SGt × REt)/(SGc × REc)] × 100
where: GI: germination index; SGt: average number of germinated treated seeds; REt: average radical elongation for treated seeds; SGc: average number of germinated seeds for dH2O control; REc: average radical elongation for dH2O control. Data are expressed as the mean ± SDs for the number of germinated seeds, radical elongation and germination index. Data were analyzed using SPSS statistical program with Tukey test at P < 0.05.

3.6. Cytotoxic Activity

Cell culture of HCT-116 (human colorectal carcinoma), HepG2 (human hepatocellular carcinoma), and MCF-7 (human breast adenocarcinoma) cell lines were purchased from the American Type Culture Collection (Rockville, MD) and maintained in DMEM medium, which was supplemented with 10% heat-inactivated fetal bovine serum (FBS), 100 U/mL penicillin, and 100 U/mL streptomycin. The cells were grown at 37 °C in a humidified atmosphere of 5% CO2.

MTT Cytotoxicity Assay

The cytotoxicity activity against HCT-116, HepG2, and MCF-7 human cancer cell lines was estimated using the 3-[4,5-dimethyl-2-thiazolyl)-2,5-diphenyl-2H-tetrazolium bromide (MTT) assay, which is based on the cleavage of the tetrazolium salt by mitochondrial dehydrogenases in viable cells [50,51,52]. Cells were dispensed in a 96 well sterile microplate (5 × 10⁴ cells/well), and incubated at 37 °C with series of different concentrations (3.12, 6.25, 12.5 and 25.0 µM), in DMSO, of each tested compound or Doxorubicin (positive control) for 48 h in a serum free medium prior to the MTT assay. After incubation, media were carefully removed and 40 µL of MTT (2.5 mg/mL) were added to each well and then incubated for an additional 4 h. The purple formazan dye crystals were solubilized by the addition of 200 µL of DMSO. The absorbance was measured at 590 nm using a Spectra Max Paradigm 1` Multi-ode micro plate reader. The relative cell viability was expressed as the mean percentage of viable cells compared to the untreated control cells. All experiments were performed in triplicate on three different days. Results were represented as mean ± SD. The half maximal inhibitory concentration (IC50) were calculated by probit analysis by SPSS Inc. software (IBM Corp, Armonk, NY, USA).

4. Conclusions

The following metal ions Mn(II), Co(II), Ni(II), Cu(II), and Zn(II) reacted with H2Ten and Phen forming new complexes. The structures of the new synthesized complexes were investigated using various spectroscopic techniques. The obtained data indicated that H2Ten and Phen ligands worked as bidentate chelates and coordinated to the metal via i) the oxygen atom of the amide group; ii) the nitrogen atom of the pyridyl ring; and iii) two atoms of nitrogen of Phen. Results supported the hypothesized octahedral structure of the new metal complexes. Thermal analyses showed a significant mass decrease due to the loss of water molecules, either initially or during successive steps. On the other hand, Phen and (D) compounds were more potent than the parent ligand (H2Ten) against HepG2 human liver carcinoma cells, whereas the other compounds (A), (B), (C), and (E) were slightly less active compared to doxorubicin. Regarding the antimicrobial effects, the obtained results showed that the tested ligand and its metal complexes were able to inhibit the majority of tested microorganisms in a dose dependent manner, and this effect could be due to the chemical structures of free ligand itself and the toxic nature of some attached metal ions.

Supplementary Materials

The supplementary materials are available online.

Author Contributions

Conceptualization, H.S.E, A.A.M. and S.A.S.; methodology, A.A.M., H.S.E., H.M.A. and I.C.; software, I.C.; formal analysis, A.A.M., H.M.A. and H.S.E.; investigation, H.S.E, I.C. and A.A.M.; data curation, I.C. and S.A.S.; writing—original draft preparation, A.A.M and H.S.E.; writing—review and editing, I.C. and S.A.S.; supervision, I.C. and S.A.S. All authors have read and agreed to the published version of the manuscript.

Funding

This research received no external funding.

Conflicts of Interest

The authors declare no conflict of interest.

References

  1. Weder, J.E.; Dillon, C.T.; Hambley, T.W.; Kennedy, B.J.; Lay, P.A.; Biffin, J.R.; Regtop, H.L.; Davies, N.M. Copper complexes of non-steroidal anti-inflammatory drugs: An opportunity yet to be realized. Coord. Chem. Rev. 2002, 232, 95–126. [Google Scholar] [CrossRef]
  2. Gonzalez, J.P.; Todd, P.A. A Preliminary review of its pharmacodynamic and pharmacokinetic properties and therapeutic efficacy. Drugs 1987, 34, 289–310. [Google Scholar] [CrossRef] [PubMed]
  3. Atkobar, Z.; Tuncel, M. The polarographic determination of tenoxicam in the pharmaceutical preparations. Anal. Lett. 1996, 29, 2383–2397. [Google Scholar] [CrossRef]
  4. Blake, D.W.; Bjorksten, A.R.; Libreri, F.C. Oral Tenoxicam for Peripheral Orthopaedic Surgery: A Pharmacokinetic Study. Anaesth. Intens. Care 1997, 25, 142–146. [Google Scholar] [CrossRef] [PubMed] [Green Version]
  5. Tamasi, G.; Bernini, C.; Corbini, G.; Owens, N.F.; Messori, L.; Scaletti, F.; Massai, L.; LoGiudice, P.; Cini, R. Synthesis, spectroscopic and DFT structural characterization of two novel ruthenium(III) oxicam complexes. In vivo evaluation of anti-inflammatory and gastric damaging activities. J. Inorg. Biochem. 2014, 134, 25–35. [Google Scholar]
  6. Cini, R.; Tamasi, G.; Defazio, S.; Hursthouse, M.B. Unusual coordinating behavior by three non-steroidal anti-inflammatory drugs from the oxicam family towards copper(II). Synthesis, X-ray structure for copper(II)–isoxicam, –meloxicam and –cinnoxicam-derivative complexes, and cytotoxic activity for a copper(II)–piroxicam complex. J. Inorg. Biochem. 2007, 101, 1140–1152. [Google Scholar]
  7. Nesseem, D.I.; Eid, S.F.; El-Houseny, S.S. Development of novel transdermal self-adhesive films for tenoxicam, an anti-inflammatory drug. Life Sci. 2011, 89, 430–438. [Google Scholar] [CrossRef]
  8. Erbas, M.; Simsek, T.; Kiraz, H.A.; Sahin, H.; Toman, H. Comparison of the effectivity of oral and intra-articular administration of tenoxicam in patients with knee osteoarthritis. Rev. Bras. Anestesiol. 2015, 65, 333–337. [Google Scholar] [CrossRef] [Green Version]
  9. Baran, E.J. Quimica Bioinorganica; McGraw-Hill Interamericana: Madrid, Spain, 1995. [Google Scholar]
  10. Adam, A.M.A. Ca(II), Sr(II) and Ba(II) ion interaction with the rheumatoid arthitis drug tenoxicam: Structural, thermal, and biological characterization. Appl. Organometal. Chem. 2018, 32, e4055. [Google Scholar]
  11. McCormick, D.L.; Phillips, J.M.; Horn, T.L.; Johnson, W.D.; Steele, V.E.; Lubet, R.A. Over expression of Cyclooxygenase-2 in Rat oral cancers and prevention of oral carcinogenesis in rats by selective and non-selective COX inhibitors. Cancer. Prev. Res. 2010, 3, 73–81. [Google Scholar] [CrossRef] [Green Version]
  12. Kumar, S.V.; Tarun, P.; Kumar, T.A. Transdermal drug delivery system for non-steroidal anti inflammatory drugs: A review. J. Pharm. Res. 2013, 3, 3588–3605. [Google Scholar]
  13. Gurpinar, E.; Grizzle, W.E.; Piazza, G.A. COX-independent mechanisms of cancer chemoprevention by anti-inflammatory drugs. Front. Oncol. 2013, 3, 1–18. [Google Scholar] [CrossRef] [PubMed] [Green Version]
  14. Sadeek, S.A.; Abd El-Hamid, S.M. Synthesis spectroscopic, thermal analysis and in vitro biological properties of some new metal complexes with gemifloxacin and 1,10-phenanthroline. J. Therm. Anal. Calorim. 2016, 124, 547–562. [Google Scholar] [CrossRef]
  15. Kucková, L.; Jomová, K.; Švorcová, A.; Valko, M.; Segľa, P.; Moncoľ, J.; Kožíšek, J. Synthesis, crystal structure, spectroscopic properties and potential biological activities of salicylate‒neocuproine ternary Copper(II) complexes. Molecules 2015, 20, 2115–2137. [Google Scholar] [CrossRef] [PubMed] [Green Version]
  16. Zayed, M.A.; Nour El-Dien, F.A.; Mohamed, G.G.; El-Gamel, N.E.A. Structure investigation, spectral, thermal, X-ray and mass characterization of piroxicam and its metal complexes. Spectrochim. Acta A 2004, 60, 2843–2852. [Google Scholar] [CrossRef] [PubMed]
  17. Mohamed, G.G.; El-Gamel, N.E.A. Synthesis, investigation and spectroscopic characterization of piroxicam ternary complexes of Fe(II), Fe(III), Co(II), Ni(II), Cu(II) and Zn(II) with glycine and dl-phenylalanine. Spectrochim. Acta A 2004, 60, 3141–3154. [Google Scholar] [CrossRef]
  18. Hay, M.T.; Hainaut, B.J.; Geib, S.J. Synthesis and characterization of a novel iron (III) silsesquioxane compound. Inorg. Chem. Commun. 2003, 6, 431–434. [Google Scholar] [CrossRef]
  19. Manonmani, J.; Thirumuruhan, R.; Kandaswamy, M.; Narayanan, V.; Shanmuga, S.; Raj, S.; Ponnuswamy, M.N.; Shanmugan, G.; Fun, H.K. Synthesis of copper(II) and nickel(II) complexes using compartmental ligands: X-ray, electrochemical and magnetic studies. Polyhedron 2001, 20, 3039–3048. [Google Scholar] [CrossRef]
  20. Cini, R.; Giorgi, G.; Cinquantini, A.; Rossi, C.; Sabat, M. Metal complexes of the anti-inflammatory drug piroxicam. Inorg. Chem. 1990, 29, 5197–5200. [Google Scholar] [CrossRef]
  21. Kovala-Demertzi, D. Recent advances on non-steroidal anti-inflammatory drugs, NSAIDs: Organotin complexes of NSAIDs. J. Organomet. Chem. 2006, 691, 1767–1774. [Google Scholar] [CrossRef]
  22. Galani, A.; Demertzis, M.A.; Kubicki, M.; Kovala-Demertzi, D. Organotin-drug interactions organotin adducts of lornoxicam, synthesis and characterization of first complexes of lornoxicam. Eur. J. Inorg. Chem. 2003, 9, 1761–1767. [Google Scholar] [CrossRef]
  23. Defazio, S.; Cini, R. Synthesis, X-ray structure and molecular modelling analysis of cobalt (II), nickel (II), zinc (II) and cadmium (II) complexes of the widely used anti-inflammatory drug meloxicam. J. Chem. Soc. Dalton Trans. 2002, 9, 1888–1897. [Google Scholar] [CrossRef]
  24. Radecka-Paryzek, W.; Luks, E. The scandium (III) ion as a template for the synthesis of a hexaaza Schiff base macrocyclic ligand. J. Monatsh. Chem. 1995, 126, 795–798. [Google Scholar] [CrossRef]
  25. Costamagna, J.; Carruso, F.; Rossi, M.; Campos, M.; Canales, J.; Ramirez, J. Precursors of hexa-azamacrocycles synthesis and X-ray structure of 2,9-diaminophenanthroline-bisacetate-co(ii) and 6,6′-diaminobipyridine-bisacetate-M(ii) (M = Ni, Cu). J. Coord. Chem. 2001, 54, 247–259. [Google Scholar]
  26. Mohamed, A.A.; Sadeek, S.A.; Abd El-Hamid, S.M.; Zordok, W.A.; Awad, H.M. Mixed-ligand complexes of tenoxicam drug with some transition metal ions in presence of 2,2/-bipyridine: Synthesis, spectroscopic characterization, thermal analysis, density functional theory and in vitro cytotoxic activity. J. Mol. Struct. 2019, 1197, 628–644. [Google Scholar] [CrossRef]
  27. Li, Y.; Chai, Y.; Yuan, R.; Liang, W. Synthesis Spectroscopic and Biological Evaluation of some Levofloxacin Metal Complexes. Russ. J. Inorg. Chem. 2008, 53, 704–706. [Google Scholar] [CrossRef]
  28. Sadeek, S.A.; Abd El-Hamid, S.M. Preparation, characterization and cytotoxicity studies of some transition metal complexes with ofloxacin and 1,10-phenanthroline mixed ligand. J. Mol. Struct. 2016, 1122, 175–185. [Google Scholar] [CrossRef]
  29. El-Tabl, A.S.; El-Saied, A.F.; Al-Hakimi, A.N. Synthesis, spectroscopic investigation and biological activity of metal complexes with ONO tri functionalalized hydrazone ligand. Trans. Met. Chem. 2007, 32, 689–701. [Google Scholar] [CrossRef]
  30. Mohamed, H.A.; Wadood, M.A.; Farghaly, O.A. Potentiometric and spectrofluorometric studies on complexation of tenoxicam with some metal ions. J. Pharm. Biomed. Anal. 2002, 28, 819–826. [Google Scholar] [CrossRef]
  31. Kose, D.A.; Kaya, A.; Necefoglu, H. Synthesis and characterization of bis (N, N-diethylnicotinamide) m-hydroxybenzoate complexes of Co(II), Ni(II), Cu(II) and Zn(II). Russ. J. Coord. Chem. 2007, 33, 422–428. [Google Scholar] [CrossRef]
  32. Lever, A.B.P. The electronic spectra of tetragonal metal complexes analysis and significance. Coord. Chem. Rev. 1968, 3, 119–140. [Google Scholar] [CrossRef]
  33. Mohamed, G.G.; Abd El-Wahab, Z.H. Salisaldehyde-2-aminobenzimidazole schiff base complexes of Fe(III), Co(II), Ni(II), Cu(II), Zn(II) and Cd(II). J. Therm. Anal. 2003, 73, 347–359. [Google Scholar] [CrossRef]
  34. Masoud, M.S.; Zaki, Z.M. Synthesis and characterization of 5-(arylazo)thiobarbituric acids and their complexes. Met. Chem. 1988, 13, 321–327. [Google Scholar] [CrossRef]
  35. Macias, B.; Martinez, M.; Sanchez, A.; Dominguez-Gil, A.A. physico-chemical study of the interaction of ciprofloxacin and ofloxacin with polivaientcations. Int. J. Pharm. 1994, 106, 229–235. [Google Scholar]
  36. El –Gamel, N.E.A.; Gerlach, D. Uranyl and transition metals chelates of tenoxicam. Crystal structures of trans, trans-[Co(II)-(Hten)2(dmso)2], trans, trans-[Zn(II)-(Hten)2(dmso)2] and solvate cis,cis-[UO2(VI)(Hten)2 (H2O)2].C2H5OH. Coord. Chem. 2008, 61, 2246–2265. [Google Scholar] [CrossRef]
  37. Khedr, A.M.; Draz, D.F. Synthesis, spectroscopic, and thermal analyses of trinuclear Mn(II), Co(II), Ni(II), and Zn(II) complexes with some sulfa derivatives. J. Coord. Chem. 2010, 63, 1418–1429. [Google Scholar] [CrossRef]
  38. Zordok, W.A.; Sadeek, S.A. Synthesis spectroscopic characterization, biological studies and DFT calculations on some transition metal complexes of NO donor ligand. J. Mol. Struct. 2018, 1158, 205–220. [Google Scholar] [CrossRef]
  39. Ringer, A.L.; Sherrill, C.D.; King, R.A.; Crawford, T.D. Low-lying singlet excited states of isocyanogen. Int. J. Quant. Chem. 2008, 108, 1137–1140. [Google Scholar] [CrossRef]
  40. Coats, A.W.; Redfern, J.P. Kinetic parameters from thermogravimetric data. Nature 1964, 201, 68–69. [Google Scholar] [CrossRef]
  41. Horowitz, H.W.; Metzger, G. A New Analysis of thermogravimetric traces. Anal. Chem. 1963, 35, 1464–1468. [Google Scholar] [CrossRef]
  42. El Gammal, O.A. Mononuclear and binuclear complexes derived from hydrazone Schiff base NON donor ligand: Synthesis, structure, theoretical and biological studies. Inorg. Chim. Acta 2015, 435, 73–81. [Google Scholar] [CrossRef]
  43. Elshafie, H.S.; Sakr, S.H.; Sadeek, S.A.; Camele, I. Biological investigations and spectroscopic studies of new Moxifloxacin/Glycine-Metal complexes. Chem. Biodiver. 2019, 16, e1800633. [Google Scholar]
  44. Sakr, S.H.; Elshafie, H.S.; Camele, I.; Sadeek, S.A. Synthesis, spectroscopic, and biological studies of mixed ligand complexes of gemifloxacin and glycine with Zn(II), Sn(II), and Ce(III). Molecules 2018, 23, e1182. [Google Scholar] [CrossRef] [PubMed] [Green Version]
  45. Patel, N.H.; Parekh, H.M.; Patel, M.N. Synthesis, physicochemical characteristics, and biocidal activity of some transition metal mixed-ligand complexes with bidentate (NO and NN) Schiff bases. Pharm. Chem. J. 2007, 1, 78–81. [Google Scholar] [CrossRef]
  46. Zygadlo, J.A.; Guzman, C.A.; Grosso, N.R. Antifungal properties of the leaf oils of Tagetesminuta L. and Tagetesfilifolia Lag. J. Essent. Oil Res. 1994, 6, 617–621. [Google Scholar] [CrossRef]
  47. Elshafie, H.S.; Mancini, E.; Camele, I.; De Martino, l.; De Feo, V. In vivo antifungal activity of two essential oils from Mediterranean plants against postharvest brown rot disease of peach fruit. Ind. Crop. Prod. 2015, 66, 11–15. [Google Scholar] [CrossRef]
  48. Elshafie, H.S.; Amato, M.; De Feo, V.; Camele, I. Chemical composition and antimicrobial activity of Chia (Salvia hispanica l.) essential oil. Eur. Food Res. Technol. 2018, 244, 1675–1682. [Google Scholar] [CrossRef]
  49. Ceglie, F.; Elshafie, H.S.; Verrastro, V.; Tittarelli, F. Evaluation of olive pomace and green waste composts as peat substitutes for organic tomato seedling production. J. Compost. Sci. Util. 2011, 19, 293–300. [Google Scholar] [CrossRef]
  50. Emam, A.; Samah, N.; Loutfy, A.; Mostafa, A.A.; Awad, H.M.; Mohamed, M.B. Cytotoxicity, biocompatibility and cellular response of carbon dots–plasmonic based nano-hybrids for bioimaging. RSC Adv. 2017, 7, 23502–23514. [Google Scholar] [CrossRef] [Green Version]
  51. Hassan, A.S.; Mady, M.F.; Awad, H.M.; Hafez, T.S. Synthesis and antitumor activity of some new pyrazolo [1, 5-a] pyrimidines. Chin. Chem. Lett. 2017, 28, 388–393. [Google Scholar] [CrossRef]
  52. Flefel, E.M.; El-Sayed, W.A.; Mohamed, A.M.; El-Sofany, W.I.; Awad, H.M. Synthesis and Anticancer Activity of New 1-Thia-4-azaspiro[4.5]decane, Their Derived Thiazolopyrimidine and 1,3,4-Thiadiazole Thioglycosides. Molecules 2017, 22, 1–13. [Google Scholar] [CrossRef] [PubMed]
Sample Availability: Samples of the new prepared compounds are available from the authors.
Scheme 1. (A) H2Ten (4-hydroxy-2-methyl-N-(2pyridyl)-2H-thieno [2,3-e]-1,2-thiazine-3-carboxamide 1,1-dioxide) and (B) 1,10-phenanthroline monohydrate (Phen).
Molecules 25 01027 sch001
Scheme 2. The coordination mode of Mn (II), Co(II), Ni(II), Cu(II), and Zn (II) with H2Ten and Phen.
Molecules 25 01027 sch002
Figure 1. Electronic absorption spectrum for H2Ten, Phen and their metal complexes. Where: H2Ten: Tenoxicam; Phen: 1,10-Phenanthroline; (A) Manganese complex; (B) Cobalt complex; (C) Nickel complex; (D) Cupper complex; (E) Zink complex.
Molecules 25 01027 g001
Figure 2. 1H NMR spectrum for H2Ten, Phen and their metal complexes. Where: H2Ten: Tenoxicam; Phen: 1,10-Phenanthroline; (A) Manganese complex; (B) Cobalt complex; (C) Nickel complex; (D) Cupper complex; (E) Zink complex.
Molecules 25 01027 g002aMolecules 25 01027 g002b
Scheme 3. Fragmentation pattern of (C) complex.
Molecules 25 01027 sch003
Figure 3. TGA and DTG diagram for H2Ten, Phen and their metal complexes. Where: H2Ten: Tenoxicam; Phen: 1,10-Phenanthroline; (A) Manganese complex; (B) Cobalt complex; (C) Nickel complex; (D) Cupper complex; (E) Zink complex.
Molecules 25 01027 g003
Figure 4. Antimicrobial activity of H2Ten and its metal complexes. Where: H2Ten: Tenoxicam; A: Manganese complex; B: Cobalt complex; C: Nickel complex; D: Cupper complex; E: Zink complex; Tetracycline: 1.6 mg/mL. Values are recorded as the mean of diameter of inhibition zones (mm) from three replicates ± SDs. (*): statistically significant at 𝑃 < 0.05: (**): statistically significant at 𝑃 < 0.01.
Molecules 25 01027 g004
Figure 5. Dose dependent cytotoxic activities of H2Ten, Phen and their metal complexes against HCT-116 cancer cells according to the MTT assay. Where: 3.12, 6.25, 12.5, and 25.0 µM are the concentrations, diluted in DMSO, used for the MTT assay.
Molecules 25 01027 g005
Figure 6. Dose dependent cytotoxic activities of H2Ten, Phen and their metal complexes against MCF-7 cancer cells according to the MTT assay. Where: 3.12, 6.25, 12.5, and 25.0 µM are the concentrations, diluted in DMSO, used for the MTT assay.
Molecules 25 01027 g006
Figure 7. Dose dependent cytotoxic activities of H2Ten, Phen and their metal complexes against HepG2 cancer cells according to the MTT assay. Where: 3.12, 6.25, 12.5, and 25.0 µM are the concentrations, diluted in DMSO, used for the MTT assay.
Molecules 25 01027 g007
Table 1. Selected infrared wave numbers (cm−1) for H2Ten, Phen and their metal complexes
Compoundsν(O-H);enolate and H2O;ν(C=O); amideν(C=N)
in pyridyl H2Ten
ν(C=N)
in pyridyl Bipy
νas(so2)νs(so2) ν(M-O) and
ν(M-N)
H2Ten3432s1635vs1599s 1327s1040 m-
Phen3380 mbr--1586 ms---
(A)3402 m,br1600 s1549 m1510 vw 1325 m 1050vw608 m
526 w
424 vw
(B)3436 s1600 s1551 m1520 w1328 s1042 w624 m
582 m
528 m
(C)3387 s,br 1627 vs1592 s 1524 m 1325 m 1052 vw626 vw
586 m
543 vw
(D)3423 m,br1640 vs1533 w1501 sh1326 vs1037 vs617 m
530 w
423 w
(E)3429 m,br1600 vs1547 m1510 w1328 s1041 vw627 w
548 vw
526 w
Table 2. UV–Vis. spectra for H2Ten, Phen and their metal complexes
Assignments (nm)H2TenPhenMixed Ligand Complex With
(A)(B)(C)(D)(E)
π-π* transitions241
257
273225
257
257 256 235
257
244
265
n-π* transitions383350383382386380382
Ligand-metal charge transfer--520510560530550
d-d transition--615620605630---
Table 3. The maximum temperature Tmax (οC) and weight loss values of the decomposition stages for H2Ten, Phen and their metal complexes
CompoundsDecompositionTmax (οC)Weight Loss (%)Lost Species
Calc.Found
H2Ten
(C13H11N3O4S2)
First step22892.8993.835C2H2+2SO+CO2+0.5H2+1.5N2
Second step 92.8993.83
Residue 7.116.172C
Phen
(C12H10N2O)
First step959.079.02
Second step27890.9390.98H2O
Total loss 1001004C2H2+C4H2+N2
Residue
(A)
(MnC25H27N5O8S2Cl2)
First step1245.035.042H2O
Second step20830.1930.306C2H2+2NO
Third step447,61153.1953.155C2H2+NCCl+HCl+CO+N2+2SO
Total loss 88.4183.49
Residue 11.5911.51MnO+C
(B)
(CoC25H25N5O7S2Cl2)
First step632.562.50H2O
Second step21230.8330.806C2H2+2NO
Third step251,34754.2254.765C2H2+2SO+NCCl+HCl+N2+CO
Total loss 87.6188.06
Residue 12.3911.94CoO+C
(C)
(NiC29H35N5O13S2)
First step63,1206.896.853H2O
Second step25827.5427.356C2H2+2NO
Third step34952.9952.927C2H2+2SO+CO+NH3+2NO2
Total loss 87.4287.12
Residue 12.5812.88NiO+2C
(D)
(CuC25H27N5O8S2Cl2)
First step1294.974.912H2O
Second step20329.8629.806C2H2+2NO
Third step30747.5547.484C2H2+2SO+NCCl+0.5Cl2+NO+NH3
Total loss 82.3985.30
Residue 17.6117.81CuO+4C
(E)
(ZnC25H23N5O6S2Cl2)
First step21731.3431.326C2H2+2NO
Second step43953.3953.985C2H2+2SO+Cl2+1.5N2+CO+0.5H2
Total loss 84.7385.30
Residue 15.2714.70ZnO+2C
Table 4. Thermal behavior and Kinetic parameters determined using Coats–Redfern (CR) and Horowitz–Metzger (HM) operated for H2Ten, Phen and their complexes.
CompoundsDecomposition Range (K)Ts(K)MethodParameterR aSD b
E*
(KJ/mol)
A
(s−1)
ΔS*
(KJ/mol.K)
ΔH*
(KJ/mol)
ΔG*
(KJ/mol)
H2Ten
(C13H11N3O4S2)
401–525501CR
HM
94.49
99.97
7.06 × 10⁷
2.11 × 10⁸
−0.0989
−0.0898
90.32
95.81
139.90
140.8
0.989
0.984
0.154
0.183
Phen
(C12H10N2O)
394–572551CR
HM
117.83
146.78
2.03 × 10⁹
7.97 × 10¹¹
−0.0718
−0.0222
113.25
142.20
153.44
152.84
0.985
0.984
0.206
0.219
(A)
(MnC25H27N5O8S2Cl2)
419–629582CR
HM
85.59
77.30
3.5 × 10⁶
1.65 × 10⁶
−0.1236
−0.1298
81.59
73.30
141.05
135.74
0.990
0.986
0.139
0.165
(B)
(CoC25H25N5O7S2Cl2)
439–516482CR
HM
128.73
124.95
4.37 × 10¹¹
3.73 × 10¹¹
−0.0260
−0.027
124.72
120.94
137.28
134.13
0.998
0.997
0.052
0.067
(C)
(NiC29H35N5O13S2)
440–741531CR
HM
94.09
103.30
5.04 × 10⁶
1.06 × 10⁸
−0.1213
−0.0960
89.68
98.89
154.13
149.88
0.991
0.985
0.132
0.176
(D)
(CuC25H27N5O8S2Cl2)
419–507476CR
HM
92.53
87.42
5.42 × 10⁷
3.02 × 10⁷
−0.1007
−0.1055
88.58
83.46
136.52
162.23
0.992
0.989
0.124
0.148
(E)
(ZnC25H23N5O6S2Cl2)
388–541491CR
HM
96.50
86.20
3.92 × 10⁷
1.05 × 10⁷
−0.1036
−0.1145
92.41
82.12
143.32
138.37
0.982
0.980
0.201
0.209
a: correlation coefficients of the Arrhenius plots. b: standard deviation.
Table 5. Antifungal activity of H2Ten and its metal complexes
Tested SubstancesFungal Growth Inhibition (%)
PPMP. digitatumC. acutatumM. fructicola
H2Ten25087.5 ± 6.2a32.5 ± 2.9c67.5 ± 3.1b
12535.0 ± 3.1c14.0 ± 2.1c45.0 ± 2.5b
A250100.0 ± 0.0a100.0 ± 0.0a100.0 ± 0.0a
125100.0 ± 0.0a100.0 ± 0.0a100.0 ± 0.0a
B25087.5 ± 5.2a54.0 ± 2.1b81.0 ± 5.7a
12572.5 ± 4.3b22.5 ± 1.2c62.5 ± 5.4b
C25087.5 ± 5.6a81.0 ± 5.8ab77.5 ± 7.2b
12515.0 ± 2.1c32.5 ± 3.1c57.5 ± 2.1b
D25075.0 ± 3.1b65.0 ± 1.4b87.0 ± 3.5a
12536.5 ± 3.5c27.0 ± 1.6c61.0 ± 2.1b
E25087.5 ± 2.5a62.5 ± 2.8b65.0 ± 2.2b
12562.5 ± 6.4b45.0 ± 3.4c45.0 ± 5.6b
PDA −ve cont.0.0 ± 0.0e0.0 ± 0.0d0.0 ± 0.0c
Azoxy.+ve cont.58.1 ± 1.2b92.5 ± 1.3a45.3 ± 2.1b
Where: H2Ten: (C13H11N3O4S2); A: (MnC25H27N5O8S2Cl2); B: (CoC25H25N5O7S2Cl2); C: (NiC29H35N5O13S2); D: (CuC25H27N5O8S2Cl2); E: (ZnC25H23N5O6S2Cl2). Values were recorded as the mean inhibition percentage of fungal growth (three replicates) ± SDs. Values followed by different letters in each vertical column are significantly different according to Tukey B test at P < 0.05. Cont (PDA): potato dextrose agar (negative control). Azoxy. +ve cont: Positive control Azoxystrobin (0.8 µL/mL).
Table 6. IC50 of the tested compounds against the three cancer cell lines according to the MTT assay.
Compound CodeIC50 (µM) ± SD
HCT-116MCF-7HepG2
H2Ten16.3 ± 5.111.9 ± 4.110.5 ± 4.1
Phen0.6 ± 0.30.5 ± 0.29.8 ± 3.5
(A)4.2 ± 1.53.0 ± 1.111.1 ± 3.9
(B)4.3 ± 1.64.2 ± 1.511.4 ± 3.8
(C)18.5 ± 4.911.2 ± 3.512.6 ± 4.1
(D)0.2 ± 0.20.3 ± 0.26.8 ± 2.5
(E)19.3 ± 4.36.3 ± 2.512.0 ± 4.1
Doxorubicin9.4 ± 3.96.7 ± 2.910.4 ± 3.6

