
Simultaneous Analysis of Fenthion and Its Five Metabolites in Produce Using Ultra-High Performance Liquid Chromatography-Tandem Mass Spectrometry


Abstract
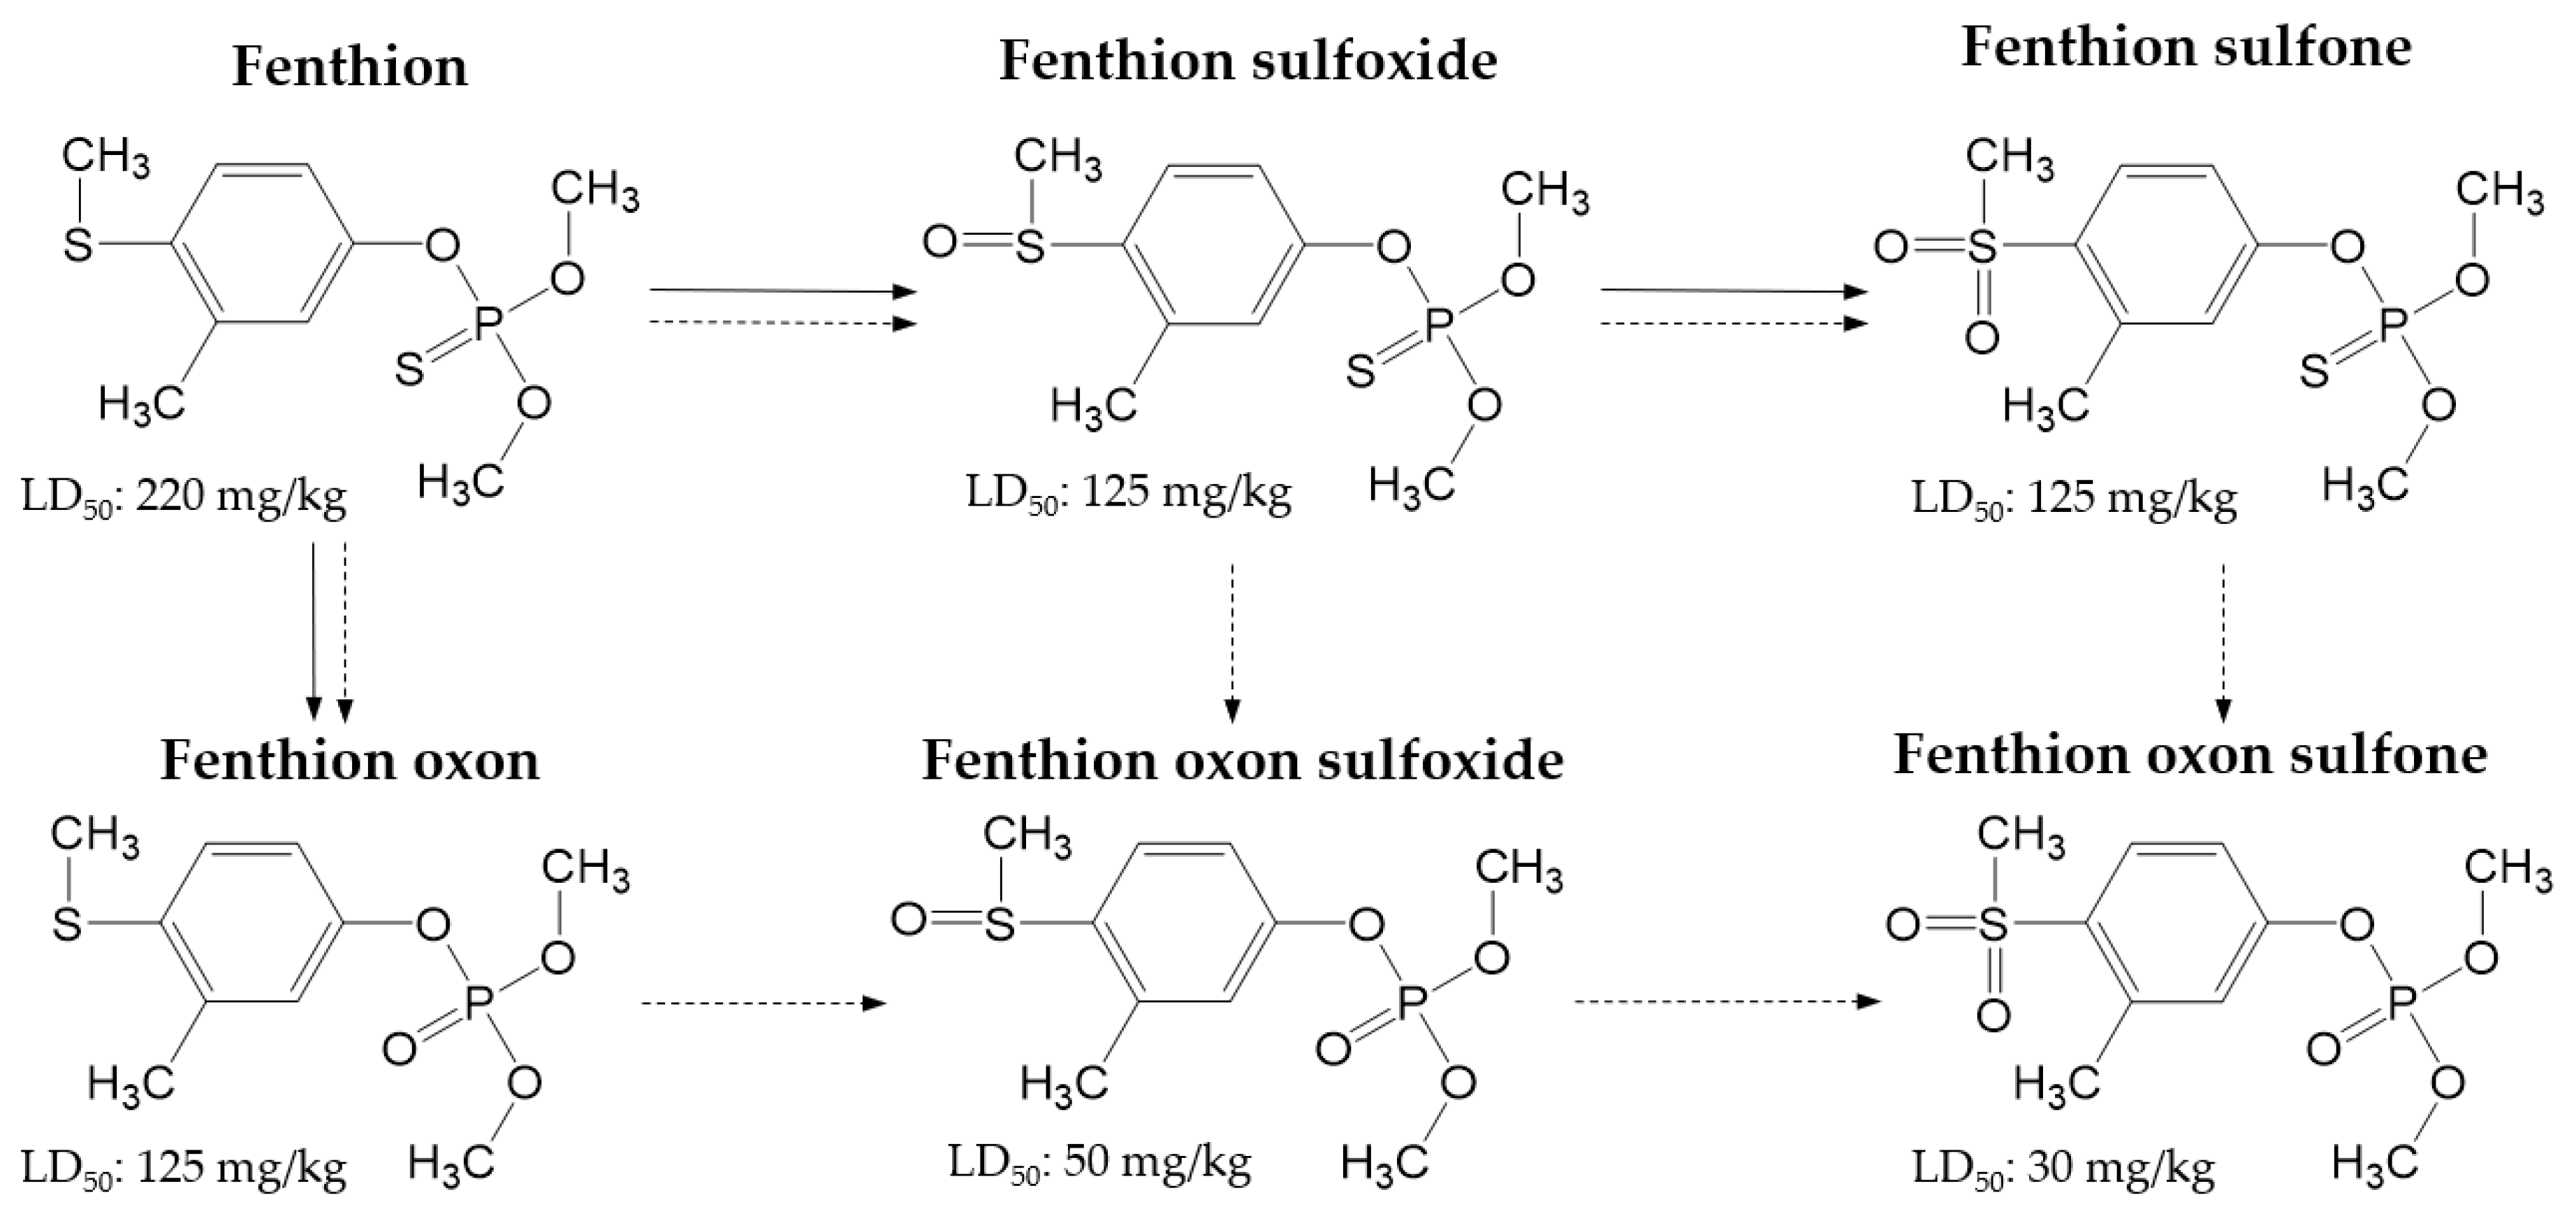
:1. Introduction
2. Results and Discussion
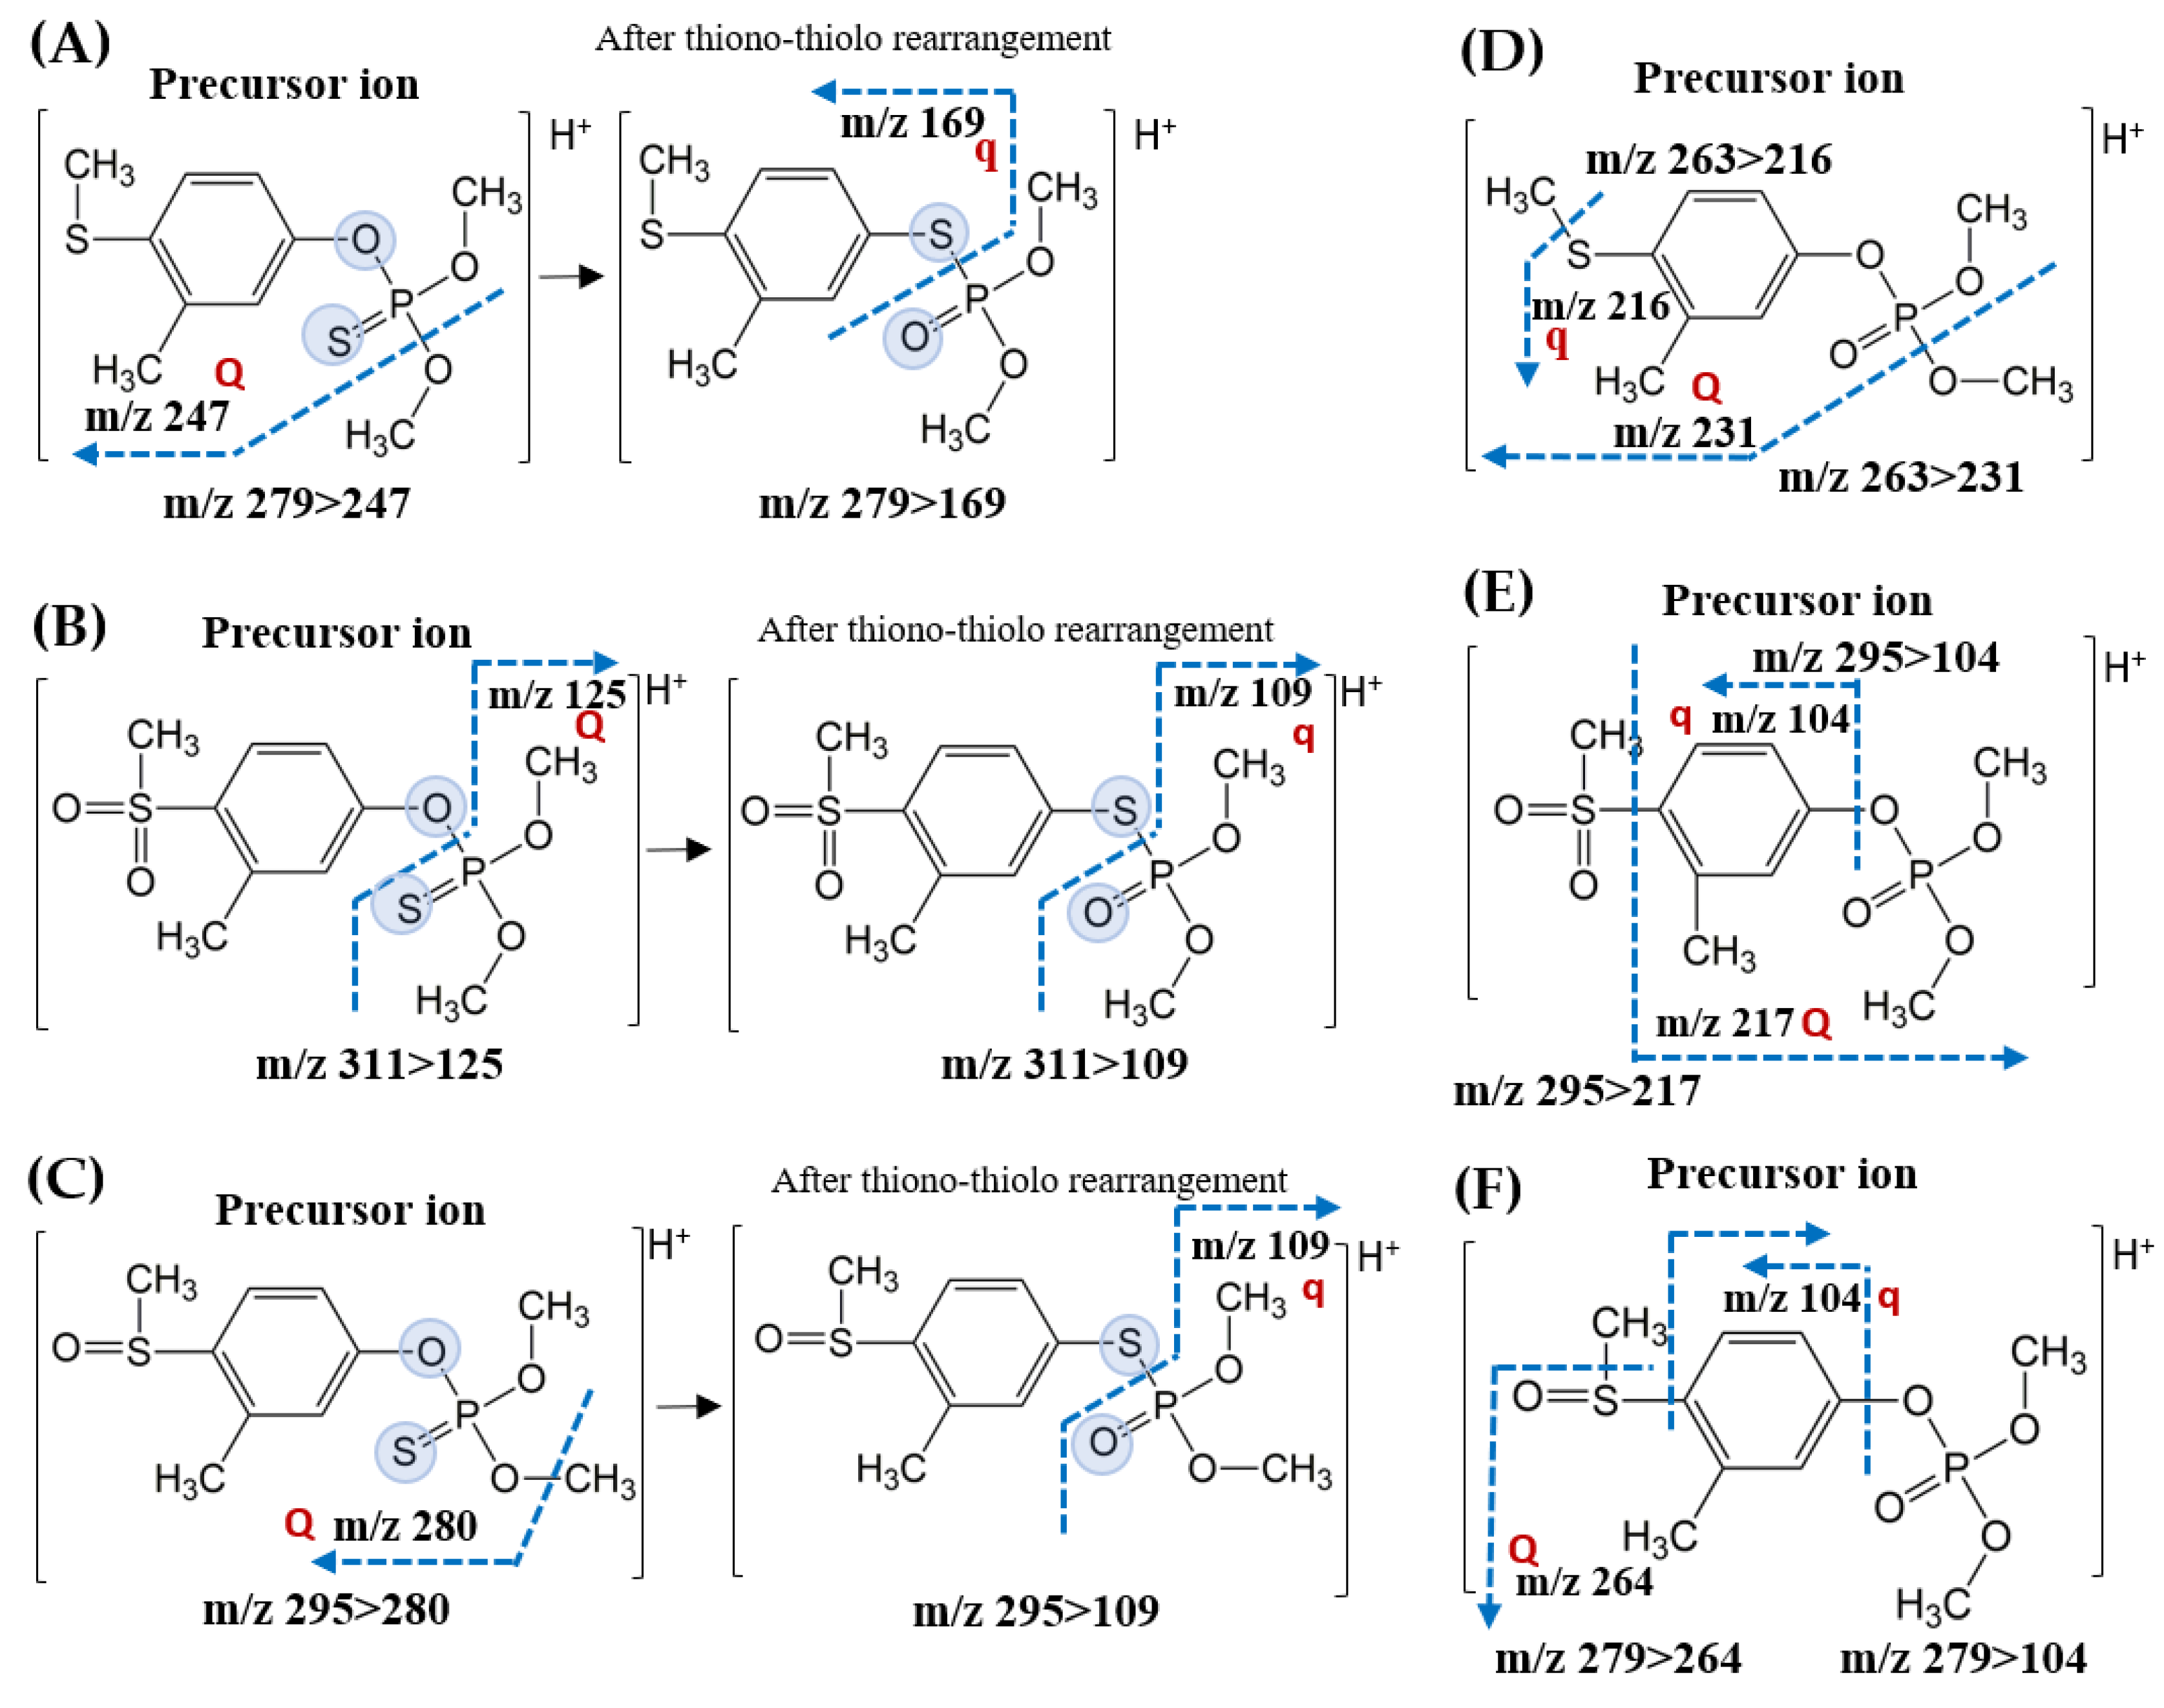
2.1. Optimization of Multiple Reaction Monitoring (MRM) Transitions
2.2. Selection of the Mobile Phase
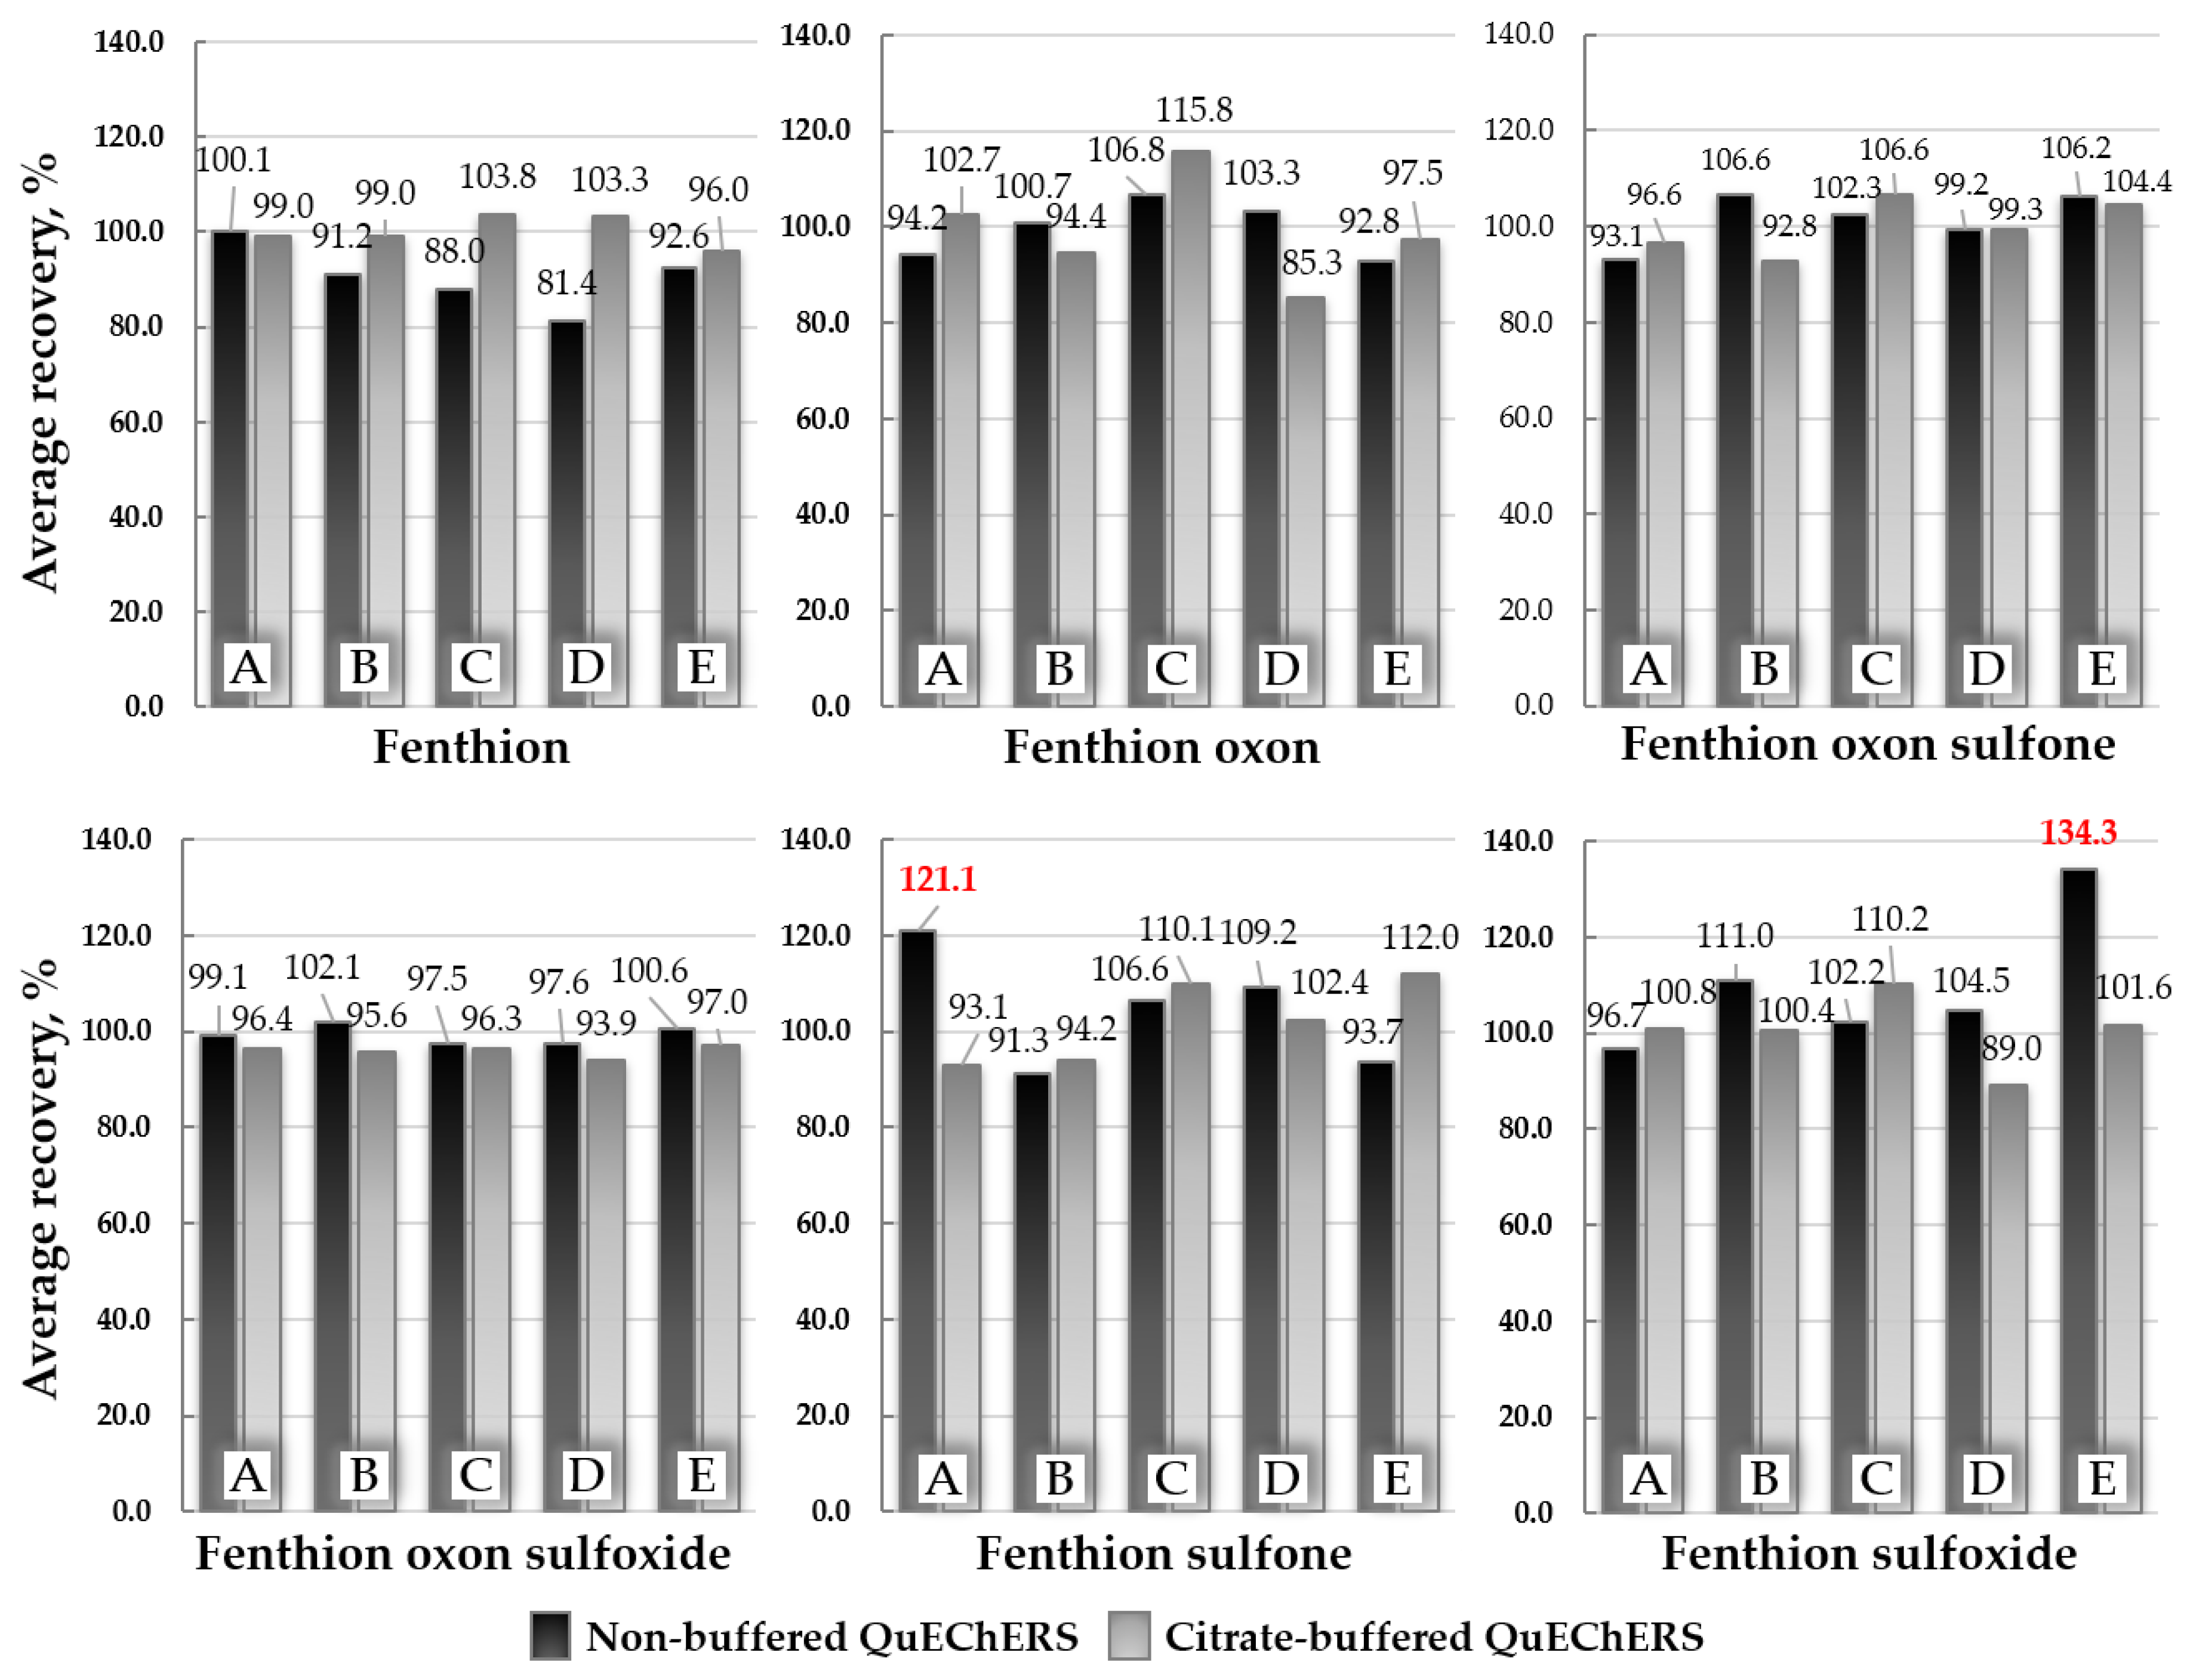
2.3. Optimization of the Sample Extraction Method
2.4. Validation of the Analytical Method
2.4.1. Specificity
2.4.2. Linearity
2.4.3. Accuracy and Precision
2.4.4. Limit of Quantitation
2.4.5. Matrix Effect
3. Materials and Methods
3.1. Chemicals and Reagents
3.2. Instrumental Conditions
3.3. Selection of the Mobile Phases for UHPLC-MS/MS
3.4. Optimization of the Sample Extraction Procedure
3.5. The Final Optimized Sample Preparation Procedure
3.6. Validation of the Analytical Method
4. Conclusions
Supplementary Materials
Author Contributions
Funding
Conflicts of Interest
References
- Štěpán, R.; Tichá, J.; HajšLová, J.; Kovalczuk, T.; Kocourek, V. Baby food production chain: Pesticide residues in fresh apples and products. Food Addit. Contam. 2005, 22, 1231–1242. [Google Scholar] [CrossRef] [PubMed]
- Seo, Y.-H.; Cho, T.-H.; Hong, C.-K.; Kim, M.-S.; Cho, S.-J.; Park, W.-H.; Hwang, I.-S.; Kim, M.-S. Monitoring and Risk Assessment of Pesticide Residues in Commercially Dried Vegetables. Prev. Nutr. Food Sci. 2013, 18, 145–149. [Google Scholar] [CrossRef] [PubMed] [Green Version]
- Schnoebelen, D.J.; Kalkhoff, S.; Becher, K.D.; Thurman, E. Water-quality assessment of the eastern Iowa basins: Selected pesticides and pesticide degradates in streams, 1996–1998; US Department of the Interior, US Geological Survey: Reston, VA, USA, 2003.
- Richardson, S.D. Environmental Mass Spectrometry: Emerging Contaminants and Current Issues. Anal. Chem. 2008, 80, 4373–4402. [Google Scholar] [CrossRef] [PubMed]
- Somasundaram, L.; Coats, J.R.; Racke, K.D.; Stahr, H.M. Application of the microtox system to assess the toxicity of pesticides and their hydrolysis metabolites. Bull. Environ. Contam. Toxicol. 1990, 44, 254–259. [Google Scholar] [CrossRef]
- FAO. Fenthion. 1995. Available online: http://www.fao.org/fileadmin/templates/agphome/documents/Pests_Pesticides/JMPR/Evaluation95/fenthion.pdf (accessed on 21 April 2020).
- EPA. Fenthion Facts. 2001. Available online: https://archive.epa.gov/pesticides/reregistration/web/pdf/0290fact.pdf (accessed on 21 April 2020).
- EPA. Interim Reregistration Eligibility Decision for Fenthion. 2001. Available online: https://nepis.epa.gov/Exe/ZyPURL.cgi?Dockey=200007BH.TXT (accessed on 21 April 2020).
- Bai, C.L.; Qiao, C.B.; Zhang, W.D.; Chen, Y.L.; Qu, S.X. A study of the pesticide fenthion: Toxicity, mutagenicity, and influence on tissue enzymes. Biomed. Environ. Sci. 1990, 3, 262–275. [Google Scholar]
- Berrada, H.; Fernández, M.; Ruiz, M.-J.; Moltó, J.C.; Mañes, J.; Franzón, M.F. Exposure assessment of fruits contaminated with pesticide residues from Valencia, 2001– 03. Food Addit. Contam. 2006, 23, 674–682. [Google Scholar] [CrossRef]
- Tsatsakis, A.; Tsakiris, I.N.; Tzatzarakis, M.N.; Agourakis, Z.B.; Tutudaki, M.; Alegakis, A. Three-year study of fenthion and dimethoate pesticides in olive oil from organic and conventional cultivation. Food Addit. Contam. 2003, 20, 553–559. [Google Scholar] [CrossRef]
- Francis, J.I.; Barnes, J.M. Studies on the mammalian toxicity of fenthion. Bull. World Heal. Organ. 1963, 29, 205–212. [Google Scholar]
- FAO/WHO. Fenthion. 1995. Available online: http://www.inchem.org/documents/jmpr/jmpmono/v95pr21.htm (accessed on 21 April 2020).
- WHO/FAO. Evaluations of Some Pesticide Residues in Food: The Monographs; 9241665017; World Health Organization: Geneva, Switzerland, 1972; Available online: https://apps.who.int/iris/handle/10665/38338 (accessed on 21 April 2020).
- Minelli, E.V.; Cabras, P.; Angioni, A.; Garau, V.L.; Melis, M.; Pirisi, F.M.; Cabitza, F.; Cubeddu, M. Persistence and Metabolism of Fenthion in Orange Fruit. J. Agric. Food Chem. 1996, 44, 936–939. [Google Scholar] [CrossRef]
- Picó, Y.; Farré, M.; Soler, C.; Barceló, J. Confirmation of Fenthion Metabolites in Oranges by IT-MS and QqTOF-MS. Anal. Chem. 2007, 79, 9350–9363. [Google Scholar] [CrossRef]
- Codex Alimentarius, Codex pesticides residues in food online database. Codex Alimentarius. 2018. Available online: http://www.fao.org/fao-who-codexalimentarius/codex-texts/dbs/pestres/pesticide-detail/en/?p_id=39 (accessed on 21 April 2020).
- Cabras, P.; Garau, V.L.; Melis, M.; Pirisi, F.M.; Spanedda, L. Persistence and fate of fenthion in olives and olive products. J. Agric. Food Chem. 1993, 41, 2431–2433. [Google Scholar] [CrossRef]
- Lentza-Rizos, C.; Avramides, E.J. Determination of residues of fenthion and its oxidative metabolites in olive oil. Analyst 1990, 115, 1037. [Google Scholar] [CrossRef]
- Kyriakidis, N.V.; Pappas, C.; Athanasopoulos, P. Degradation of fenthion and fenthion sulfoxide on grapes on the vines and during refrigerated storage. Food Chem. 2005, 91, 241–245. [Google Scholar] [CrossRef]
- Tsakirakis, A.; Machera, K. Determination of fenthion and oxidation products in personal protection equipment by gas chromatography. J. Chromatogr. A 2007, 1171, 98–103. [Google Scholar] [CrossRef]
- Wright, F.C.; Riner, J.C. Method to determine fenthion and five oxidative metabolites in fat. J. Agric. Food Chem. 1978, 26, 1258–1259. [Google Scholar] [CrossRef]
- Galeano-Díaz, T.; Cabanillas, A.G.; Lopezsoto, M.; Ortiz, J.; Soto, M.L. Determination of fenthion and fenthion-sulfoxide, in olive oil and in river water, by square-wave adsorptive-stripping voltammetry. Talanta 2008, 76, 809–814. [Google Scholar] [CrossRef]
- Zambonin, C.; Losito, I.; Cilenti, A.; Palmisano, F. Solid-phase microextraction coupled to gas chromatography-mass spectrometry for the study of soil adsorption coefficients of organophosphorus pesticides. J. Environ. Monit. 2002, 4, 477–481. [Google Scholar] [CrossRef]
- Meyer, F.; Harrison, A.G. A Mechanism for Tropylium Ion Formation by Electron Impact. J. Am. Chem. Soc. 1964, 86, 4757–4761. [Google Scholar] [CrossRef]
- Periat, A.; Kohler, I.; Bugey, A.; Bieri, S.; Versace, F.; Staub, C.; Guillarme, D. Hydrophilic interaction chromatography versus reversed phase liquid chromatography coupled to mass spectrometry: Effect of electrospray ionization source geometry on sensitivity. J. Chromatogr. A 2014, 1356, 211–220. [Google Scholar] [CrossRef]
- Kostiainen, R.; Kauppila, T.J. Effect of eluent on the ionization process in liquid chromatography–mass spectrometry. J. Chromatogr. A 2009, 1216, 685–699. [Google Scholar] [CrossRef]
- Johnson, D.; Boyes, B.; Orlando, R. The Use of Ammonium Formate as a Mobile-Phase Modifier for LC-MS/MS Analysis of Tryptic Digests. J. Biomol. Tech. JBT 2013, 24, 187–197. [Google Scholar] [CrossRef] [PubMed] [Green Version]
- Anastassiades, M.; Scherbaum, E.; Tadelen, B.; Tajnbaher, D.; Tasdelen, B.; Stajnbaher, D. Recent Developments in QuEChERS Methodology for Pesticide Multiresidue Analysis. In Pesticide Chemistry; Wiley: Hoboken, NJ, USA, 2007; pp. 439–458. [Google Scholar]
- Guidance Document on Analytical Quality Control and Method Validation Procedures for Pesticide Residues and Analysis in Food and Feed. 2017. Available online: https://ec.europa.eu/food/sites/food/files/plant/docs/pesticides_mrl_guidelines_wrkdoc_2017-11813.pdf (accessed on 21 April 2020).
- Ministry of Food and Drug Safety, Pesticides and Veterinary Drugs Information. 2019. Available online: https://www.foodsafetykorea.go.kr/residue/main.do (accessed on 21 April 2020).
- Abbas, M.S.; Soliman, A.S.; El-Gammal, H.A.; Amer, M.E.; Attallah, E.R. Development and validation of a multiresidue method for the determination of 323 pesticide residues in dry herbs using QuEChERS method and LC-ESI-MS/MS. Int. J. Environ. Anal. Chem. 2017, 97, 1003–1023. [Google Scholar] [CrossRef]
- Kwon, H.; Lehotay, S.J.; Asteggiante, L.G. Variability of matrix effects in liquid and gas chromatography–mass spectrometry analysis of pesticide residues after QuEChERS sample preparation of different food crops. J. Chromatogr. A 2012, 1270, 235–245. [Google Scholar] [CrossRef] [PubMed]
- Mastovska, K.; Lehotay, S.J.; Anastassiades, M. Combination of Analyte Protectants to Overcome Matrix Effects in Routine GC Analysis of Pesticide Residues in Food Matrixes. Anal. Chem. 2005, 77, 8129–8137. [Google Scholar] [CrossRef] [PubMed]
- Cho, J.; Lee, J.; Lim, C.-U.; Ahn, J. Quantification of pesticides in food crops using QuEChERS approaches and GC-MS/MS. Food Addit. Contam. Part A 2016, 33, 1803–1816. [Google Scholar] [CrossRef] [PubMed]
- Shin, Y.; Lee, J.; Kim, J.-H. A simultaneous multiresidue analysis for 203 pesticides in soybean using florisil solid-phase extraction and gas chromatography–tandem mass spectrometry. Appl. Boil. Chem. 2018, 61, 543–548. [Google Scholar] [CrossRef] [Green Version]
- Kittlaus, S.; Schimanke, J.; Kempe, G.; Speer, K. Assessment of sample cleanup and matrix effects in the pesticide residue analysis of foods using postcolumn infusion in liquid chromatography–tandem mass spectrometry. J. Chromatogr. A 2011, 1218, 8399–8410. [Google Scholar] [CrossRef]
- Gosetti, F.; Mazzucco, E.; Zampieri, D.; Gennaro, M.C. Signal suppression/enhancement in high-performance liquid chromatography tandem mass spectrometry. J. Chromatogr. A 2010, 1217, 3929–3937. [Google Scholar] [CrossRef]
Sample Availability: Samples of the compounds are not available from the authors. |


| Compound | tR a (min) | Molecular Mass (g/mol) | Precursor Ion > Production (CE b Voltage) | |
|---|---|---|---|---|
| Quantification Transition | Qualification Transition | |||
| Fenthion | 4.92 | 278 | 279.0 > 247.0 (−13) | 279.0 > 169.0 (−19) |
| Fenthion Sulfone | 4.35 | 310 | 311.0 > 125.0 (−21) | 311.0 > 109.0 (−26) |
| Fenthion Sulfoxide | 4.30 | 294 | 295.0 > 280.0 (−19) | 295.0 > 109.0 (−33) |
| Fenthion Oxon | 4.58 | 262 | 263.0 > 231.0 (−17) | 263.0 > 216.0 (−24) |
| Fenthion Oxon Sulfone | 4.32 | 294 | 295.0 > 217.0 (−20) | 295.0 > 104.0 (−28) |
| Fenthion Oxon Sulfoxide | 3.84 | 278 | 279.0 > 264.0 (−19) | 279.0 > 104.0 (−29) |
| Compound | Spiked Level (mg/kg) | Average Recovery % (RSD a%) | ||||
|---|---|---|---|---|---|---|
| Brown Rice | Chili Pepper | Orange | Potato | Soybean | ||
| Fenthion | 0.01 | 76.8 (5.1) | 98.1 (9.9) | 76.9 (5.8) | 75.0 (8.1) | 86.9 (0.5) |
| 0.1 | 77.1 (8.7) | 82.4 (9.8) | 87.1 (3.7) | 95.1 (9.6) | 89.5 (3.0) | |
| 0.2 | 70.3 (1.0) | 83.6 (5.5) | 94.0 (7.4) | 100.0 (9.4) | 83.9 (4.5) | |
| Fenthion Oxon | 0.01 | 95.5 (2.8) | 100.0 (2.1) | 106.1 (5.2) | 85.3 (4.6) | 71.9 (4.4) |
| 0.1 | 96.7 (3.7) | 88.7 (4.8) | 97.3 (1.9) | 90.2 (6.7) | 94.0 (2.5) | |
| 0.2 | 92.8 (5.2) | 88.0 (3.9) | 99.4 (5.6) | 98.6 (4.7) | 94.9 (11.2) | |
| Fenthion Oxon Sulfone | 0.01 | 102.6 (9.6) | 98.1 (1.9) | 102.0 (8.6) | 115.9 (14.0) | 89.1 (6.9) |
| 0.1 | 106.3 (9.1) | 96.9 (3.4) | 102.0 (5.7) | 118.2 (4.4) | 115.3 (0.6) | |
| 0.2 | 104.5 (7.3) | 93.9 (3.5) | 93.8 (9.1) | 105.5 (1.8) | 110.3 (4.2) | |
| Fenthion Oxon Sulfoxide | 0.01 | 91.8 (0.8) | 94.0 (1.7) | 79.8 (12.9) | 96.0 (2.8) | 108.9 (6.0) |
| 0.1 | 92.6 (2.0) | 95.1 (5.2) | 94.2 (4.7) | 98.0 (1.4) | 114.0 (1.8) | |
| 0.2 | 91.5 (2.9) | 91.3 (3.1) | 86.5 (9.2) | 91.4 (0.2) | 92.9 (3.2) | |
| Fenthion Sulfone | 0.01 | 101.3 (9.0) | 85.8 (8.7) | 83.2 (15.0) | 113.9 (10.3) | 90.9 (10.4) |
| 0.1 | 105.3 (7.8) | 94.4 (7.7) | 99.6 (8.5) | 103.6 (5.9) | 106.2 (2.8) | |
| 0.2 | 102.8 (5.6) | 88.3 (8.9) | 98.4 (7.6) | 116.2 (14.7) | 101.7 (3.6) | |
| Fenthion Sulfoxide | 0.01 | 100.7 (9.9) | 98.4 (1.5) | 100.8 (12.1) | 105.1 (8.8) | 96.3 (9.7) |
| 0.1 | 104.9 (10.9) | 97.1 (4.1) | 102.9 (5.9) | 118.1 (4.8) | 116.0 (0.2) | |
| 0.2 | 105.3 (7.7) | 95.8 (2.8) | 95.5 (8.5) | 102.6 (1.2) | 111.1 (4.6) | |
© 2020 by the authors. Licensee MDPI, Basel, Switzerland. This article is an open access article distributed under the terms and conditions of the Creative Commons Attribution (CC BY) license (http://creativecommons.org/licenses/by/4.0/).
Share and Cite
Lee, J.; Kim, J.-H. Simultaneous Analysis of Fenthion and Its Five Metabolites in Produce Using Ultra-High Performance Liquid Chromatography-Tandem Mass Spectrometry. Molecules 2020, 25, 1938. https://doi.org/10.3390/molecules25081938
Lee J, Kim J-H. Simultaneous Analysis of Fenthion and Its Five Metabolites in Produce Using Ultra-High Performance Liquid Chromatography-Tandem Mass Spectrometry. Molecules. 2020; 25(8):1938. https://doi.org/10.3390/molecules25081938
Chicago/Turabian StyleLee, Jonghwa, and Jeong-Han Kim. 2020. "Simultaneous Analysis of Fenthion and Its Five Metabolites in Produce Using Ultra-High Performance Liquid Chromatography-Tandem Mass Spectrometry" Molecules 25, no. 8: 1938. https://doi.org/10.3390/molecules25081938