Abstract
In this work, we measured the intensities of Q-branches of the ν1, ν2 and ν3 bands in the polarized and depolarized methane Raman spectra in the pressure range of 1–60 atm. It was established that the pressure dependence of depolarization ratios of the ν2 and ν3 bands are negligible. In turn, the depolarization ratio of the ν1 band increases with increasing pressure and reaches approximately 0.0045 at 60 atm. These data are more precise than previously published ones because ν1 band intensities were determined taking into account the contribution of overlapping lines of ν3 band. The presented data will be useful in calculating the methane polarizabilities at high pressure, as well as in calculating methane Raman spectra for measuring the natural gas composition using Raman spectroscopy.
1. Introduction
Methane is one of the most abundant molecules on Earth. It is present in atmospheric air, often found in inclusions in minerals, and is also the dominant component of natural gas. Development of Raman gas analysis [1,2,3,4,5,6,7,8,9] brings up the need of information that allows taking into account changes in the methane Raman spectrum under various conditions (temperature, pressure, environment). At present, shifts and broadenings of its fundamental bands [10,11,12,13,14,15], as well as changes in the ratio of peak intensities [13,15,16,17] are known. One of the important characteristics of the Raman bands, along with the position, half-width, and scattering cross-section, is the depolarization ratio (ρ). This value characterizes the symmetry of the vibrations and is defined as the ratio I⊥/I‖, where I⊥ and I‖ are the Raman intensities with orthogonal and parallel orientation of the polarization plane to the polarization plane of the exciting radiation, respectively. As a rule, the higher the symmetry, the lower the degree of depolarization. On the one hand, measuring the depolarization ratio makes it possible to detect intermolecular interactions that lead to distortion of the symmetry of the molecule [18,19]. On the other hand, the exact values of depolarization ratios obtained from the experiment can be used to verify the polarizabilities of the molecules, which, in turn, are the basis for calculating the line intensities.
It is known that in the methane Raman spectrum, the fundamental ν1 band (symmetric C–H stretching mode, 2917 cm−1) is polarized, i.e., ρ = 0, and ν2 (bending mode, 1534 cm−1), ν3 (asymmetric C–H stretching mode, 3020 cm−1), and ν4 (bending mode, 1306 cm−1) are depolarized bands, i.e., ρ = 0.75 [20]. These data are correct for low pressure, when the molecules do not significantly affect each other. Rose et al. [21] and Wright et al. [22] showed that the depolarization ratio of ν1 in pure methane increases with pressure in the range of 1–1000 bar. The main disadvantage of these works is the low signal-to-noise ratio of the experimental setups used, and as a consequence, the high uncertainty of the measured values. The aim of this work is to obtain the depolarization ratios of both the ν1 band and the ν2 and ν3 bands in the pressure range of 1–60 atm using an experimental setup with higher sensitivity.
2. Experiment
For research, a Raman spectrometer based on the 90 degree geometry of scattered light collection was used [1]. The gas cell represented a hollow metal cube with a volume of approximately10 cm3 having three fused silica windows. A solid-state laser with a wavelength of 532 nm and a power of 1500 mW was used as an excitation source. To collect the scattered light, two f/1.8-lens objectives were used. A holographic notch-filter and a polarizer were installed between them. Rotation of the polarizer allowed us to register radiation with the desired polarization plane. To record Raman spectra, we used an f/1.8-spectrometer equipped with a Hamamatsu CCD array (2048 × 256 pix) with thermoelectric cooling to − 10 °C. Using a diffraction grating of 1600 lines/mm provides simultaneous record of spectrum in the range of 200–3800 cm−1 with a dispersion of approximately 1.8 cm−1/pixel. Wavenumber calibration was performed using the emission spectrum of neon [23].
Raman spectra of methane were recorded on the equipment described above at pressures from 1 to 60 atm with a step of 5 atm. For each pressure, polarized (I‖) and depolarized (I⊥) spectra were recorded. The exposure time at a pressure of 1 atm was 500 s, and for all other pressures it was 100 s. The gas temperature and the air temperature in the laboratory during all experiments were maintained at a level of 298 ± 1 K. The change in gas pressure in the cell during the recording of two spectra with different polarizations was no more than 0.01 atm at a pressure of 1 atm, and no more than 0.1 atm at a pressure of 60 atm. The error of the pressure gauge used was less than 0.1%.
3. Results and Discussion
Figure 1 shows the polarized and depolarized methane Raman spectra. It can be seen that only the ν2, ν3 and, in part, 2ν4 bands (F2 and E symmetry species [24]) are present in the depolarized spectrum. To obtain the depolarization ratios, the integrated intensities of the Q-branches of ν1, ν2, and ν3 bands in each spectrum were obtained. The intensity of ν4 band was too weak to measure. Integration was carried out in the ranges of 2888–2938 cm−1, 1515–1555 cm−1, and 2990–3040 cm−1 for the ν1, ν2 and ν3 bands, respectively. As shown in Figure 2, the pressure dependence of depolarization ratio of the ν2 and ν3 bands is negligible. In turn, the depolarization ratio of the ν1 band increases with pressure.
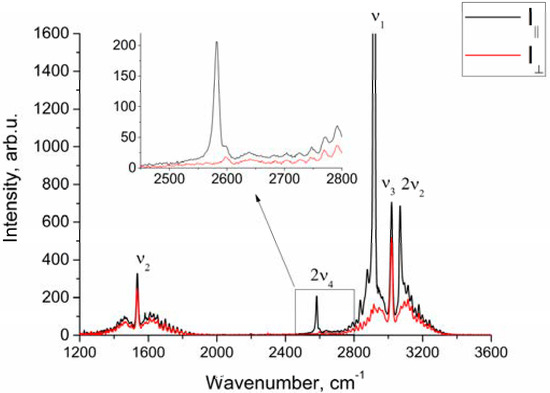
Figure 1.
Polarized and depolarized methane Raman spectra at P = 50 atm.
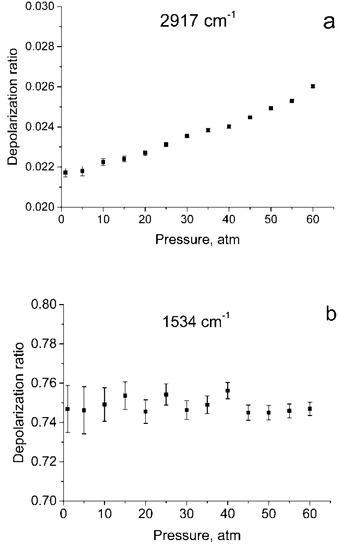
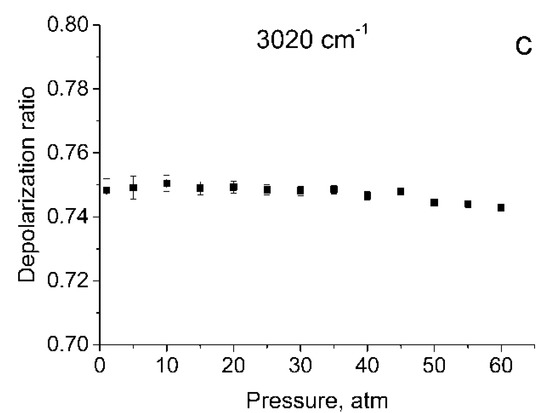
Figure 2.
Depolarization ratios for ν1 (a), ν2 (b), and ν3 (c) bands as a function of pressure.
The error bars shown in Figure 2 were calculated as follows. We believe that in our case, the main source of the error in measuring ρ is the signal fluctuations caused by shot noise and detector noise. To determine these fluctuations, we have additionally recorded five methane Raman spectra at pressures of 1 and 60 atm. From the spectra obtained, standard deviations were estimated of the integral intensities δP in the specified spectral ranges for these pressures. For other pressure values, δP were estimated by interpolating these data. The errors in measuring the depolarization ratio at each P (∆P) were estimated using Equation (1)
where is the integrated intensities in the polarized spectrum obtained at this pressure.
As seen from Figure 1, in the region of 2917 cm–1, the ν1 band overlaps with the lines of the O-branch of the ν3 band. This means that the obtained integrated intensities of ν1 band are somewhat different from the true ones. Therefore, the depolarization ratios for ν1 () shown in Figure 2a, have been calculated with an error and should be improved.
An analysis of the depolarized spectra showed that the peak in the region of 2916–2917 cm−1 increases with pressure, as shown in Figure 3. This peak belongs to ν1 band. We estimated changes in the integrated intensities in the range of 2888–2938 cm−1 for polarized and depolarized spectra at different pressures. For this purpose, intensities at each pressure (IP) have been converted into intensities corresponding to the densities of molecules at 1 atm () using Equation (2):
where Z(P) is the methane compressibility factor at T = 298 K, which is a function of pressure. The virial coefficients for calculating Z(P) were taken from [25].
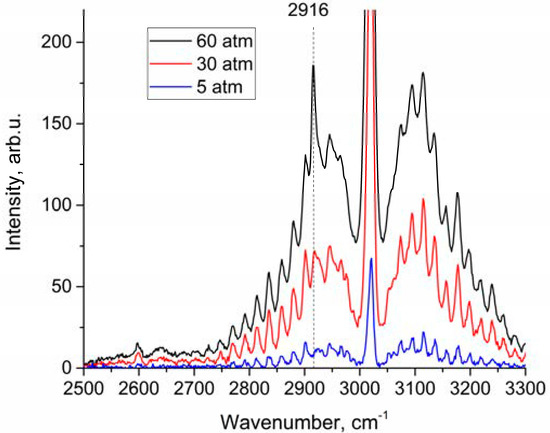
Figure 3.
Depolarized methane Raman spectra at 5, 30, and 60 atm.
According to the data shown in Figure 4, both a decrease in intensity in the polarized spectrum and an increase in intensity in the depolarized spectrum are observed. This results from lower methane molecule symmetry at high pressure [21,22]. To verify the fact that the increase in the intensity in Figure 4b is not due to the features of the experiment, Figure 5 shows the dependence of the integrated intensity of the depolarized spectrum of the ν3 band in the range of 2820–2870 cm−1 where there are no ν1 lines. Referring to this figure, the intensities after normalization per unit of density is stable. Thus, the data presented in Figure 4b are correct. Note that, as shown in Figure 4, the increase in intensity in the depolarized spectrum is less than its decrease in the polarized one. Taking into account that the intensity ratio of the 2ν4/ν1 and 2ν2/ν1 increases with increasing pressure [13], it can be assumed that the decrease in the ν1 intensity in the polarized spectrum is caused not only by intensity redistribution to the depolarized spectrum, but also to 2ν4 and 2ν2 overtones by means of Fermi resonance [24].
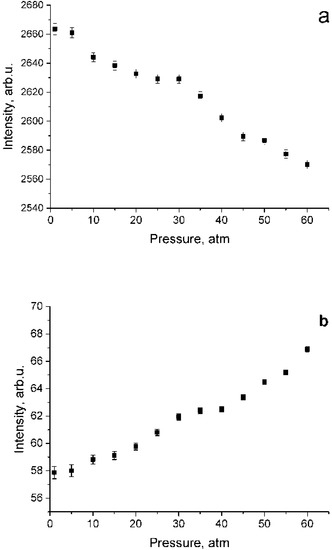
Figure 4.
Pressure dependence of integrated intensities in the range of 2890–2940 cm−1 for polarized (a) and depolarized (b) methane spectra which were normalized using Equation (2).
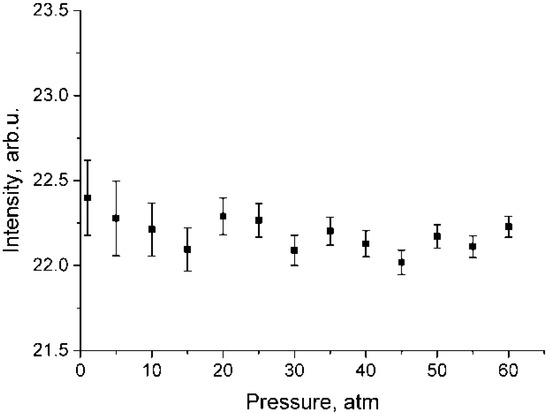
Figure 5.
Pressure dependence of integrated intensities of ν3 band in the range of 2820–2870 cm−1 for depolarized methane spectra which were normalized using Equation (2).
The data given in Figure 4b are the sum of intensities of ν1 and ν3 bands. Thus, they can be represented using Equation (3):
where and are the intensities for the ν1 and ν3 bands in the depolarized spectrum, respectively. As seen from Figure 5, pressure dependence of is negligible. In addition, according to the calculations [26], at P = 1 atm, = 0, therefore, = 0 and . Having this in mind, we calculated . The for various pressures were calculated using Equation (4).
As follows from Figure 6, the depolarization ratio increases significantly less compared to the data of Rose et al. [21]. In the studied pressure range, an increase in is close to a linear dependence. According to [21], increases with pressure up to approximately 1000 atm. In practice, to analyze the composition of natural gas, it is necessary to take into account changes in spectroscopic characteristics in the pressure range of 1–100 atm. We believe that at any pressure from this range can be estimated using the function presented in Figure 6.
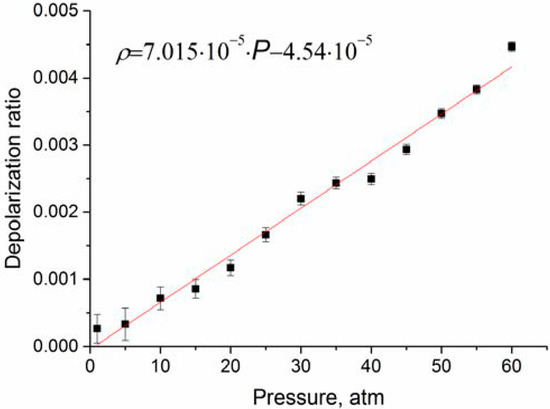
Figure 6.
Depolarization ratio of ν1 band obtained after correction of the intensities to the contribution of the ν3 lines.
4. Conclusions
The performed studies showed that the dependence of depolarization ratios of the ν2 and ν3 bands on pressure is negligible. In turn, the degree of depolarization of the ν1 band increases with pressure and reaches approximately 0.0045 at 60 atm. These data are significantly lower than those published earlier. This is explained by the fact that in our work we used an experimental setup with higher sensitivity, and also took into account the contribution of the lines of the ν3 band located in the region of 2916–2917 cm−1. We believe that the obtained data on the pressure dependence of the depolarization ratio, as well as changes in the intensities of the polarized and depolarized spectrum of methane, will improve the accuracy of the calculation of methane polarizabilities. These data will be useful in calculating the Raman spectra of methane at different pressures for analysis of natural gas composition using Raman spectroscopy.
Funding
The work was supported by the Russian Science Foundation (RSF), grant No. 19-77-10046.
Conflicts of Interest
The author declares no conflicts of interest.
References
- Petrov, D.V.; Matrosov, I.I. Raman Gas Analyzer (RGA): Natural Gas Measurements. Appl. Spectrosc. 2016, 70, 1770–1776. [Google Scholar] [CrossRef] [PubMed]
- Petrov, D.V.; Matrosov, I.I.; Tikhomirov, A.A. High-Sensitivity Spontaneous Raman Spectrometer for Gaseous Media. J. Appl. Spectrosc. 2015, 82, 120–124. [Google Scholar] [CrossRef]
- Hippler, M. Cavity-Enhanced Raman Spectroscopy of Natural Gas with Optical Feedback cw-Diode Lasers. Anal. Chem. 2015, 87, 7803–7809. [Google Scholar] [CrossRef] [PubMed]
- Sandfort, V.; Trabold, B.; Abdolvand, A.; Bolwien, C.; Russell, P.; Wöllenstein, J.; Palzer, S. Monitoring the Wobbe Index of Natural Gas Using Fiber-Enhanced Raman Spectroscopy. Sensors 2017, 17, 2714. [Google Scholar] [CrossRef] [PubMed]
- Sieburg, A.; Schneider, S.; Yan, D.; Popp, J.; Frosch, T. Monitoring of gas composition in a laboratory biogas plant using cavity enhanced Raman spectroscopy. Analyst 2018, 143, 1358–1366. [Google Scholar] [CrossRef]
- Gao, Y.; Dai, L.-K.; Zhu, H.-D.; Chen, Y.-L.; Zhou, L. Quantitative Analysis of Main Components of Natural Gas Based on Raman Spectroscopy. Chinese J. Anal. Chem. 2019, 47, 67–76. [Google Scholar] [CrossRef]
- Gomez Velez, J.; Muller, A. Trace gas sensing using diode-pumped collinearly detected spontaneous Raman scattering enhanced by a multipass cell. Opt. Lett. 2020, 45, 133. [Google Scholar] [CrossRef]
- Sharma, R.; Poonacha, S.; Bekal, A.; Vartak, S.; Weling, A.; Tilak, V.; Mitra, C. Raman analyzer for sensitive natural gas composition analysis. Opt. Eng. 2016, 55, 104103. [Google Scholar] [CrossRef]
- Dąbrowski, K.M.; Kuczyński, S.; Barbacki, J.; Włodek, T.; Smulski, R.; Nagy, S. Downhole measurements and determination of natural gas composition using Raman spectroscopy. J. Nat. Gas Sci. Eng. 2019, 65, 25–31. [Google Scholar] [CrossRef]
- Lin, F.; Bodnar, R.J.; Becker, S.P. Experimental determination of the Raman CH4 symmetric stretching (ν1) band position from 1–650 bar and 0.3–22 °C: Application to fluid inclusion studies. Geochim. Cosmochim. Acta 2007, 71, 3746–3756. [Google Scholar] [CrossRef]
- Petrov, D.V. Raman Spectrum of Methane in the Range 20–40 °C. J. Appl. Spectrosc. 2017, 84, 420–424. [Google Scholar] [CrossRef]
- Lin, F.; Sum, A.K.; Bodnar, R.J. Correlation of methane Raman ν1 band position with fluid density and interactions at the molecular level. J. Raman Spectrosc. 2007, 38, 1510–1515. [Google Scholar] [CrossRef]
- Petrov, D.V. Pressure dependence of peak positions, half widths, and peak intensities of methane Raman bands (ν2, 2ν4, ν1, ν3, and 2ν2). J. Raman Spectrosc. 2017, 48, 1426–1431. [Google Scholar] [CrossRef]
- Shang, L.; Chou, I.-M.; Burruss, R.C.; Hu, R.; Bi, X. Raman spectroscopic characterization of CH4 density over a wide range of temperature and pressure. J. Raman Spectrosc. 2014, 45, 696–702. [Google Scholar] [CrossRef]
- Petrov, D.V. Raman spectrum of methane in nitrogen, carbon dioxide, hydrogen, ethane, and propane environments. Spectrochim. Acta Part A Mol. Biomol. Spectrosc. 2018, 191, 573–578. [Google Scholar] [CrossRef]
- Wang, M.; Lu, W.; Li, L.; Qiao, S. Pressure and Temperature Dependence of the Raman Peak Intensity Ratio of Asymmetric Stretching Vibration (ν3) and Asymmetric Bending Overtone (2ν2) of Methane. Appl. Spectrosc. 2014, 68, 536–540. [Google Scholar] [CrossRef]
- Brunsgaard Hansen, S.; Berg, R.W.; Stenby, E.H. How to determine the pressure of a methane-containing gas mixture by means of two weak Raman bands, ν3 and 2ν2. J. Raman Spectrosc. 2002, 33, 160–164. [Google Scholar] [CrossRef]
- Saito, Y.; Ishibashi, T.; Hamaguchi, H. Polarization-resolved coherent anti-Stokes Raman scattering (CARS) spectroscopy: A new probe of molecular symmetry through accurate determination of the Raman depolarization ratio. J. Raman Spectrosc. 2000, 31, 725–730. [Google Scholar] [CrossRef]
- Ikawa, S.; Whalley, E. Effect of pressure on the raman depolarization ratio and the vibrational relaxation of the v1 mode of liquid carbon tetrachloride at 22°C and 0–1.1 kbar. Mol. Phys. 1992, 75, 659–667. [Google Scholar] [CrossRef]
- Thomas, M.A.; Welsh, H.L. The Raman spectrum of methane. Can. J. Phys. 1960, 38, 1291–1303. [Google Scholar] [CrossRef]
- Rose, E.J.; Whitewolf, E.; Baglin, F.G. Isothermal density tuning of the depolarization ratios from the v1 mode of methane. J. Chem. Phys. 1992, 97, 4596–4604. [Google Scholar] [CrossRef]
- Wright, M.; Murphy, T.; Baglin, F.G. Isosteric and isothermal studies of the raman depolarization ratios in an argon-methane mixture at 298 K and 323 K. Mol. Phys. 1994, 82, 277–282. [Google Scholar] [CrossRef]
- Petrov, D.V.; Matrosov, I.I.; Sedinkin, D.O.; Zaripov, A.R. Wavenumber calibration of a multichannel Raman spectrometer. Proc. SPIE 2017, 10466, 1046606. [Google Scholar]
- Lolck, J.E.; Robiette, A.G. A theoretical model for the interacting upper states of the ν1, ν3, 2ν2, ν2 + ν4, and 2ν4 bands in methane. J. Mol. Spectrosc. 1981, 88, 14–29. [Google Scholar] [CrossRef]
- Dymond, J.H.; Marsh, K.N.; Wilhoit, R.C.; Wong, K.C. Virial Coefficients of Pure Gases and Mixtures; Frenke, M., Marsh, K.N., Eds.; Springer: Berlin, Germany, 2003. [Google Scholar]
- Abbate, S.; Gussoni, M.; Zerbi, G. Raman intensities of methanes from electrooptical parameters. J. Mol. Spectrosc. 1978, 73, 415–429. [Google Scholar] [CrossRef]


© 2020 by the author. Licensee MDPI, Basel, Switzerland. This article is an open access article distributed under the terms and conditions of the Creative Commons Attribution (CC BY) license (http://creativecommons.org/licenses/by/4.0/).