
Study on the Mechanism of Ionic Liquids Improving the Extraction Efficiency of Essential Oil Based on Experimental Optimization and Density Functional Theory: The Fennel (Foeniculi fructus) Essential Oil Case

 , ,
, ,
Abstract
:
1. Introduction
2. Experiment
2.1. Materials and Chemicals
2.2. Extraction Procedure of Essential Oil from Foeniculi Fructus
2.3. DoE for the Extraction Process
2.3.1. Kinetic Model
2.3.2. DoE for MILT-HD
2.4. GC-MS Analysis of Essential Oil
2.5. Fourier Transforms Infrared Spectroscopy (FTIR)
2.6. Scanning Electron Microscopy (SEM)
2.7. Quantum Chemical Calculations
2.8. Data Analysis
3. Results and Discussion
3.1. Quantification of the Critical Operating Parameters Affecting the Extraction Process
3.1.1. Critical Operating Parameters Affecting the Yeo
3.1.2. Multiple Objective Optimization and Verification
3.2. GC-MS Analysis
3.3. Energy Demands and CO2 Emission
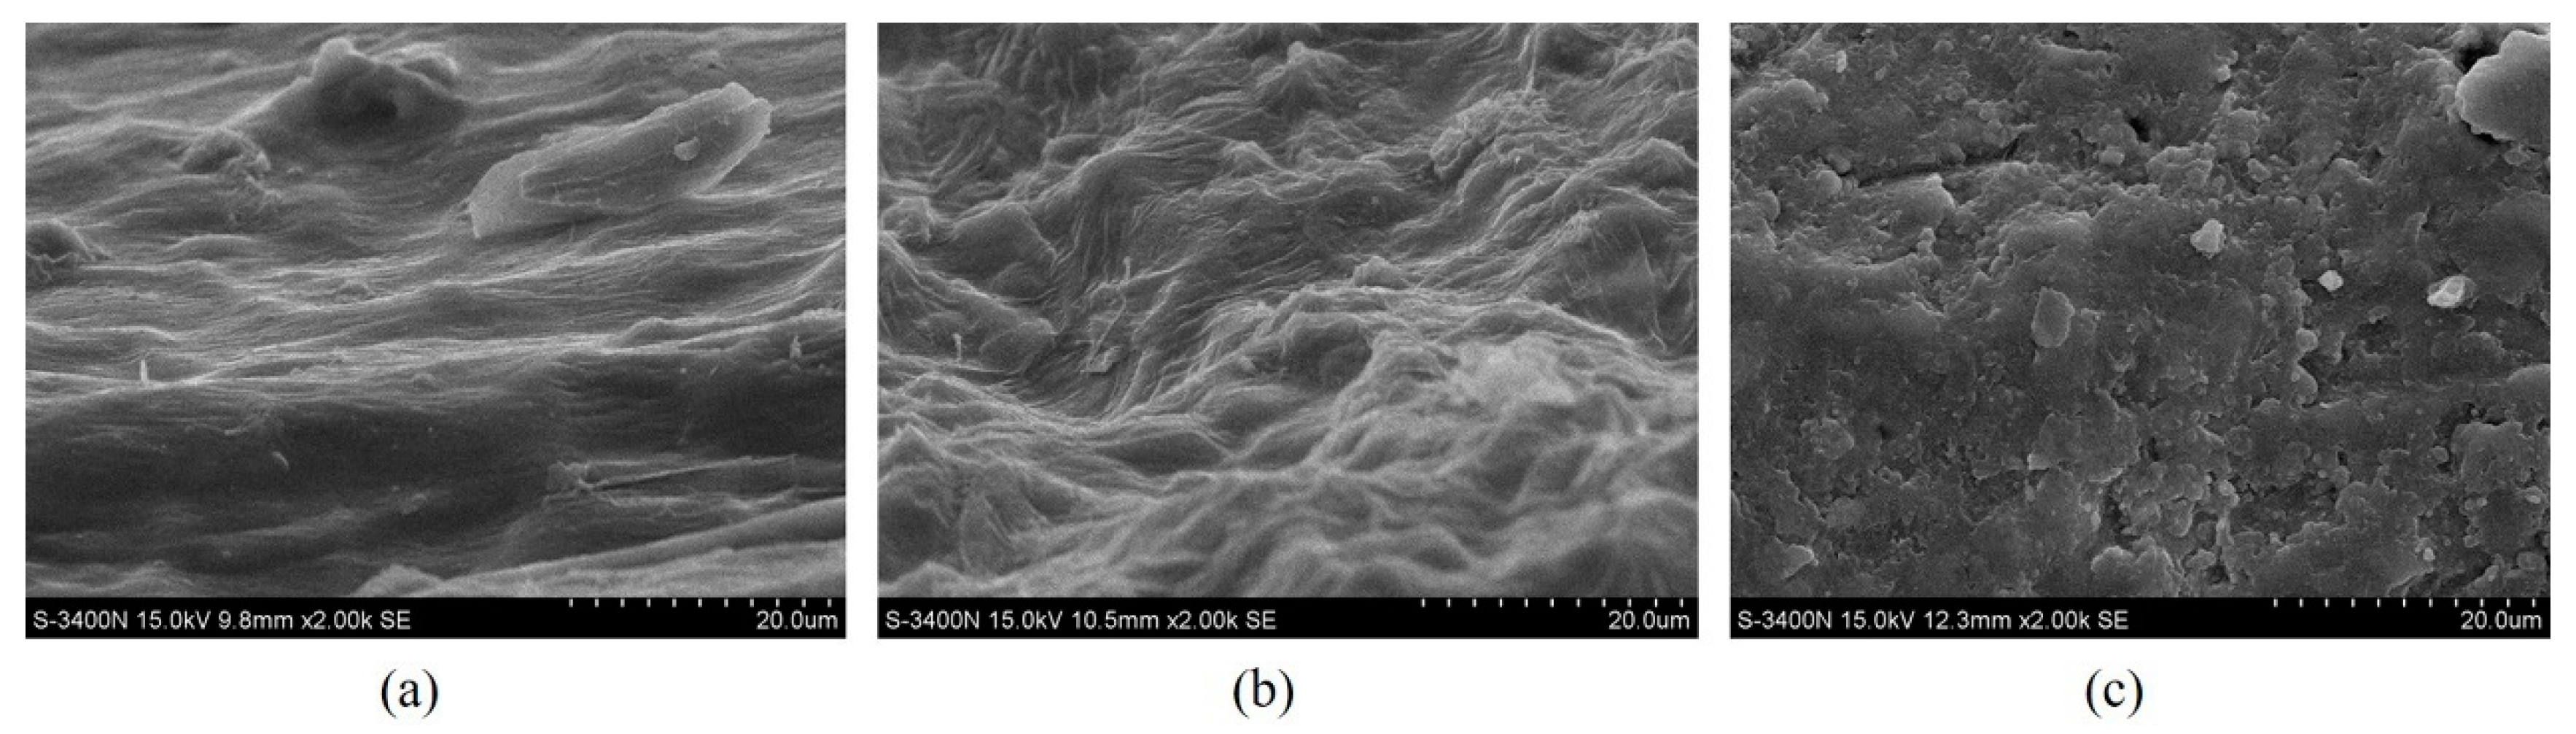
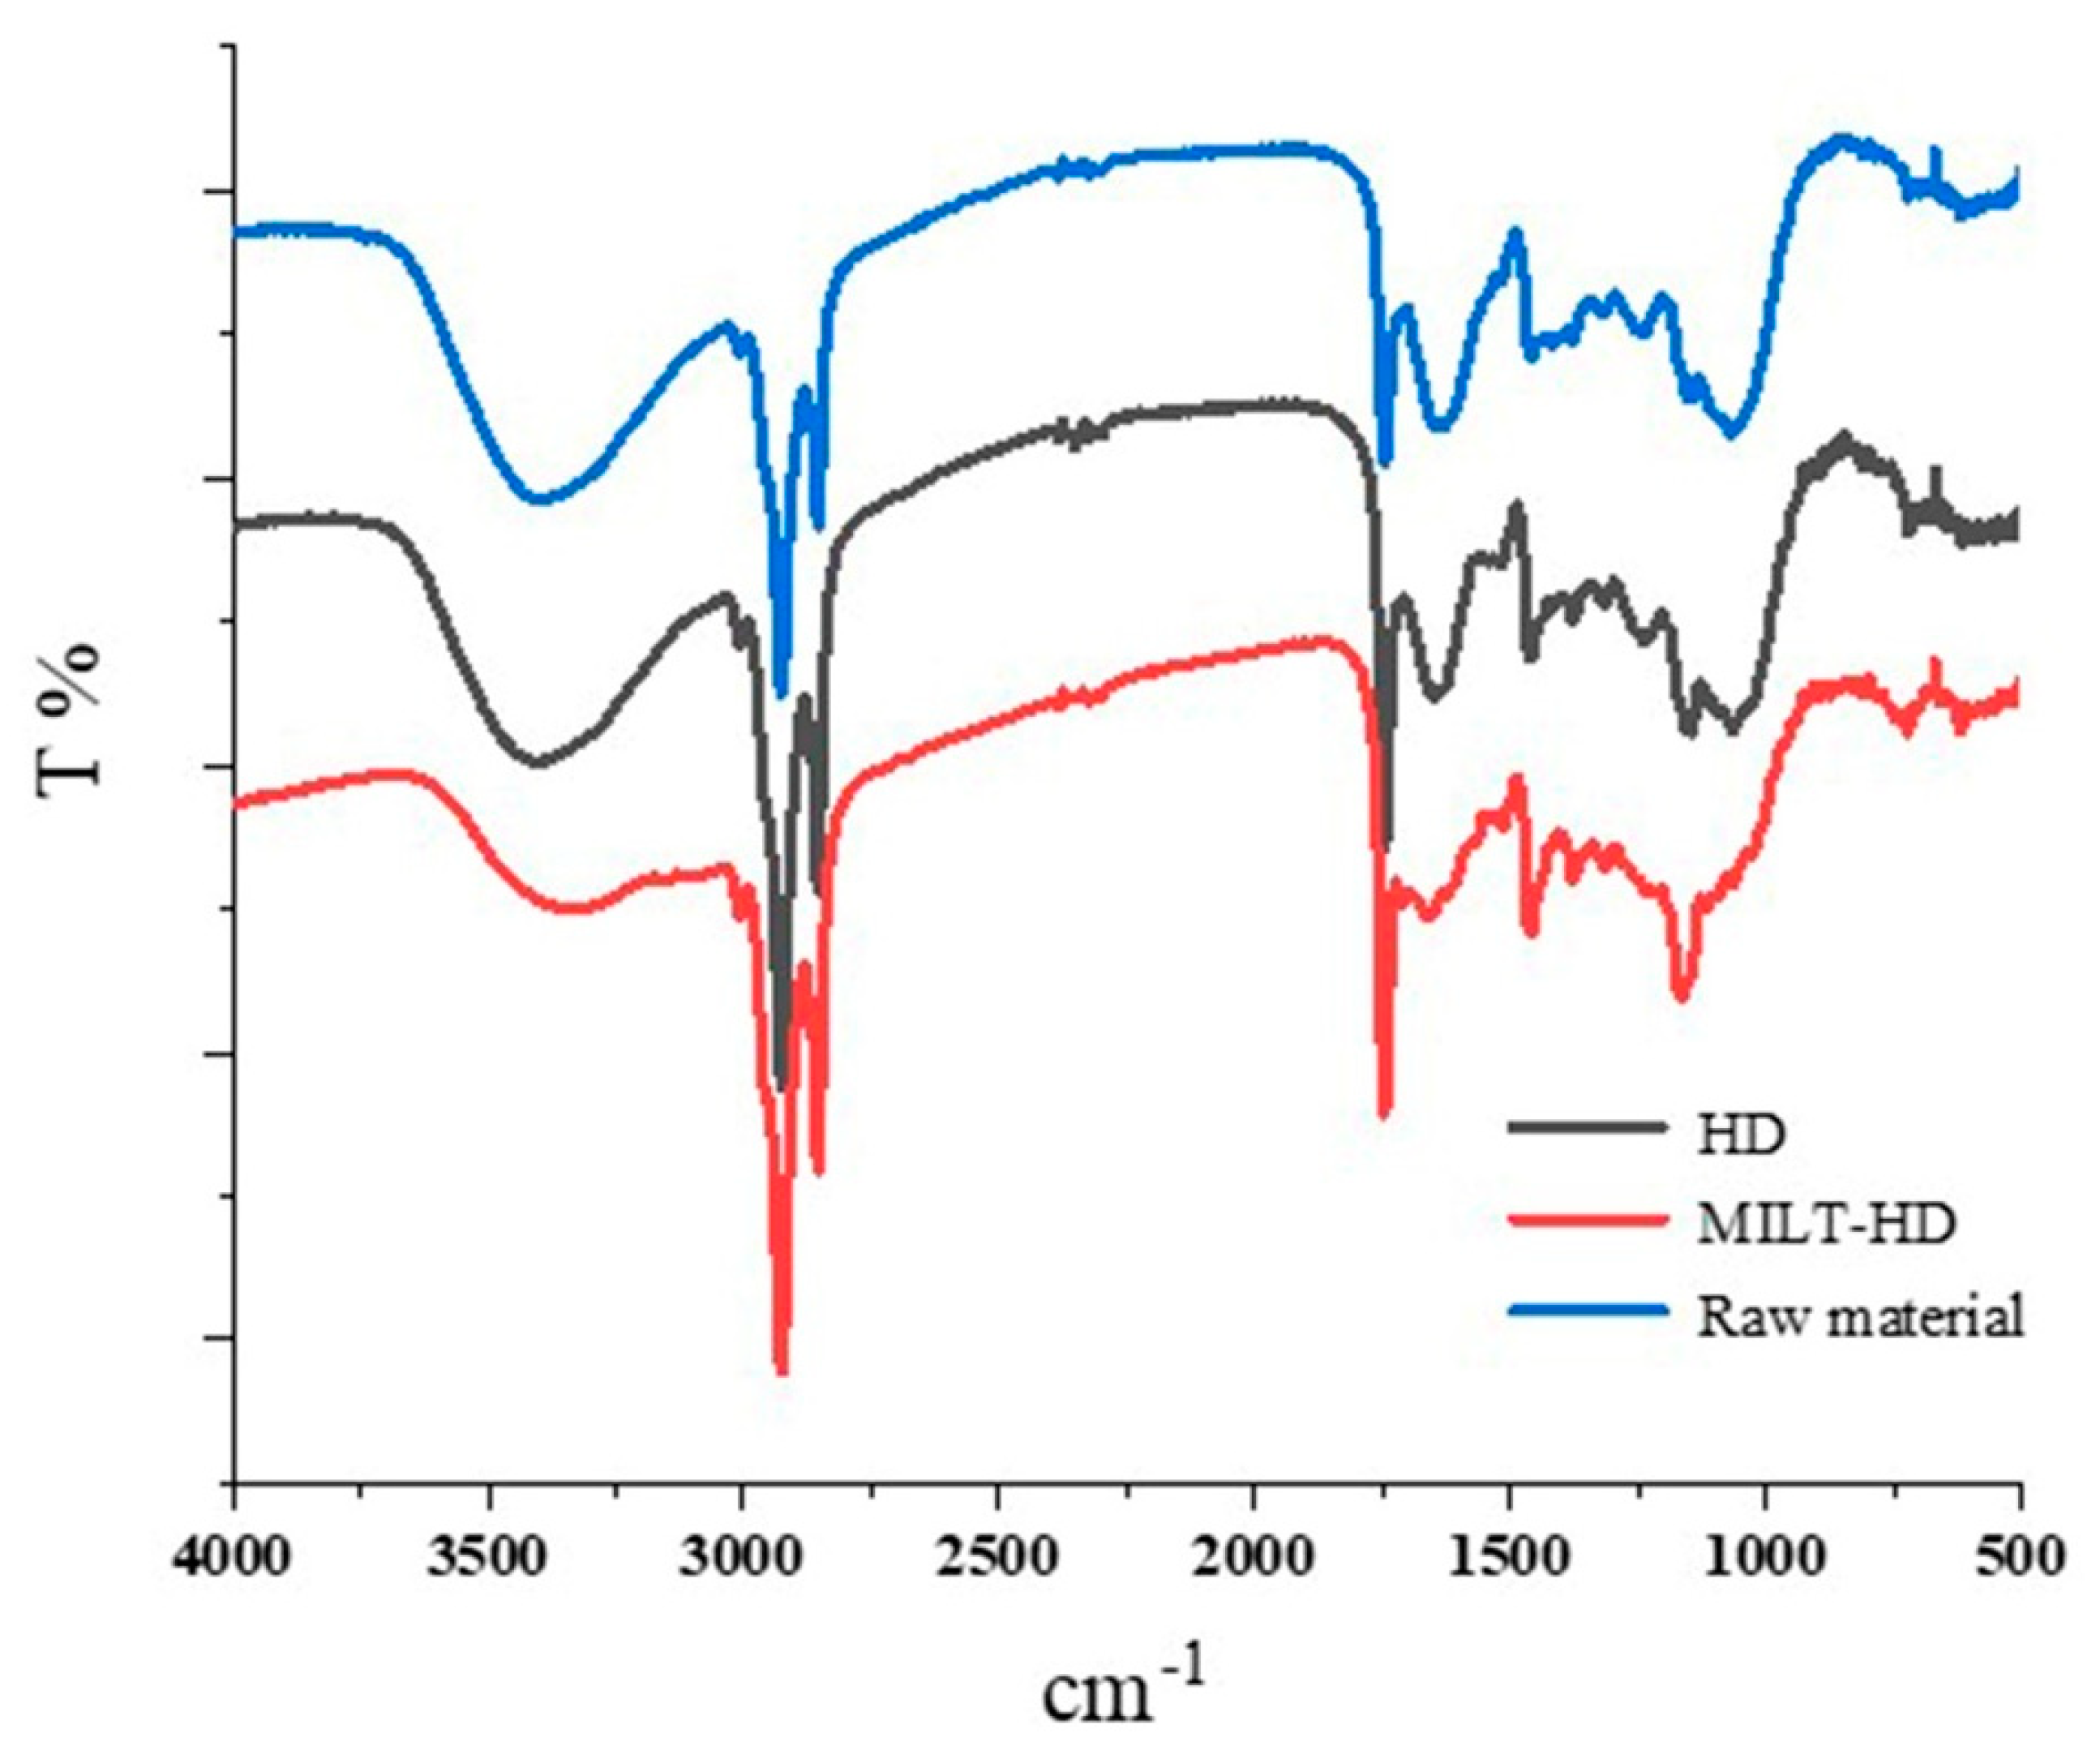
3.4. Structural Changes after Extraction
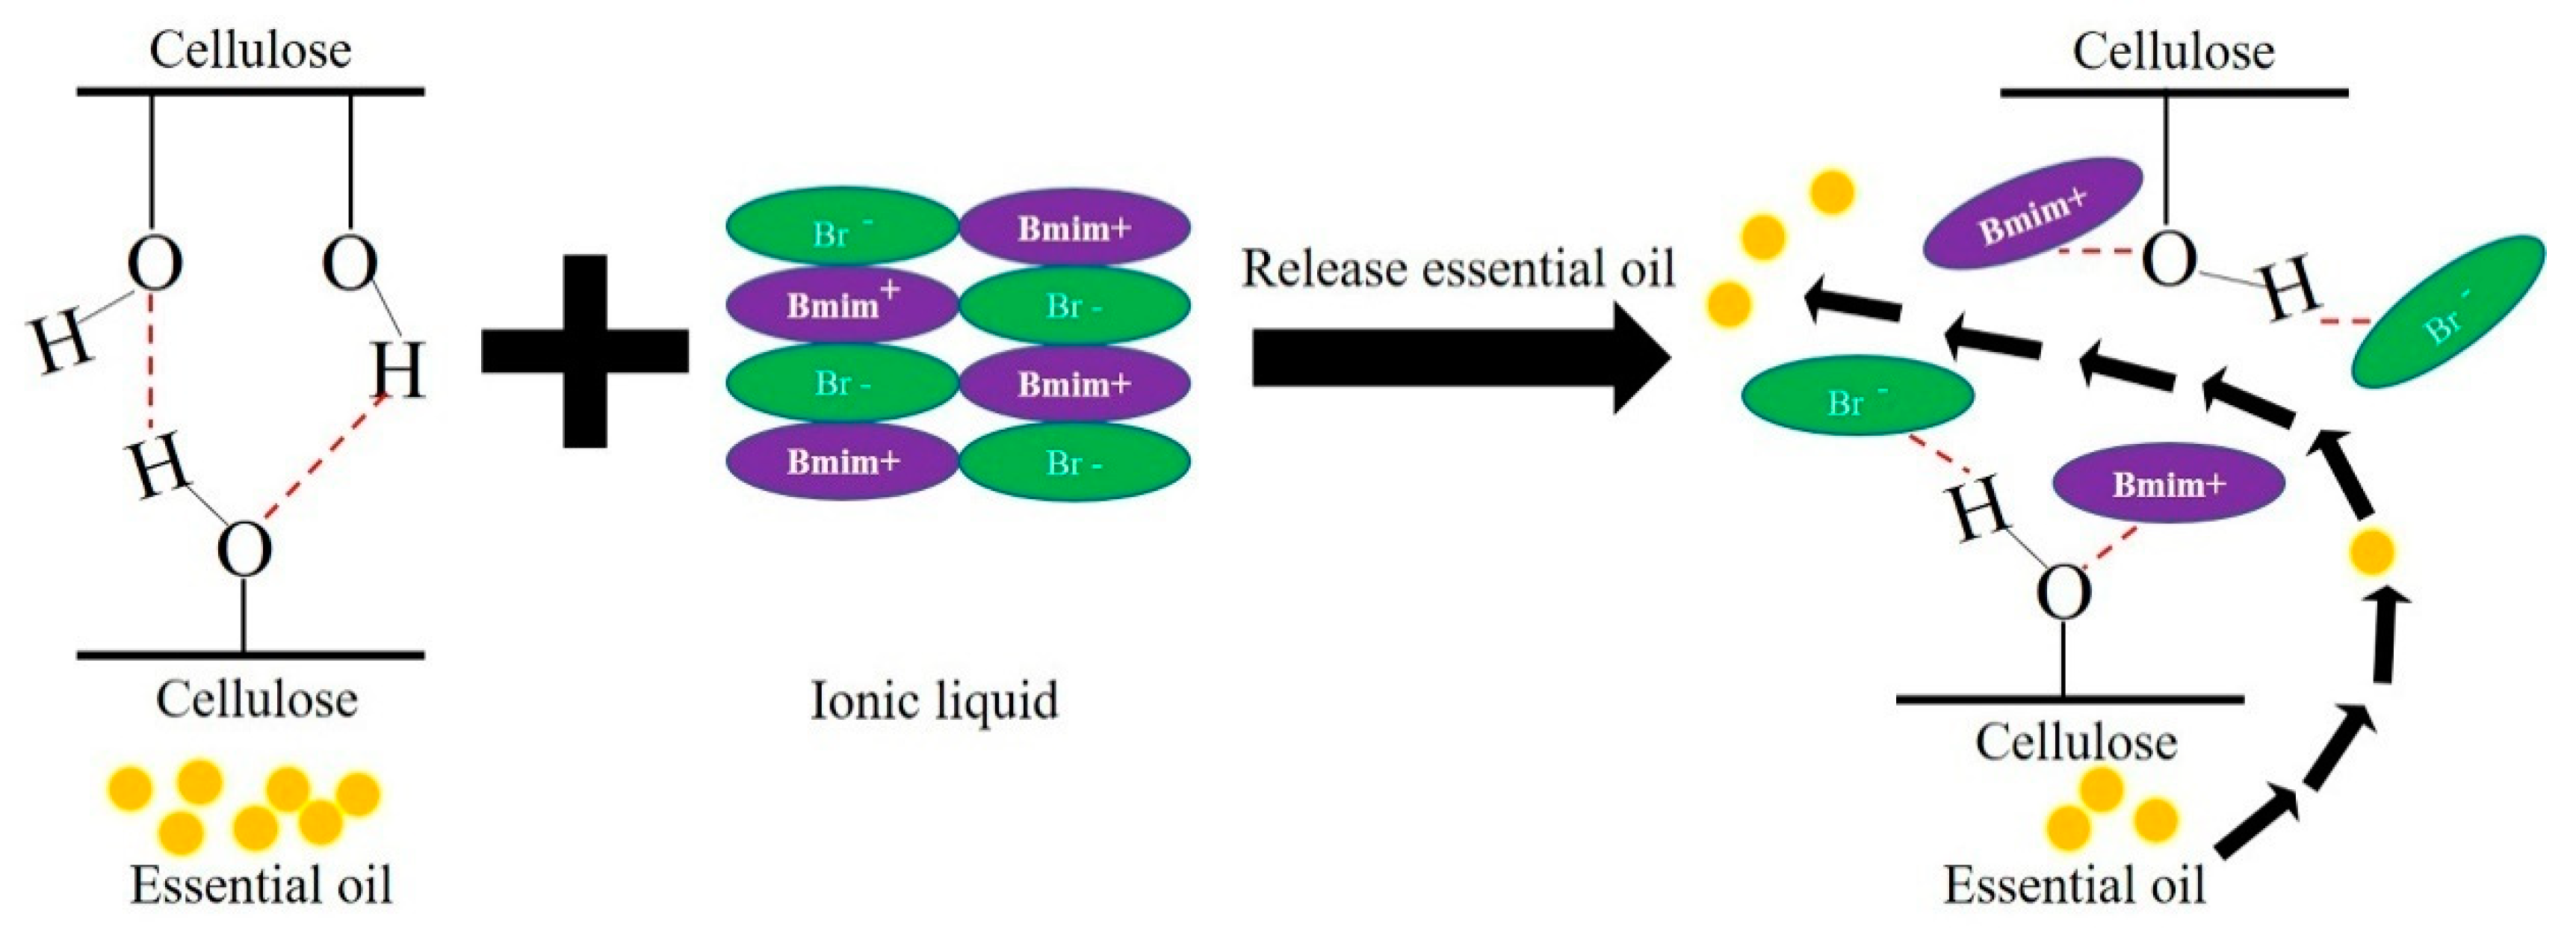
3.5. Interaction between Cellulose and ILs
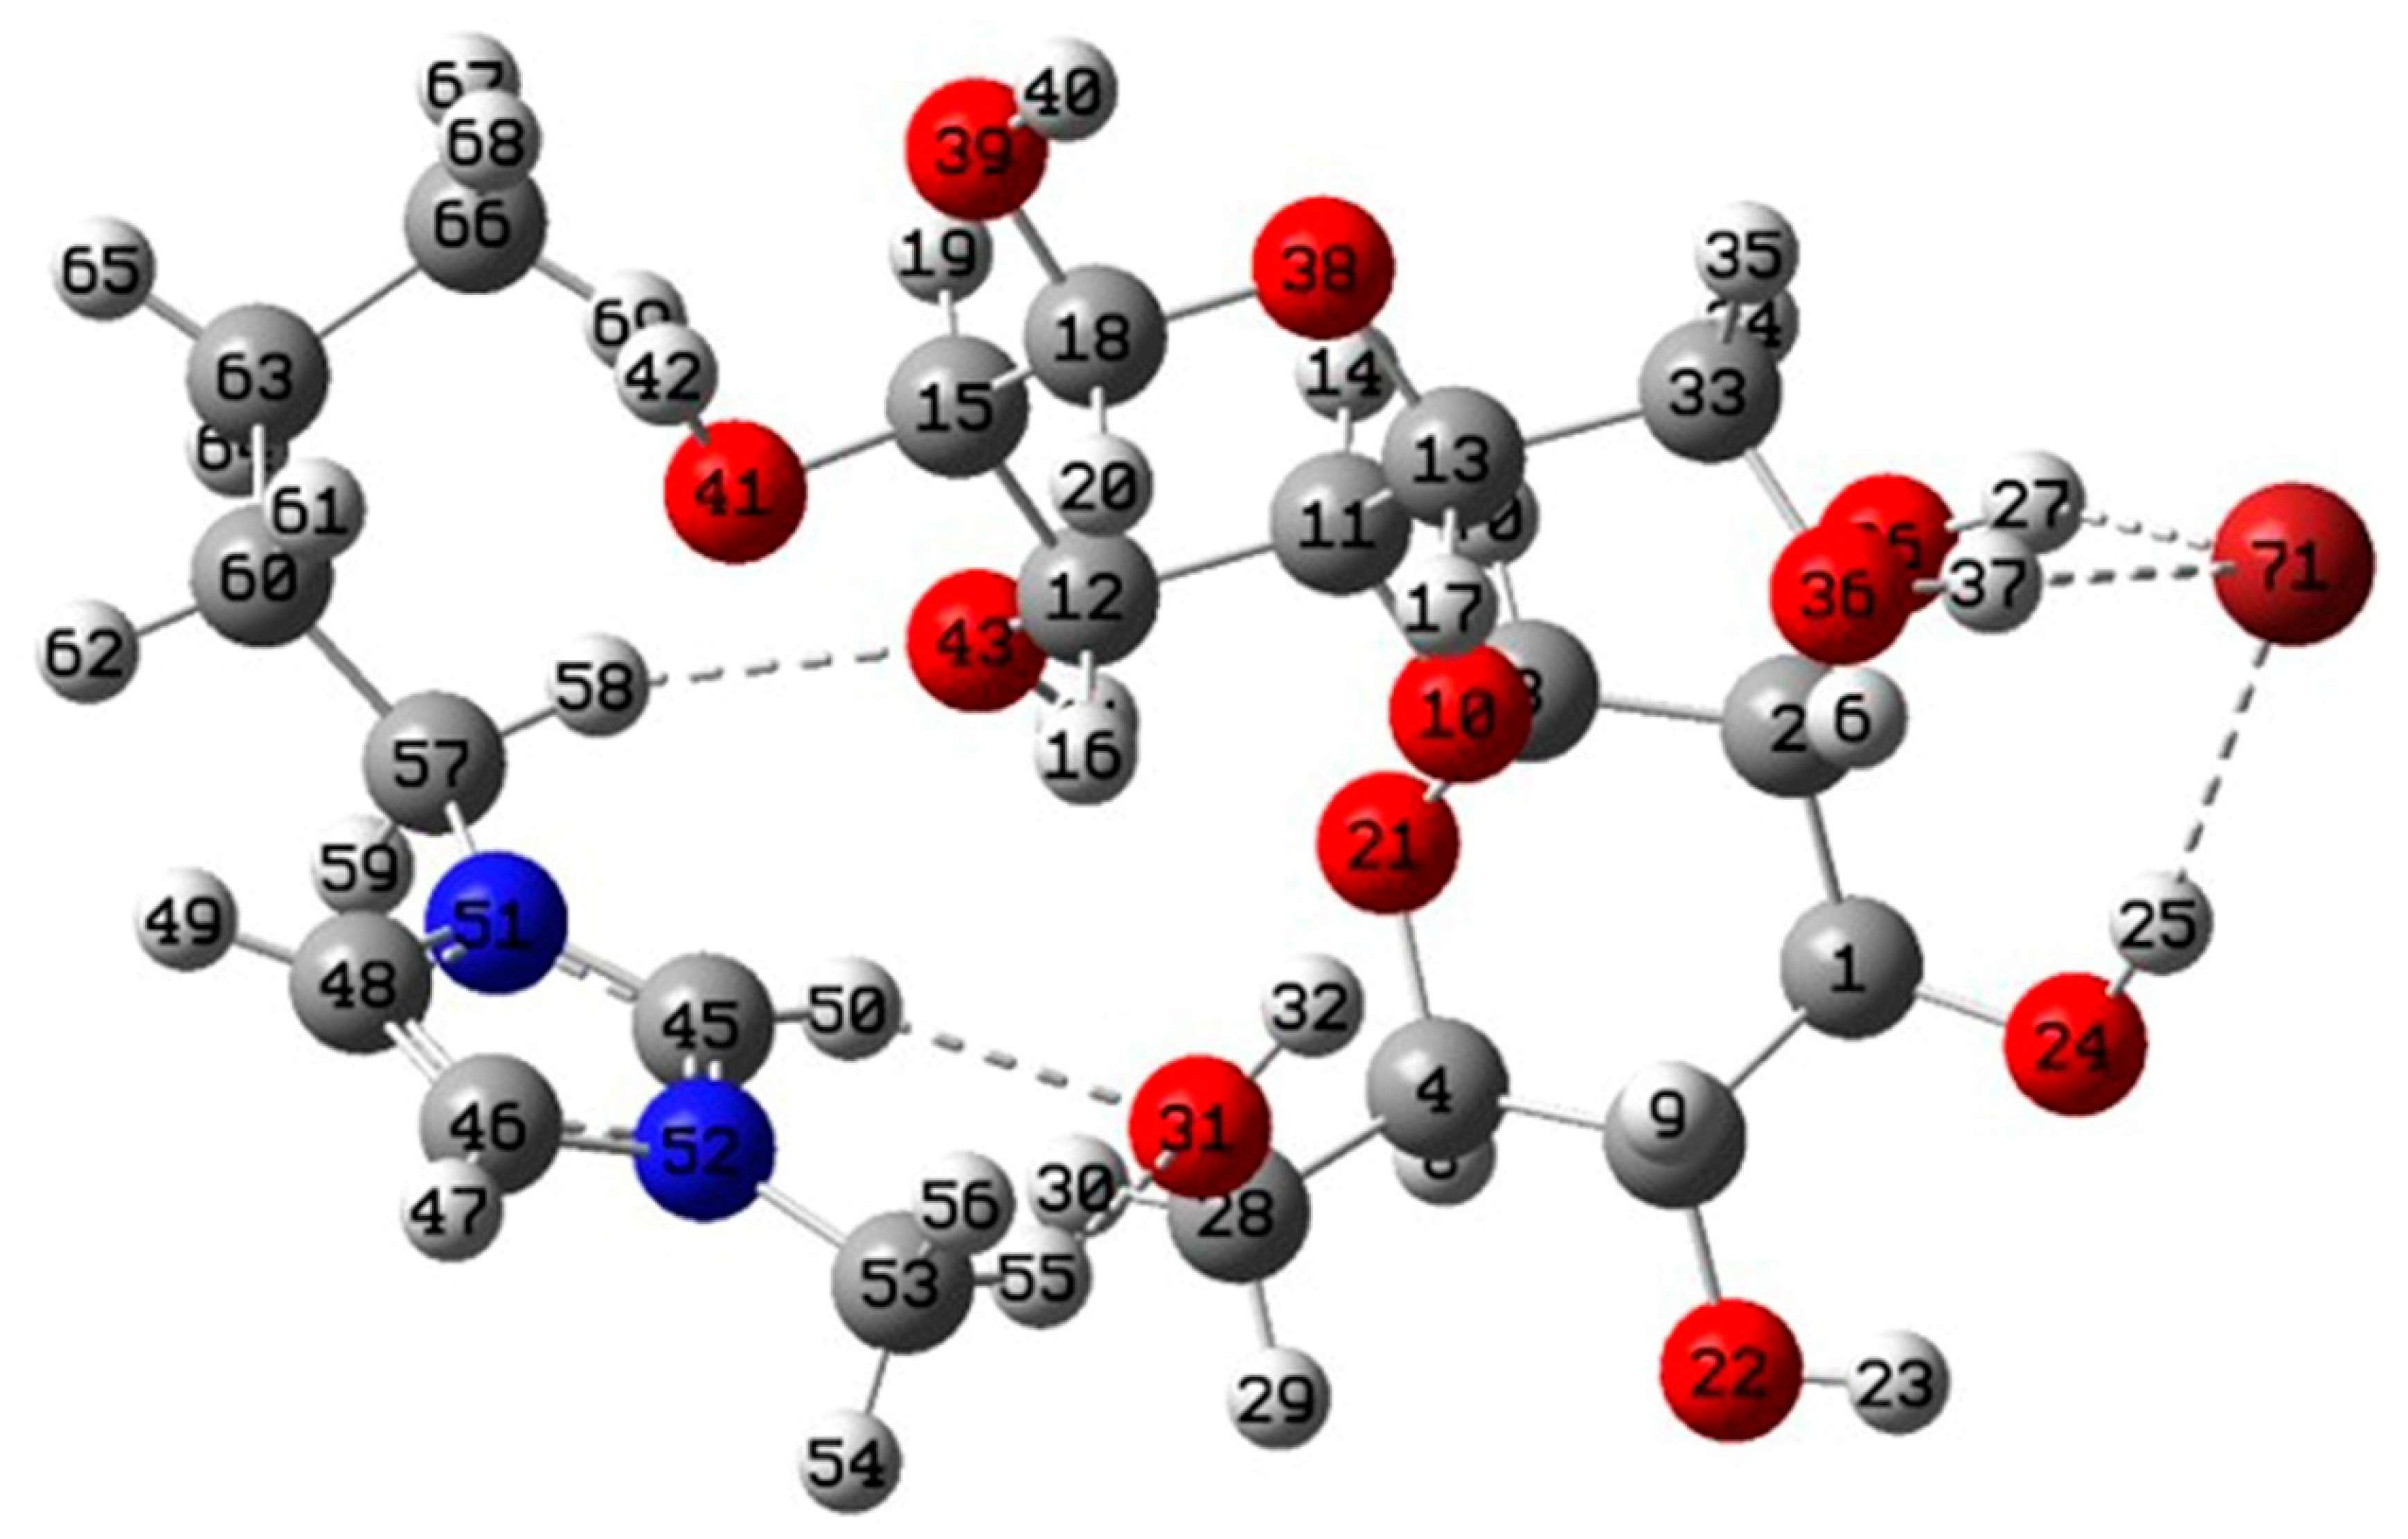
3.5.1. Geometries and Interaction Energy Analysis
3.5.2. AIM Analysis
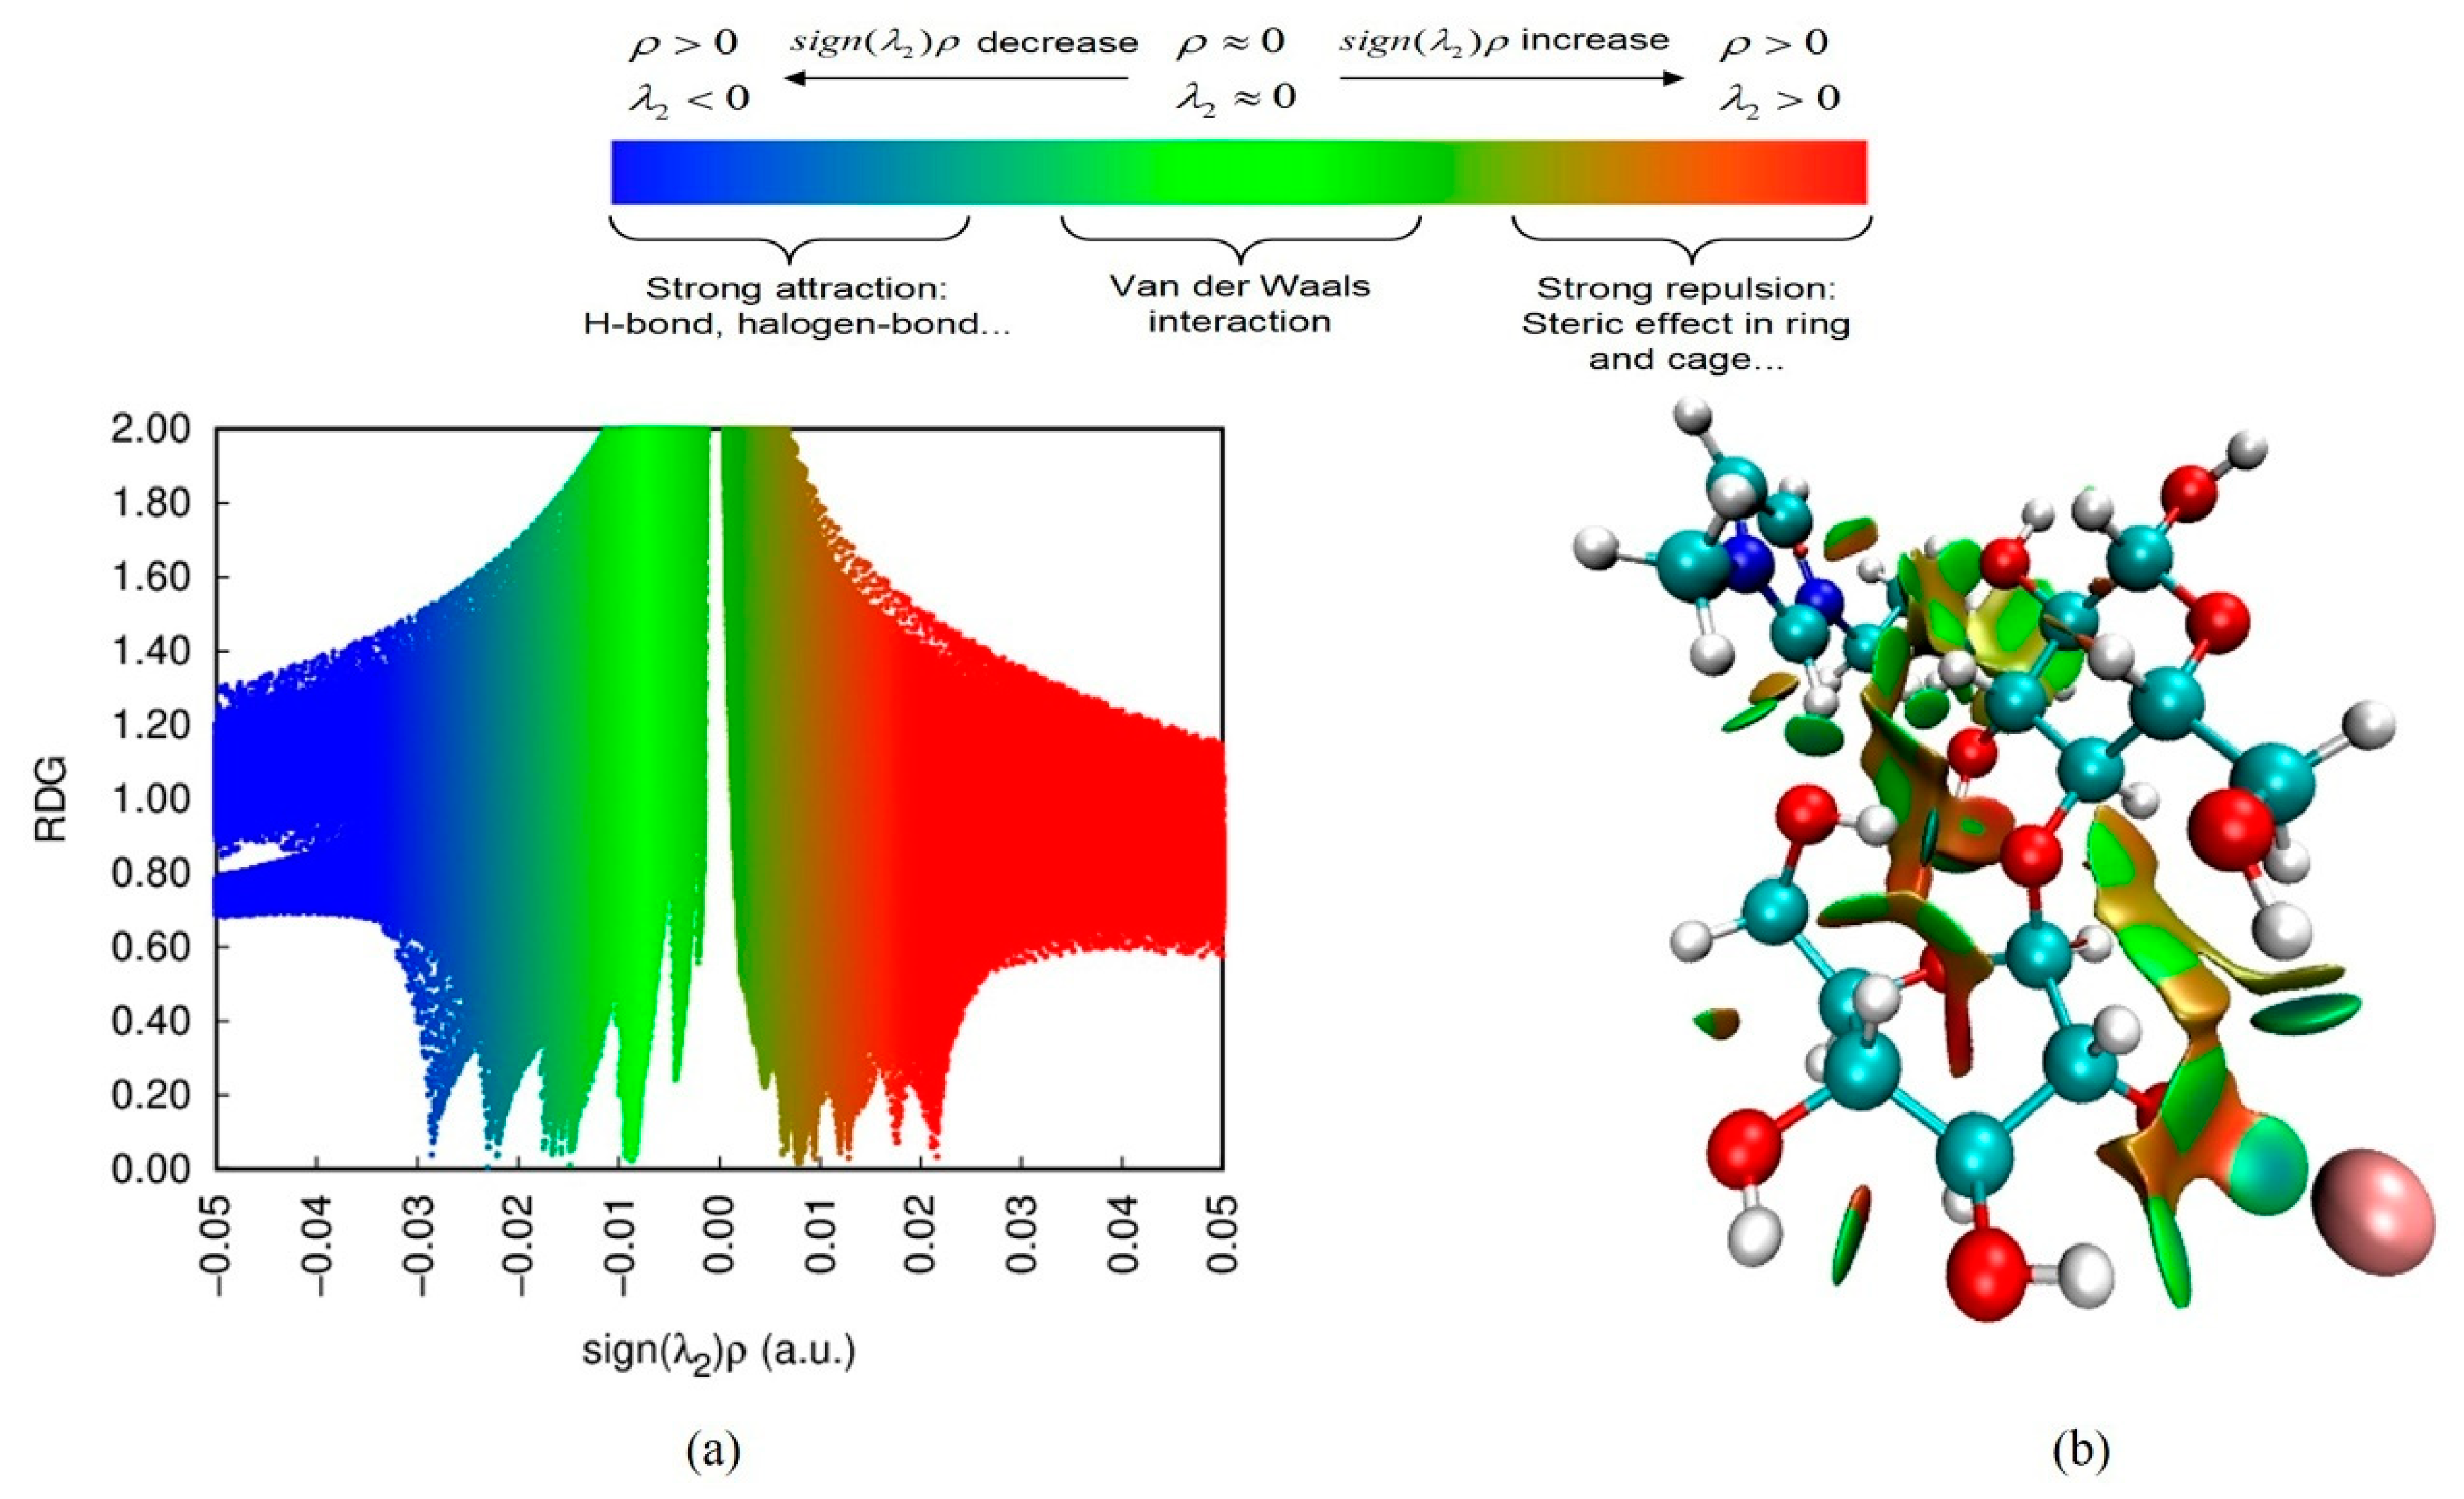
3.5.3. RDG Analysis
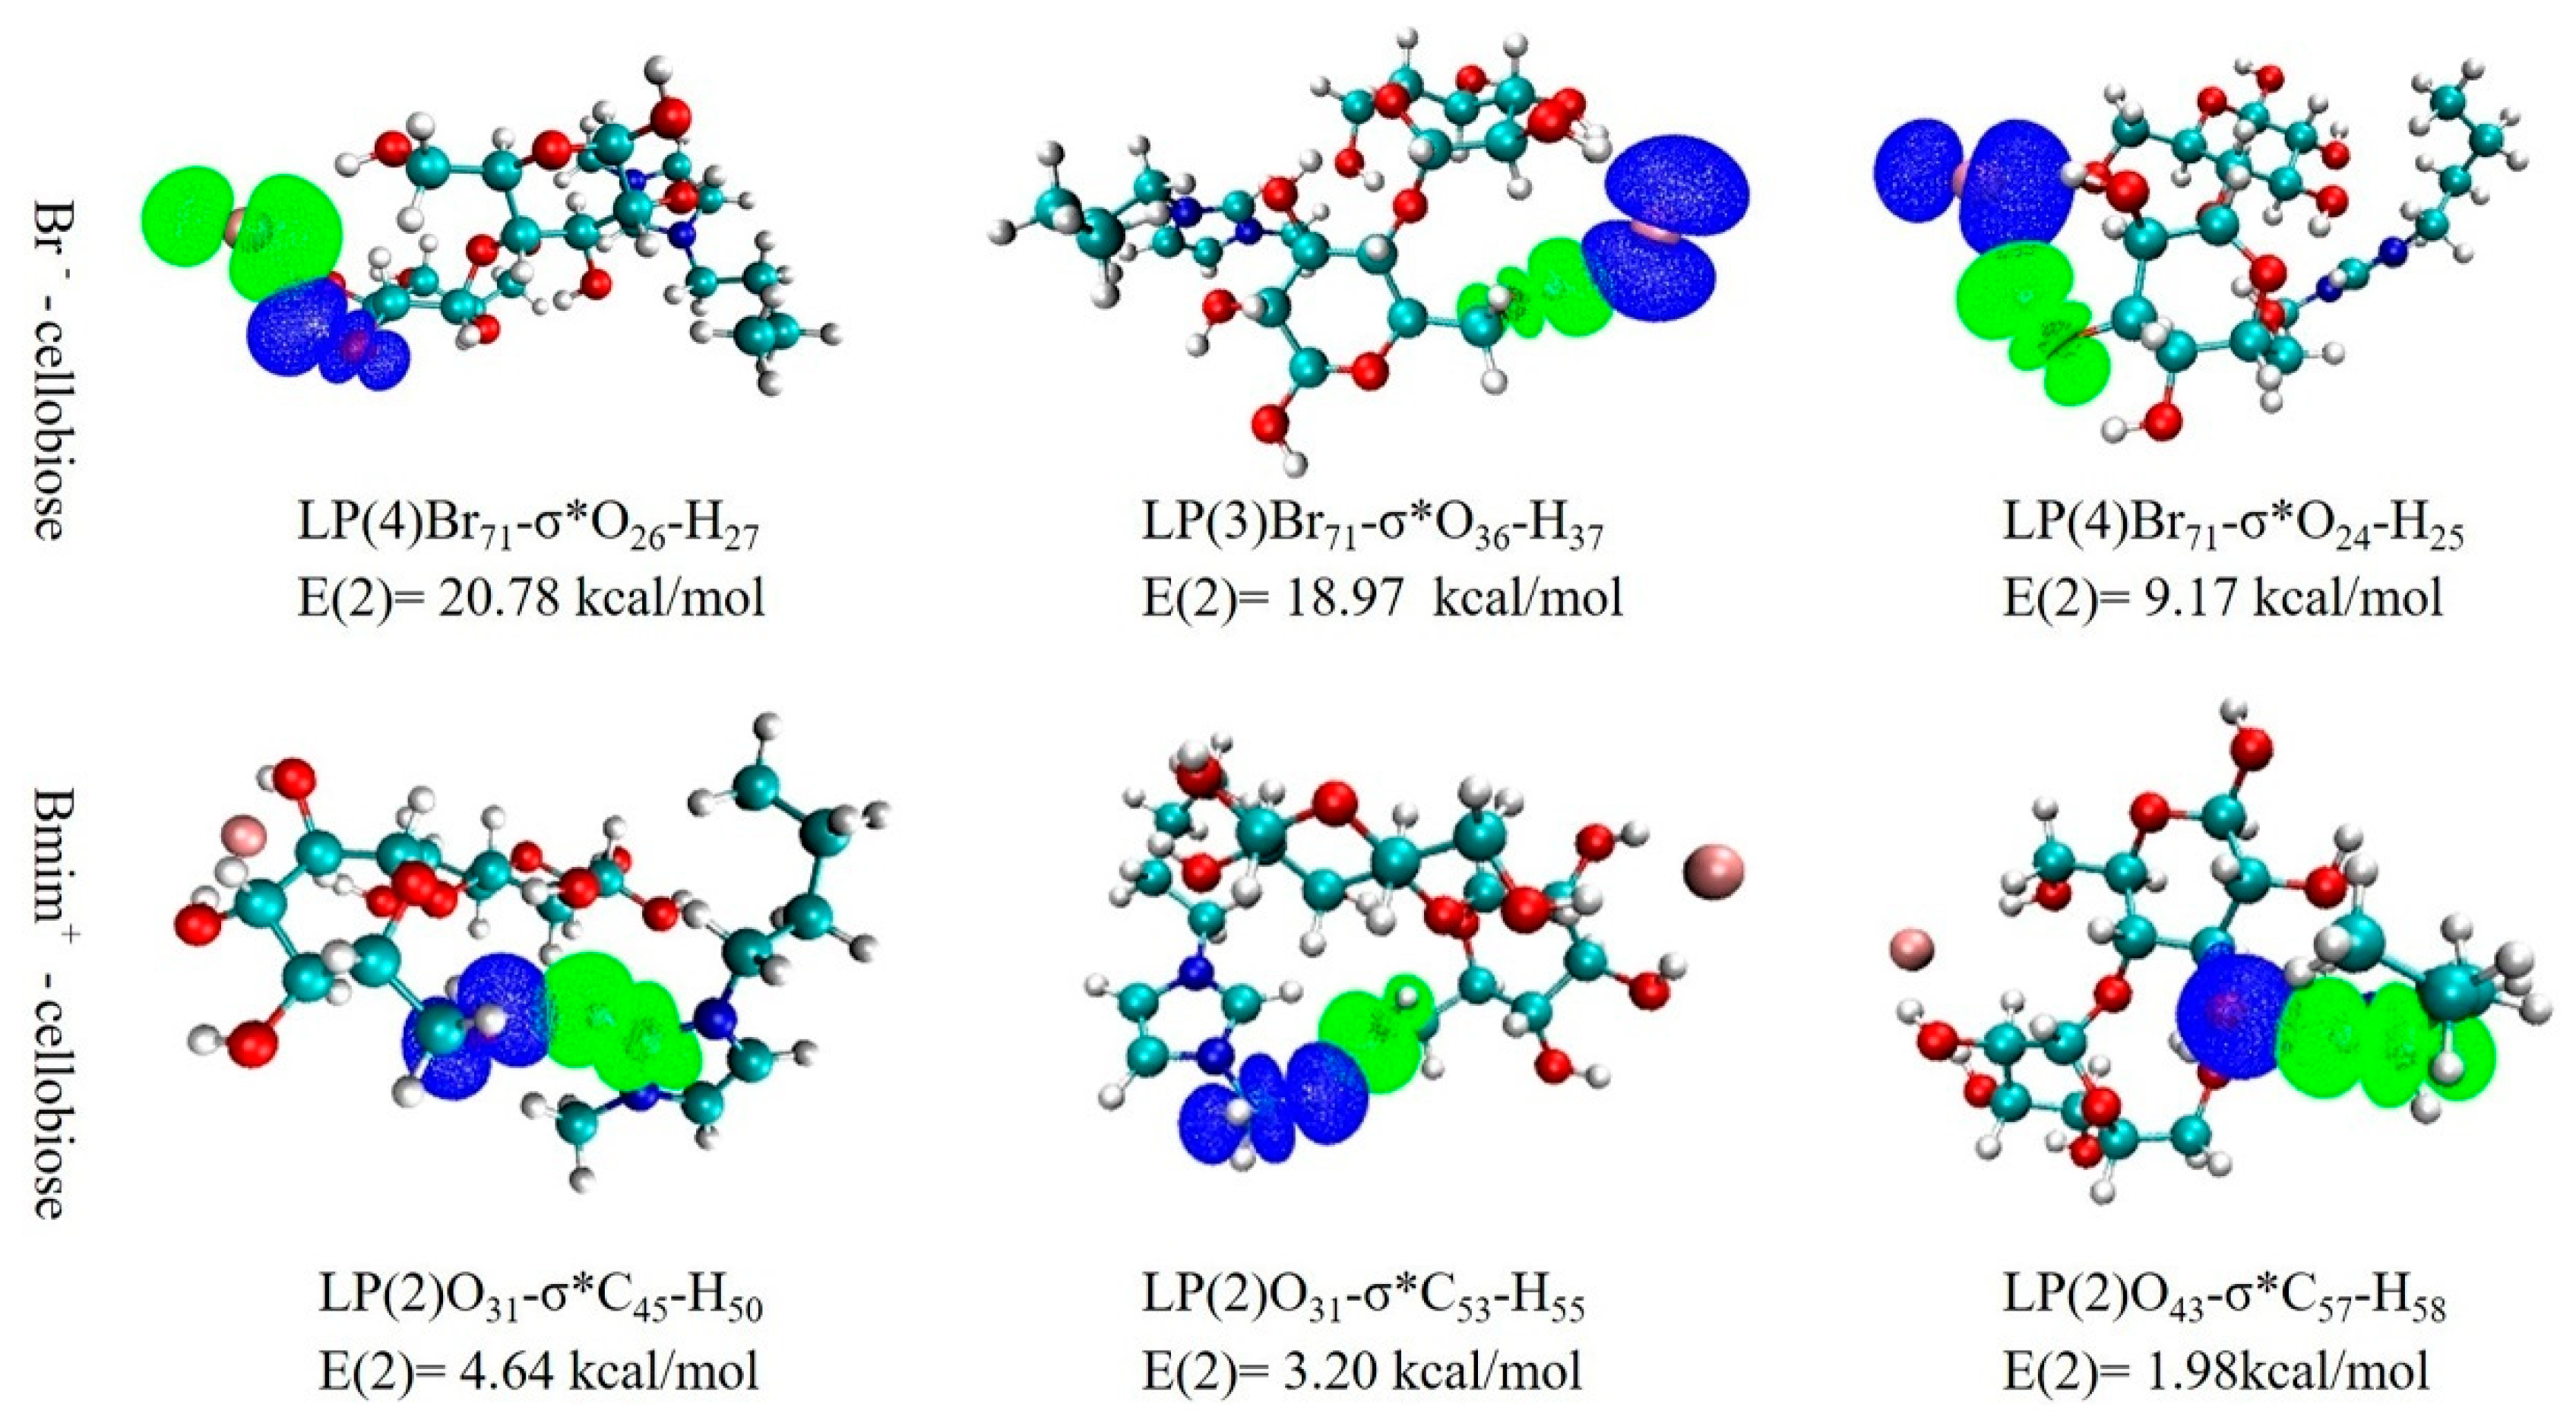
3.5.4. NBO Analysis
4. Conclusions
Supplementary Materials
Author Contributions
Funding
Institutional Review Board Statement
Informed Consent Statement
Data Availability Statement
Conflicts of Interest
Sample Availability
References
- Zhao, Y.; Wang, P.; Zheng, W.; Yu, G.; Li, Z.; She, Y.; Lee, M. Three-stage microwave extraction of cumin (cuminum cyminum l.) seed essential oil with natural deep eutectic solvents. Ind. Crop. Prod. 2019, 140, 111660. [Google Scholar] [CrossRef]
- Jiao, J.; Gai, Q.-Y.; Fu, Y.-J.; Zu, Y.-G.; Luo, M.; Zhao, C.-J.; Li, C.-Y. Microwave-assisted ionic liquids treatment followed by hydro-distillation for the efficient isolation of essential oil from fructus forsythiae seed. Sep. Purif. Technol. 2013, 107, 228–237. [Google Scholar] [CrossRef]
- Wang, W.; Li, Q.; Liu, Y.; Chen, B. Ionic liquid-aqueous solution ultrasonic-assisted extraction of three kinds of alkaloids from phellodendron amurense rupr and optimize conditions use response surface. Ultrason. Sonochem. 2015, 24, 13–18. [Google Scholar] [CrossRef]
- Liu, T.; Sui, X.; Zhang, R.; Yang, L.; Zu, Y.; Zhang, L.; Zhang, Y.; Zhang, Z. Application of ionic liquids based microwave-assisted simultaneous extraction of carnosic acid, rosmarinic acid and essential oil from rosmarinus officinalis. J. Chromatogr. A 2011, 1218, 8480–8489. [Google Scholar] [CrossRef]
- Cao, Y.; Wu, J.; Zhang, J.; Li, H.; Zhang, Y.; He, J. Room temperature ionic liquids (rtils): A new and versatile platform for cellulose processing and derivatization. Chem. Eng. J. 2009, 147, 13–21. [Google Scholar] [CrossRef]
- Lanari, D.; Marcotullio, M.C.; Neri, A. A design of experiment approach for ionic liquid-based extraction of toxic components-minimized essential oil from myristica fragrans houtt. Fruits. Molecules 2018, 23, 2817. [Google Scholar] [CrossRef] [Green Version]
- Liu, X.; Jing, X.; Li, G. A process to acquire essential oil by distillation concatenated liquid-liquid extraction and flavonoids by solid-liquid extraction simultaneously from helichrysum arenarium (l.) moench inflorescences under ionic liquid-microwave mediated. Sep. Purif. Technol. 2019, 209, 164–174. [Google Scholar] [CrossRef]
- Yansheng, C.; Zhida, Z.; Changping, L.; Qingshan, L.; Peifang, Y.; Welz-Biermann, U. Microwave-assisted extraction of lactones from ligusticum chuanxiong hort. Using protic ionic liquids. Green Chem. 2011, 13, 666–670. [Google Scholar] [CrossRef]
- Jiao, J.; Gai, Q.-Y.; Fu, Y.-J.; Zu, Y.-G.; Luo, M.; Wang, W.; Zhao, C.-J. Microwave-assisted ionic liquids pretreatment followed by hydro-distillation for the efficient extraction of essential oil from dryopteris fragrans and evaluation of its antioxidant efficacy in sunflower oil storage. J. Food Eng. 2013, 117, 477–485. [Google Scholar] [CrossRef]
- Bader, R.F. Atoms in molecules. Acc. Chem. Res. 1985, 18, 9–15. [Google Scholar] [CrossRef]
- Glendening, E.D.; Landis, C.R.; Weinhold, F. Natural bond orbital methods. Wiley Interdiscip. Rev. Comput. Mol. Sci. 2012, 2, 1–42. [Google Scholar] [CrossRef]
- Johnson, E.R.; Keinan, S.; Mori-Sánchez, P.; Contreras-García, J.; Cohen, A.J.; Yang, W. Revealing noncovalent interactions. J. Am. Chem. Soc. 2010, 132, 6498–6506. [Google Scholar] [CrossRef] [Green Version]
- Cao, B.; Du, J.; Cao, Z.; Sun, X.; Sun, H.; Fu, H. Dft study on the dissolution mechanisms of α-cyclodextrin and chitobiose in ionic liquid. Carbohydr. Polym. 2017, 169, 227–235. [Google Scholar] [CrossRef]
- Ascrizzi, R.; González-Rivera, J.; Pomelli, C.S.; Chiappe, C.; Margari, P.; Costagli, F.; Longo, I.; Tiné, M.R.; Flamini, G.; Duce, C. Ionic liquids, ultra-sounds and microwaves: An effective combination for a sustainable extraction with higher yields. The cumin essential oil case. React. Chem. Eng. 2017, 2, 577–589. [Google Scholar] [CrossRef]
- Commission, C.P. Chinese Pharmacopoeia 2020 Edition; Beijing Chemical Industry Press: Beijing, China, 2020. [Google Scholar]
- Najdoska-Bogdanov, M.; Bogdanov, J.; Zdravkovski, Z. Tlc and gc-ms analyses of essential oil isolated from macedonian foeniculi fructus. Maced. Pharm. Bull. 2011, 56, 29–36. [Google Scholar] [CrossRef]
- Li, Y.; Liu, X.; Zhang, S.; Yao, Y.; Yao, X.; Xu, J.; Lu, X. Dissolving process of a cellulose bunch in ionic liquids: A molecular dynamics study. Phys. Chem. Chem. Phys. 2015, 17, 17894–17905. [Google Scholar] [CrossRef] [PubMed]
- Lu, T.; Chen, F. Multiwfn: A multifunctional wavefunction analyzer. J. Comput. Chem. 2012, 33, 580–592. [Google Scholar] [CrossRef] [PubMed]
- Frisch, M.; Trucks, G.; Schlegel, H.B.; Scuseria, G.E.; Robb, M.A.; Cheeseman, J.R.; Scalmani, G.; Barone, V.; Mennucci, B.; Petersson, G. Gaussian 09, Revision D. 01, Gaussian; Inc., Wallingford CT: Wallingford, CT, USA, 2009; Volume 201. [Google Scholar]
- Xia, R.; Li, B.; Wang, X.; Li, T.; Yang, Z. Measurement and calibration of the discrete element parameters of wet bulk coal. Measurement 2019, 142, 84–95. [Google Scholar] [CrossRef]
- Li, S.; Chen, F.; Jia, J.; Liu, Z.; Gu, H.; Yang, L.; Wang, F.; Yang, F. Ionic liquid-mediated microwave-assisted simultaneous extraction and distillation of gallic acid, ellagic acid and essential oil from the leaves of eucalyptus camaldulensis. Sep. Purif. Technol. 2016, 168, 8–18. [Google Scholar] [CrossRef]
- Hou, K.; Bao, M.; Wang, L.; Zhang, H.; Yang, L.; Zhao, H.; Wang, Z. Aqueous enzymatic pretreatment ionic liquid–lithium salt based microwave–assisted extraction of essential oil and procyanidins from pinecones of pinus koraiensis. J. Clean. Prod. 2019, 236, 117581. [Google Scholar] [CrossRef]
- Derringer, G.C. A balancing act-optimizing a products properties. Qual. Prog. 1994, 27, 51–58. [Google Scholar]
- Xiao, Z.; Chen, J.; Niu, Y.; Chen, F. Characterization of the key odorants of fennel essential oils of different regions using gc–ms and gc–o combined with partial least squares regression. J. Chromatogr. B 2017, 1063, 226–234. [Google Scholar] [CrossRef]
- Zou, J.-B.; Zhang, X.-F.; Tai, J.; Wang, J.; Cheng, J.-X.; Zhao, C.-B.; Ma, L.-L.; Feng, Y.; Shi, Y.-J. Extraction kinetics of volatile components from foeniculum vulgare by steam distillation. Chin. Tradit. Herb. Drugs 2018, 19, 12. [Google Scholar]
- Chemspider Search and Share Chemistry. Available online: https://www.chemspider.com/ (accessed on 15 May 2021).
- Adams, R.P. Identification of Essential Oil Components by Gas Chromatography/Mass Spectrometry; Allured Publishing Corporation: Carol Stream, IL, USA, 2007; Volume 456. [Google Scholar]
- Zhang, Q.; Huo, R.; Ma, Y.; Yan, S.; Yang, L.; Chen, F. A novel microwave-assisted steam distillation approach for separation of essential oil from tree peony (paeonia suffruticosa andrews) petals: Optimization, kinetic, chemical composition and antioxidant activity. Ind. Crop. Prod. 2020, 154, 112669. [Google Scholar] [CrossRef]
- Paré, J.; Bélanger, J.M. Instrumental Methods in Food Analysis; Elsevier: Amsterdam, The Netherlands, 1997. [Google Scholar]
- Fu, H.; Wang, X.; Sang, H.; Hou, Y.; Chen, X.; Feng, X. Dissolution behavior of microcrystalline cellulose in dbu-based deep eutectic solvents: Insights from spectroscopic investigation and quantum chemical calculations. J. Mol. Liq. 2020, 299, 112140. [Google Scholar] [CrossRef]
- Espinosa, E.; Molins, E.; Lecomte, C. Hydrogen bond strengths revealed by topological analyses of experimentally observed electron densities. Chem. Phys. Lett. 1998, 285, 170–173. [Google Scholar] [CrossRef]
- Emamian, S.; Lu, T.; Kruse, H.; Emamian, H. Exploring nature and predicting strength of hydrogen bonds: A correlation analysis between atoms-in-molecules descriptors, binding energies, and energy components of symmetry-adapted perturbation theory. J. Comput. Chem. 2019, 40, 2868–2881. [Google Scholar] [CrossRef]
- Li, Y.; Liu, X.; Zhang, Y.; Jiang, K.; Wang, J.; Zhang, S. Why only ionic liquids with unsaturated heterocyclic cations can dissolve cellulose: A simulation study. ACS Sustain. Chem. Eng. 2017, 5, 3417–3428. [Google Scholar] [CrossRef]
- Verma, P.L.; Gejji, S.P. Electronic structure, spectral characteristics and physicochemical properties of linear, branched and cyclic alkyl group substituted 1-alkyl-3-butylimidazolium cation based ionic liquids. J. Mol. Liq. 2018, 251, 394–406. [Google Scholar] [CrossRef]
- Chocholoušová, J.; Špirko, V.; Hobza, P. First local minimum of the formic acid dimer exhibits simultaneously red-shifted o–h–o and improper blue-shifted c–h–o hydrogen bonds. Phys. Chem. Chem. Phys. 2004, 6, 37–41. [Google Scholar] [CrossRef]
- Ismahan, L.; Leila, N.; Fatiha, M.; Abdelkrim, G.; Mouna, C.; Nada, B.; Brahim, H. Computational study of inclusion complex of l-glutamine/beta-cycldextrin: Electronic and intermolecular interactions investigations. J. Mol. Struct. 2020, 1206, 127740. [Google Scholar] [CrossRef]
- Wang, Y.; Li, R.; Jiang, Z.-T.; Tan, J.; Tang, S.-H.; Li, T.-T.; Liang, L.-L.; He, H.-J.; Liu, Y.-M.; Li, J.-T.; et al. Green and solvent-free simultaneous ultrasonic-microwave assisted extraction of essential oil from white and black peppers. Ind. Crop. Prod. 2018, 114, 164–172. [Google Scholar] [CrossRef]


| Runs | Process Parameters | ||
|---|---|---|---|
| X1 (%) | X2 (min) | X3 (%) | |
| 1 | 70 | 4 | 20 |
| 2 | 50 | 6 | 20 |
| 3 | 70 | 4 | 20 |
| 4 | 50 | 4 | 10 |
| 5 | 70 | 6 | 30 |
| 6 | 70 | 2 | 10 |
| 7 | 90 | 2 | 20 |
| 8 | 50 | 2 | 20 |
| 9 | 70 | 6 | 10 |
| 10 | 70 | 4 | 20 |
| 11 | 90 | 6 | 20 |
| 12 | 50 | 4 | 30 |
| 13 | 90 | 4 | 30 |
| 14 | 90 | 4 | 10 |
| 15 | 70 | 2 | 30 |
| Source | Sum of Square | DF | Mean Square | F Value | p-Value | Significance |
|---|---|---|---|---|---|---|
| Model | 2.29 | 4 | 0.57 | 18.66 | 0.0001 | Significant |
| X2 | 0.48 | 1 | 0.48 | 15.74 | 0.0027 | Significant |
| X3 | 0.98 | 1 | 0.98 | 31.85 | 0.0002 | Significant |
| X2 X3 | 0.62 | 1 | 0.62 | 20.08 | 0.0012 | Significant |
| X12 | 0.21 | 1 | 0.21 | 6.96 | 0.0248 | Significant |
| Residual | 0.31 | 10 | 0.031 | Significant | ||
| Lack of fit | 0.30 | 8 | 0.037 | 10.49 | 0.0899 | Not significant |
| R2 | 0.8818 |
| X1 (%) | X2 (min) | X3 (%) | Yeo (%) | Yt90 (%) | k % min−1 | Desirability | |
|---|---|---|---|---|---|---|---|
| Predicted | 73.19 | 6.00 | 30.00 | 3.437 | 3.440 | 0.1358 | 0.943 |
| Experimental | 73.20 | 6.00 | 30.00 | 3.633 ± 0.112 | 3.633 ± 0.112 | 0.1447 ± 0.0088 | |
| RE (%) | 5.70 | 5.61 | 6.55 |
| No. | Components | Retention Index | Molecular Formula | Molecular Weight | Relative Peak Area (%) | |
|---|---|---|---|---|---|---|
| MD | MILT-HD | |||||
| 1 | Acetic acid, butyl ester | 785 | C6H12O2 | 116 | ND | 0.68 |
| 2 | Furfural | 831 | C5H4O2 | 96 | ND | 0.49 |
| 3 | α-pinene | 948 | C10H16 | 136 | 0.95 | 1.25 |
| 4 | D-Limonene | 1018 | C10H16 | 136 | 6.85 | 8.32 |
| 5 | γ-terpinene | 998 | C10H16 | 136 | 1.36 | 1.53 |
| 6 | Fenchone | 1121 | C10H16O | 152 | 1.84 | 1.82 |
| 7 | 1-Butylimidazole | 1013 | C7H12N2 | 124 | ND | 2.07 |
| 8 | Estragole | 1172 | C10H12O | 148 | 31.28 | 28.71 |
| 9 | Anisic aldehyde | 1171 | C10H12O | 148 | 0.76 | 0.83 |
| 10 | Anethole | 1190 | C10H12O | 148 | 53.95 | 48.29 |
| 11 | Palmitic acid, methyl ester | 1878 | C17H34O2 | 270 | ND | 0.63 |
| Total identified peak area (%) | 96.99 | 94.62 | ||||
| MILT–HD | HD | ||
|---|---|---|---|
| Pretreatment | Hydrodistillation | Hydrodistillation | |
| Heating method | Microwave | Electric stove | Electric stove |
| Effective electric power (W) | 390 | 600 | 600 |
| Time consumption (h) | 0.100 | 1.17 | 2.89 |
| Electricity consumption (kW·h) | 0.0390 | 0.702 | 1.73 |
| Total electricity consumption (kW·h) | 0.741 | 1.73 | |
| Yield of essential oil (mL/g) | 0.0363 | 0.0193 | |
| Yield of essential oil per kilowatt hour (mL/g/(kW·h)) | 0.0490 | 0.0112 | |
| Environmental impact (g CO2 emission) | 592.8 | 1384 | |
| H-Bond | ρBCP (a.u) | v2ρBCP (a.u) | Vcp (a.u) | λ1 | λ2 | λ3 | EHB (Kcal/mol) |
|---|---|---|---|---|---|---|---|
| Br71⋯C24-H25 | 0.0166 | 0.0448 | −0.0085 | −0.0150 | 0.0750 | −0.0152 | −2.6590 |
| Br71⋯C36-H37 | 0.0230 | 0.0568 | −0.0137 | 0.1044 | −0.0233 | −0.0243 | −4.3095 |
| Br71⋯C26-H27 | 0.0221 | 0.0569 | −0.0135 | −0.0218 | −0.0212 | 0.0999 | −4.2372 |
| O31⋯C53-H55 | 0.0145 | 0.0518 | −0.0094 | −0.0143 | −0.0162 | 0.0822 | −2.9492 |
| O31⋯C45-H50 | 0.0181 | 0.0664 | −0.0122 | 0.1065 | −0.0211 | −0.0191 | −3.8133 |
| O43⋯C45-H50 | 0.0132 | 0.0460 | −0.0087 | −0.0108 | −0.0123 | 0.0691 | −2.7446 |
| O41⋯C60-H61 | 0.0094 | 0.0308 | −0.0061 | 0.0454 | −0.0068 | −0.0078 | −1.9123 |
| O21⋯C43-H44 | 0.0157 | 0.0561 | −0.0107 | 0.0894 | −0.0173 | −0.0161 | −3.3708 |
Publisher’s Note: MDPI stays neutral with regard to jurisdictional claims in published maps and institutional affiliations. |
© 2021 by the authors. Licensee MDPI, Basel, Switzerland. This article is an open access article distributed under the terms and conditions of the Creative Commons Attribution (CC BY) license (https://creativecommons.org/licenses/by/4.0/).
Share and Cite
Shi, G.; Lin, L.; Liu, Y.; Chen, G.; Yang, A.; Wu, Y.; Zhou, Y.; Li, H. Study on the Mechanism of Ionic Liquids Improving the Extraction Efficiency of Essential Oil Based on Experimental Optimization and Density Functional Theory: The Fennel (Foeniculi fructus) Essential Oil Case. Molecules 2021, 26, 3169. https://doi.org/10.3390/molecules26113169
Shi G, Lin L, Liu Y, Chen G, Yang A, Wu Y, Zhou Y, Li H. Study on the Mechanism of Ionic Liquids Improving the Extraction Efficiency of Essential Oil Based on Experimental Optimization and Density Functional Theory: The Fennel (Foeniculi fructus) Essential Oil Case. Molecules. 2021; 26(11):3169. https://doi.org/10.3390/molecules26113169
Chicago/Turabian StyleShi, Guolin, Longfei Lin, Yuling Liu, Gongsen Chen, Anhui Yang, Yanqiu Wu, Yingying Zhou, and Hui Li. 2021. "Study on the Mechanism of Ionic Liquids Improving the Extraction Efficiency of Essential Oil Based on Experimental Optimization and Density Functional Theory: The Fennel (Foeniculi fructus) Essential Oil Case" Molecules 26, no. 11: 3169. https://doi.org/10.3390/molecules26113169
APA StyleShi, G., Lin, L., Liu, Y., Chen, G., Yang, A., Wu, Y., Zhou, Y., & Li, H. (2021). Study on the Mechanism of Ionic Liquids Improving the Extraction Efficiency of Essential Oil Based on Experimental Optimization and Density Functional Theory: The Fennel (Foeniculi fructus) Essential Oil Case. Molecules, 26(11), 3169. https://doi.org/10.3390/molecules26113169