3.1. Method Validation of UHPLC-MS/MS
Method validation was conducted to assess the reliability and efficacy of UHPLC-MS/MS as an analytical technique for qualitative and quantitative determination of cannabinoids in the extract. Validation of the PHWE extraction technique was also performed. For this, linear calibration curves were constructed for CBD, THC and CBN. The peak areas were plotted against the concentration of analytes over a range of 0.5, 1, 5, 10, 20, 30, 50, 100, 500 and 1000 ng mL
−1. Mass spectrometry parameter settings were optimized in order to achieve the highest sensitivity, accuracy and resolution of the selected cannabinoid compounds (
Table S1). A chromatogram of 10 ppm standard mixture of cannabinoid compounds and the PHWE extract at optimum conditions is presented in
Figures S1 and S2, respectively. Supporting information on the fragmentation patterns obtained from the MRM mode is shown in
Figure S3.
In addition, the accuracy and precision of UHPLC-MS/MS were evaluated by using quality control samples of spiked Moringa powder, as were the recoveries achieved by PHWE extraction technique.
Table 4 summarizes the linearity, correlation coefficient (R
2), limit of detection (LOD) and limit of quantification (LOQ) estimated for each analyte.
The linearity of the curve is described by the R2 value, which was greater than 0.997 for all cases. The LOD and LOQ values estimated ranged between 0.03 ng mL−1 and 0.20 ng mL−1 and between 0.09 ng mL−1 and 0.61 ng mL−1, thus indicating good sensitivity.
Quality control samples were prepared by spiking 5.00 g of
Moringa oleifera samples with standards (0.5–500 ng mL
−1) of each the cannabinoids, and the samples were analyzed in triplicate. The accuracies were determined as the percentage of the mean of the measured concentrations to the nominal concentrations. The precisions were calculated as coefficients of variance (RSD%) among the three measured concentrations at each true concentration. The accuracies and precisions were calculated to satisfy the requirements that the mean of the measured concentrations was within 15% of the true concentration and that the RSD must fall within 15% [
9]. These precisions and accuracies are reported in
Table 5.
The accuracies were 99.31–100.55%, 84.07–100.40% and 96.52–101.50%, and the precisions were 1.34–11.43%, 1.72–7.28% and 2.25–5.68% for CBD, CBN and THC, respectively. Both the accuracies and precisions were within the acceptable range for all the analytes. Therefore, UHPLC-MS/MS quantifies the target analytes reliably.
Recovery was evaluated as well using Moringa oleifera powder spiked with standard concentrations of CBD, CBN and THC (0.5 ng mL
−1 to 500 ng mL
−1). The mean recoveries for each level were calculated by comparing the peak areas of each cannabinoid after the blank matrix was spiked with the standard concentrations, and then treated according to the extraction procedure with the peak areas before extraction procedure. The calculated extraction recoveries are shown in
Table 6. In summary, the extraction recoveries ranged between 96.56 and 103.42%, 95.22 and 99.95% and 99.62 and 99.81% for CBD, CBN and THC, respectively. The observed recoveries were satisfactory, which demonstrated a highly efficient extraction procedure.
3.2. Response Surface Methodology
The response surface methodology was applied with the objective to optimize the factors affecting decarboxylation in the in situ decarboxylation-PHWE system. This was done in order to develop the best performing system which obtains CBD-rich extracts. The experiments were performed based on the experiment design defined by CCD. These experiments were carried out at all possible level combinations of temperature and time, and the response was given as the CBD, THC and CBN content. These results are presented in
Table 2. Thereafter, the regression models were obtained by fitting the second-order polynomial equation to the experimental dataset. The adequacy of the regression models obtained was investigated using the model summary statistics or analysis of variance (ANOVA). The results are reported in
Table 4. The goodness of fit of the established models was assessed by the R
2. For all the models, the R
2 value was close to unity, suggesting that the predicted model fits the experimental data well. The significance of each term on the regression model was assessed by considering the Fischer’s F-test values and probability
p-values. In general, high F-values (F > 1) and low
p-values (
p-value < 0.05) indicate that the terms have significant influence on the regression models. From
Table 2, it is clear that terms of the regression models for CBD, CBN and THC are highly significant since most of the terms have
p-values < 0.05 and F-values > 1. Therefore, it was inferred that the independent factors (temperature and time) had a significant effect on the CBD, CBN and THC content.
The second-order polynomial model fitted to the data resulted in model Equations (1)–(3), which describe the response Y
x as a function of decarboxylation temperature (X
1) and time (X
2).
3.3. Model Fitting and Accuracy
The predictive efficiency of RSM was assessed based on the deviation of the predicted values from the actual CBD, CBN and THC content measured in the cannabis extracts. This was performed by calculating the statistical error parameters, namely, ADD (%), RSME, MAE, SEP (%), MPE (%) and chi-square (
χ2). The results of the parameters are reported in
Table 7.
The results demonstrate that the RSM has good predictive capabilities to determine the amount of cannabinoid analytes extracted using the in situ decarboxylation-PHWE system at experimental conditions. This was indicated by the low values of the statistical errors. Moreover, the plots comparing the predicted and actual values are presented in
Figure 1.
Data fitting demonstrated that all data points were well concentrated around the selected unity-slope line for all three outputs. From this, it was inferred that the predicted and actual responses determined experimentally were in proximity, further attesting that the established model was valid, reliable and adequate to predict the CBD, CBN and THC contents accurately within the experimental region.
3.4. The Effect of Decarboxylation Conditions on the Extracted Amount of Cannabinoids
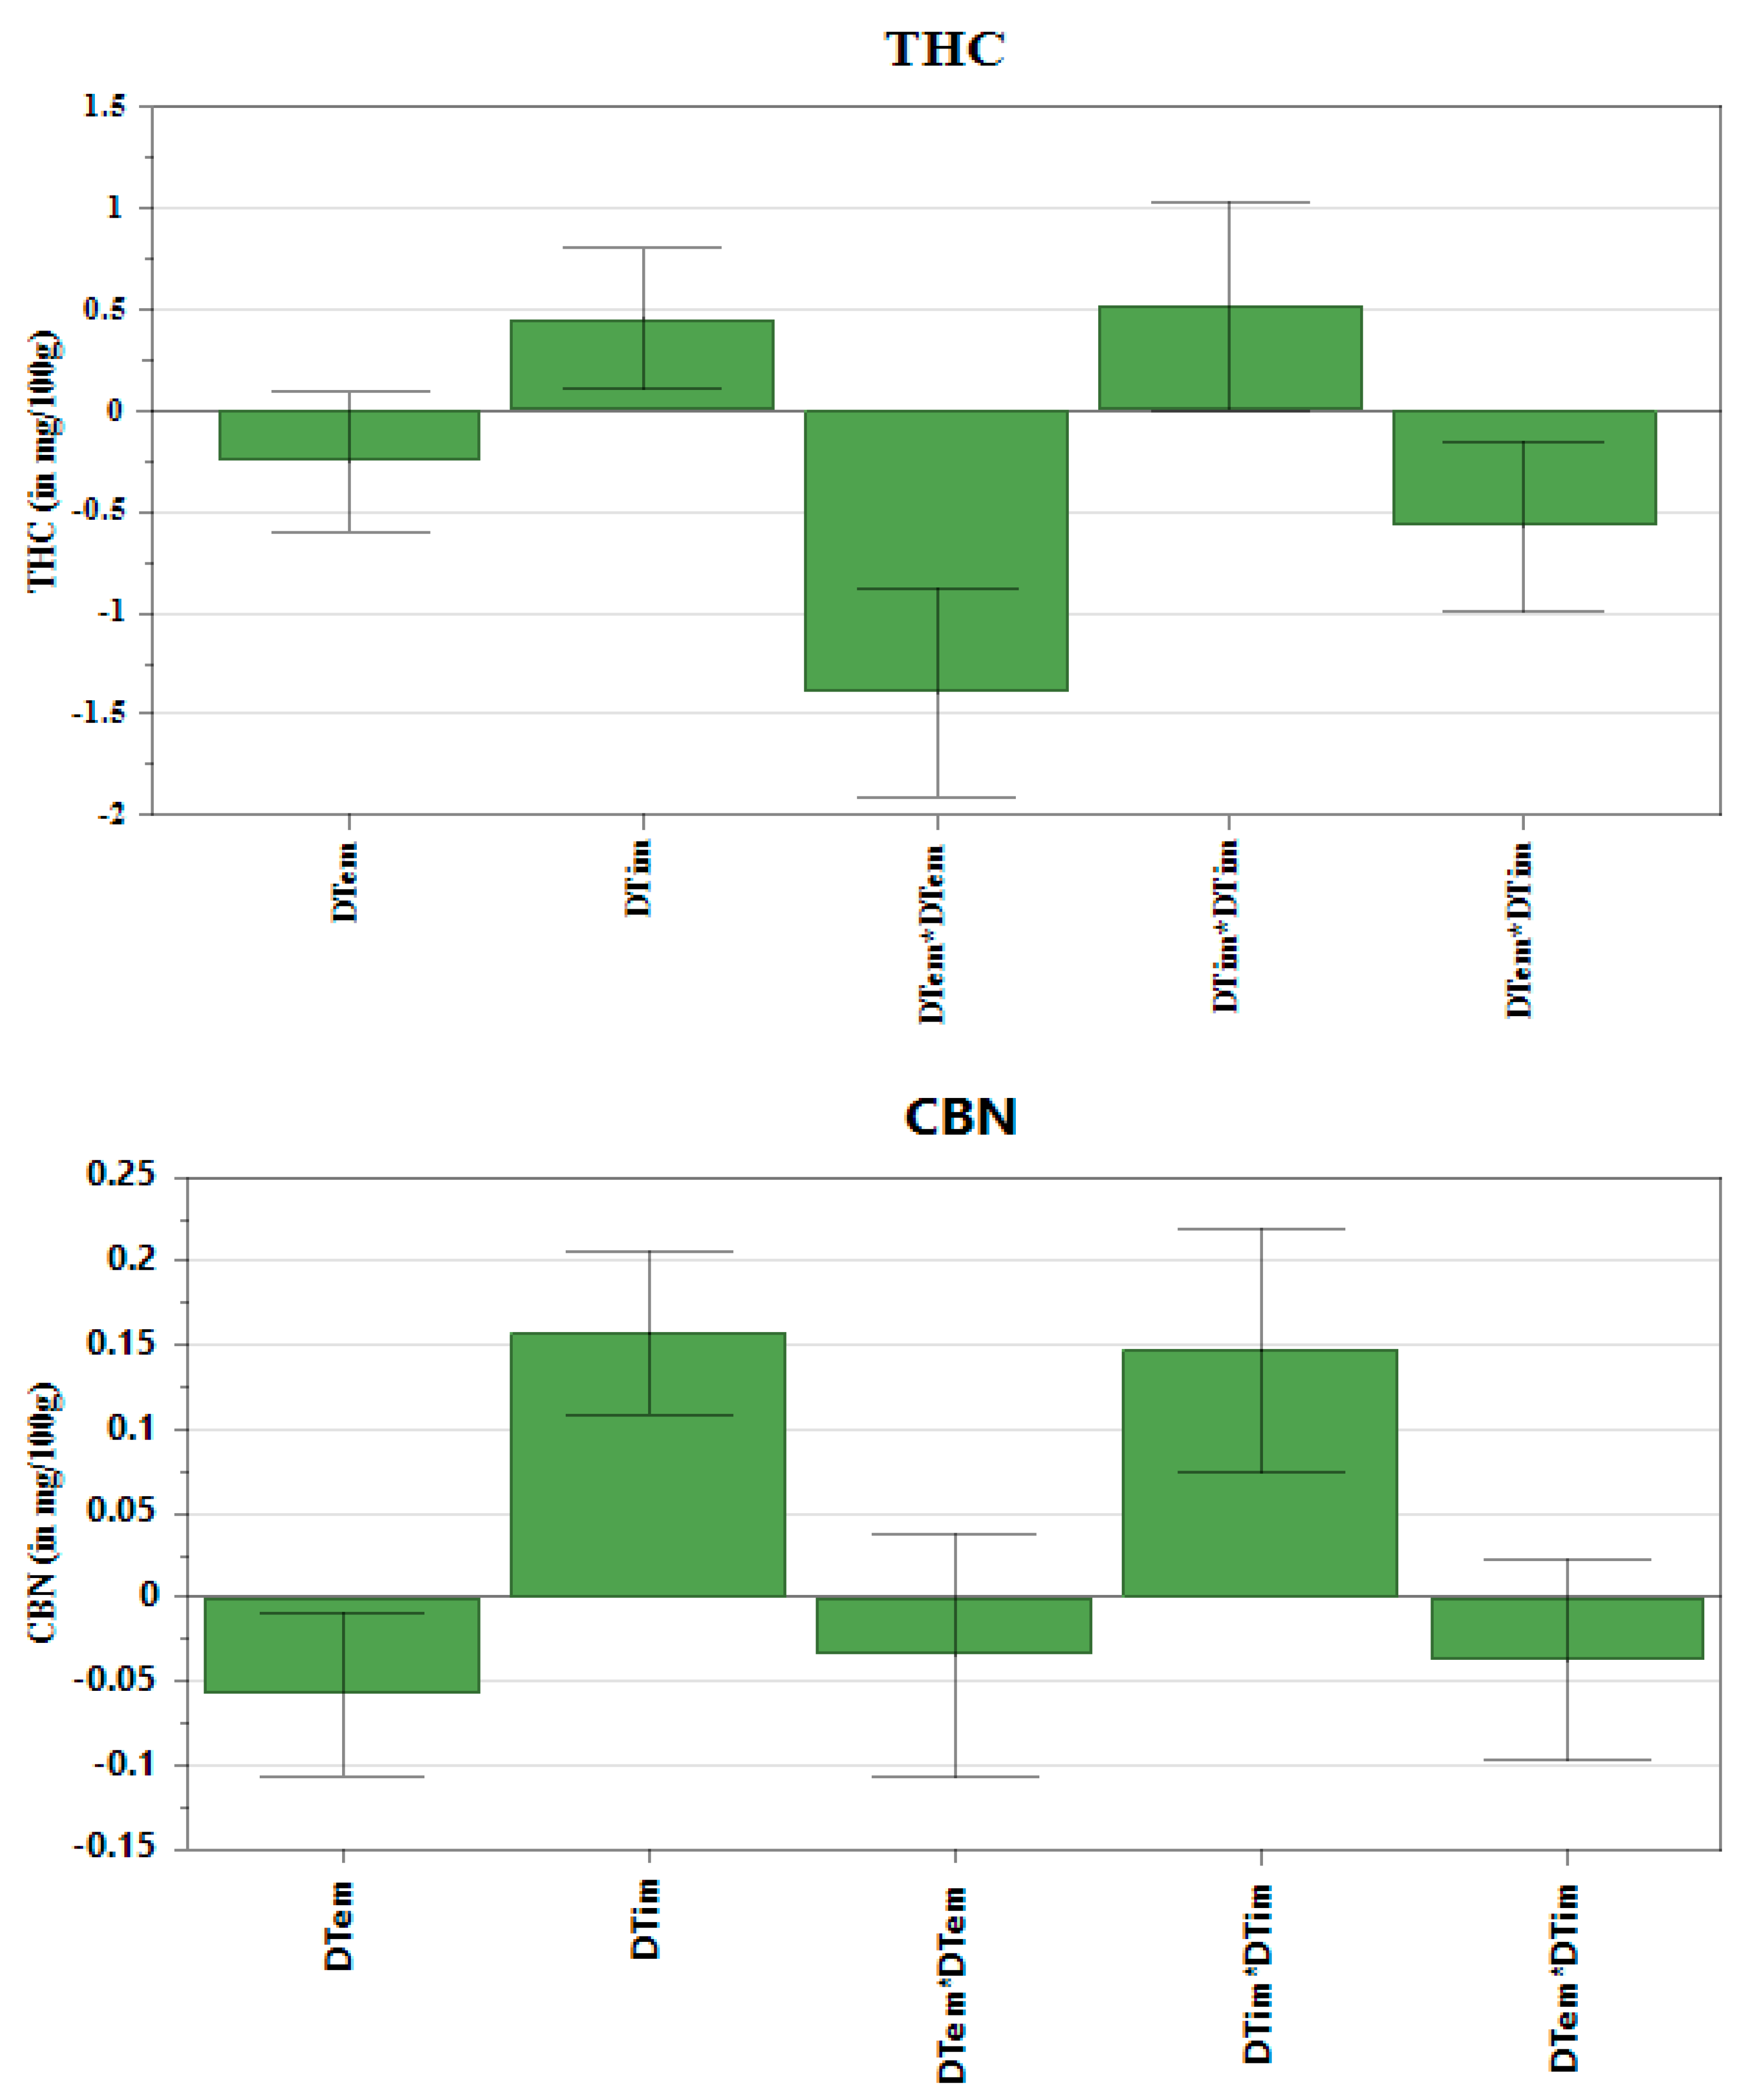
The multilinear regression (MLR) was fitted to the data to construct coefficient plots (
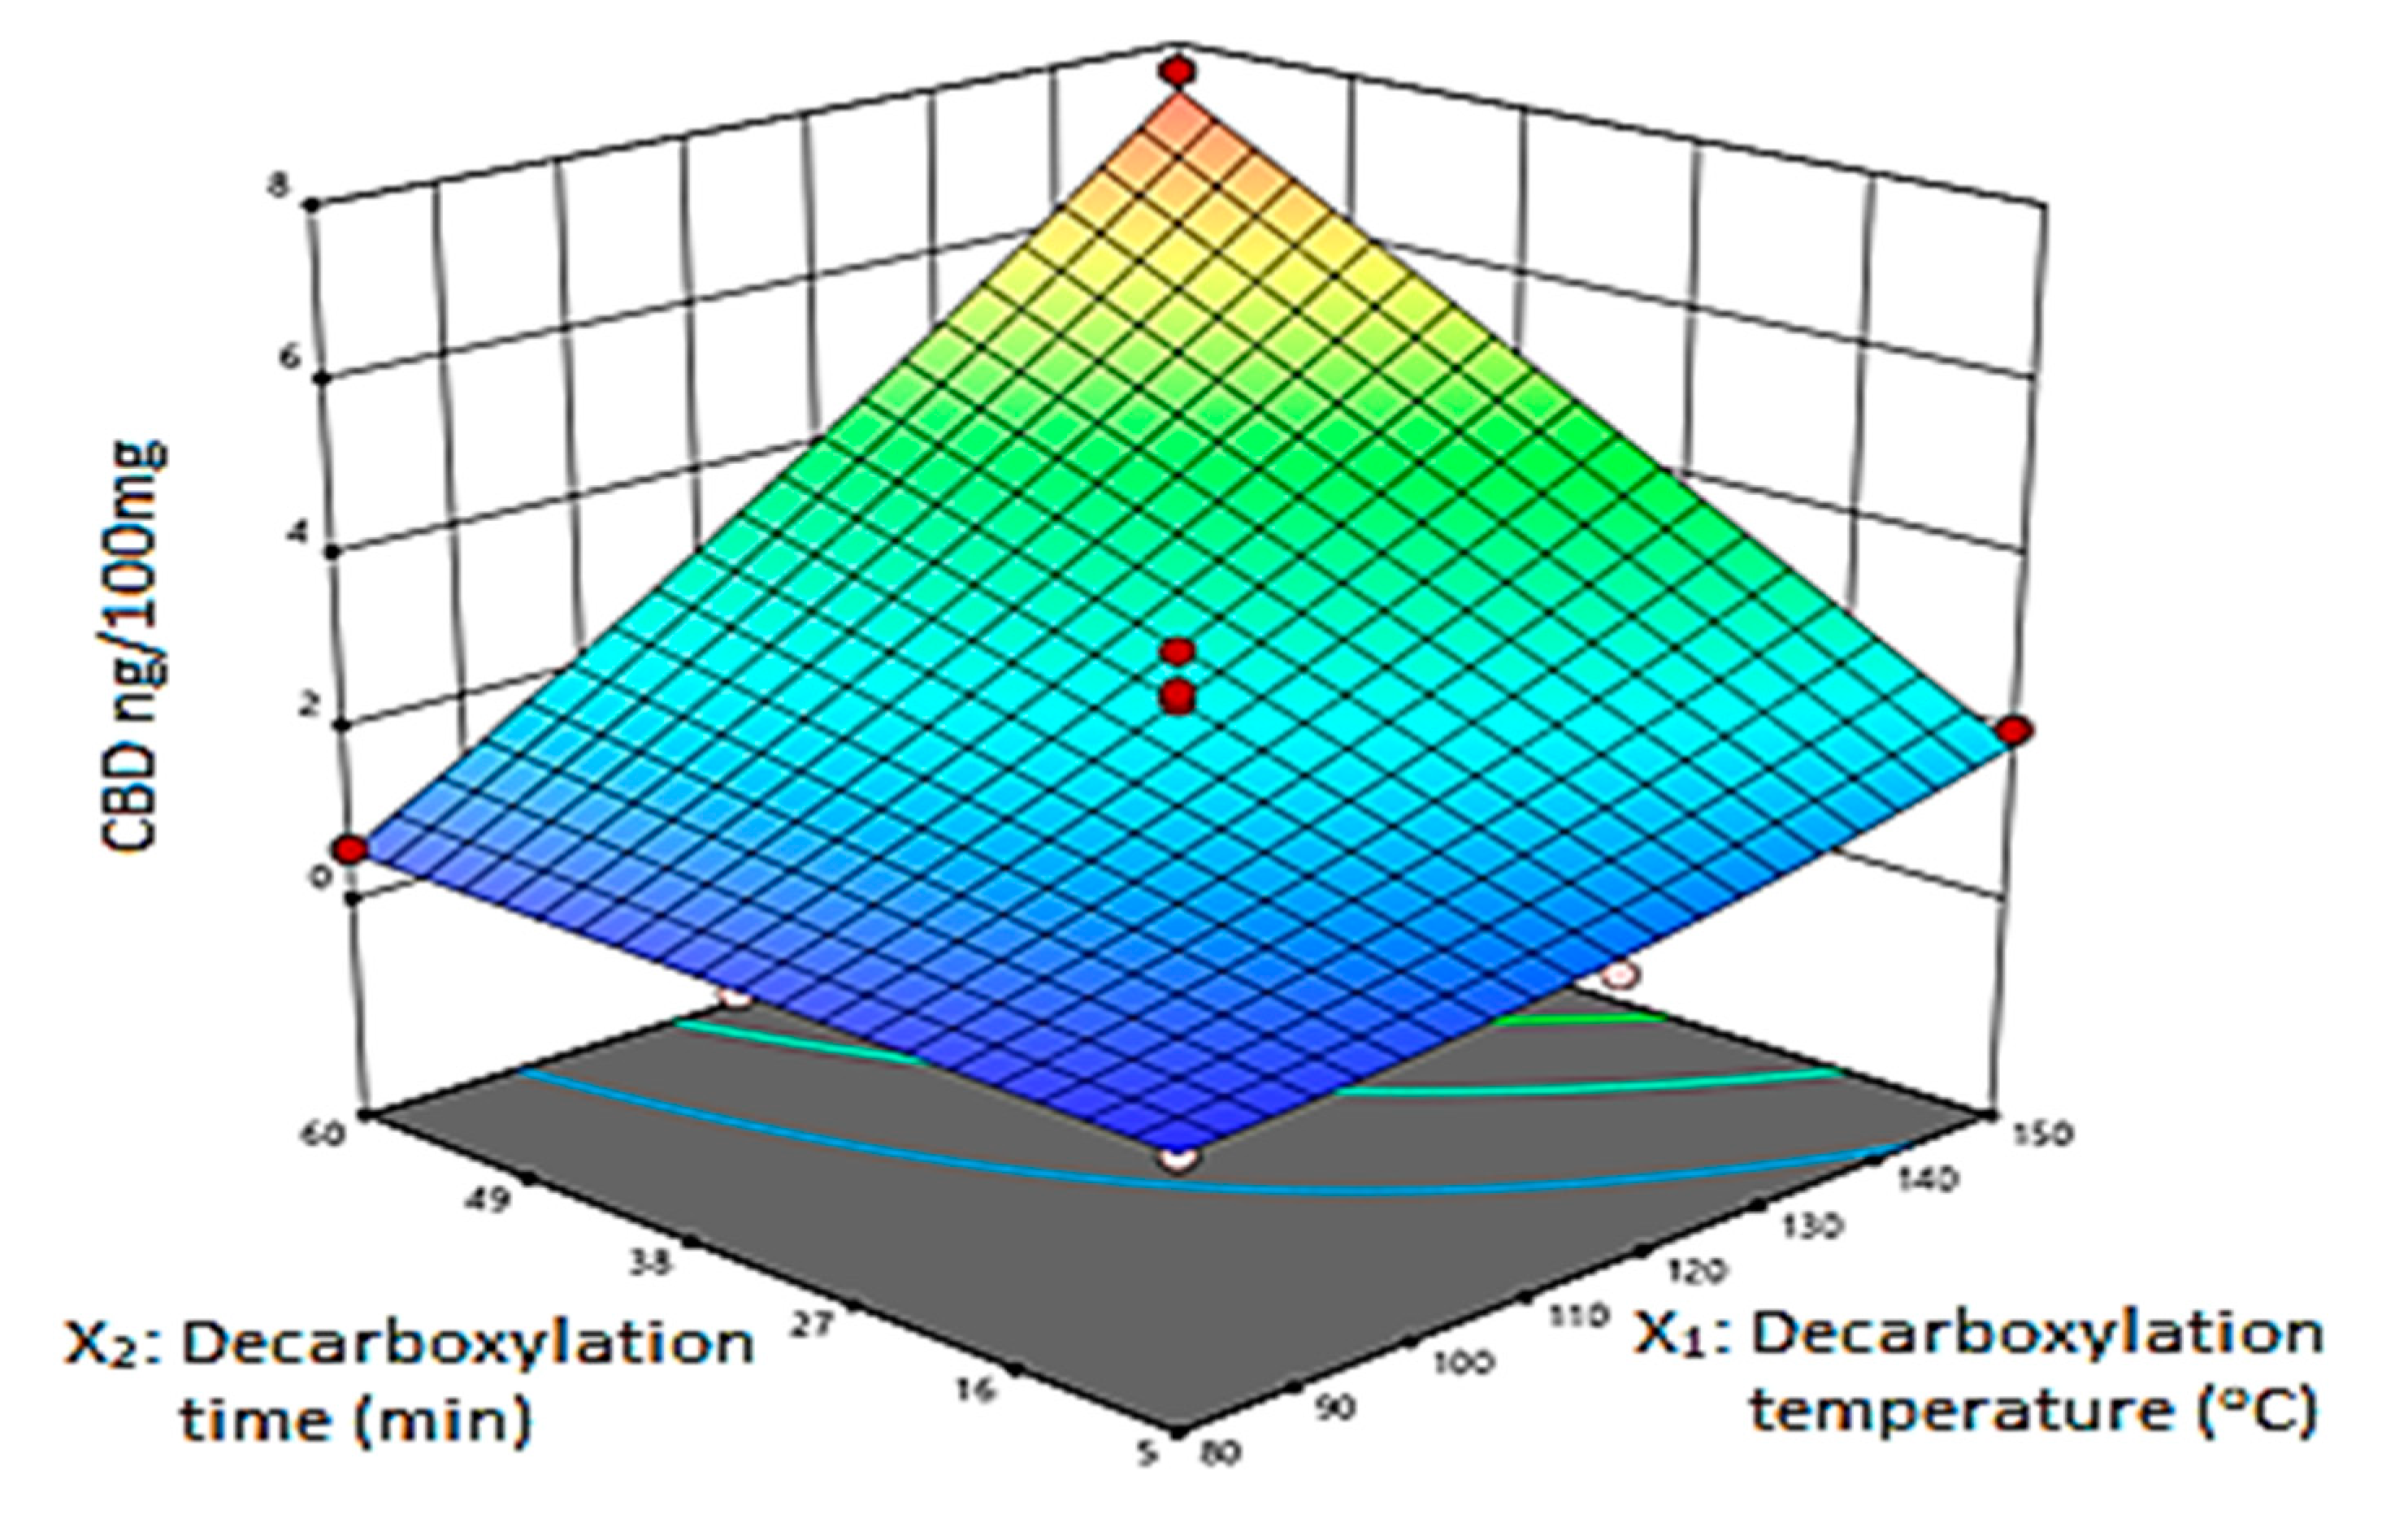
Figure 2) and the 3D response surface plots (
Figure 3). The coefficient plots depict the significance of the terms on the THC, CBN and CBD content. The 3D plots illustrate the interactive effect of decarboxylation temperature and decarboxylation time on the amount of CBD, CBN and THC extracted. Regarding THC and CBN, the coefficient plots revealed that temperature had a significant, negative influence on the response. In contrast to THC and CBN, the decarboxylation temperature had a significant, positive influence on the CBD content. The decarboxylation time showed a positive, significant influence on the amount of CBD, CBN and THC recovered. Regarding the CBD content, factors showed that there was a substantial variation of the amount of CBD recovered when there was an interaction between temperature and time. Therefore, a steep rise in CBD yield was observed when both temperature and time were increased. The use of heat accelerates THC degradation, which results in CBN generation. Consequently, heating the
C. sativa plant in the dark suppressed production of CBN, which resulted in low recovery. Wang et al. [
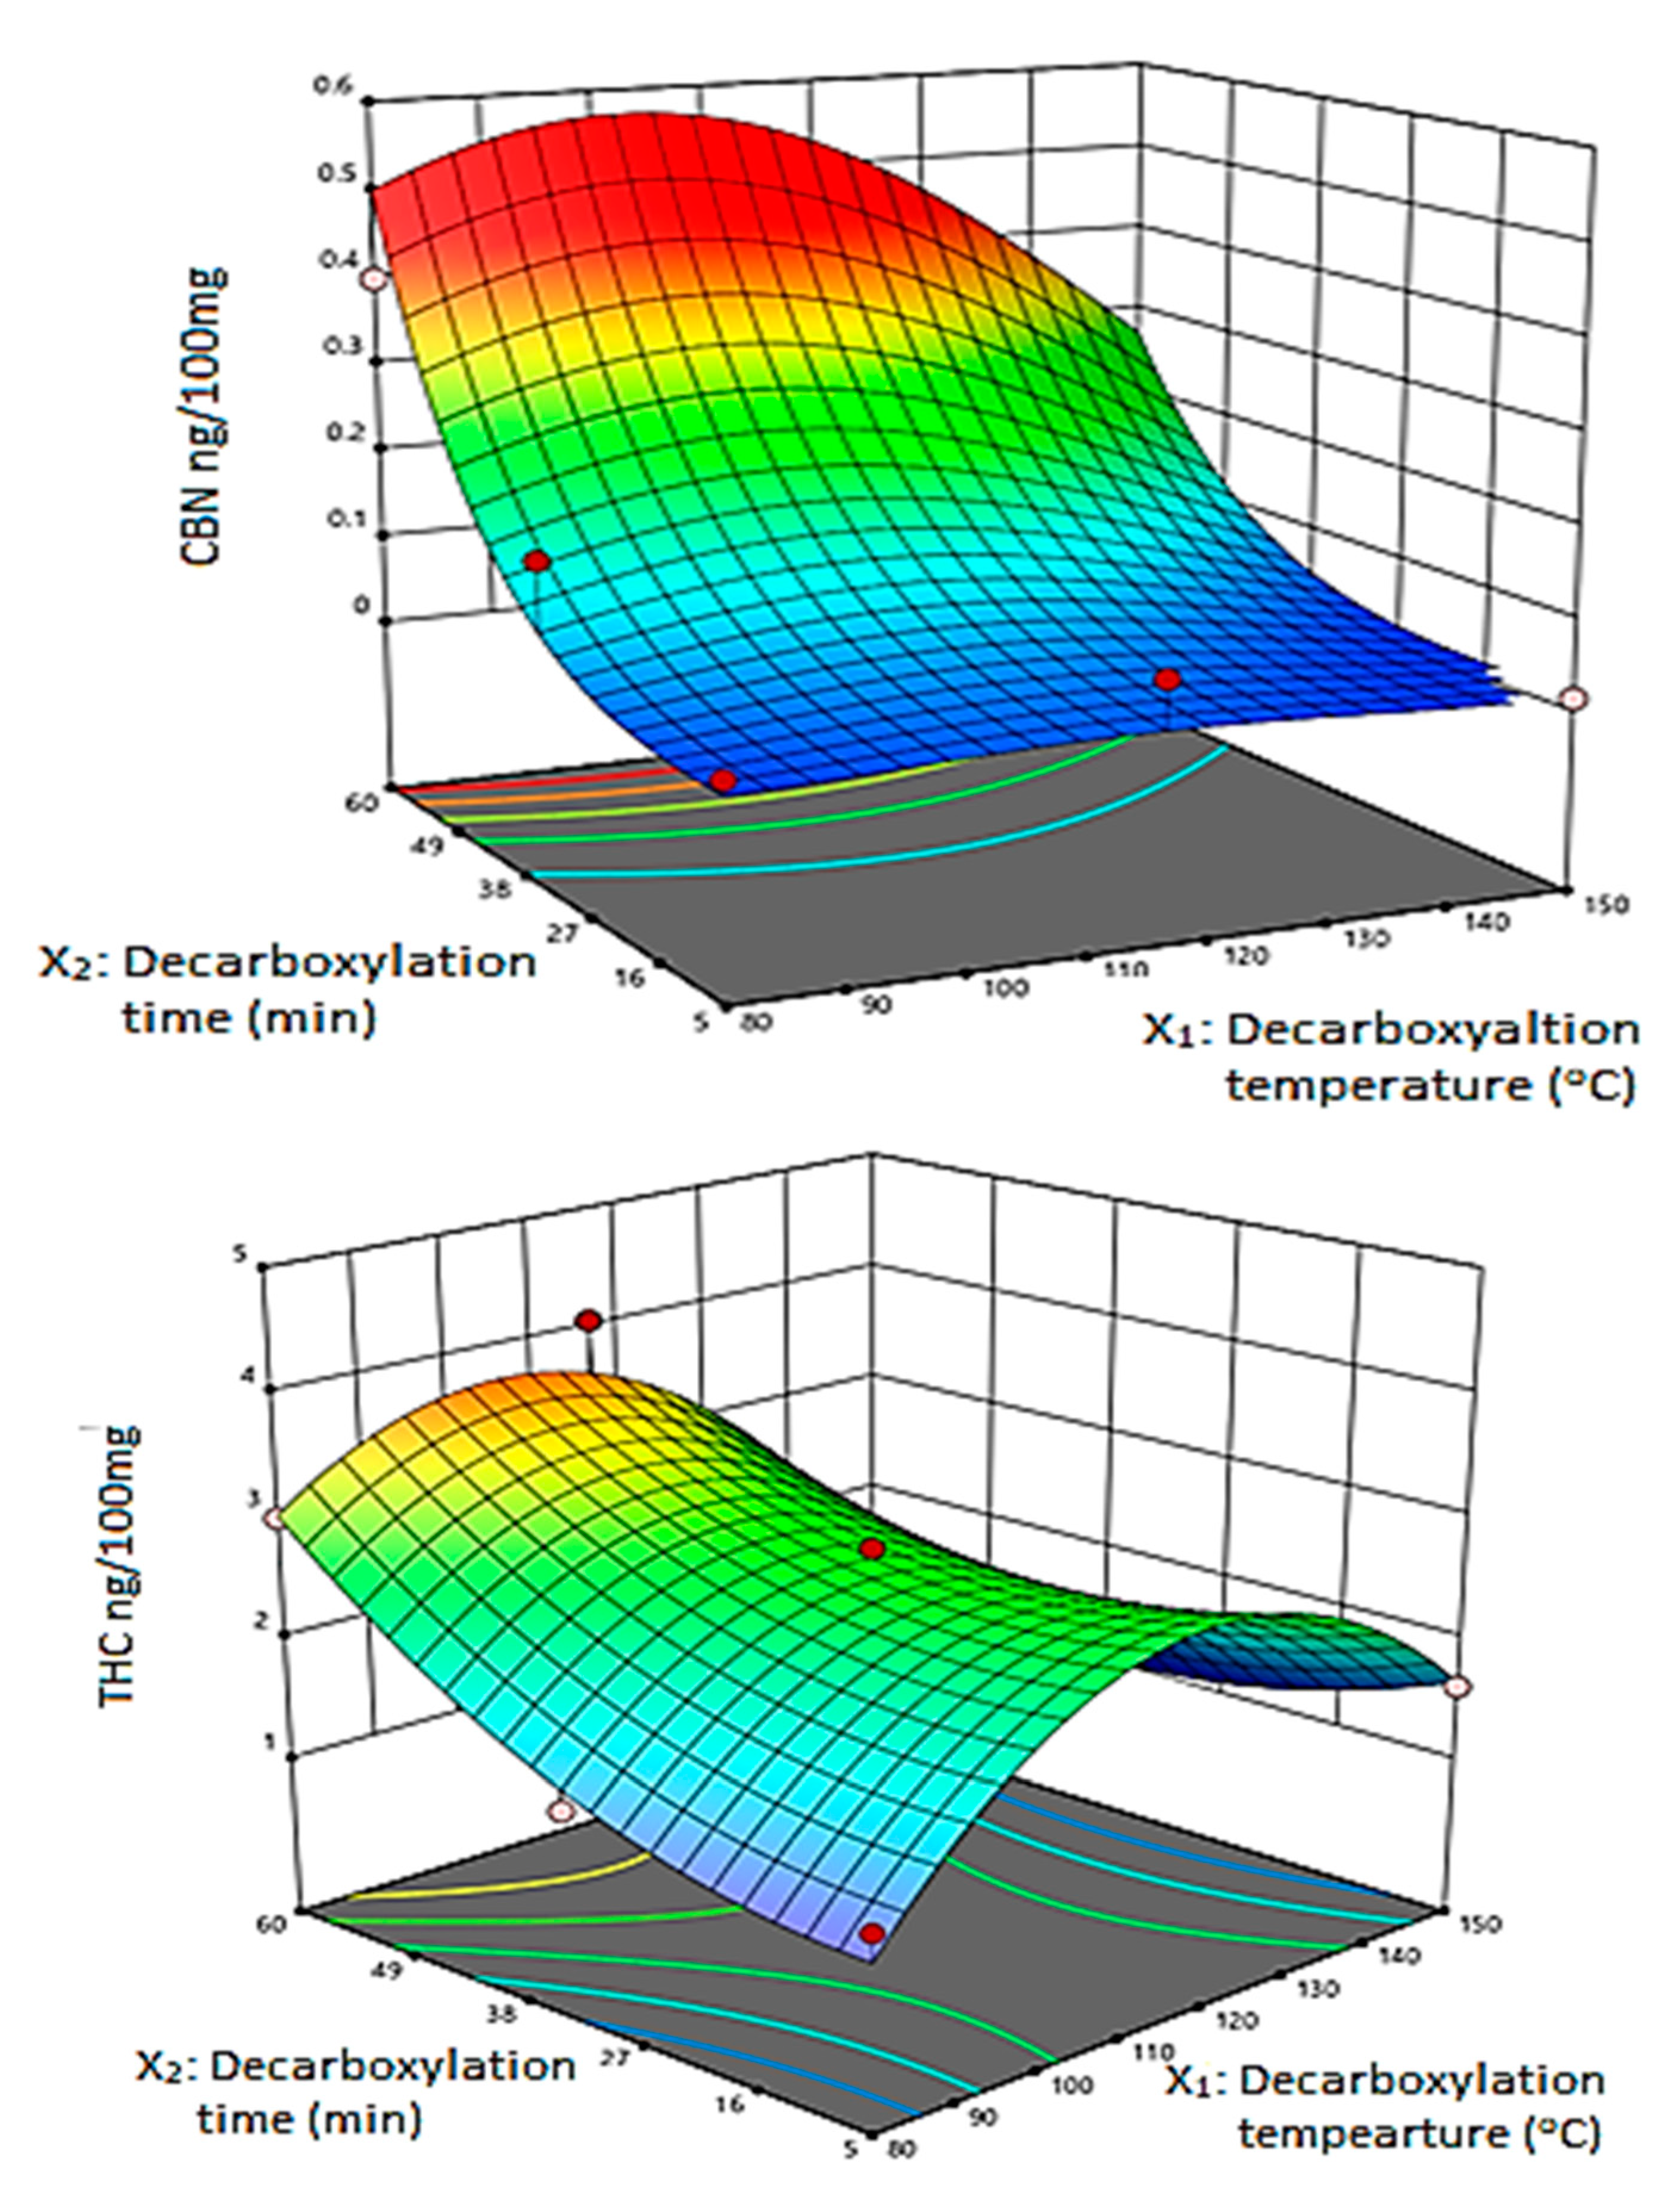
9] made a similar observation that decarboxylation carried out in a dark vacuum oven suppressed CBN formation. The influence of temperature and time on the THC content was captured by the saddle-shaped response surface (
Figure 3). The coefficient plots (
Figure 2) show that both time and temperature had a significant influence on the amount of THC in the extract. The minimum yield was observed when the cannabis material was exposed to low temperatures over a short period of time.
A steady increase occurred when both temperature and time were increased, and the maximum THC content for the considered experimental region was observed at 60 min and approximately 110 °C. Above 125 °C, a loss of THC was observed due to degradation. However, the maximum yield of CBD was obtained at 150 °C after heating for 60 min. There was no decrease in CBD observed with rising decarboxylation temperatures at approximately 150 °C and time over the studied experimental range. According to Moreno et al. [
5], the loss of CBD is expected to occur only when heating for 60 min at 160 °C and above.
3.5. Optimal Extraction Conditions
Desirable experimental conditions for in situ decarboxylation are needed to obtain CBD-rich cannabis extracts with low content of the psychoactive components, such as THC and CBN. An optimization tool in RSM was used to find the appropriate settings of decarboxylation temperature and time for high CBD recovery. The optimal conditions for decarboxylation temperature and time were found to be 149.9 °C and 42.2 min, respectively. The composition of the cannabis extract predicted using the established model is reported in
Table 8.
For verification, extractions were carried out under the predicted, optimal conditions in triplicate. It was observed that the predicted amounts fell within the standard deviation of the experimental recoveries, therefore suggesting that the observed and experimental responses were in close agreement and that the established model was reliable for estimations and can be used for future predictions.


