
Artificial Intelligence Assisted Ultrasonic Extraction of Total Flavonoids from Rosa sterilis


Abstract
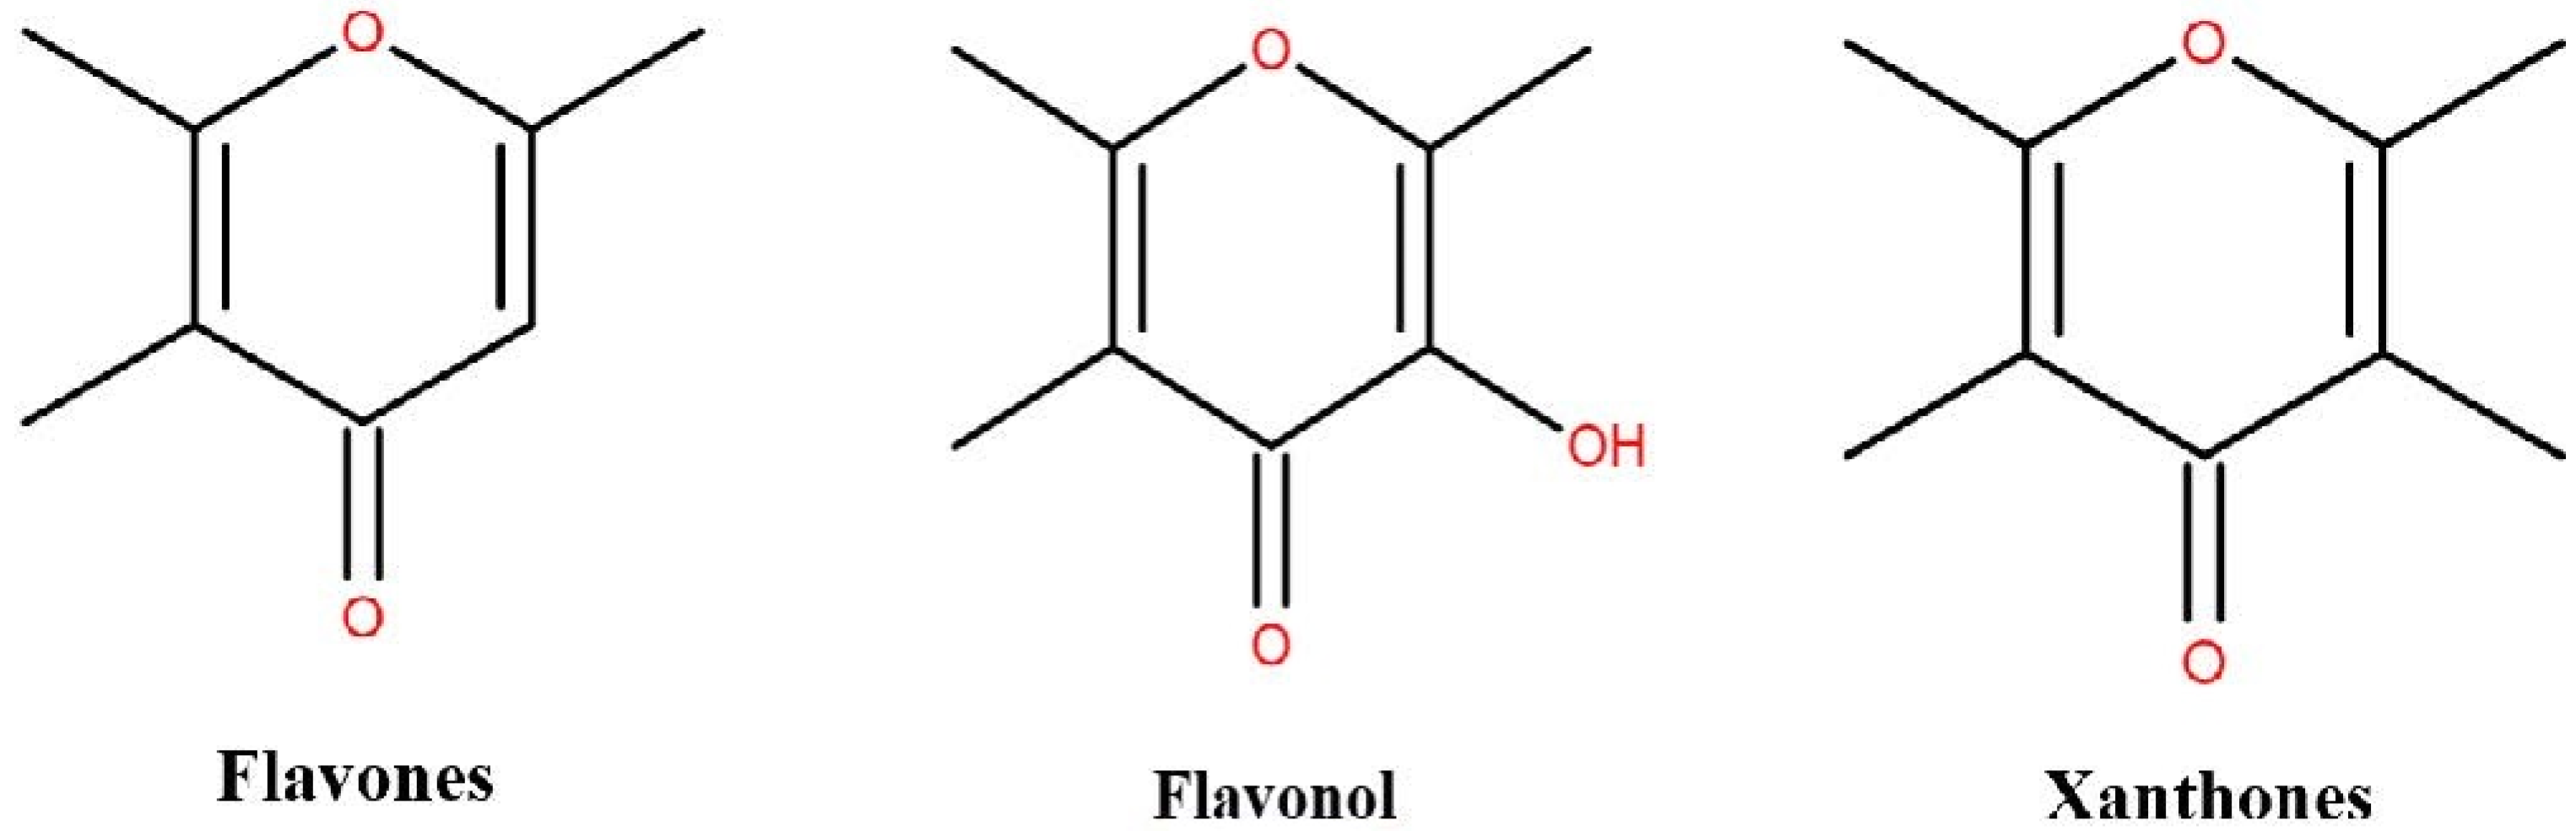
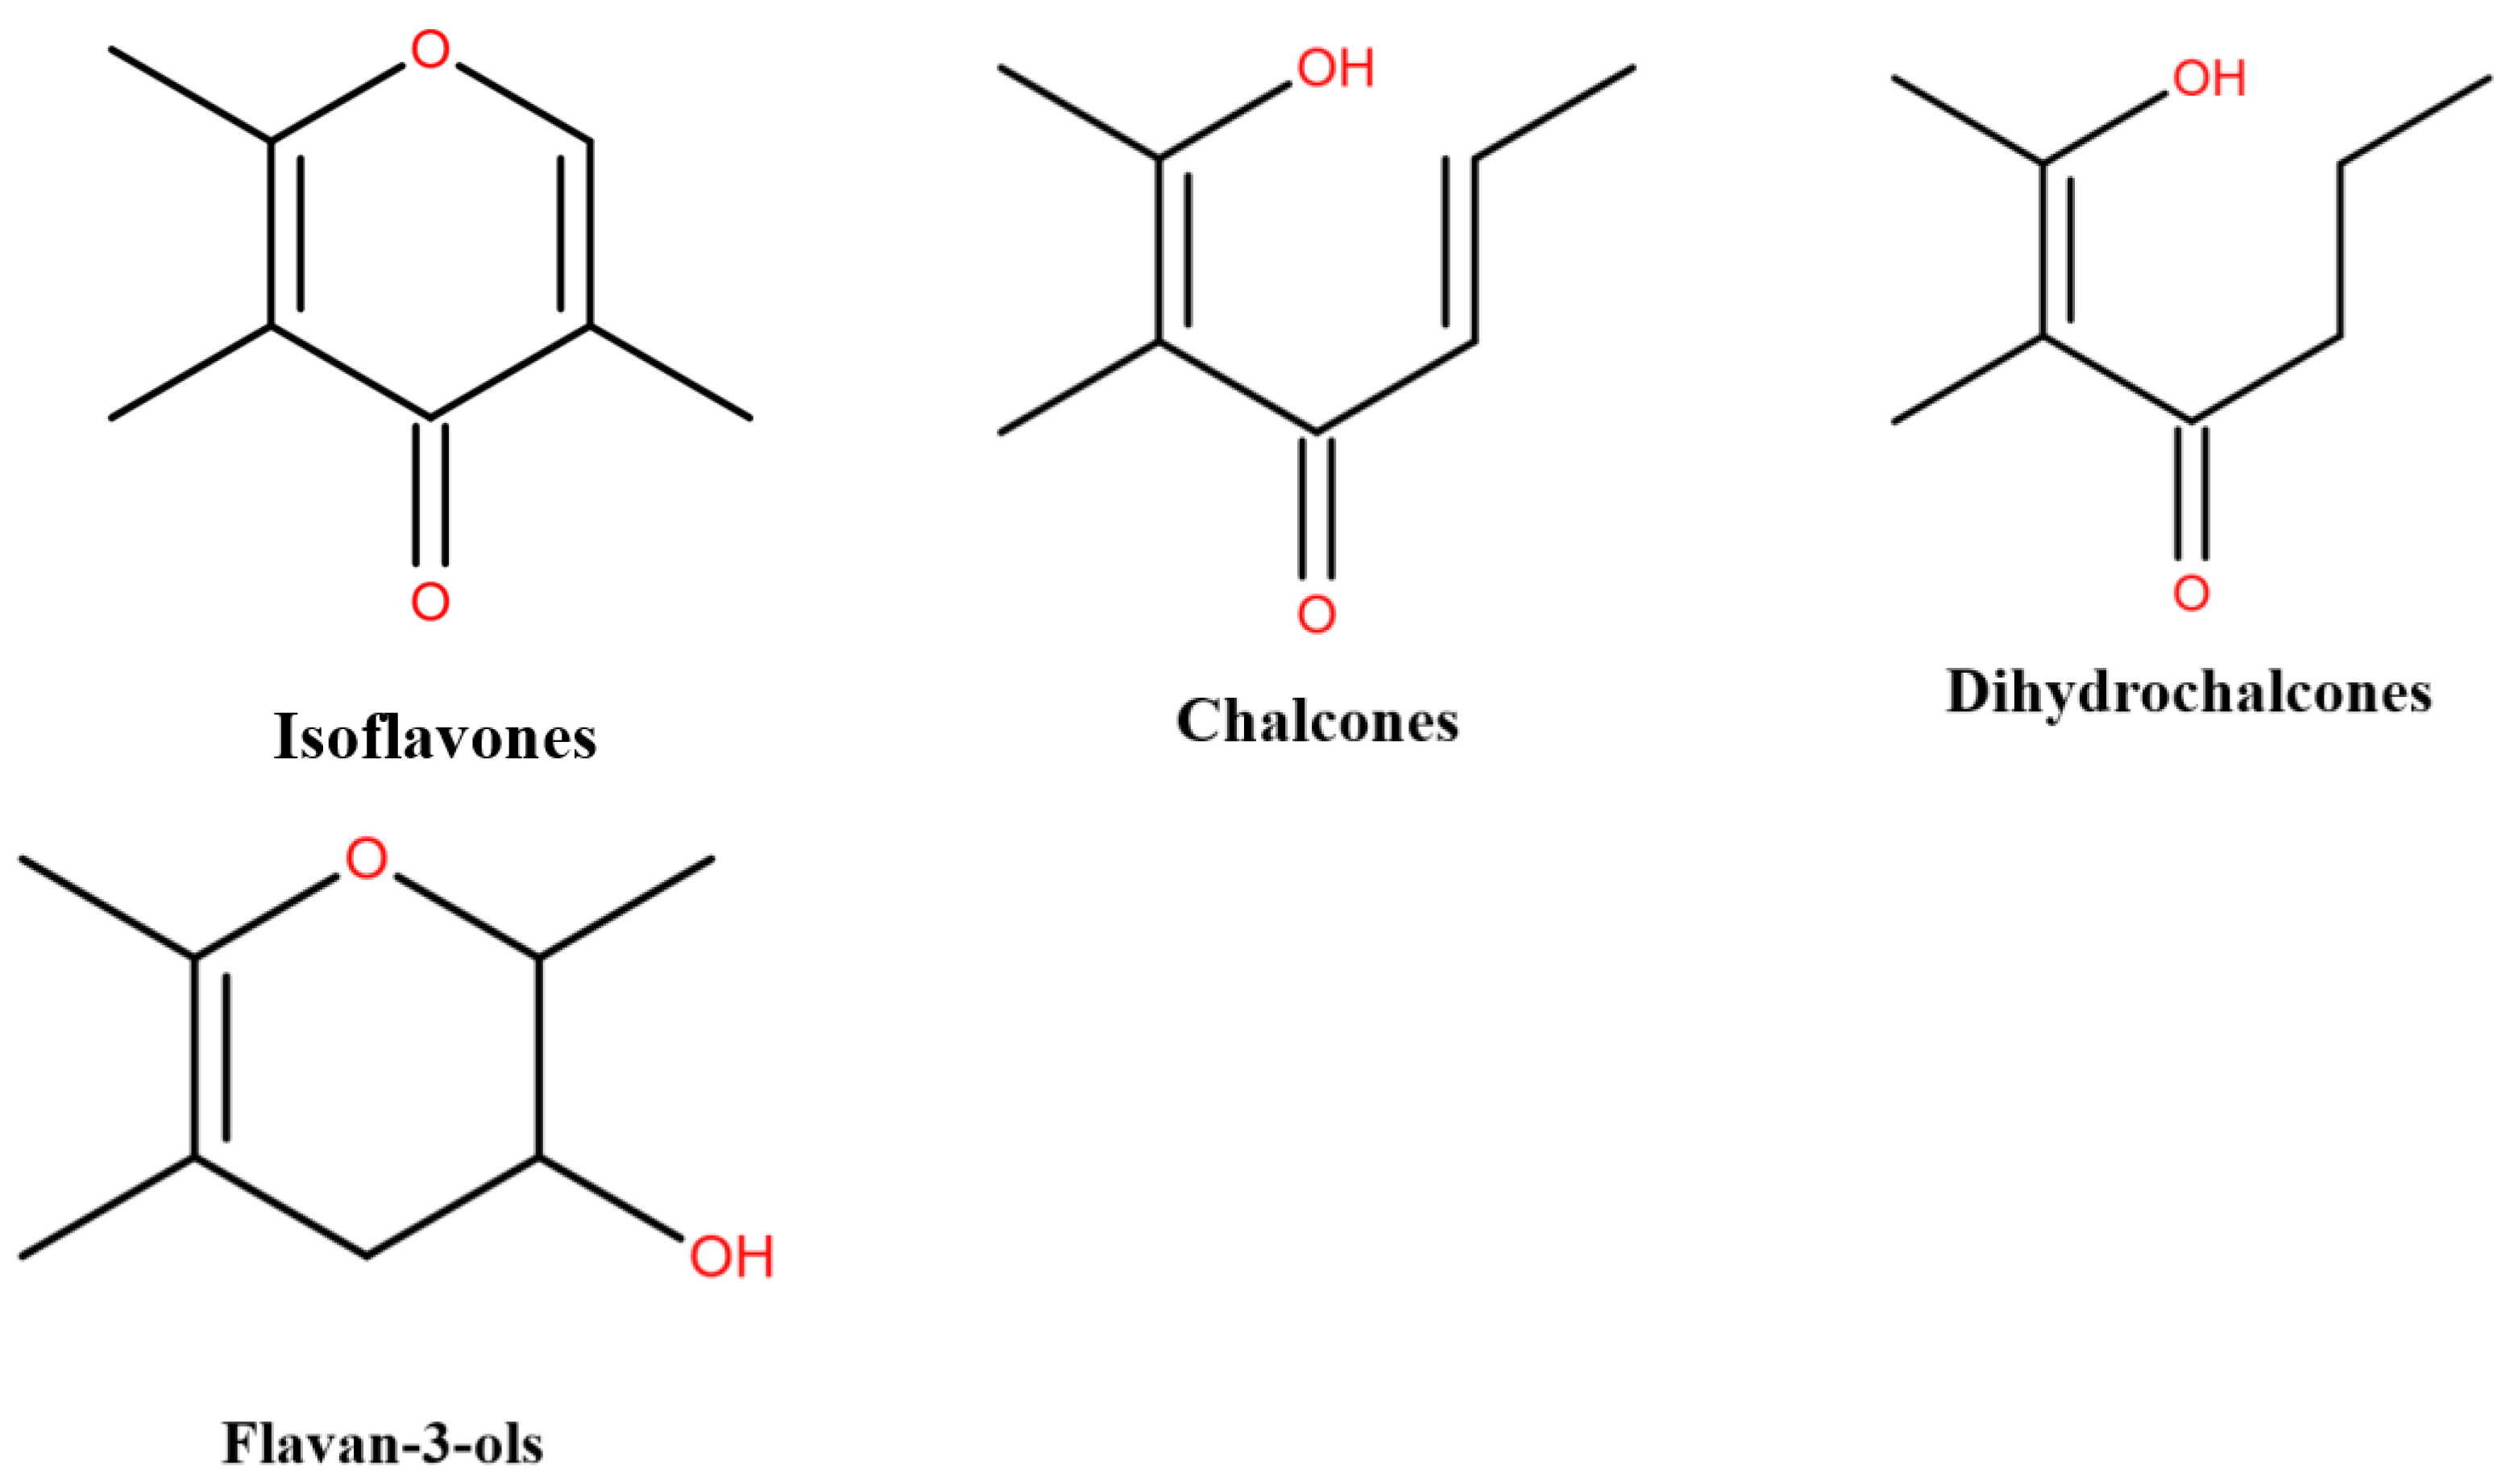
:1. Introduction
2. Materials and Methods
2.1. Materials
2.2. Instruments and Equipment
3. Experimental Methods
3.1. Single Factor Experiment
3.1.1. Making of Standard Curve
3.1.2. Single Factor Experiment
3.2. Optimization Method
3.2.1. Response Surface Methodology
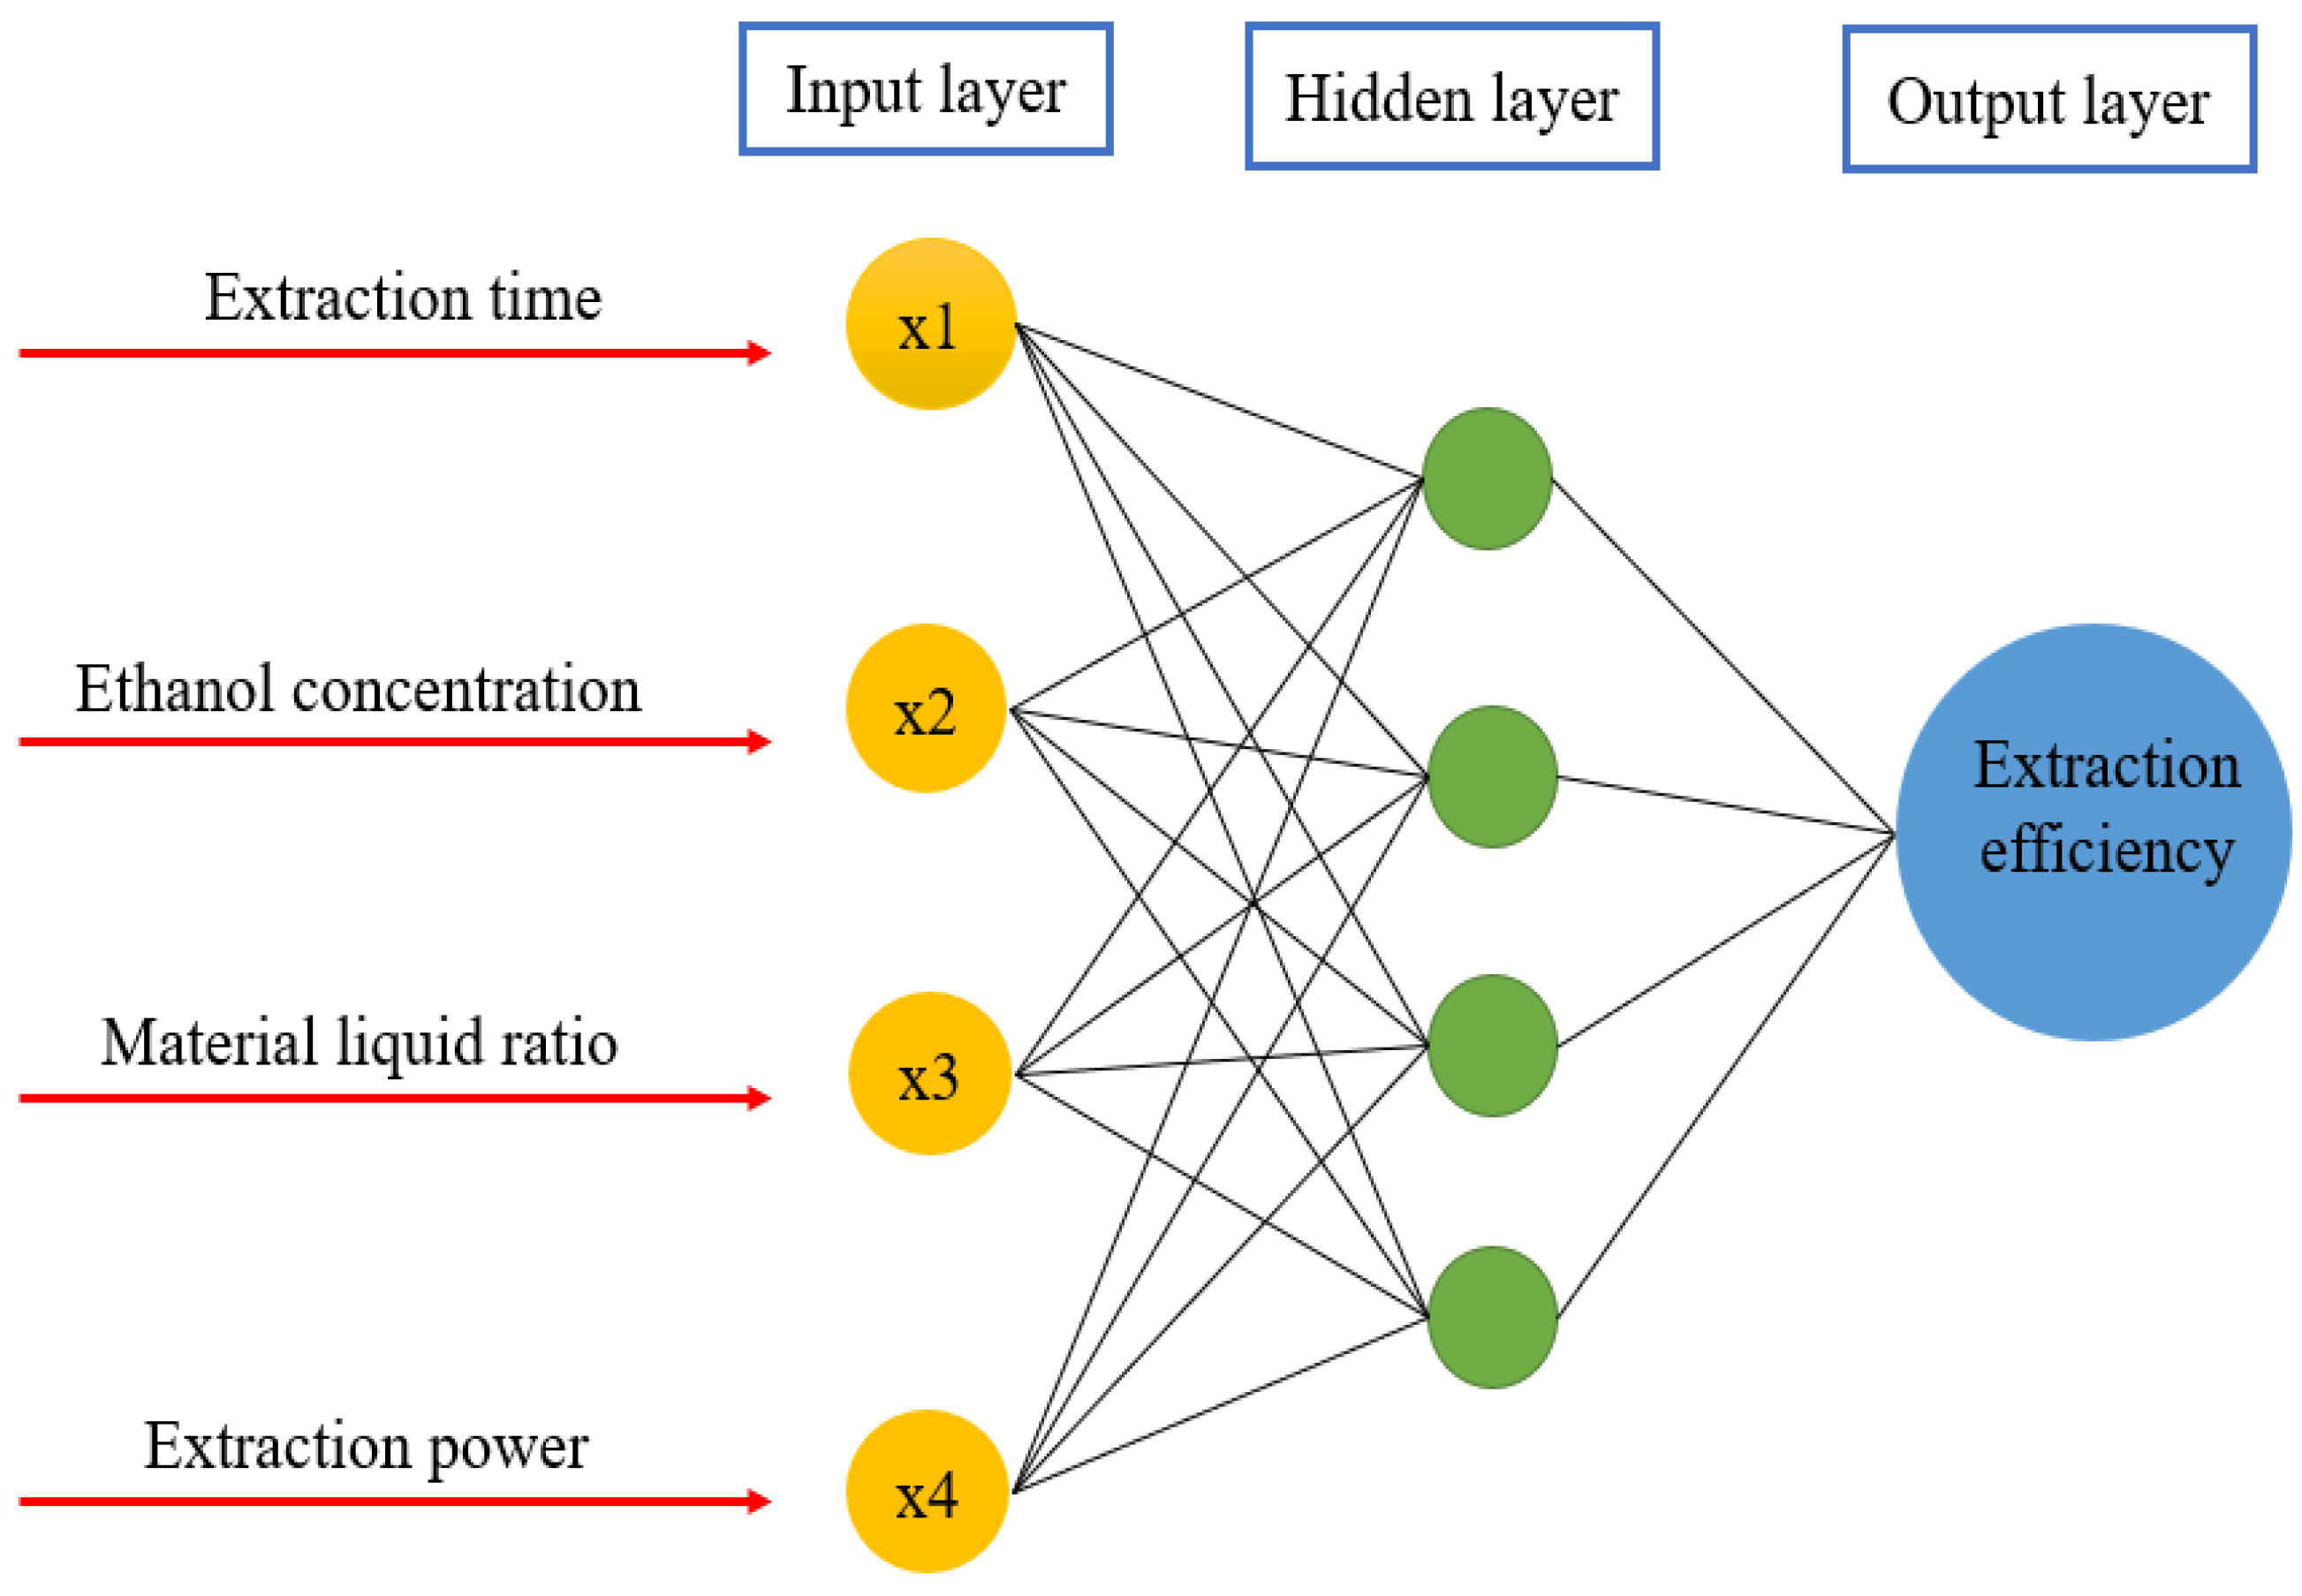
3.2.2. ANN Modeling
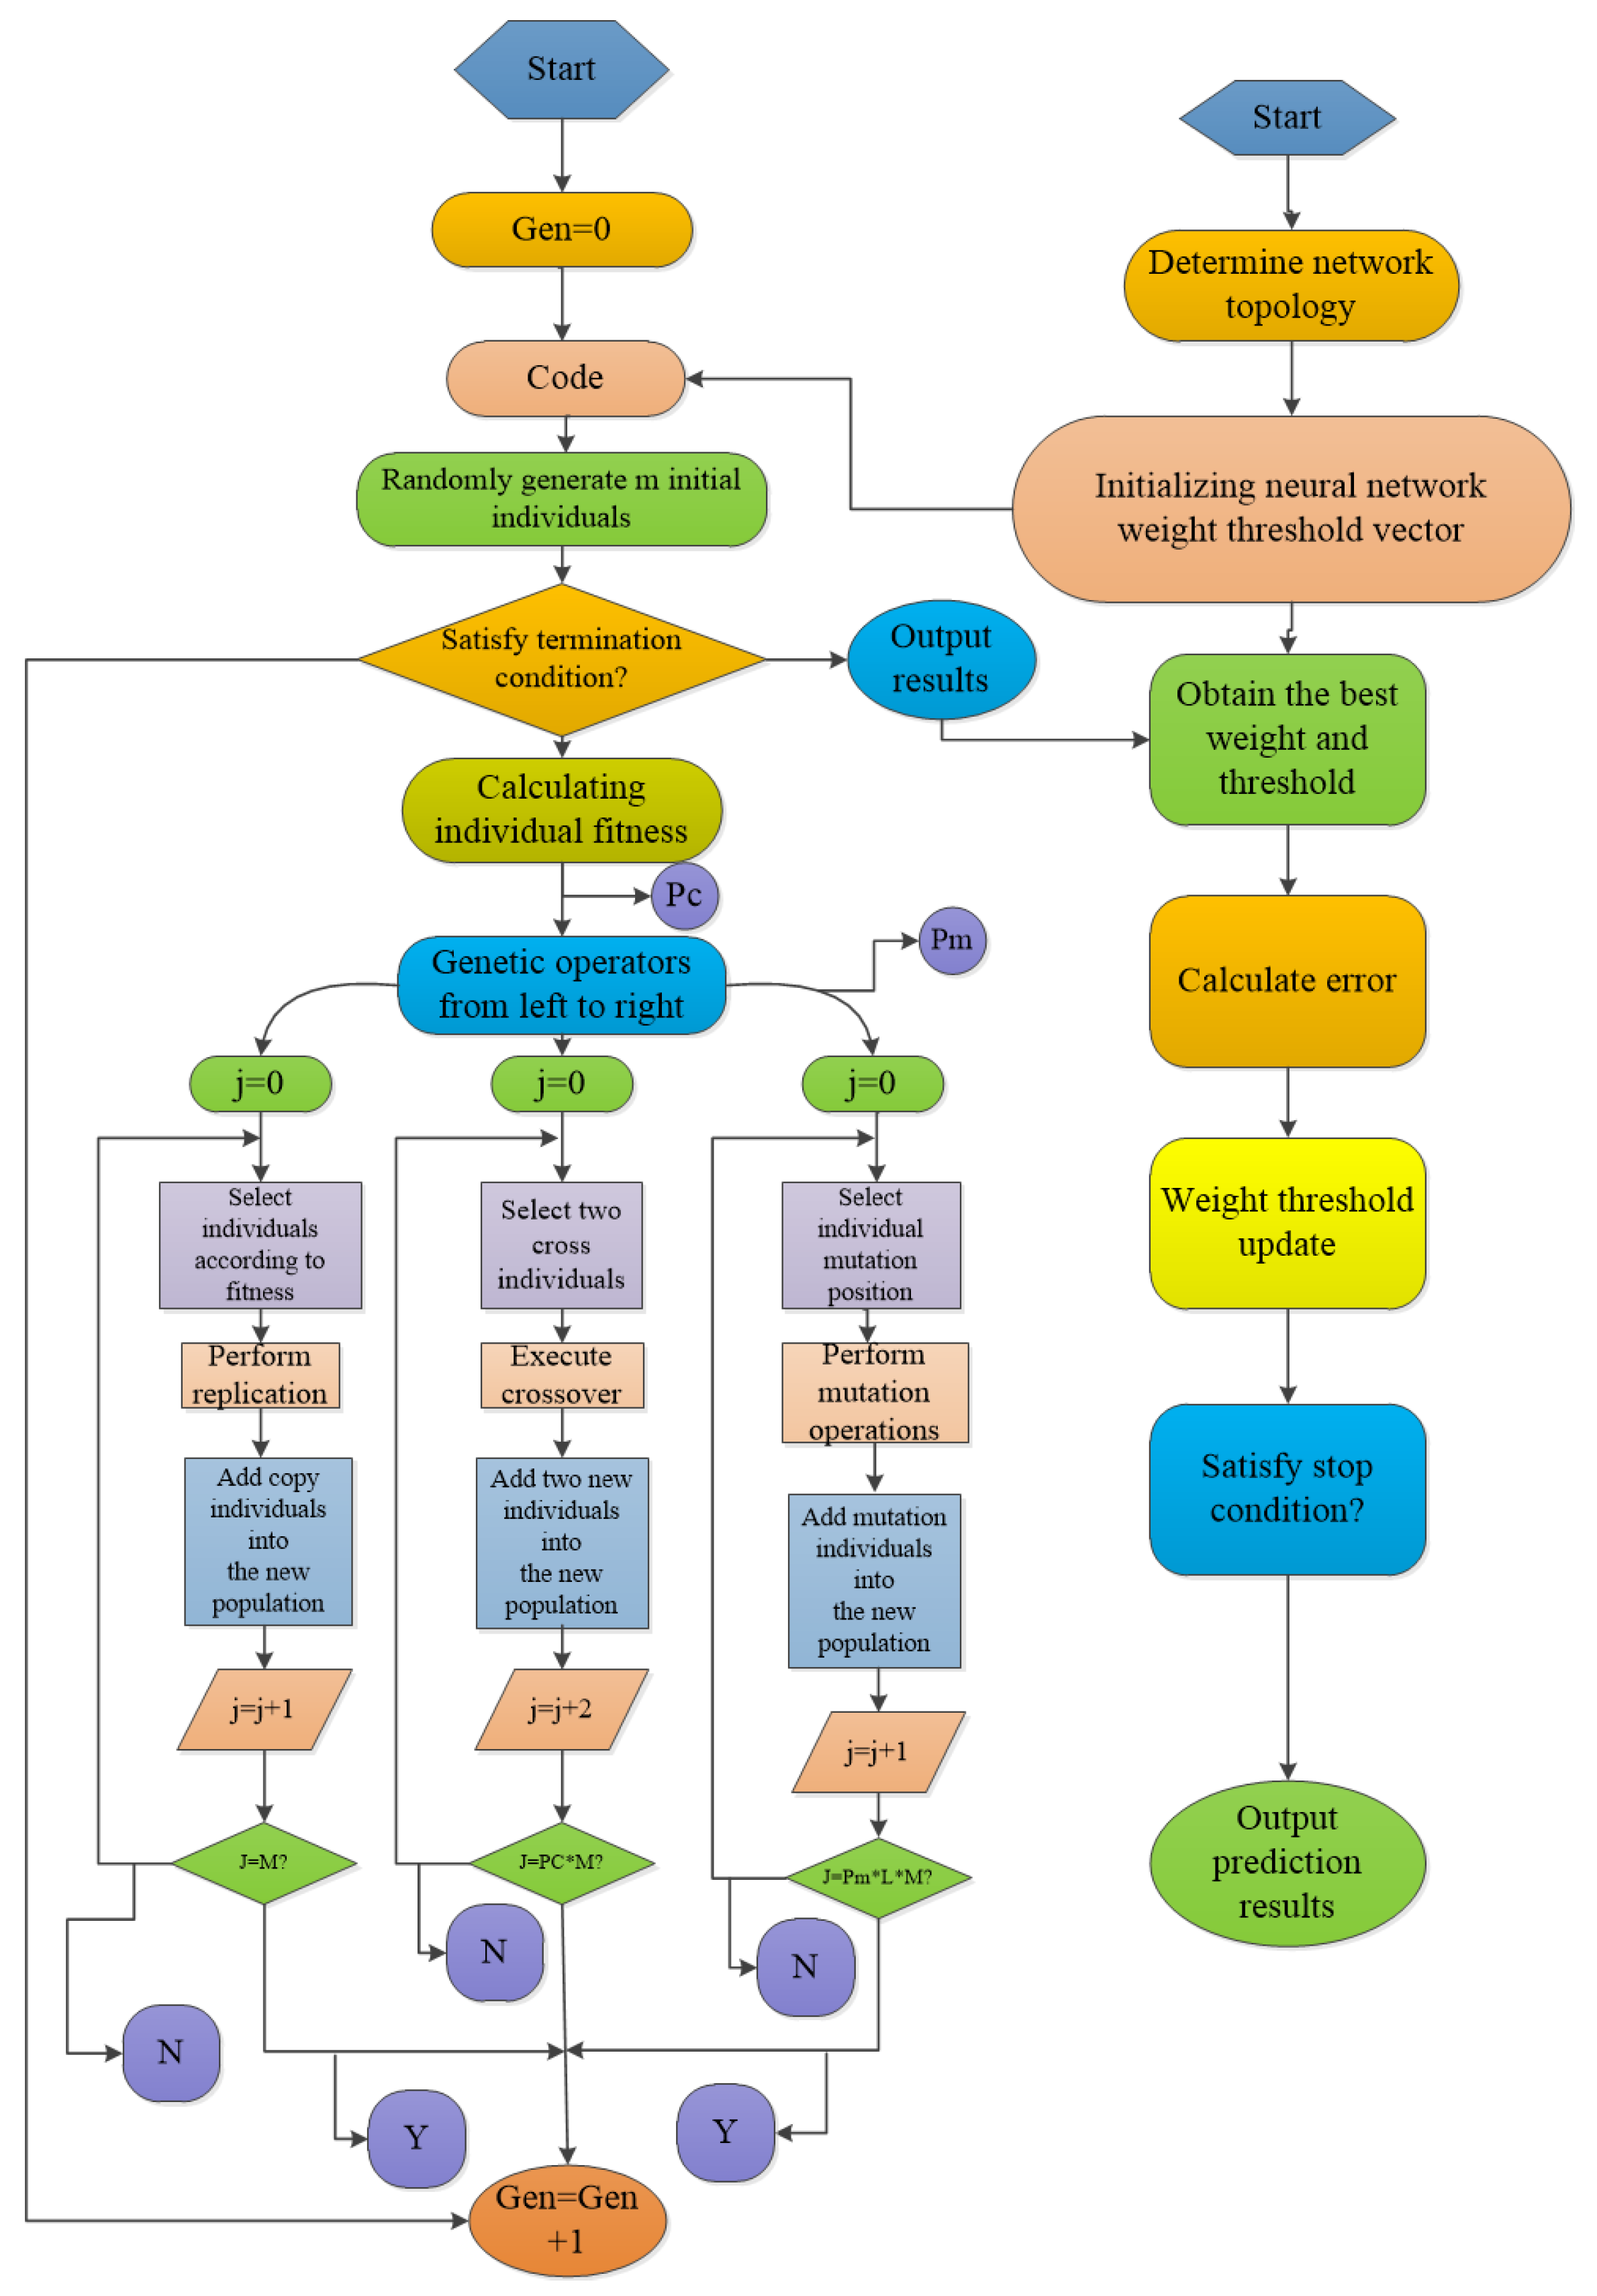
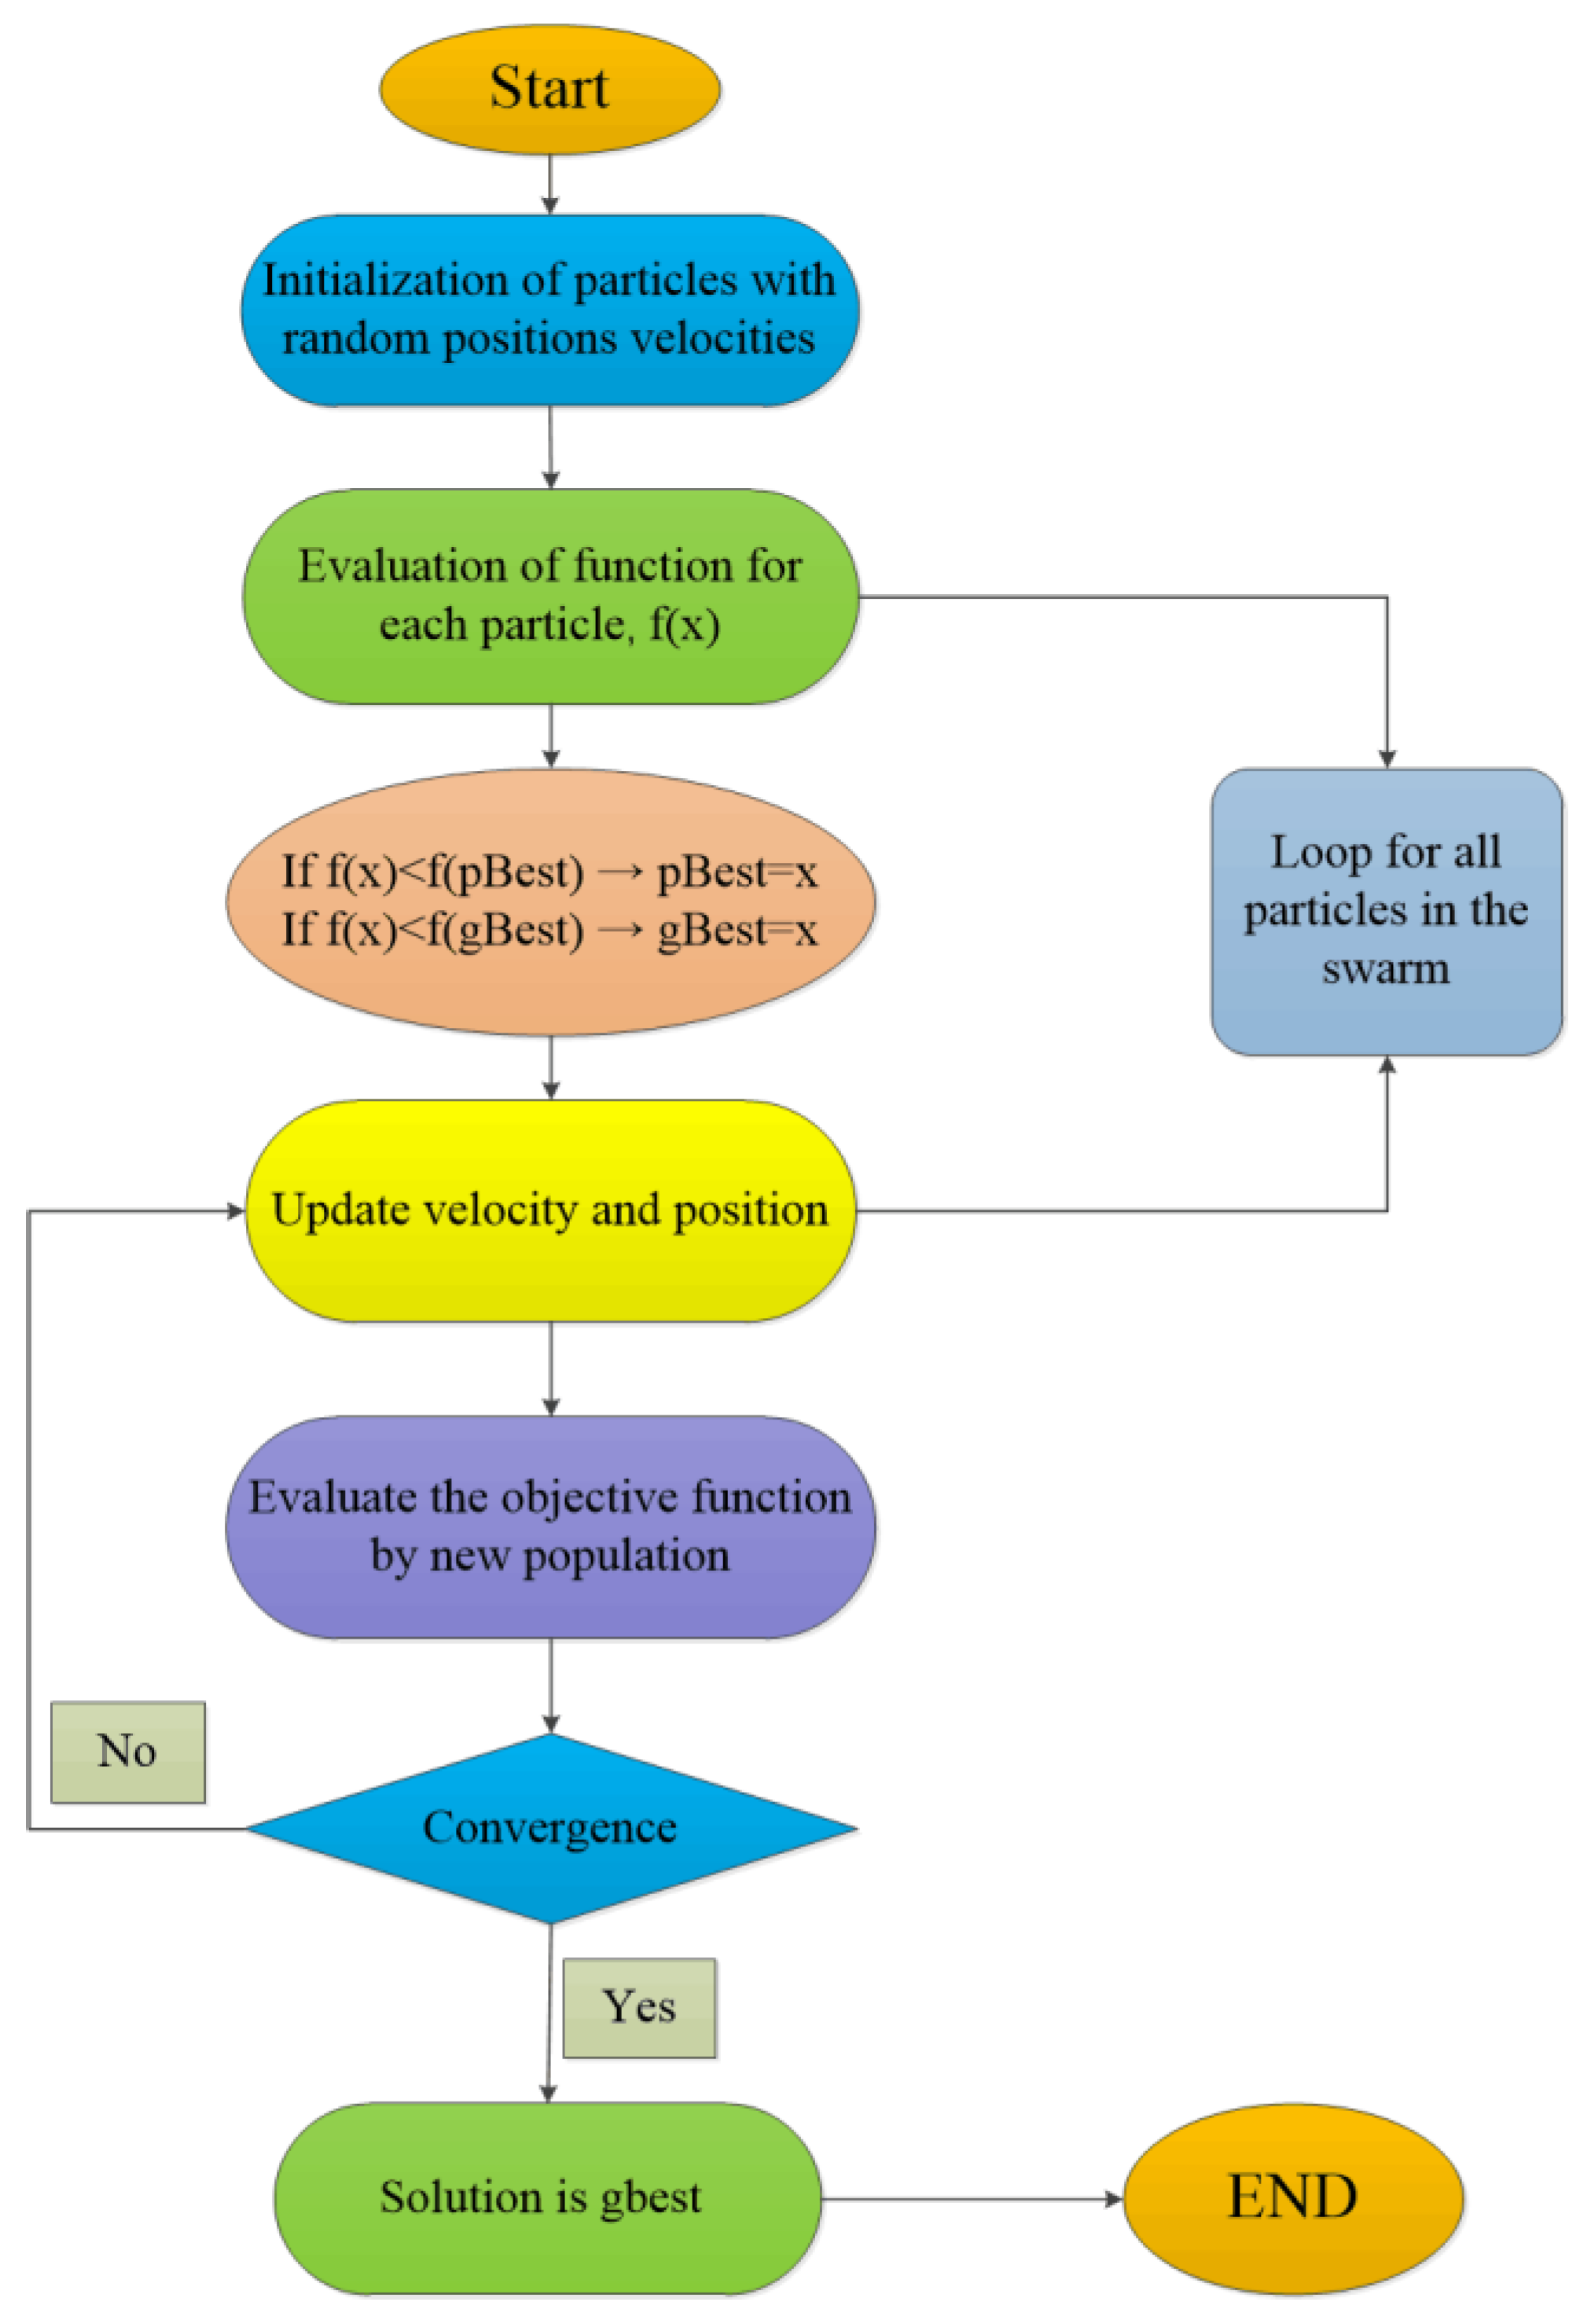
3.2.3. Optimization of ANN-GA and ANN-PSO
3.3. Importance Ranking
3.4. Determination of Free Radical Scavenging Ability
3.4.1. Scavenging Effect of Flavonoids on 2,2-diphenyl-1-picrylhydrazine (DPPH)
3.4.2. Scavenging Effect of Flavonoids on Superoxide Anion Radical (O2−·)
3.4.3. Scavenging Effect of Flavonoids on Hydroxyl Radical ·OH
4. Results and Discussion
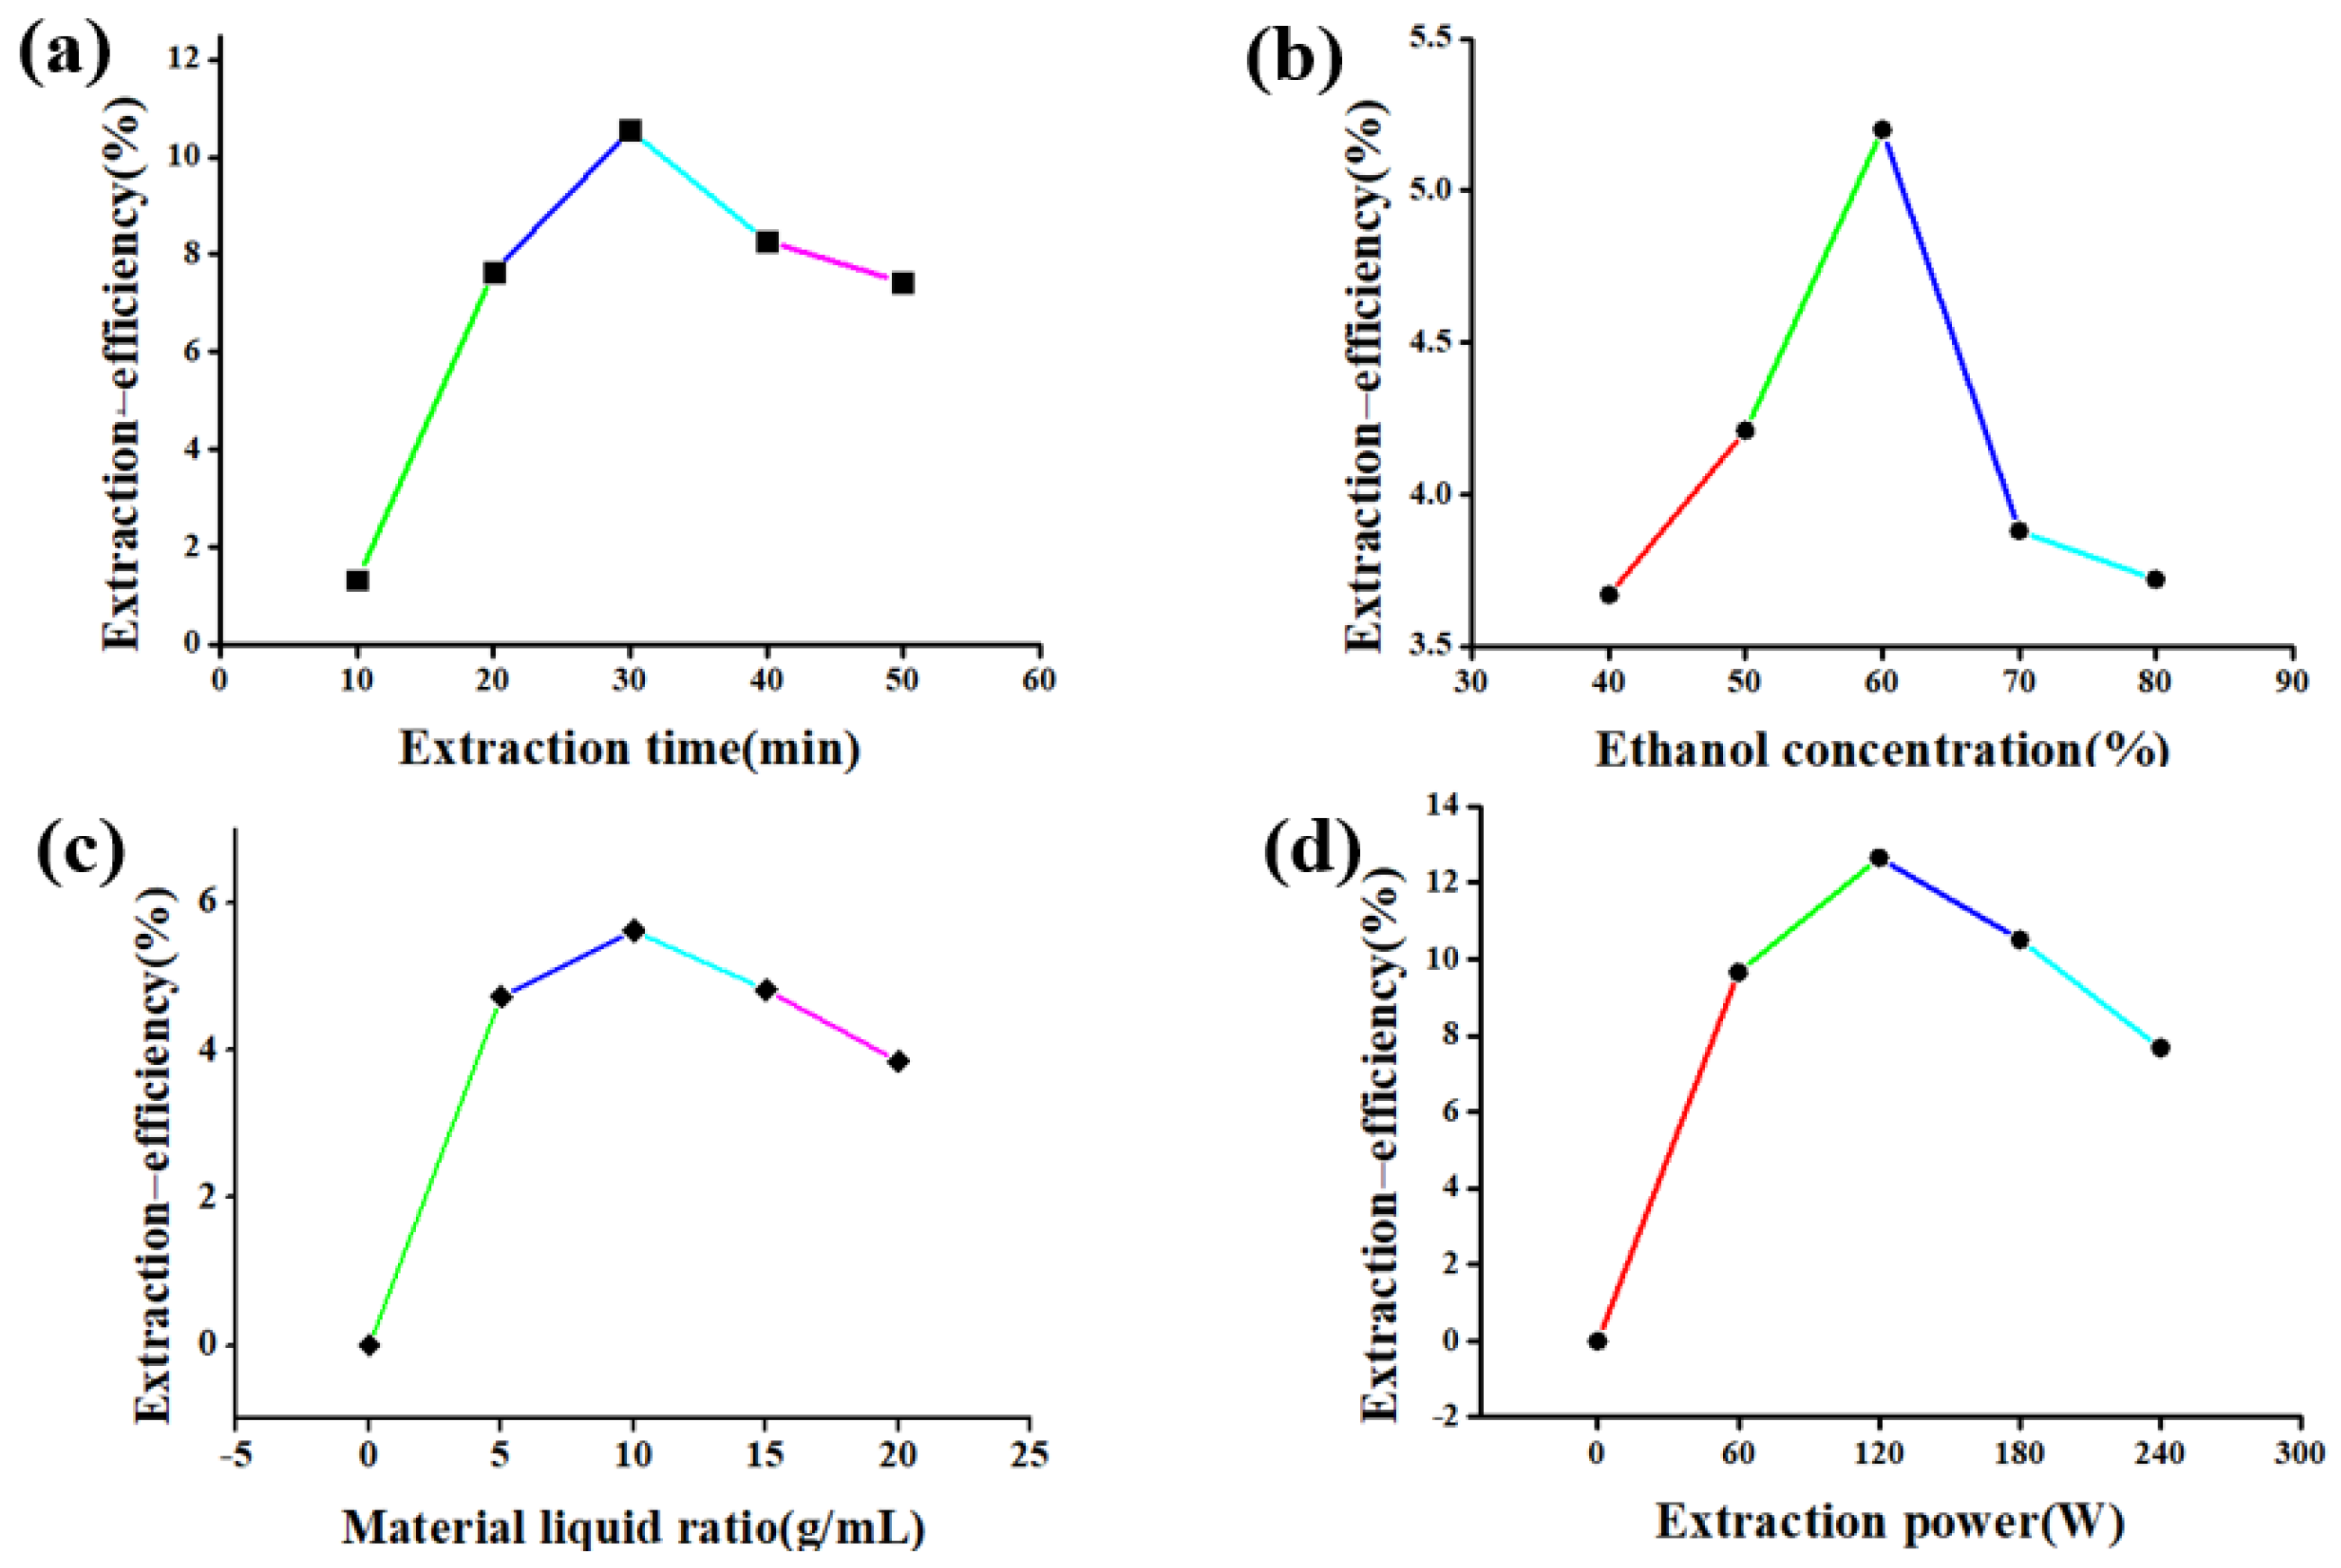
4.1. Single Factor Experiment
4.2. Optimization Results
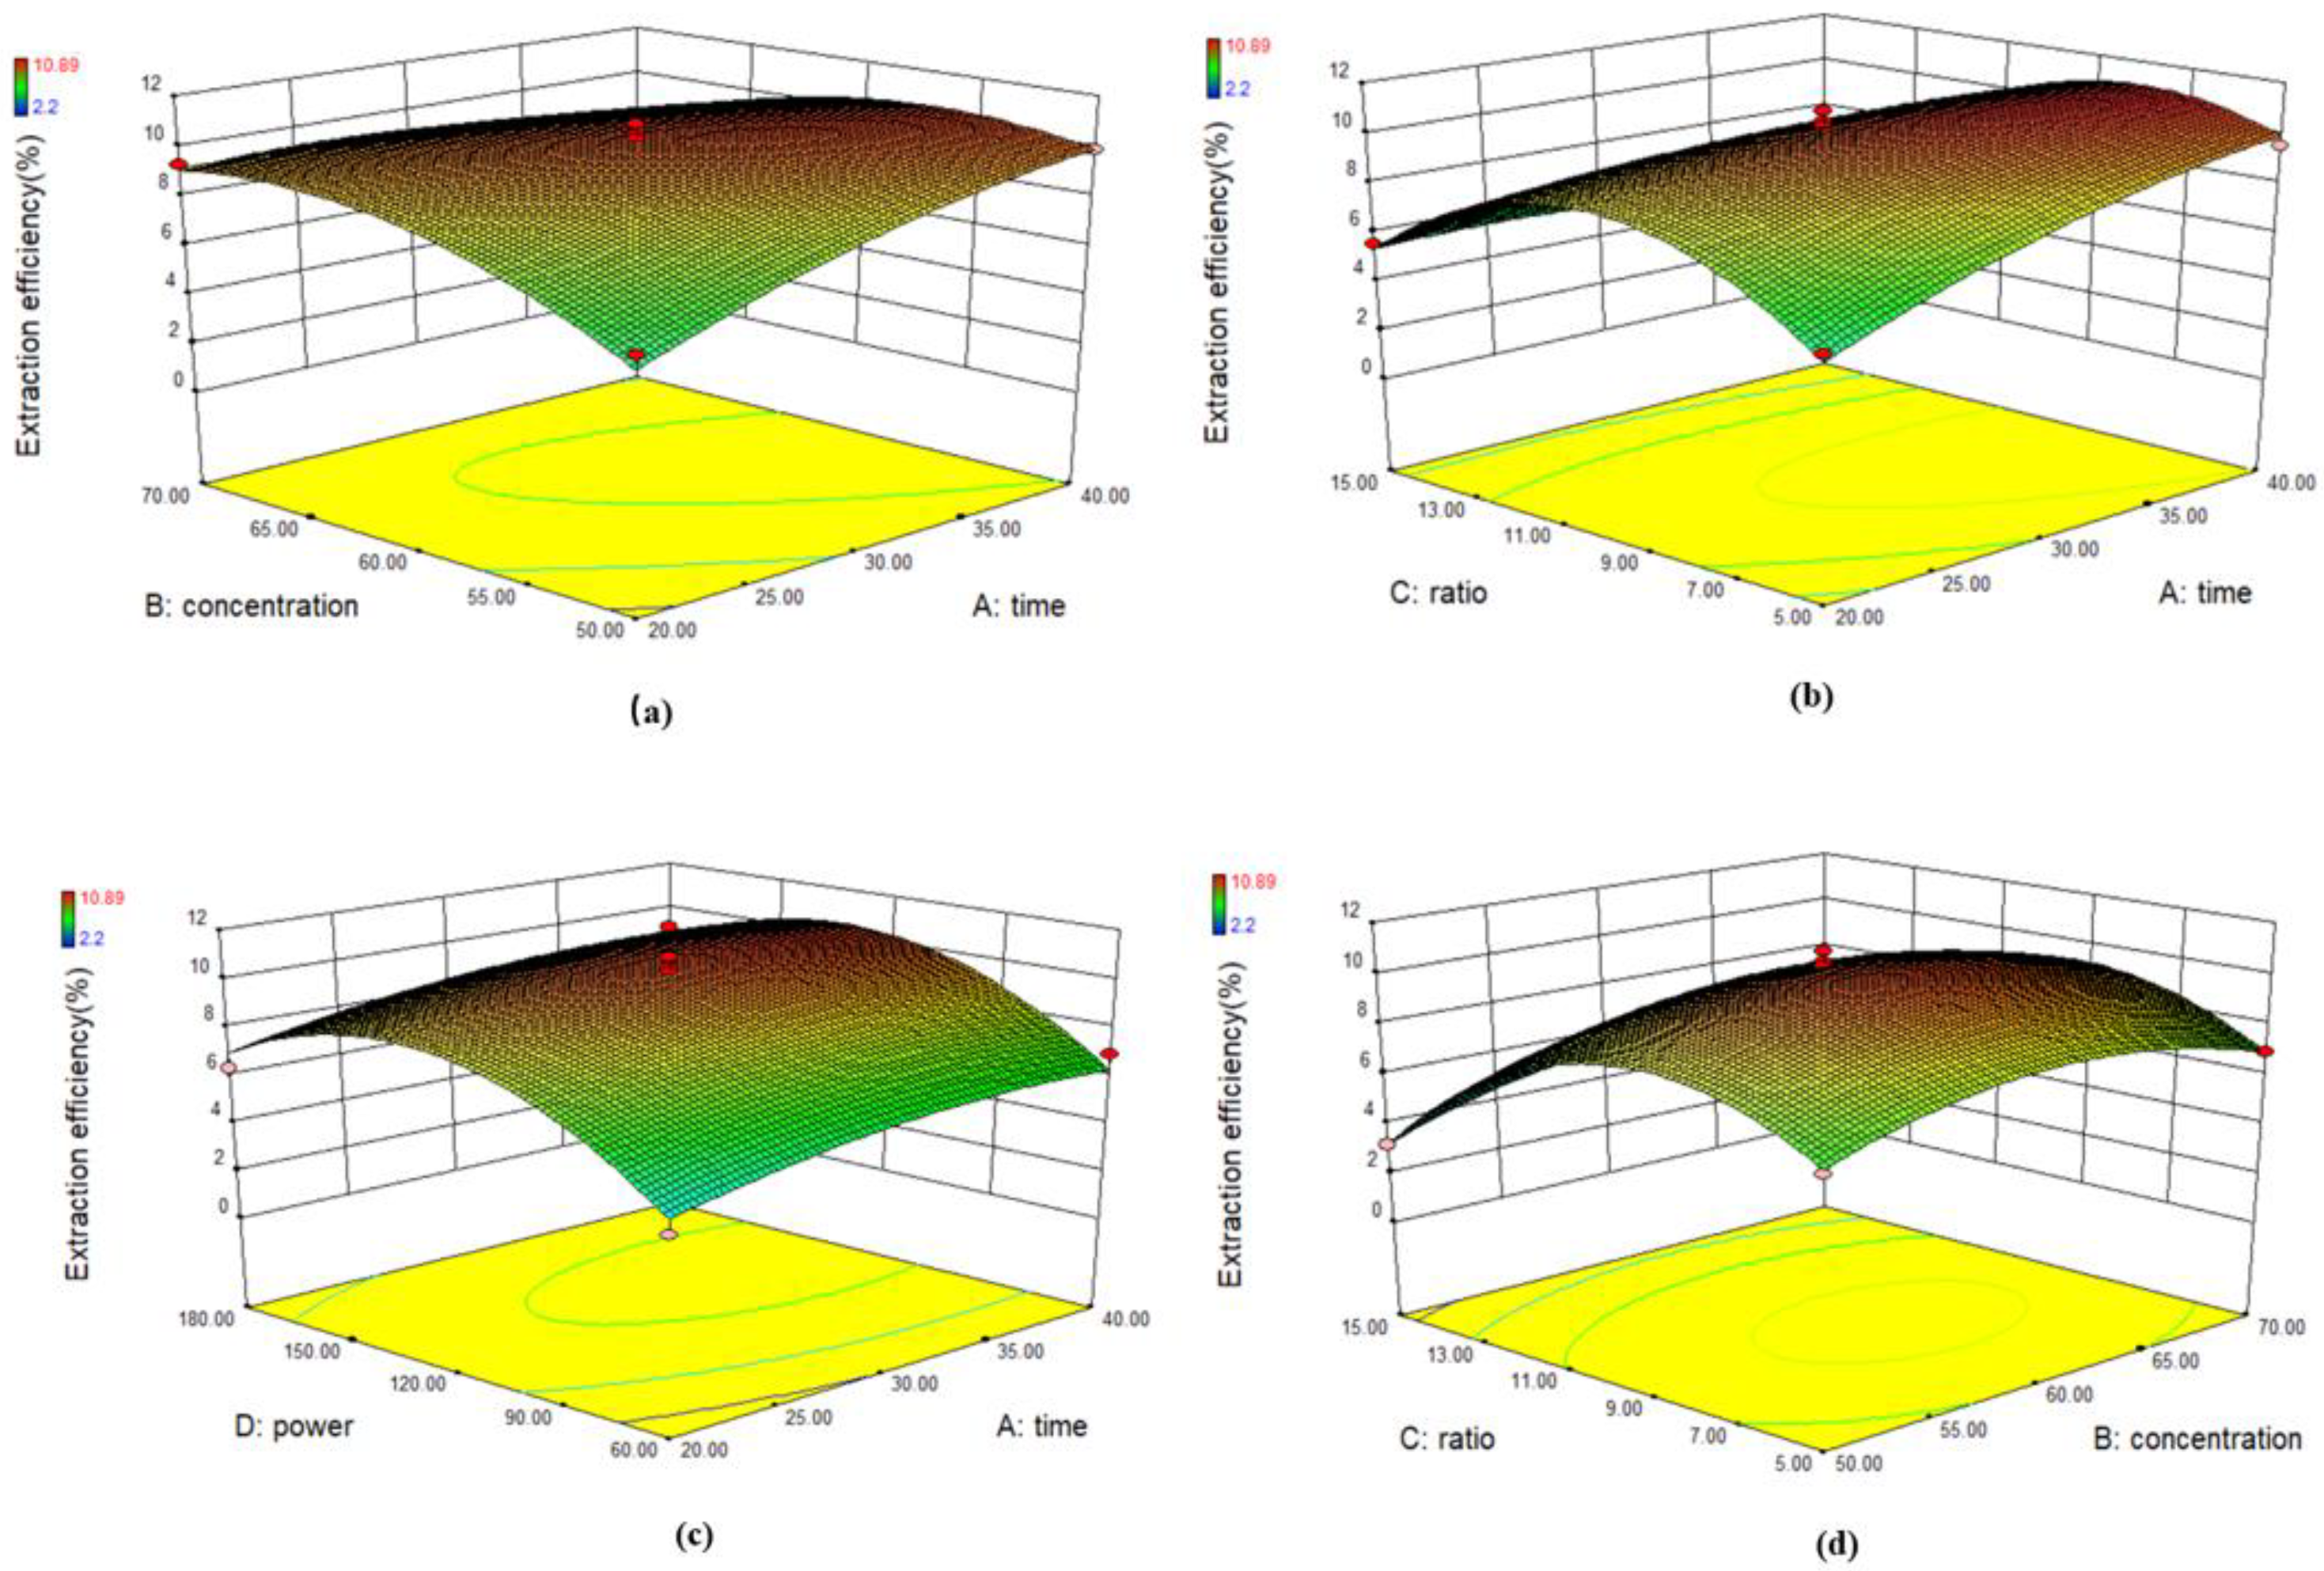
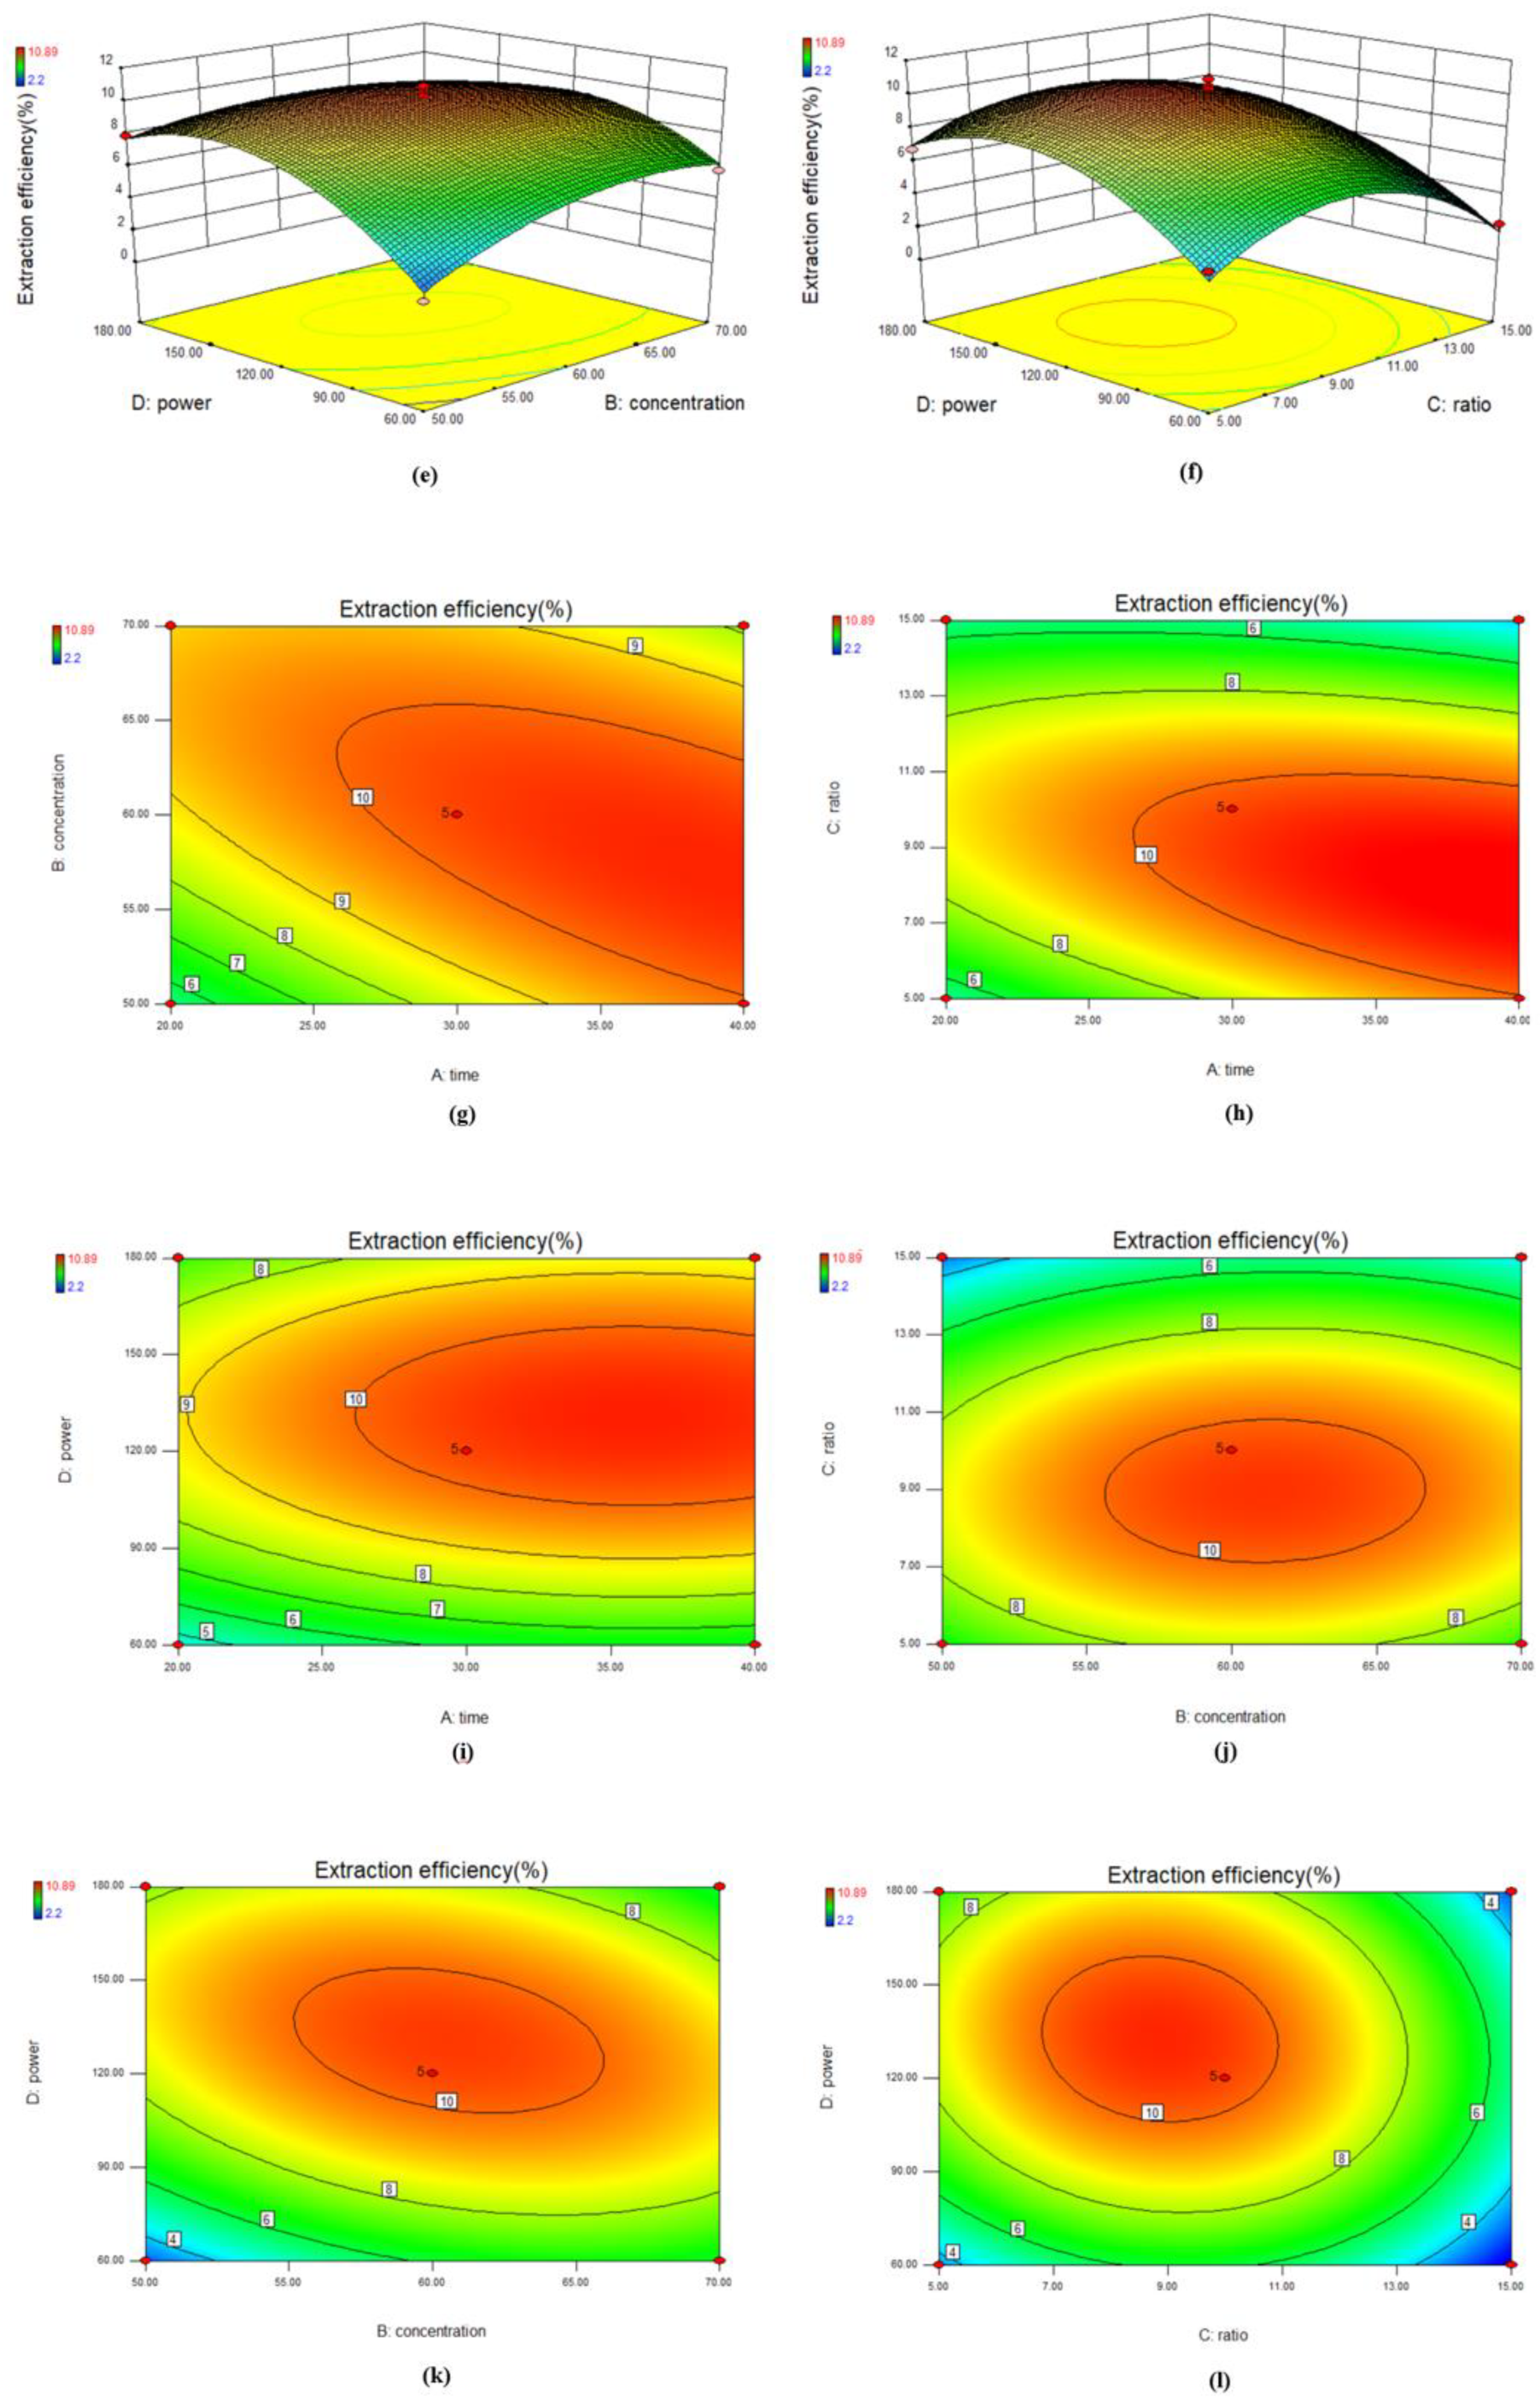
4.2.1. Response Surface Optimization
4.2.2. ANN-BP Modeling
4.2.3. ANN-PSO and ANN-GA
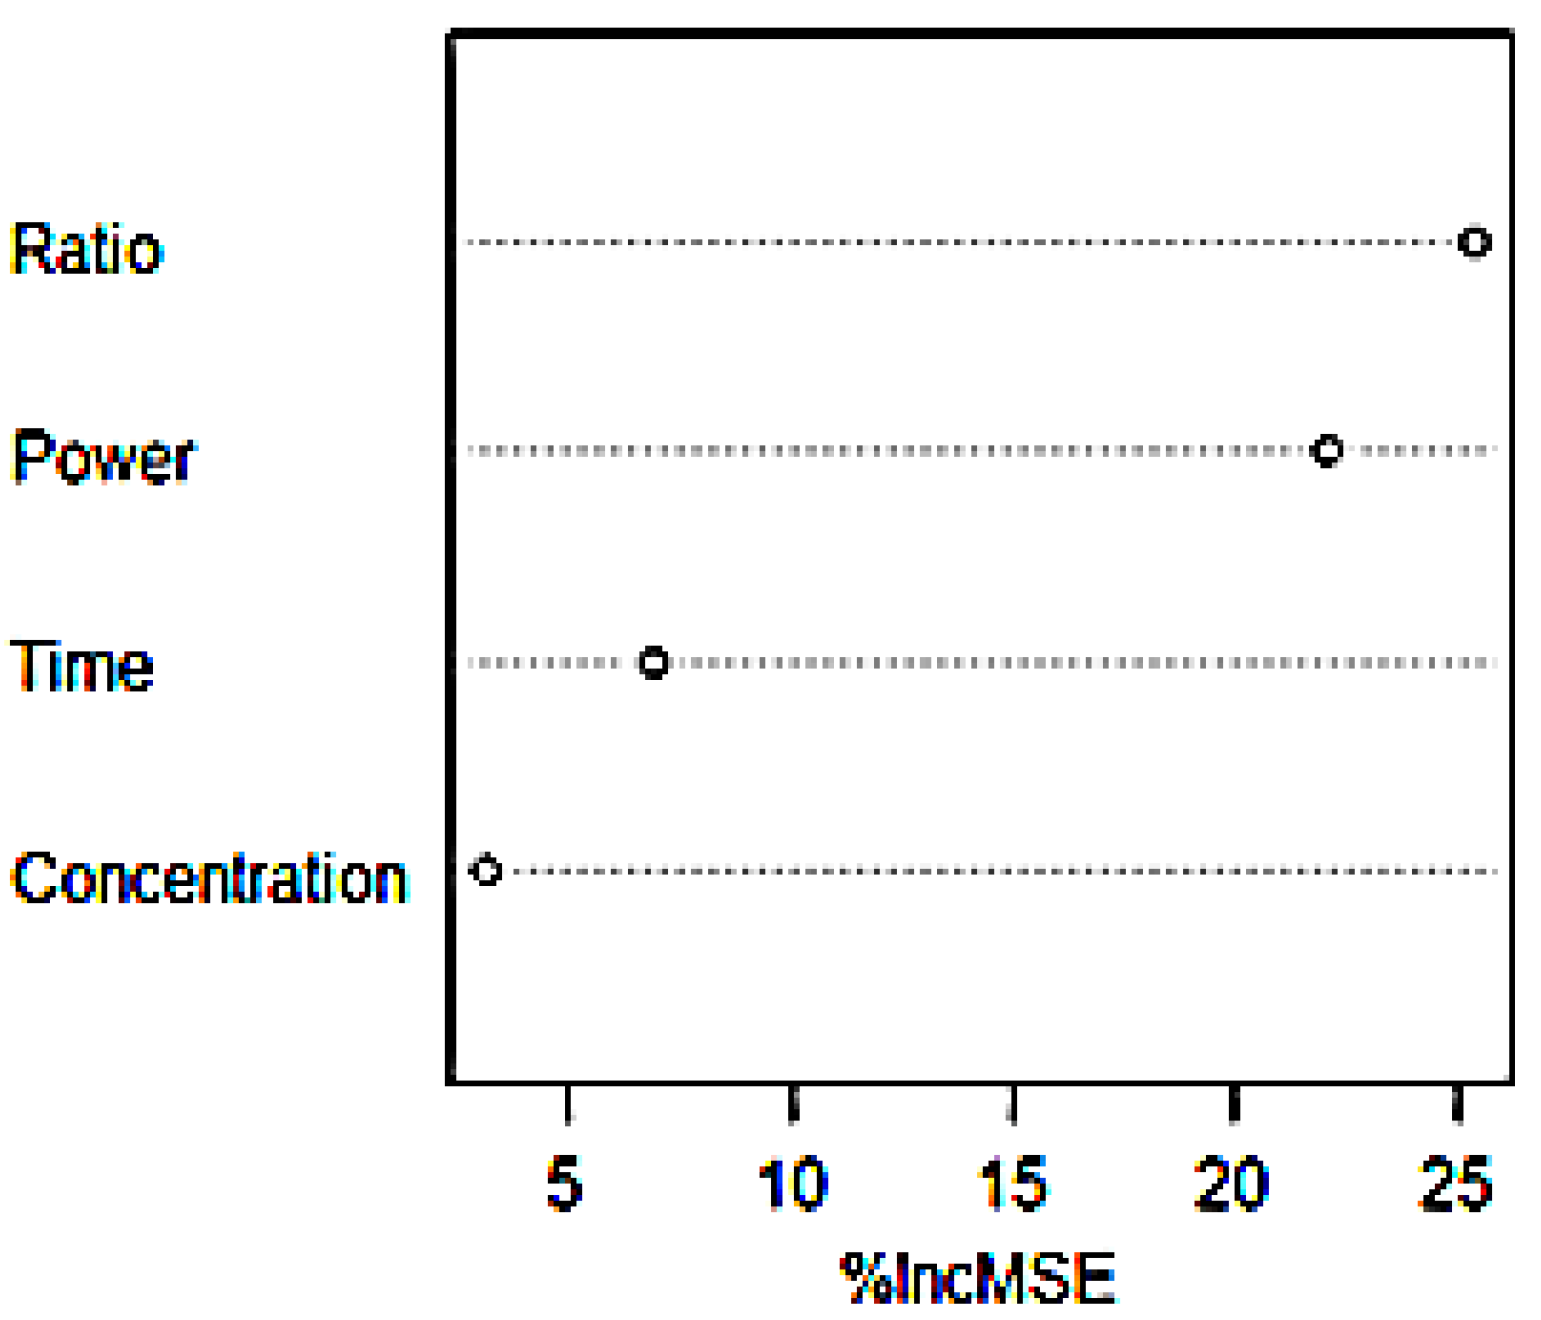
4.3. Importance Ranking
4.4. Free Radical Scavenging Effect
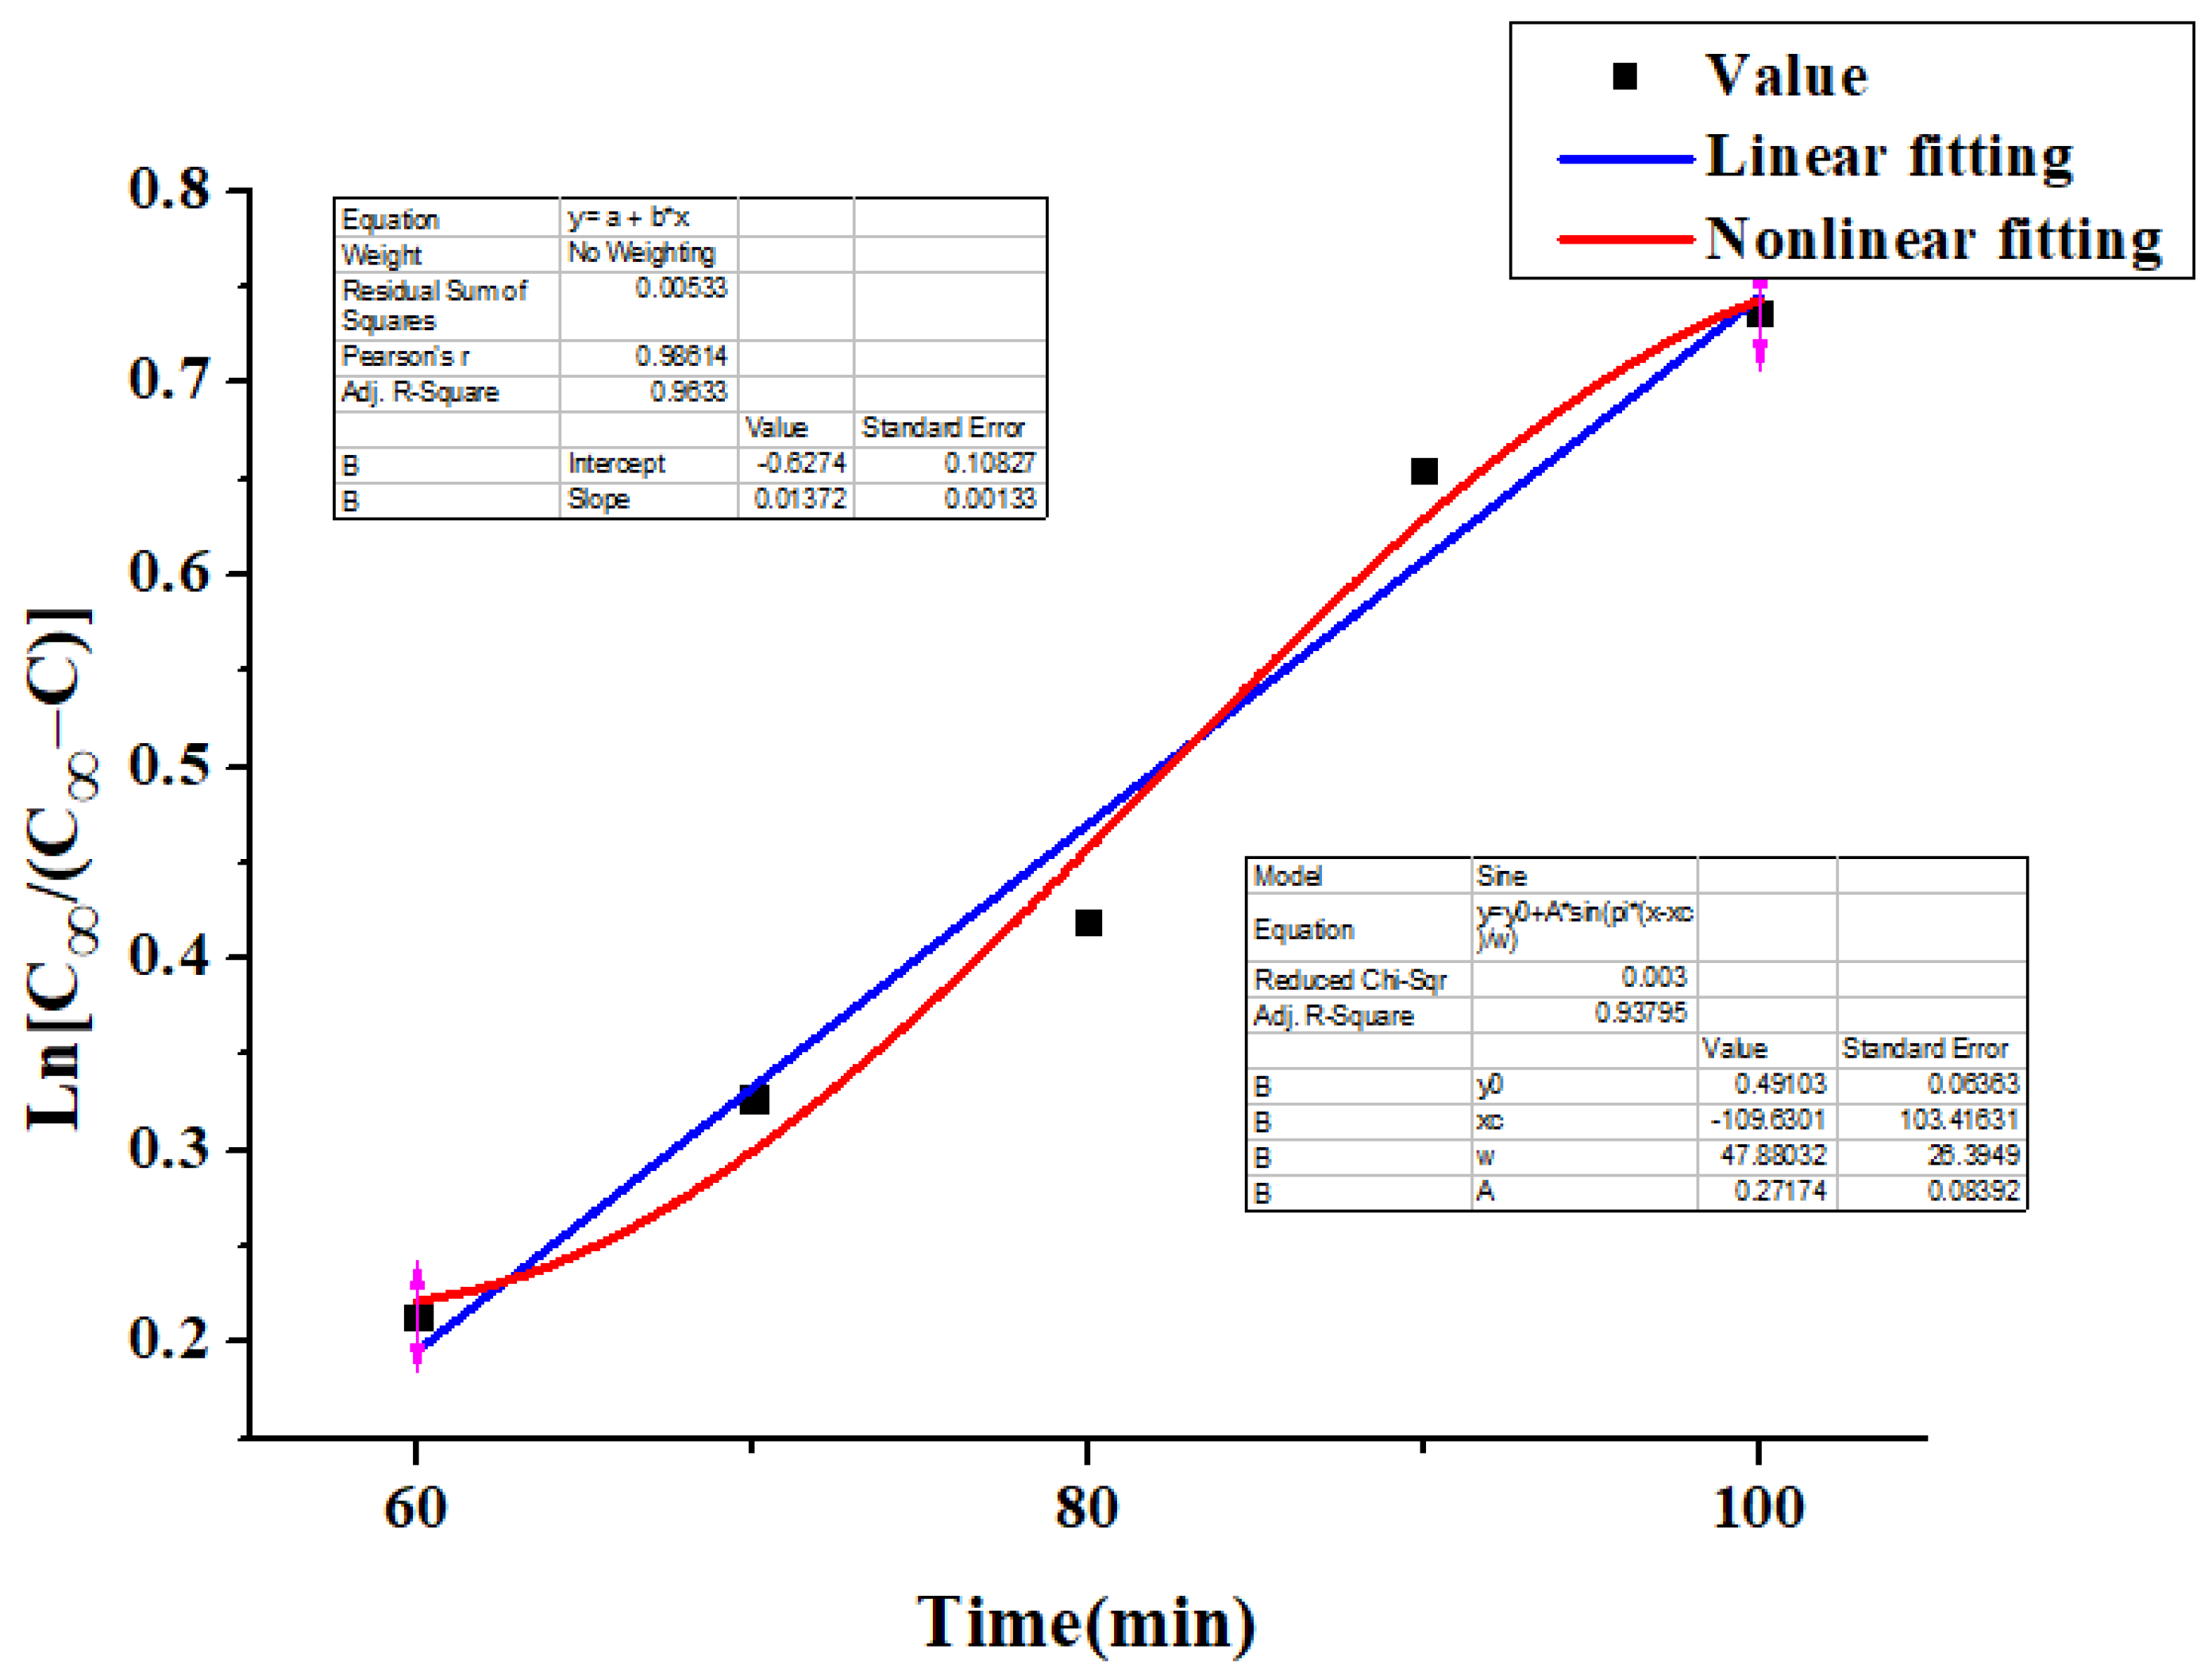
4.5. Kinetics
5. Conclusions
- The optimum extraction conditions were as follows: extraction time 30 min, ethanol concentration 60%, material liquid ratio 1:10 (g/mL), extraction power 120 W.
- ANN-BP, ANN-GA and ANN-PSO were used to optimize the extraction conditions. The results show that the ANN-GA algorithm can predict the experimental results well, and the absolute error is 0.2625.
- GBRT, F-test, Garson formula and random forest were used to analyze the importance of influencing factors. The results show that the material liquid ratio has an important influence on the extraction process.
- The scavenging effects of flavonoids on DPPH, O2−· and ·OH were determined. The results show that flavonoids have strong antioxidant activities, and Rosa sterilis is a good source of natural antioxidants.
- The kinetics of the extraction process were studied, and the linear and nonlinear fitting results show that the extraction process of flavonoids conforms to Fick’s first law.
Supplementary Materials
Author Contributions
Funding
Institutional Review Board Statement
Informed Consent Statement
Data Availability Statement
Conflicts of Interest
Sample Availability
References
- Li, J.L.; Quan, W.X.; Li, C.C. Effects of ecological factors on content of flavonoids in Rosa sterilis from different karst areas of Guizhou, SW China. Pak. J. Bot. 2018, 50, 1125–1133. [Google Scholar]
- Panche, A.N.; Diwan, A.D.; Chandra, S.R. Flavonoids: An overview. J. Nutr. Sci. Vitaminol. 2016, 5, e47. [Google Scholar] [CrossRef] [PubMed] [Green Version]
- Liu, M.H.; Zhang, Q.; Zhang, Y.H. Chemical Analysis of Dietary Constituents in Rosa roxburghii and Rosa sterilis Fruits. Molecules 2016, 21, 1204. [Google Scholar] [CrossRef] [PubMed]
- He, J.Y.; Zhang, Y.H.; Ma, N.; Zhang, X.L.; Liu, M.H.; Fu, W.M. Comparative analysis of multiple ingredients in Rosa roxburghii, and R. sterilis, fruits and their antioxidant activities. J. Funct. Foods 2016, 27, 29–41. [Google Scholar] [CrossRef]
- Wang, L.; Lv, M.J.; An, J.Y. Botanical characteristics, phytochemistry and related biological activities of Rosa roxburghii Tratt fruit and the potential use in functional foods: A review. Food Funct. 2021, 12, 1432–1451. [Google Scholar] [CrossRef] [PubMed]
- Oniszczuk, A.; Widelska, G.; Jtowicz, A.W. Content of phenolic compounds and antioxidant activity of new Gluten-Free pasta with the addition of chestnut flour. Molecules 2019, 24, 2623. [Google Scholar] [CrossRef] [PubMed] [Green Version]
- Schneider, J.R.; Müller, M.; Klein, V.A. Soybean plant metabolism under water deficit and xenobiotic and antioxidant agent application. Biology 2020, 9, 266. [Google Scholar] [CrossRef] [PubMed]
- Guilherme, R.; Aires, A.; Rodrigues, N. Phenolics and antioxidant activity of green and red sweet peppers from organic and conventional agriculture: A comparative study. Agriculture 2020, 10, 652. [Google Scholar] [CrossRef]
- Park, C.H.; Min, S.Y.; Yu, H.W. Effects of apigenin on RBL-2H3, RAW264.7, and HaCaT Cells: Anti-Allergic, Anti-Inflammatory, and Skin-Protective activities. Int. J. Mol. Sci. 2020, 21, 4620. [Google Scholar] [CrossRef] [PubMed]
- Wen, R.; Lv, H.; Jiang, Y. Anti-inflammatory flavone and chalcone derivatives from the roots of Pongamia pinnata (L.) Pierre. Phytochemistry 2018, 149, 56. [Google Scholar] [CrossRef]
- Li, X.; Jiang, X.; Sun, J. Cytoprotective effects of dietary flavonoids against cadmium-induced toxicity. Ann. N. Y. Acad. Sci. 2017, 1398, 5–19. [Google Scholar] [CrossRef] [PubMed]
- Freitas, C.D.; Rocha, M.; Sacramento, C.Q. Agathisflavone, a biflavonoid from Anacardium occidentale L. inhibits influenza virus neuraminidase. Curr. Top. Med. Chem. 2020, 20, 1–10. [Google Scholar] [CrossRef] [PubMed]
- Seleem, D.; Pardi, V.; Murata, R.M. Review of flavonoids: A diverse group of natural compounds with anti-Candida albicans activity in vitro. Arch. Oral Biol. 2017, 76, 76–83. [Google Scholar] [CrossRef] [PubMed]
- Javier, E.; Julia, O.; Leonora, M. Structure-activity and lipophilicity relationships of selected antibacterial natural flavones and flavanones of chilean flora. Molecules 2017, 22, 608. [Google Scholar]
- Kim, S.Y.; Wie, G.A.; Cho, Y.A. The role of red meat and flavonoid consumption on cancer prevention: The Korean cancer screening examination cohort. Nutrients 2017, 9, 938. [Google Scholar] [CrossRef] [PubMed] [Green Version]
- Sun, G.W.; Qiu, Z.D.; Wang, W.N. Flavonoids extraction from propolis attenuates pathological cardiac hypertrophy through PI3K/AKT signaling pathway. Evid. Based Complementary Altern. Med. 2016, 2016, 1–11. [Google Scholar] [CrossRef] [PubMed] [Green Version]
- Oniszczuk, A.; Jtowicz, A.W.; Oniszczuk, T. Opuntia fruits as food enriching ingredient, the first step towards new functional food products. Molecules 2020, 25, 916. [Google Scholar] [CrossRef] [PubMed] [Green Version]
- At, A.; Img, A.; Kpp, B. Inhibition of calcitriol inactivating enzyme CYP24A1 gene expression by flavonoids in hepatocellular carcinoma cells under normoxia and hypoxia. Arch. Biochem. Biophys. 2021, 704, 108889. [Google Scholar]
- Masad, R.J.; Haneefa, S.M.; Mohamed, Y.A. The immunomodulatory effects of honey and associated flavonoids in cancer. Nutrients 2021, 13, 1269. [Google Scholar] [CrossRef] [PubMed]
- Zhu, L.; Chen, J.; Tan, J. Flavonoids from Agrimonia pilosa Ledeb: Free radical scavenging and DNA oxidative damage protection activities and analysis of bioactivity-structure relationship based on molecular and electronic structures. Molecules 2017, 22, 195. [Google Scholar] [CrossRef] [PubMed] [Green Version]
- Kai, N. Optimization of total flavonoids extraction from mulberry leaf using an ethanol-based solvent system. J. Med. Plants Res. 2012, 6, 2373–2380. [Google Scholar]
- Kong, F.; Yu, S.; Bi, Y. Optimization of process parameters and kinetic model of enzymatic extraction of polyphenols from Lonicerae Flos. Pharmacogn. Mag. 2016, 12, 70–74. [Google Scholar] [PubMed] [Green Version]
- Li, X.; Liu, Y.; Di, D. A formaldehyde carbonyl groups-modified self-crosslinked polystyrene resin: Synthesis, adsorption and separation properties. Colloid. Surface A. 2016, 500, 1–9. [Google Scholar] [CrossRef]
- He, B.H.; He, J.; Wang, G.X. Photoinduced controlled/”living” polymerization of methyl methacrylate with flavone as photoinitiator. J. Appl. Polym. Sci. 2016, 133, 43845. [Google Scholar] [CrossRef]
- Sun, T.; Chen, S.; Huang, H. Metabolic profile study of 7, 8-dihydroxyflavone in monkey plasma using high performance liquid chromatography–tandem mass spectrometry. J. Chromatogr. B 2017, 1061, 97–102. [Google Scholar] [CrossRef] [PubMed]
- Bo, N.; Chen, L.; Yi, C. A high performance liquid chromatography method for simultaneous detection of 20 bioactive components in tea extracts. Electrophoresis 2019, 40, 2837–2844. [Google Scholar]
- Ouédraogo, J.C.W.; Dicko, C.; Kini, F.B. Enhanced extraction of flavonoids from Odontonema strictum leaves with antioxidant activity using supercritical carbon dioxide fluid combined with ethanol. J. Supercrit. Fluid 2018, 131, 66–71. [Google Scholar] [CrossRef]
- Oroian, M.; Dranca, F.; Ursachi, F. Comparative evaluation of maceration, microwave and ultrasonic-assisted extraction of phenolic compounds from propolis. Int. J. Food Sci. Technol. 2019, 57, 70–78. [Google Scholar] [CrossRef]
- Li, D.; Qian, Y.; Tian, Y.J. Optimization of ionic liquid-assisted extraction of biflavonoids from Selaginella doederleinii and evaluation of its antioxidant and antitumor activity. Molecules 2017, 22, 586. [Google Scholar] [CrossRef] [PubMed] [Green Version]
- Zhang, H.; Xie, G.; Tian, M. Optimization of the ultrasonic-assisted extraction of bioactive flavonoids from Ampelopsis grossedentata and subsequent separation and purification of two flavonoid aglycones by high-speed counter-current chromatography. Molecules 2016, 21, 1096. [Google Scholar] [CrossRef] [PubMed] [Green Version]
- Hao, K.; Hu, W.; Hou, M. Optimization of ultrasonic-assisted extraction of total phenolics from Citrus aurantium L. blossoms and evaluation of free radical scavenging, Anti-HMG-CoA reductase activities. Molecules 2019, 24, 2368. [Google Scholar] [CrossRef] [PubMed] [Green Version]
- Zheleva-Dimitrova, D.; Zengin, G.; Ibrahime, S.K. Identification of bioactive compounds from Rhaponticoides iconiensis extracts and their bioactivities: An endemic plant to Turkey flora. J. Pharmaceut Biomed. 2020, 190, 113537. [Google Scholar] [CrossRef] [PubMed]
- Reddy, A.V.B.; Moniruzzaman, M.; Madhavi, V.; Jaafar, J. Recent improvements in the extraction, cleanup and quantification of bioactive flavonoids. Stud. Nat. Prod. Chem. 2020, 66, 197–223. [Google Scholar]
- Jia, W.W.; Chen, Z.B.; Zhao, Y.Y.; Li, K.; Tichnell, B.; Tang, Z.H.; Ruso, J.M.; Liu, Z. The study of ultrasound-assisted extraction of flavonoids from Polygonum cuspidatum Sieb. et Zucc. J. Mater. Res. 2019, 19, 3254–3262. [Google Scholar] [CrossRef] [Green Version]
- Ueyama, H.; Kato, Y.; Akazawa, Y. Application of artificial intelligence using a convolutional neural network for diagnosis of early gastric cancer based on magnifying endoscopy with narrow-band imaging. J. Gastroenterol. Hepatol. 2021, 36, 482–489. [Google Scholar] [CrossRef] [PubMed]
- Taddeo, M.; Floridi, L. Regulate artificial intelligence to avert cyber arms race. Nature 2018, 556, 296–298. [Google Scholar] [CrossRef] [PubMed]
- Hassabis, D.; Kumaran, D.; Summerfield, C. Neuroscience-Inspired artificial intelligence. Neuron 2017, 95, 245–258. [Google Scholar] [CrossRef] [PubMed] [Green Version]
- Danna, H.; Zhou, X.L.; Si, J.Z.; Gong, X.M.; Wang, S. Studies on cellulase-ultrasonic assisted extraction technology for flavonoids from Illicium verum residues. Chem Cent. J. 2016, 10, 1–9. [Google Scholar]
- Mohammadi, R.; Mohammadifar, M.A.; Mortazavian, A.M.; Rouhi, M.; Ghasemi, J.B.; Delshadian, Z. Extraction optimization of pepsin-soluble collagen from eggshell membrane by response surface methodology (RSM). Food Chem. 2016, 190, 186–193. [Google Scholar] [CrossRef] [PubMed]
- Hu, J.; Qian, Z. The prediction of adhesive failure between aggregates and asphalt mastic based on aggregate features. Constr. Build. Mater. 2018, 183, 22–31. [Google Scholar] [CrossRef]
- Fan, M.Y.; Hu, J.W.; Cao, R.S.; Xiong, K.N.; Wei, X.H. Modeling and prediction of copper removal from aqueous solutions by nZVI/rGO magnetic nanocomposites using ANN-GA and ANN-PSO. Sci. Rep. 2017, 7, 18040. [Google Scholar] [CrossRef] [PubMed] [Green Version]
- Wang, J.; Shi, P.; Jiang, P. Application of BP neural network algorithm in traditional hydrological model for flood forecasting. Water 2017, 9, 48. [Google Scholar] [CrossRef] [Green Version]
- Gong, Y.J.; Li, J.J.; Zhou, Y. Genetic Learning Particle Swarm Optimization. IEEE Trans. Cybern. 2017, 46, 2277–2290. [Google Scholar] [CrossRef] [PubMed] [Green Version]
- Hammi, K.M.; Hammami, M.; Rihouey, C. Optimization extraction of polysaccharide from Tunisian Zizyphus lotus fruit by response surface methodology: Composition and antioxidant activity. Food Chem. 2016, 212, 476–484. [Google Scholar] [CrossRef] [PubMed]


| Extraction Time (min) | Ethanol Concentration (%) | Material Liquid Ratio (g/mL) | Extraction Power (W) | |
|---|---|---|---|---|
| Single factor1 | 5 | 60 | 1:10 | 120 |
| 10 | 60 | 1:10 | 120 | |
| … | … | … | … | |
| 45 | 60 | 1:10 | 120 | |
| 50 | 60 | 1:10 | 120 | |
| Single factor2 | 30 | 10 | 1:10 | 120 |
| 30 | 20 | 1:10 | 120 | |
| … | … | … | … | |
| 30 | 80 | 1:10 | 120 | |
| 30 | 90 | 1:10 | 120 | |
| Single factor3 | 30 | 60 | 1:2 | 120 |
| 30 | 60 | 1:4 | 120 | |
| … | … | … | … | |
| 30 | 60 | 1:18 | 120 | |
| 30 | 60 | 1:20 | 120 | |
| Single factor4 | 30 | 60 | 1:10 | 10 |
| 30 | 60 | 1:10 | 20 | |
| … | … | … | … | |
| 30 | 60 | 1:10 | 190 | |
| 30 | 60 | 1:10 | 200 |
| Run | Extraction Time (min) | Ethanol Concentration (%) | Material Liquid Ratio (g/mL) | Extraction Power (W) | Extraction Efficiency (%) | Predicted Value (%) | BP Predicted Value (%) | RF Predicted Value (%) |
|---|---|---|---|---|---|---|---|---|
| 1 | 20 | 70 | 10 | 120 | 9.31 | 5.44 | 9.31 | 6.40 |
| 2 | 40 | 60 | 15 | 120 | 3.39 | 9.9 | 3.39 | 6.40 |
| 3 | 30 | 60 | 15 | 180 | 2.6 | 9.08 | 2.6 | 5.32 |
| 4 | 30 | 50 | 15 | 120 | 3.19 | 7.84 | 3.19 | 5.36 |
| 5 | 40 | 60 | 5 | 120 | 9.51 | 3.49 | 9.51 | 7.46 |
| 6 | 30 | 70 | 10 | 180 | 6.35 | 1.75 | 6.35 | 7.32 |
| 7 | 20 | 60 | 10 | 60 | 3.98 | 6.99 | 3.98 | 5.47 |
| 8 | 30 | 50 | 10 | 180 | 7.93 | 2.87 | 7.93 | 6.25 |
| 9 | 20 | 60 | 5 | 120 | 5.56 | 4.58 | 5.56 | 7.13 |
| 10 | 30 | 60 | 10 | 120 | 9.71 | 6.29 | 10.35 | 8.67 |
| 11 | 30 | 50 | 5 | 120 | 6.35 | 6.98 | 6.35 | 6.72 |
| 12 | 20 | 60 | 10 | 180 | 6.35 | 8.5 | 6.35 | 6.84 |
| 13 | 30 | 60 | 5 | 60 | 3.98 | 6.52 | 3.98 | 5.58 |
| 14 | 40 | 50 | 10 | 120 | 9.89 | 6.92 | 9.89 | 6.86 |
| 15 | 20 | 50 | 10 | 120 | 5.96 | 3.2 | 5.96 | 6.66 |
| 16 | 30 | 60 | 15 | 60 | 2.2 | 4.38 | 2.2 | 4.48 |
| 17 | 30 | 60 | 5 | 180 | 6.75 | 5.25 | 6.75 | 7.09 |
| 18 | 30 | 70 | 10 | 60 | 5.76 | 9.92 | 5.76 | 5.48 |
| 19 | 30 | 60 | 10 | 120 | 10.3 | 5.38 | 10.35 | 8.73 |
| 20 | 40 | 70 | 10 | 120 | 7.54 | 3.93 | 7.54 | 7.90 |
| 21 | 30 | 60 | 10 | 120 | 10.5 | 2.94 | 10.35 | 8.71 |
| 22 | 30 | 50 | 10 | 60 | 2.4 | 6.2 | 2.4 | 5.88 |
| 23 | 30 | 60 | 10 | 120 | 10.89 | 7.72 | 10.35 | 8.60 |
| 24 | 30 | 70 | 15 | 120 | 4.57 | 6.04 | 4.57 | 5.27 |
| 25 | 20 | 60 | 15 | 120 | 5.56 | 10.3 | 4.33 | 4.70 |
| 26 | 40 | 60 | 10 | 60 | 6.94 | 10.3 | 4.65 | 6.06 |
| 27 | 40 | 60 | 10 | 180 | 9.12 | 10.3 | 11.73 | 7.61 |
| 28 | 30 | 70 | 5 | 120 | 6.94 | 10.3 | 10.19 | 7.26 |
| 29 | 30 | 60 | 10 | 120 | 10.1 | 10.3 | 10.35 | 8.90 |
| Source | Sum of Squares | Degree of Freedom | Mean Square | F-Value | p-Value | |
|---|---|---|---|---|---|---|
| Model | 196.58 | 14 | 14.04 | 42.61 | <0.0001 | significant |
| A-time | 7.79 | 1 | 7.79 | 23.64 | 0.0003 | |
| B-concentration | 1.88 | 1 | 1.88 | 5.71 | 0.0316 | |
| C-ratio | 25.75 | 1 | 25.75 | 78.15 | <0.0001 | |
| D-power | 15.96 | 1 | 15.96 | 48.43 | <0.0001 | |
| AB | 8.12 | 1 | 8.12 | 24.65 | 0.0002 | |
| AC | 9.36 | 1 | 9.36 | 28.41 | 0.0001 | |
| AD | 9.03E-03 | 1 | 9.03E-03 | 0.027 | 0.8709 | |
| BC | 1.60E-01 | 1 | 0.16 | 0.47 | 0.5027 | |
| BD | 6.1 | 1 | 6.1 | 18.51 | 0.0007 | |
| CD | 1.4 | 1 | 1.4 | 4.26 | 0.058 | |
| A2 | 3.03 | 1 | 3.03 | 9.19 | 0.009 | |
| B2 | 15.55 | 1 | 15.55 | 47.18 | <0.0001 | |
| C2 | 79.33 | 1 | 79.33 | 240.71 | <0.0001 | |
| D2 | 59.44 | 1 | 59.44 | 180.35 | <0.0001 | |
| Residual | 4.61 | 14 | 0.33 | |||
| Lack of Fit | 3.84 | 10 | 0.38 | 1.98 | 0.267 | not significant |
| Pure Error | 0.78 | 4 | 0.19 | |||
| Cor Total | 201.2 | 28 |
| Number of Neurons | wi | ||||||
|---|---|---|---|---|---|---|---|
| Input Weights | Input Bias | Layer Weights | Layer Bias | ||||
| Extraction Time | Ethanol Concentration | Material Liquid Ratio | Extraction Power | ||||
| 1 | −1.227 | 1.201 | −0.0184 | 1.803 | 2.49 | 0.802 | 0.46 |
| 2 | 1.174 | 0.941 | −1.143 | −1.621 | −1.936 | 0.149 | |
| 3 | 1.569 | −0.581 | −1.425 | 1.17 | −1.383 | 0.69 | |
| 4 | 0.097 | 0.229 | 2.359 | 0.757 | −0.83 | 0.477 | |
| 5 | 1.279 | −1.365 | 0.202 | 1.631 | −0.277 | 0.172 | |
| 6 | 0.374 | −1.649 | 1.824 | 0.118 | 0.277 | −0.507 | |
| 7 | −1.595 | −1.68 | 0.908 | −0.095 | −0.83 | 0.333 | |
| 8 | −1.594 | 0.949 | 0.44 | 1.601 | −1.383 | −0.833 | |
| 9 | −0.543 | −0.028 | 1.839 | −1.587 | −1.936 | 0.252 | |
| 10 | 1.127 | −1.406 | 1.718 | −0.009 | 2.49 | 0.322 | |
| Models | Independent Parameters | Experiment (%) | Prediction (%) | Absolute Error (%) | |||
|---|---|---|---|---|---|---|---|
| A | B | C | D | ||||
| BBD | 40 | 50.9 | 8.82 | 148.87 | 10.5571 | 11.0688 | 0.5117 |
| ANN-GA | 38.36 | 54.69 | 7.89 | 175.78 | 14.0137 | 13.7512 | 0.2625 |
| ANN-PSO | 20.21 | 50 | 5 | 101.89 | 13.2434 | 12.7832 | 0.4602 |
| Methods | Extraction Time (min) | Ethanol Concentration (%) | Material Liquid Ratio (g/mL) | Extraction Power (W) |
|---|---|---|---|---|
| F-test | 3 | 4 | 1 | 2 |
| RF | 3 | 4 | 1 | 2 |
| GBRT | 3 | 4 | 1 | 2 |
| Garson-formula | 4 | 3 | 1 | 2 |
Publisher’s Note: MDPI stays neutral with regard to jurisdictional claims in published maps and institutional affiliations. |
© 2021 by the authors. Licensee MDPI, Basel, Switzerland. This article is an open access article distributed under the terms and conditions of the Creative Commons Attribution (CC BY) license (https://creativecommons.org/licenses/by/4.0/).
Share and Cite
Liu, J.; Li, C.; Ding, G.; Quan, W. Artificial Intelligence Assisted Ultrasonic Extraction of Total Flavonoids from Rosa sterilis. Molecules 2021, 26, 3835. https://doi.org/10.3390/molecules26133835
Liu J, Li C, Ding G, Quan W. Artificial Intelligence Assisted Ultrasonic Extraction of Total Flavonoids from Rosa sterilis. Molecules. 2021; 26(13):3835. https://doi.org/10.3390/molecules26133835
Chicago/Turabian StyleLiu, Jing, Chaochan Li, Guijie Ding, and Wenxuan Quan. 2021. "Artificial Intelligence Assisted Ultrasonic Extraction of Total Flavonoids from Rosa sterilis" Molecules 26, no. 13: 3835. https://doi.org/10.3390/molecules26133835