
Electroreduction of Bi(III) Ions at a Cyclically Renewable Liquid Silver Amalgam Film Electrode in the Presence of Methionine †


Abstract
:1. Introduction
2. Results and Discussion
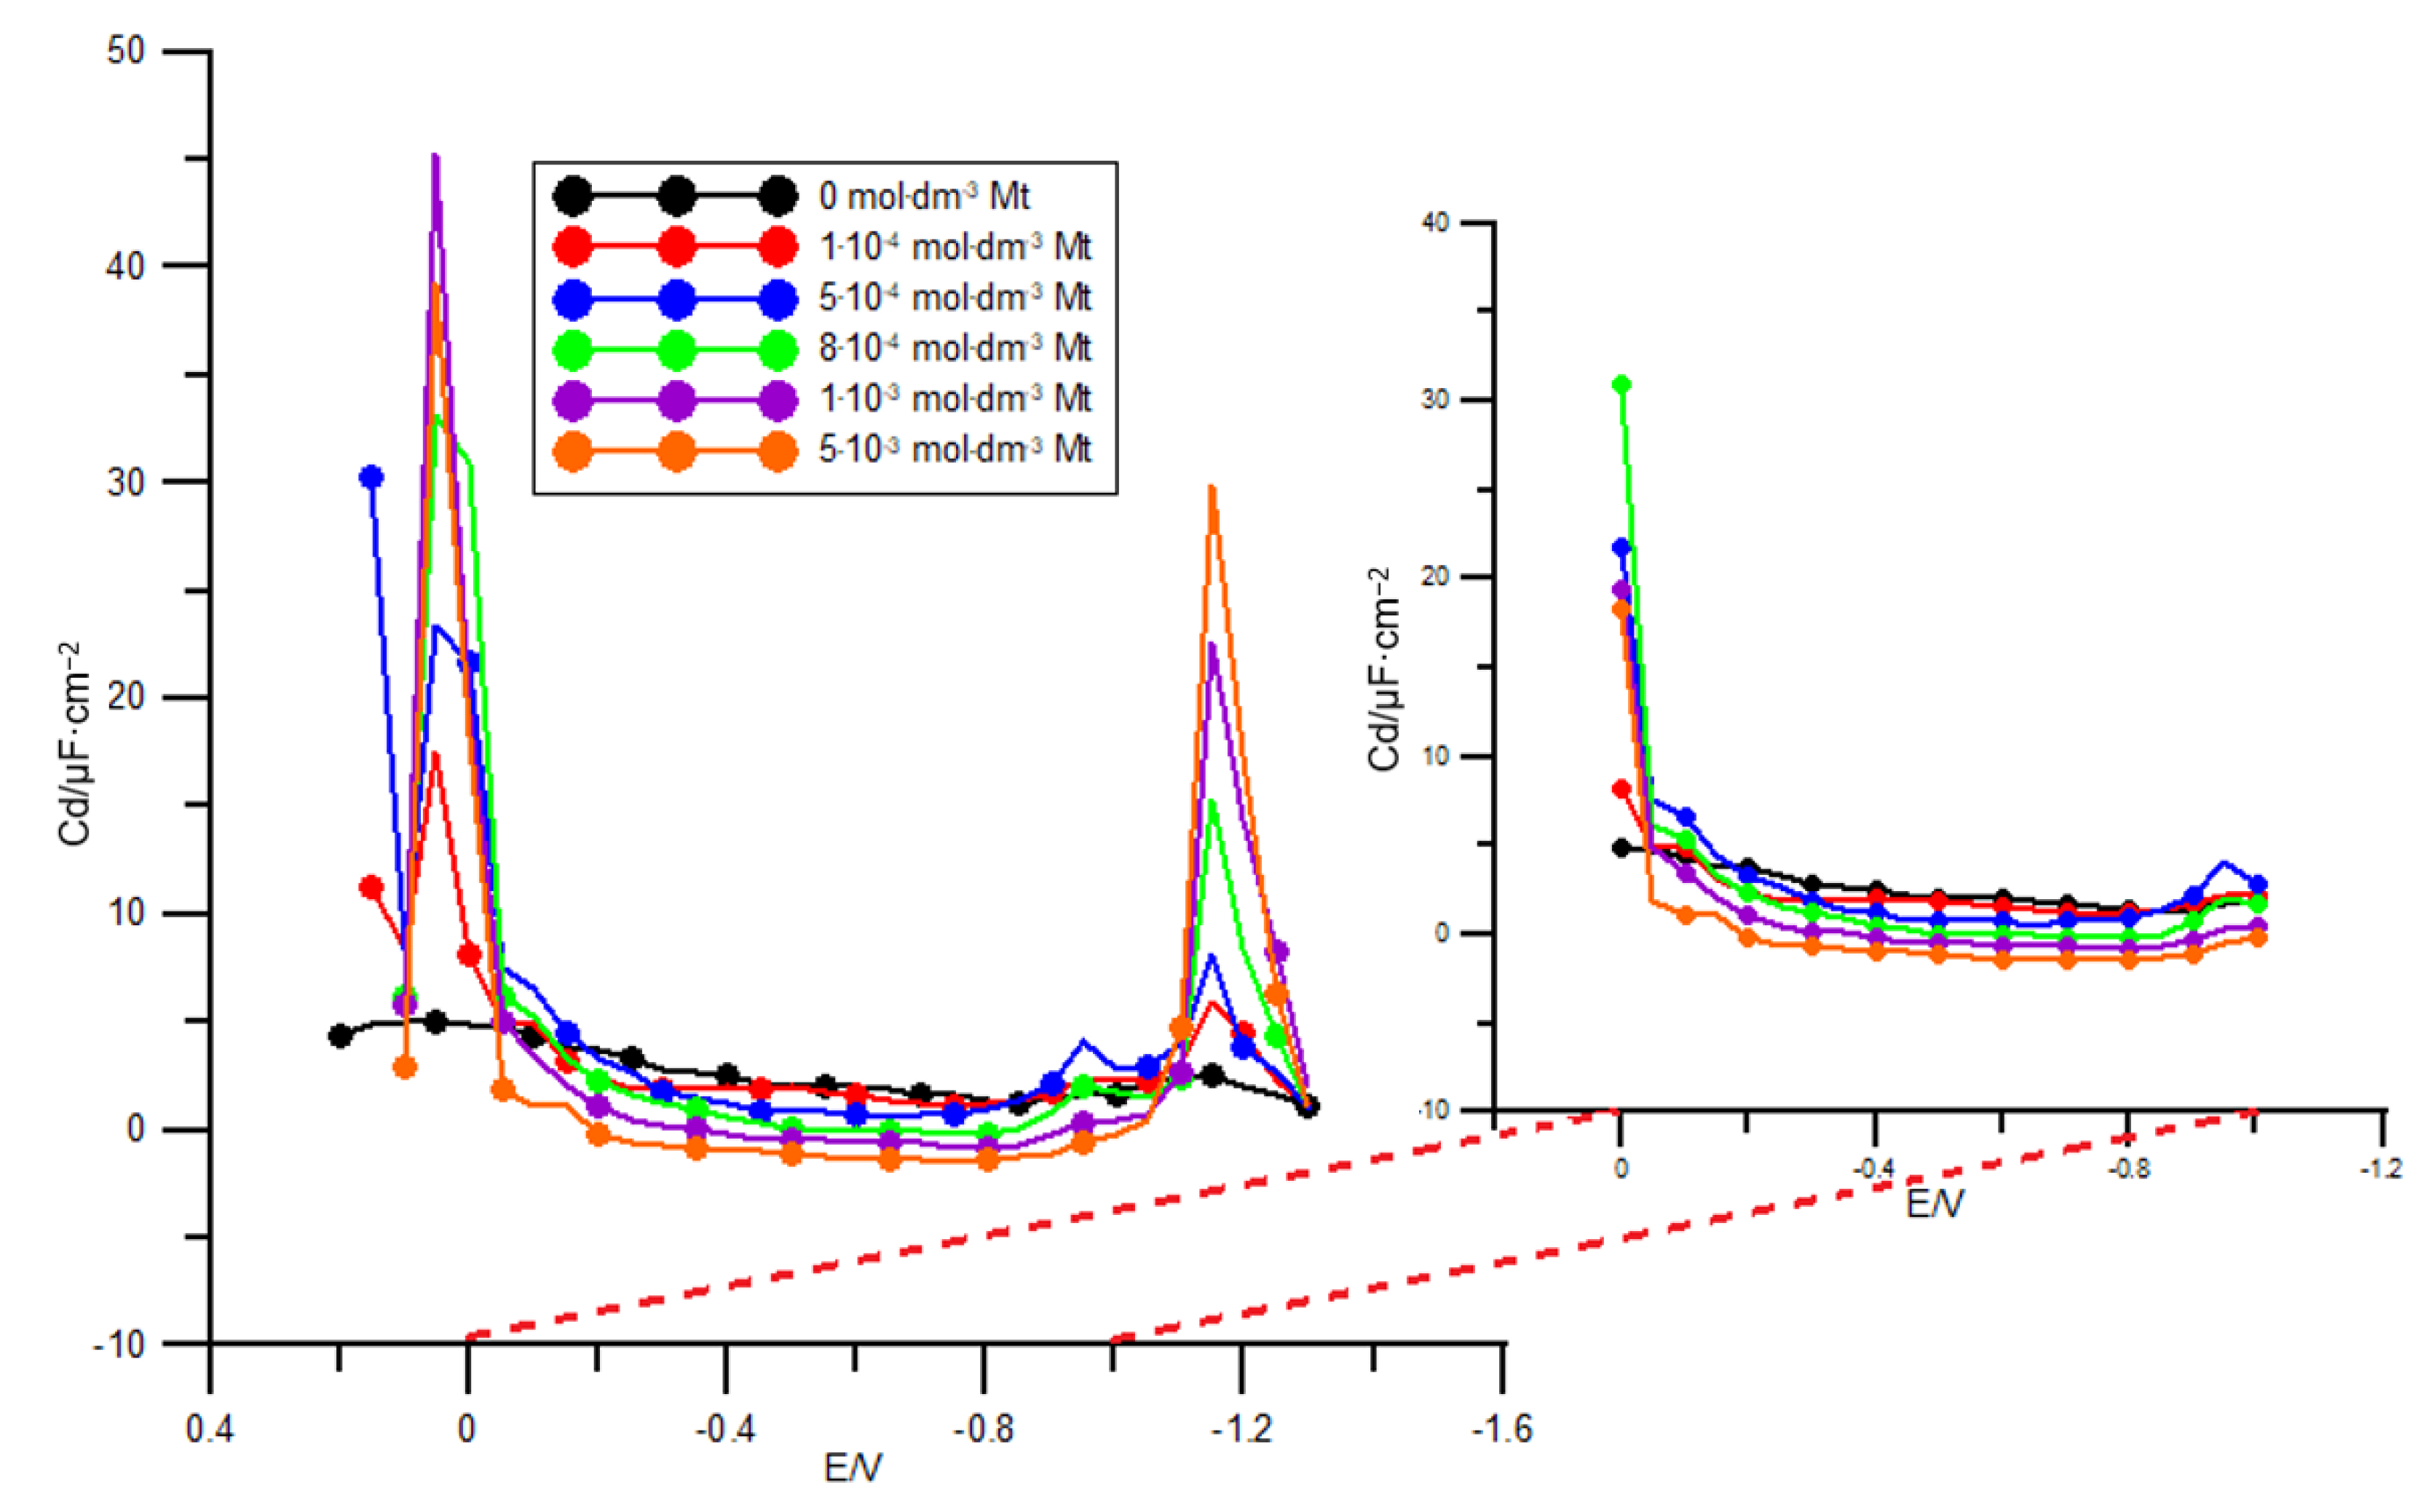
2.1. Adsorption Measurements
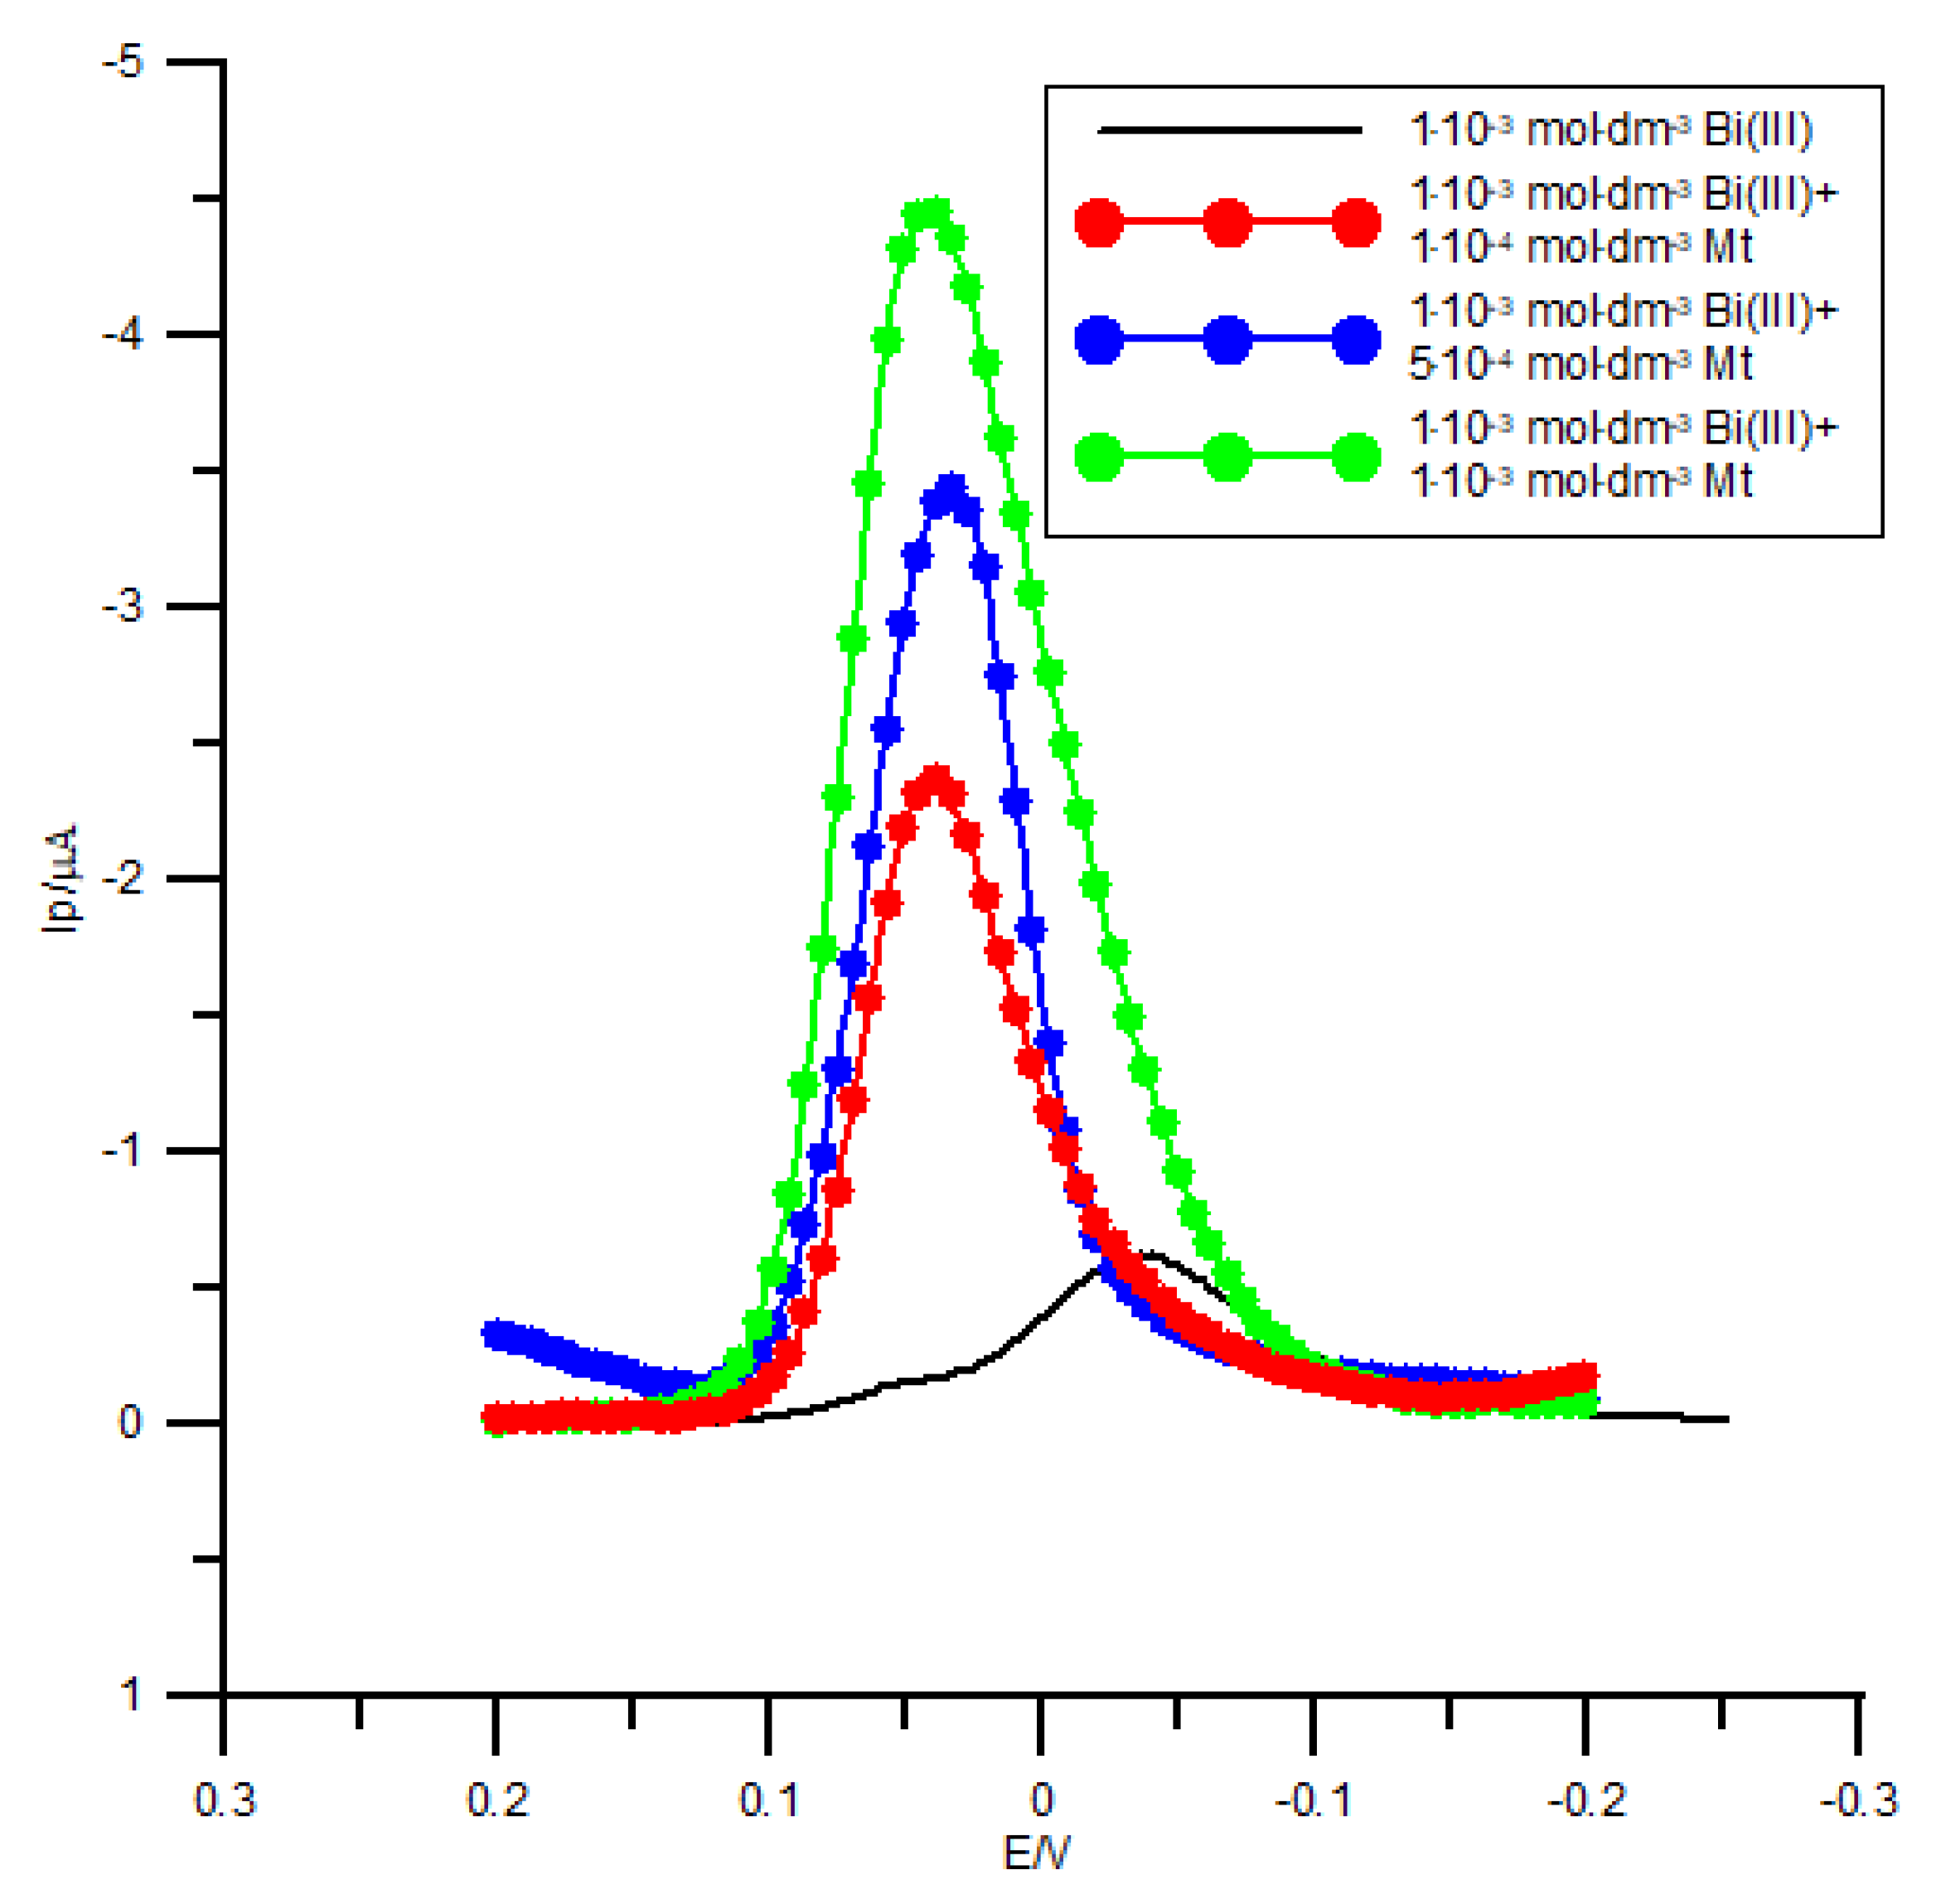
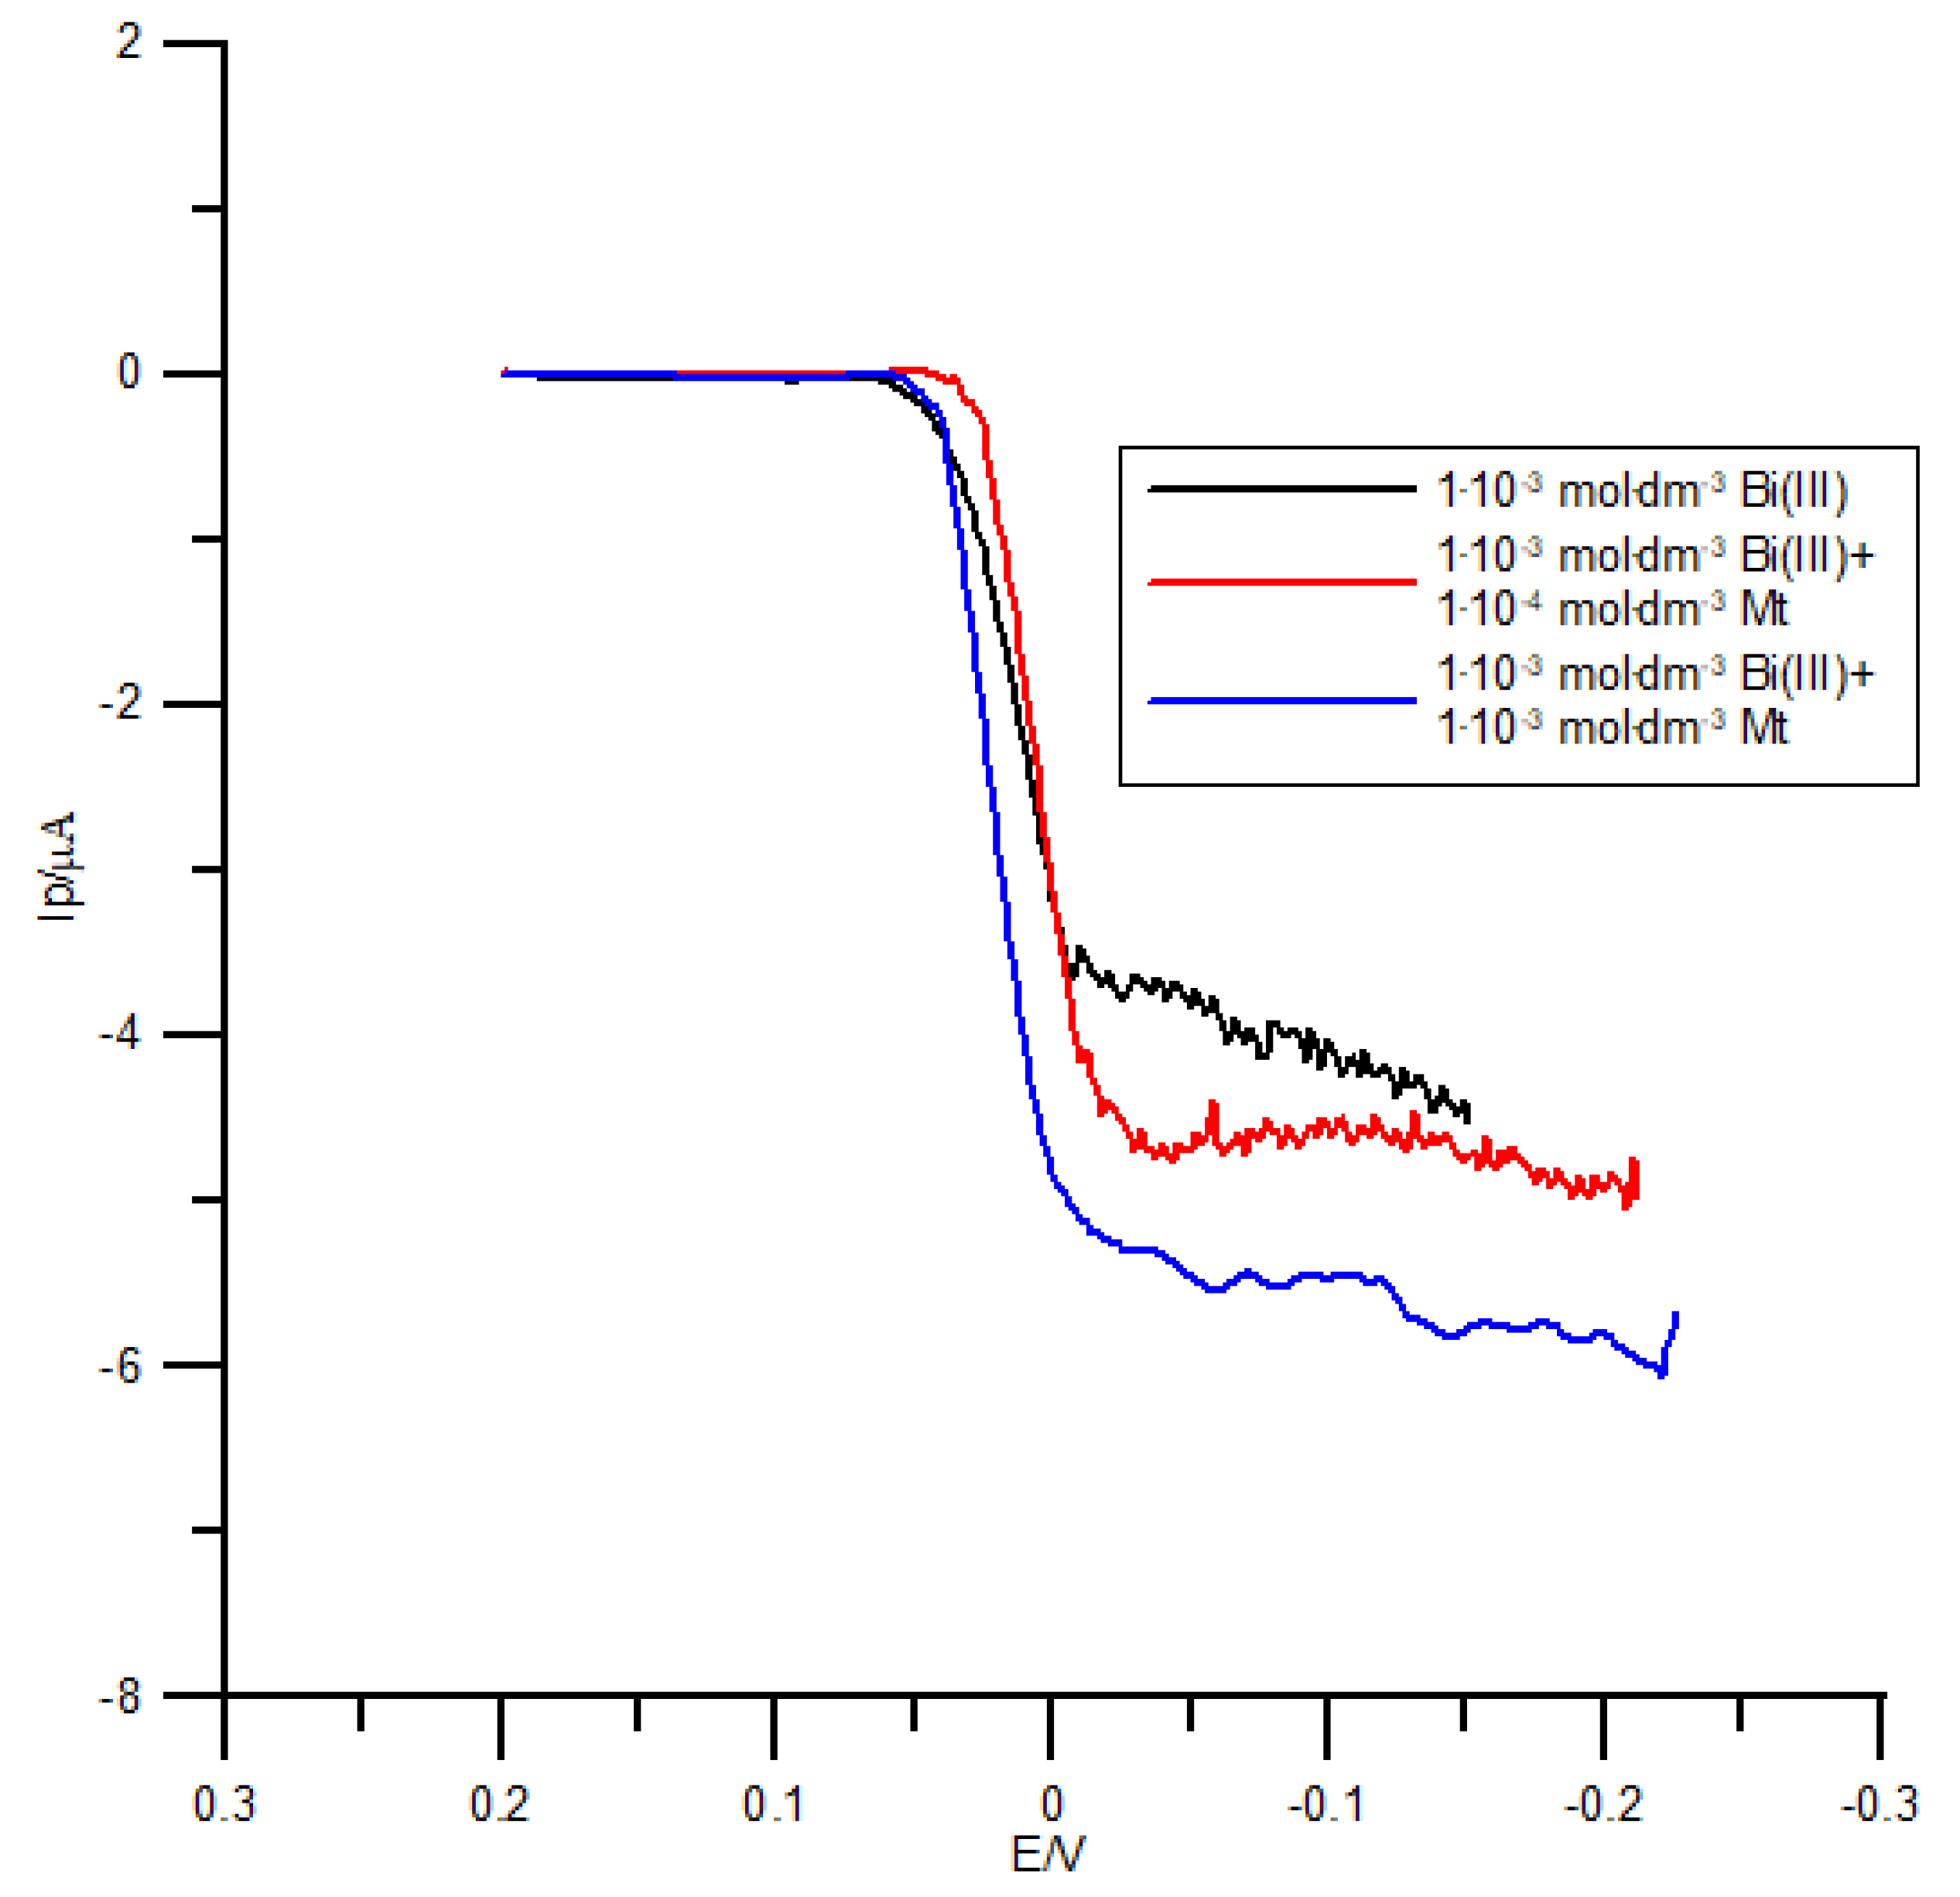
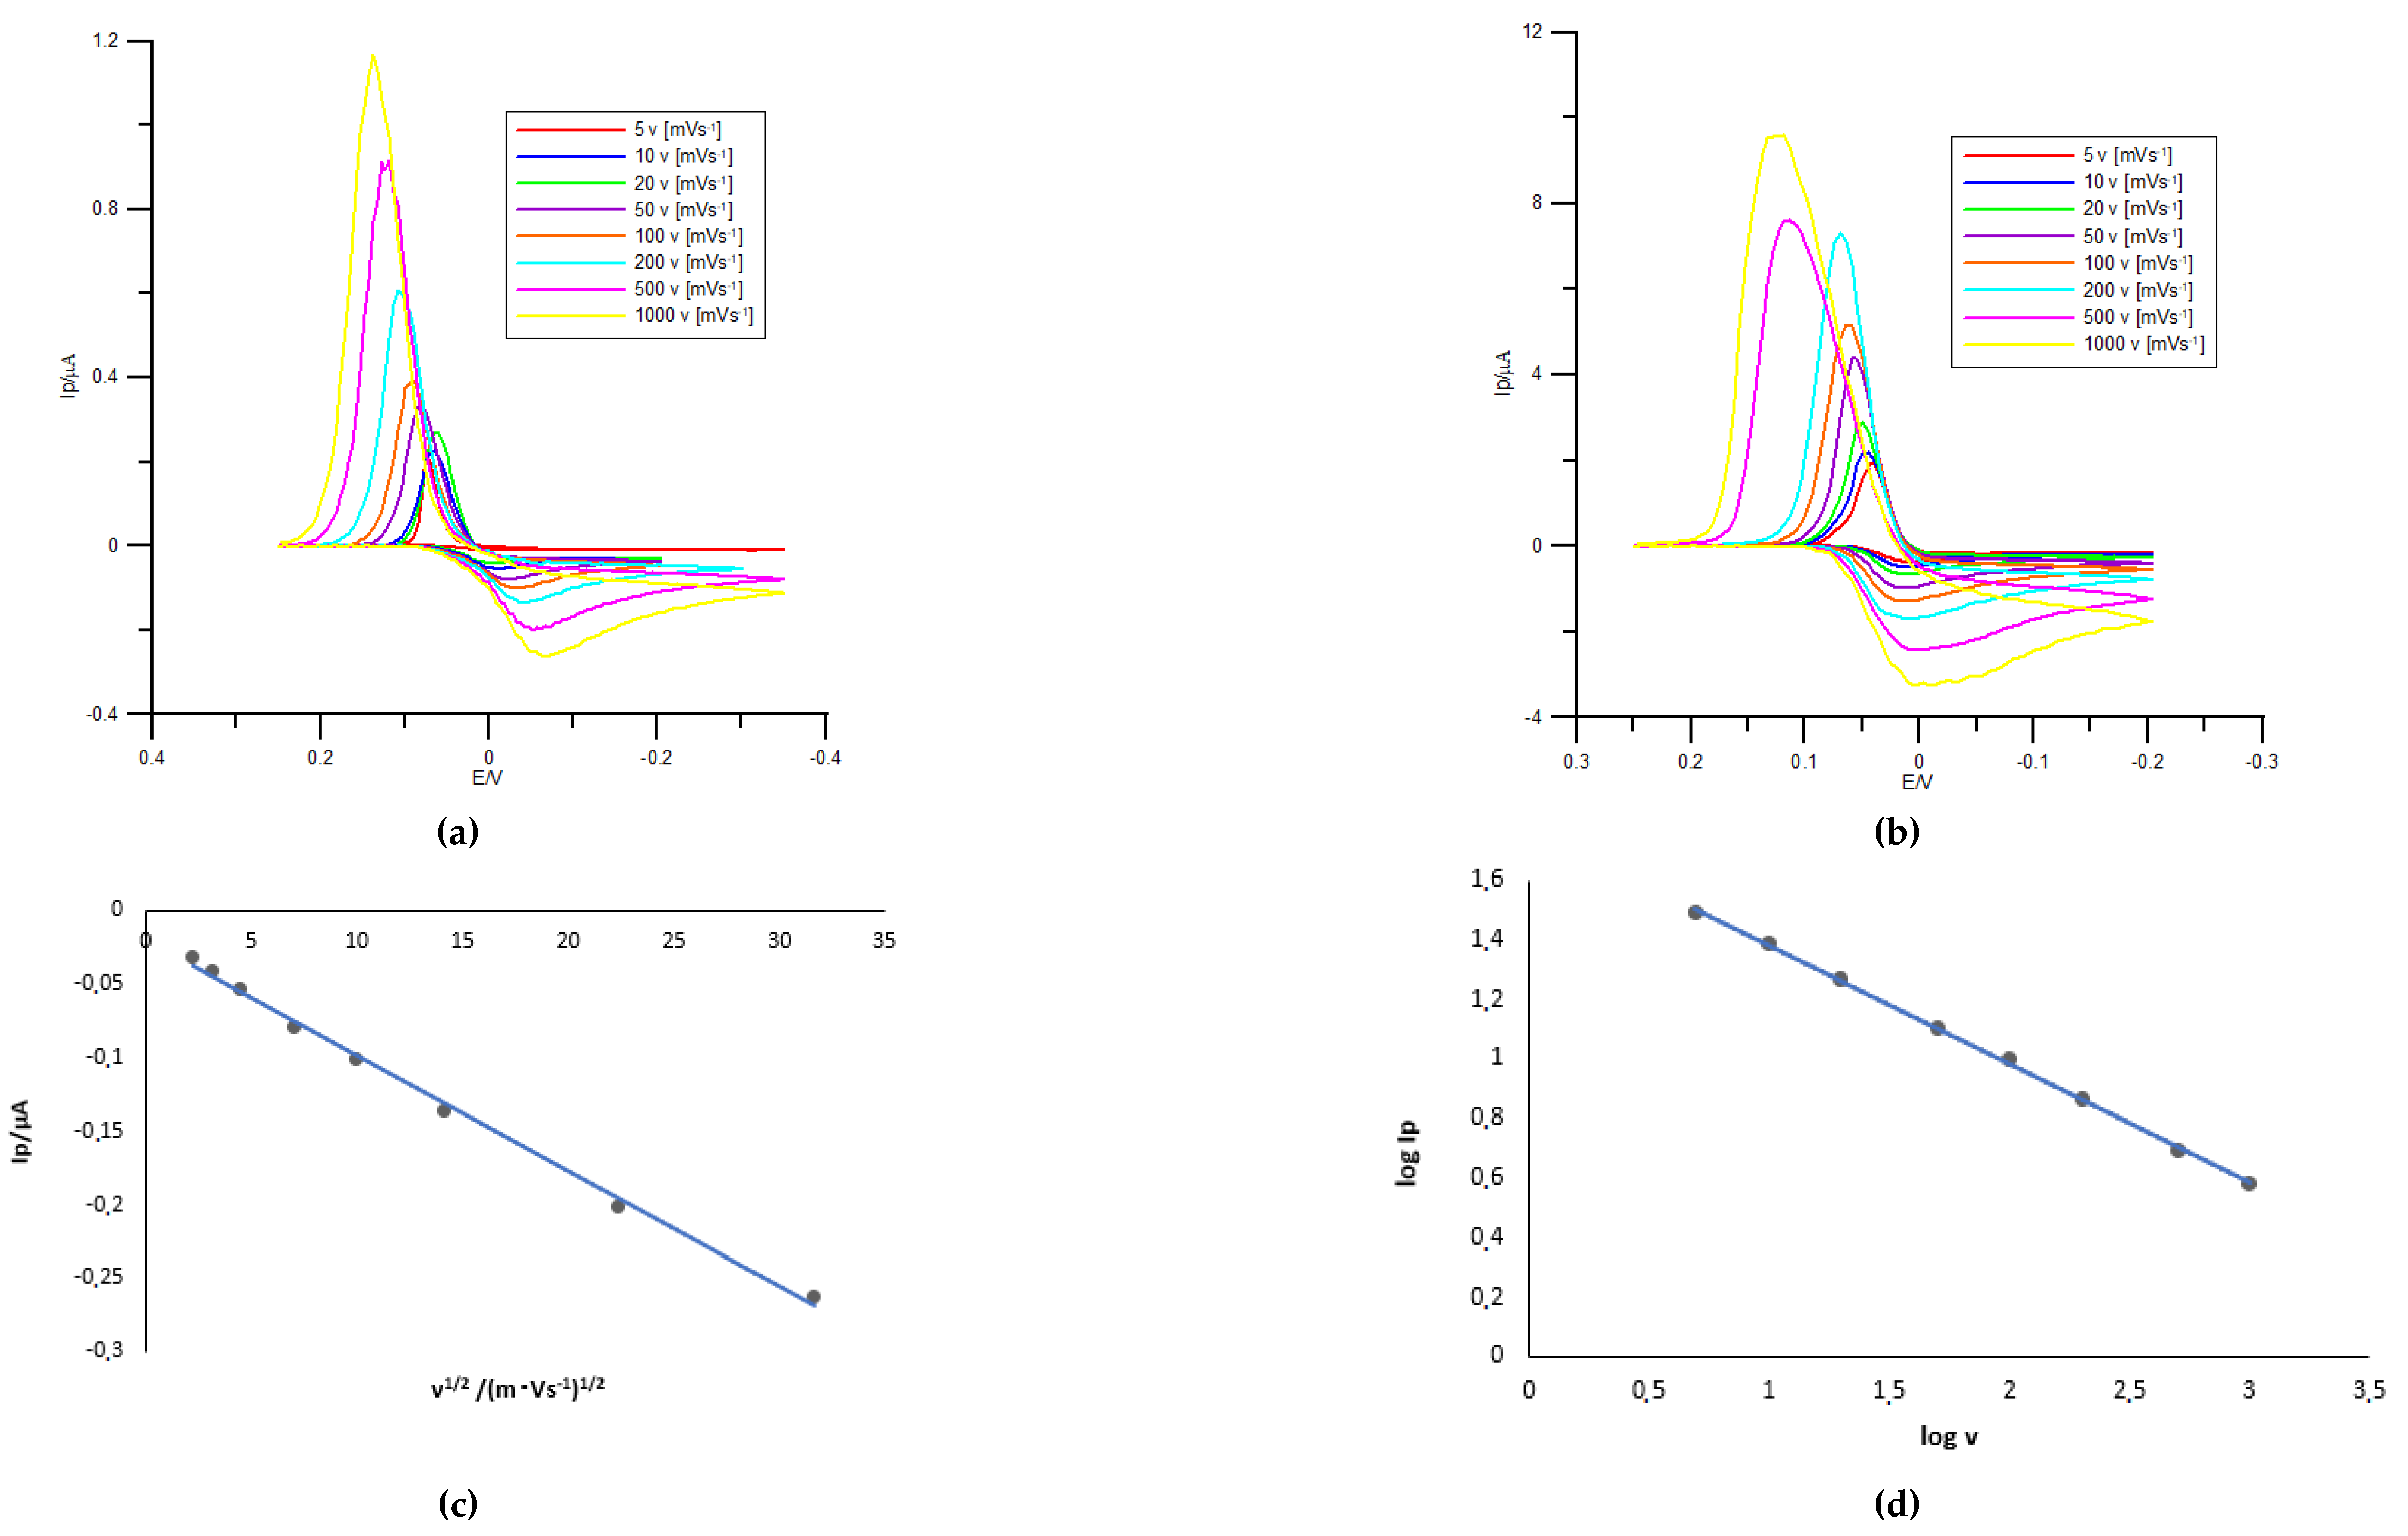
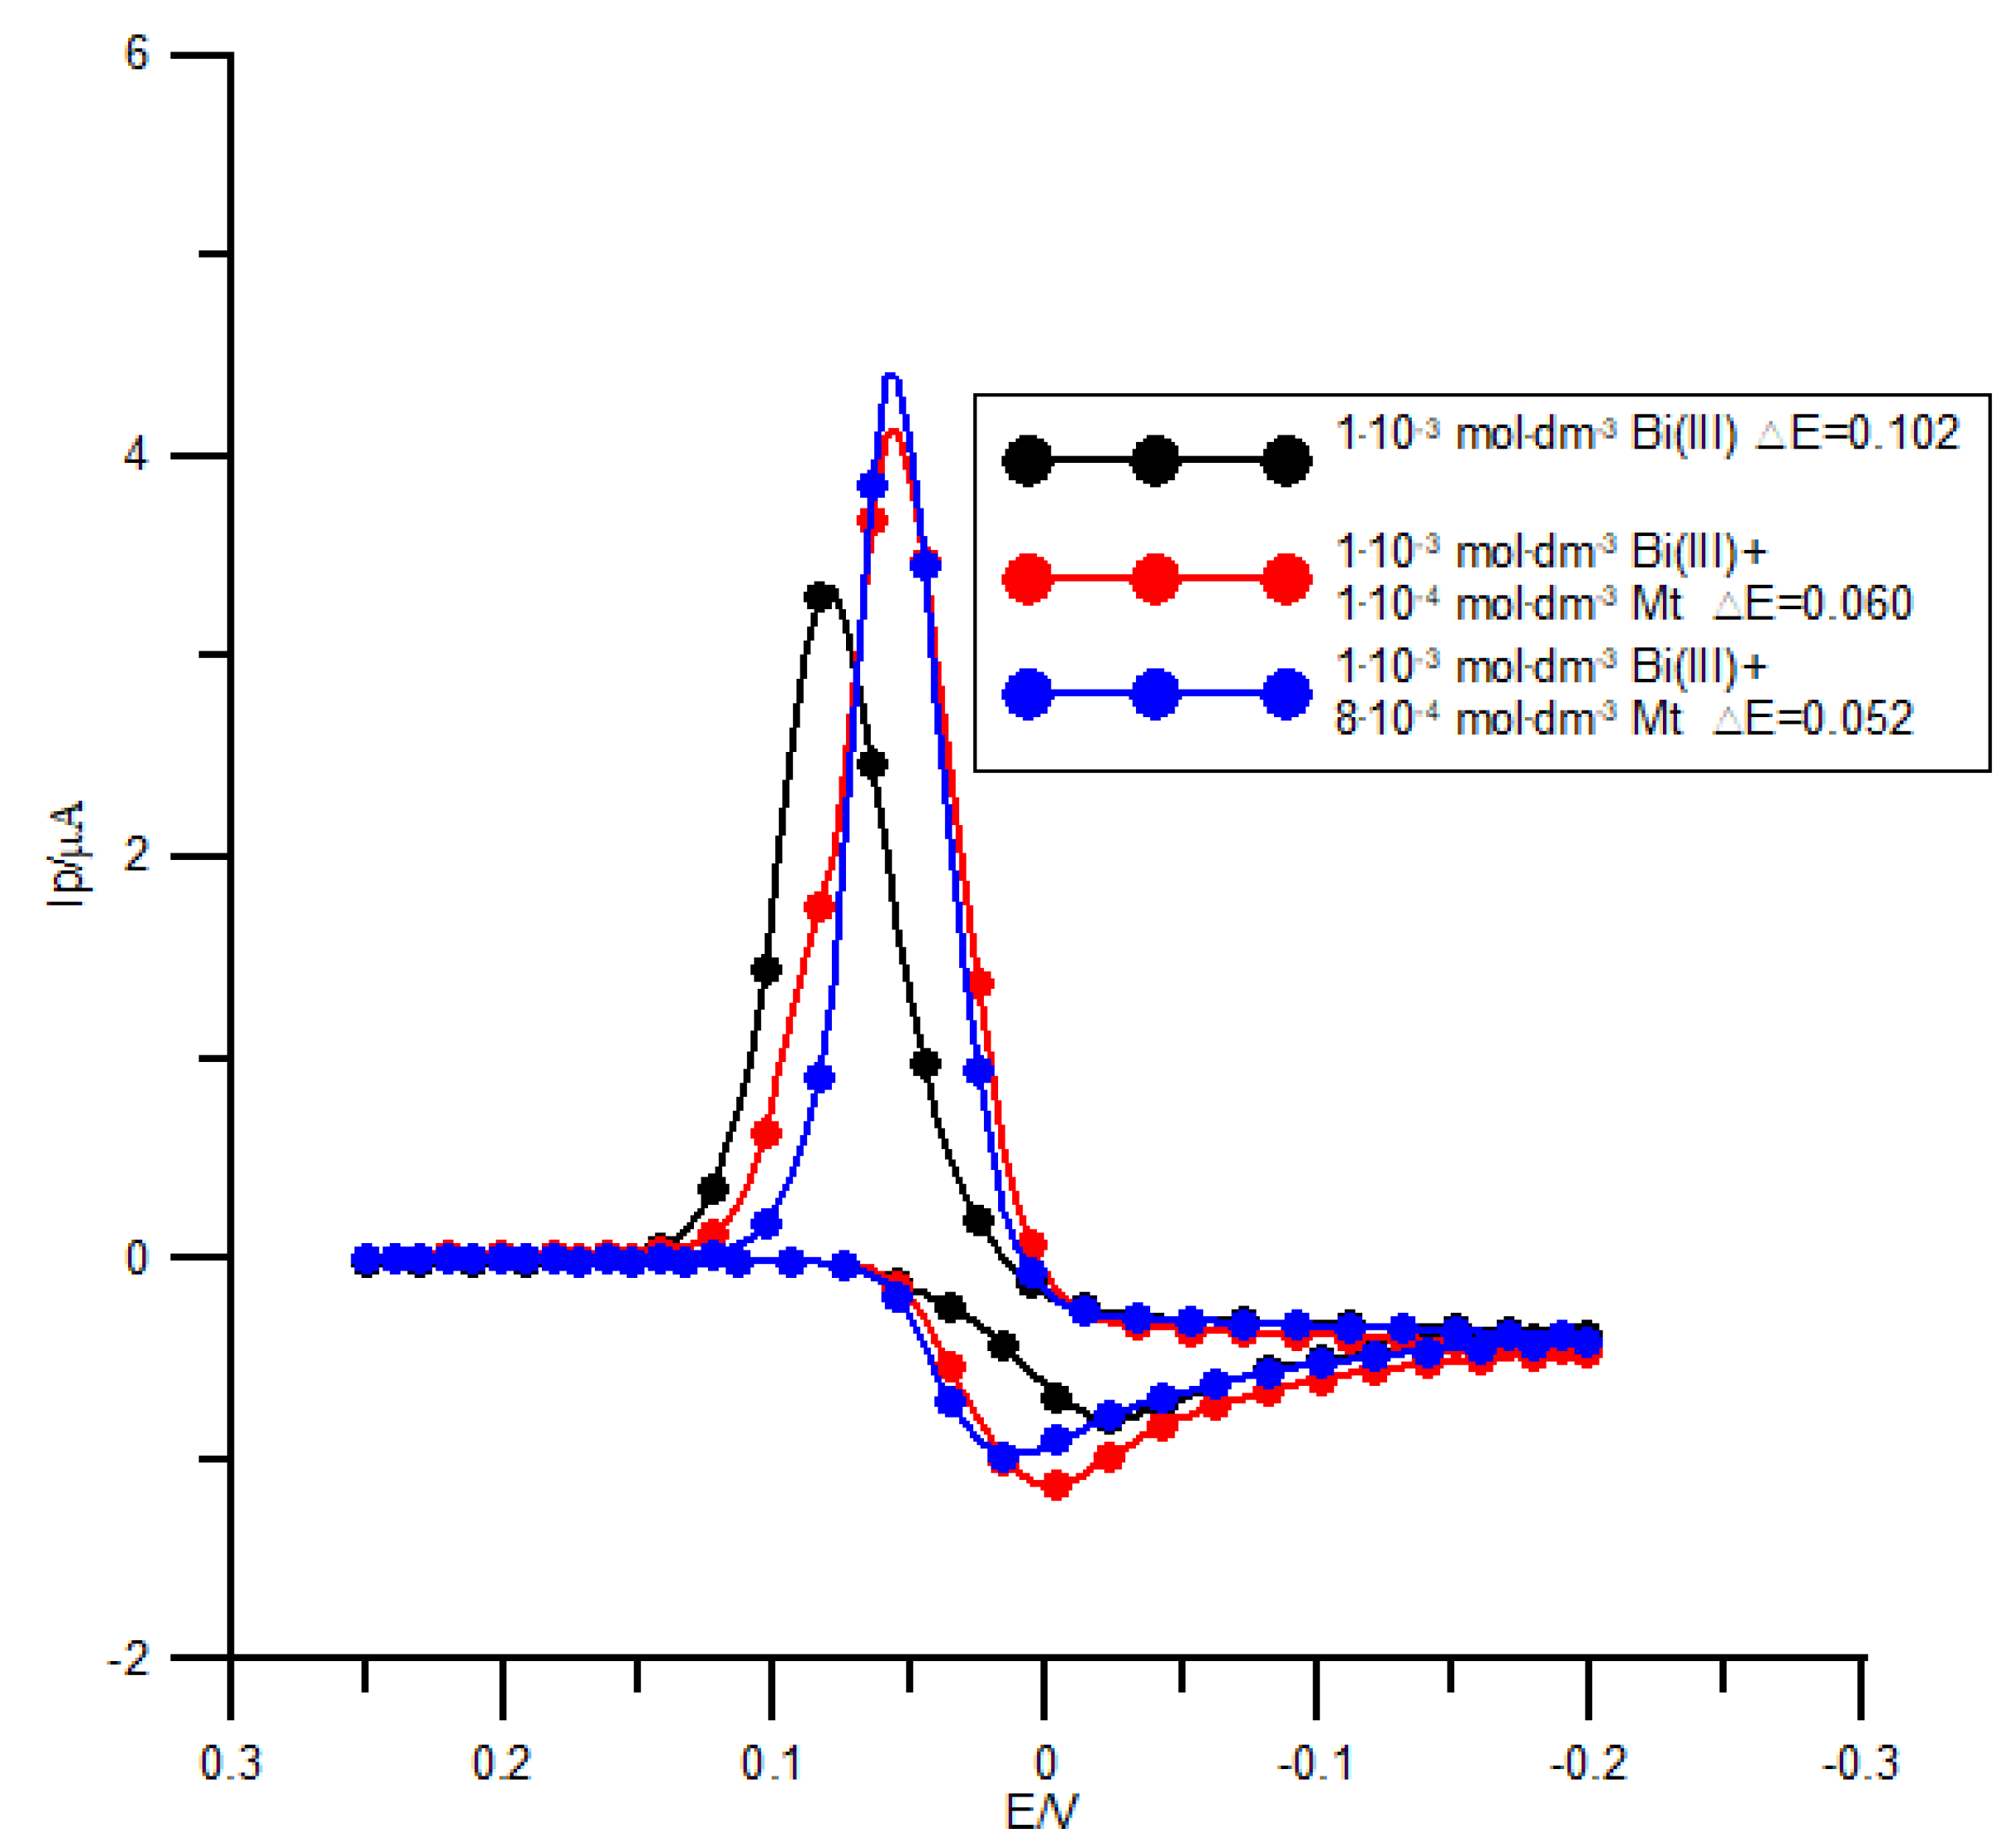
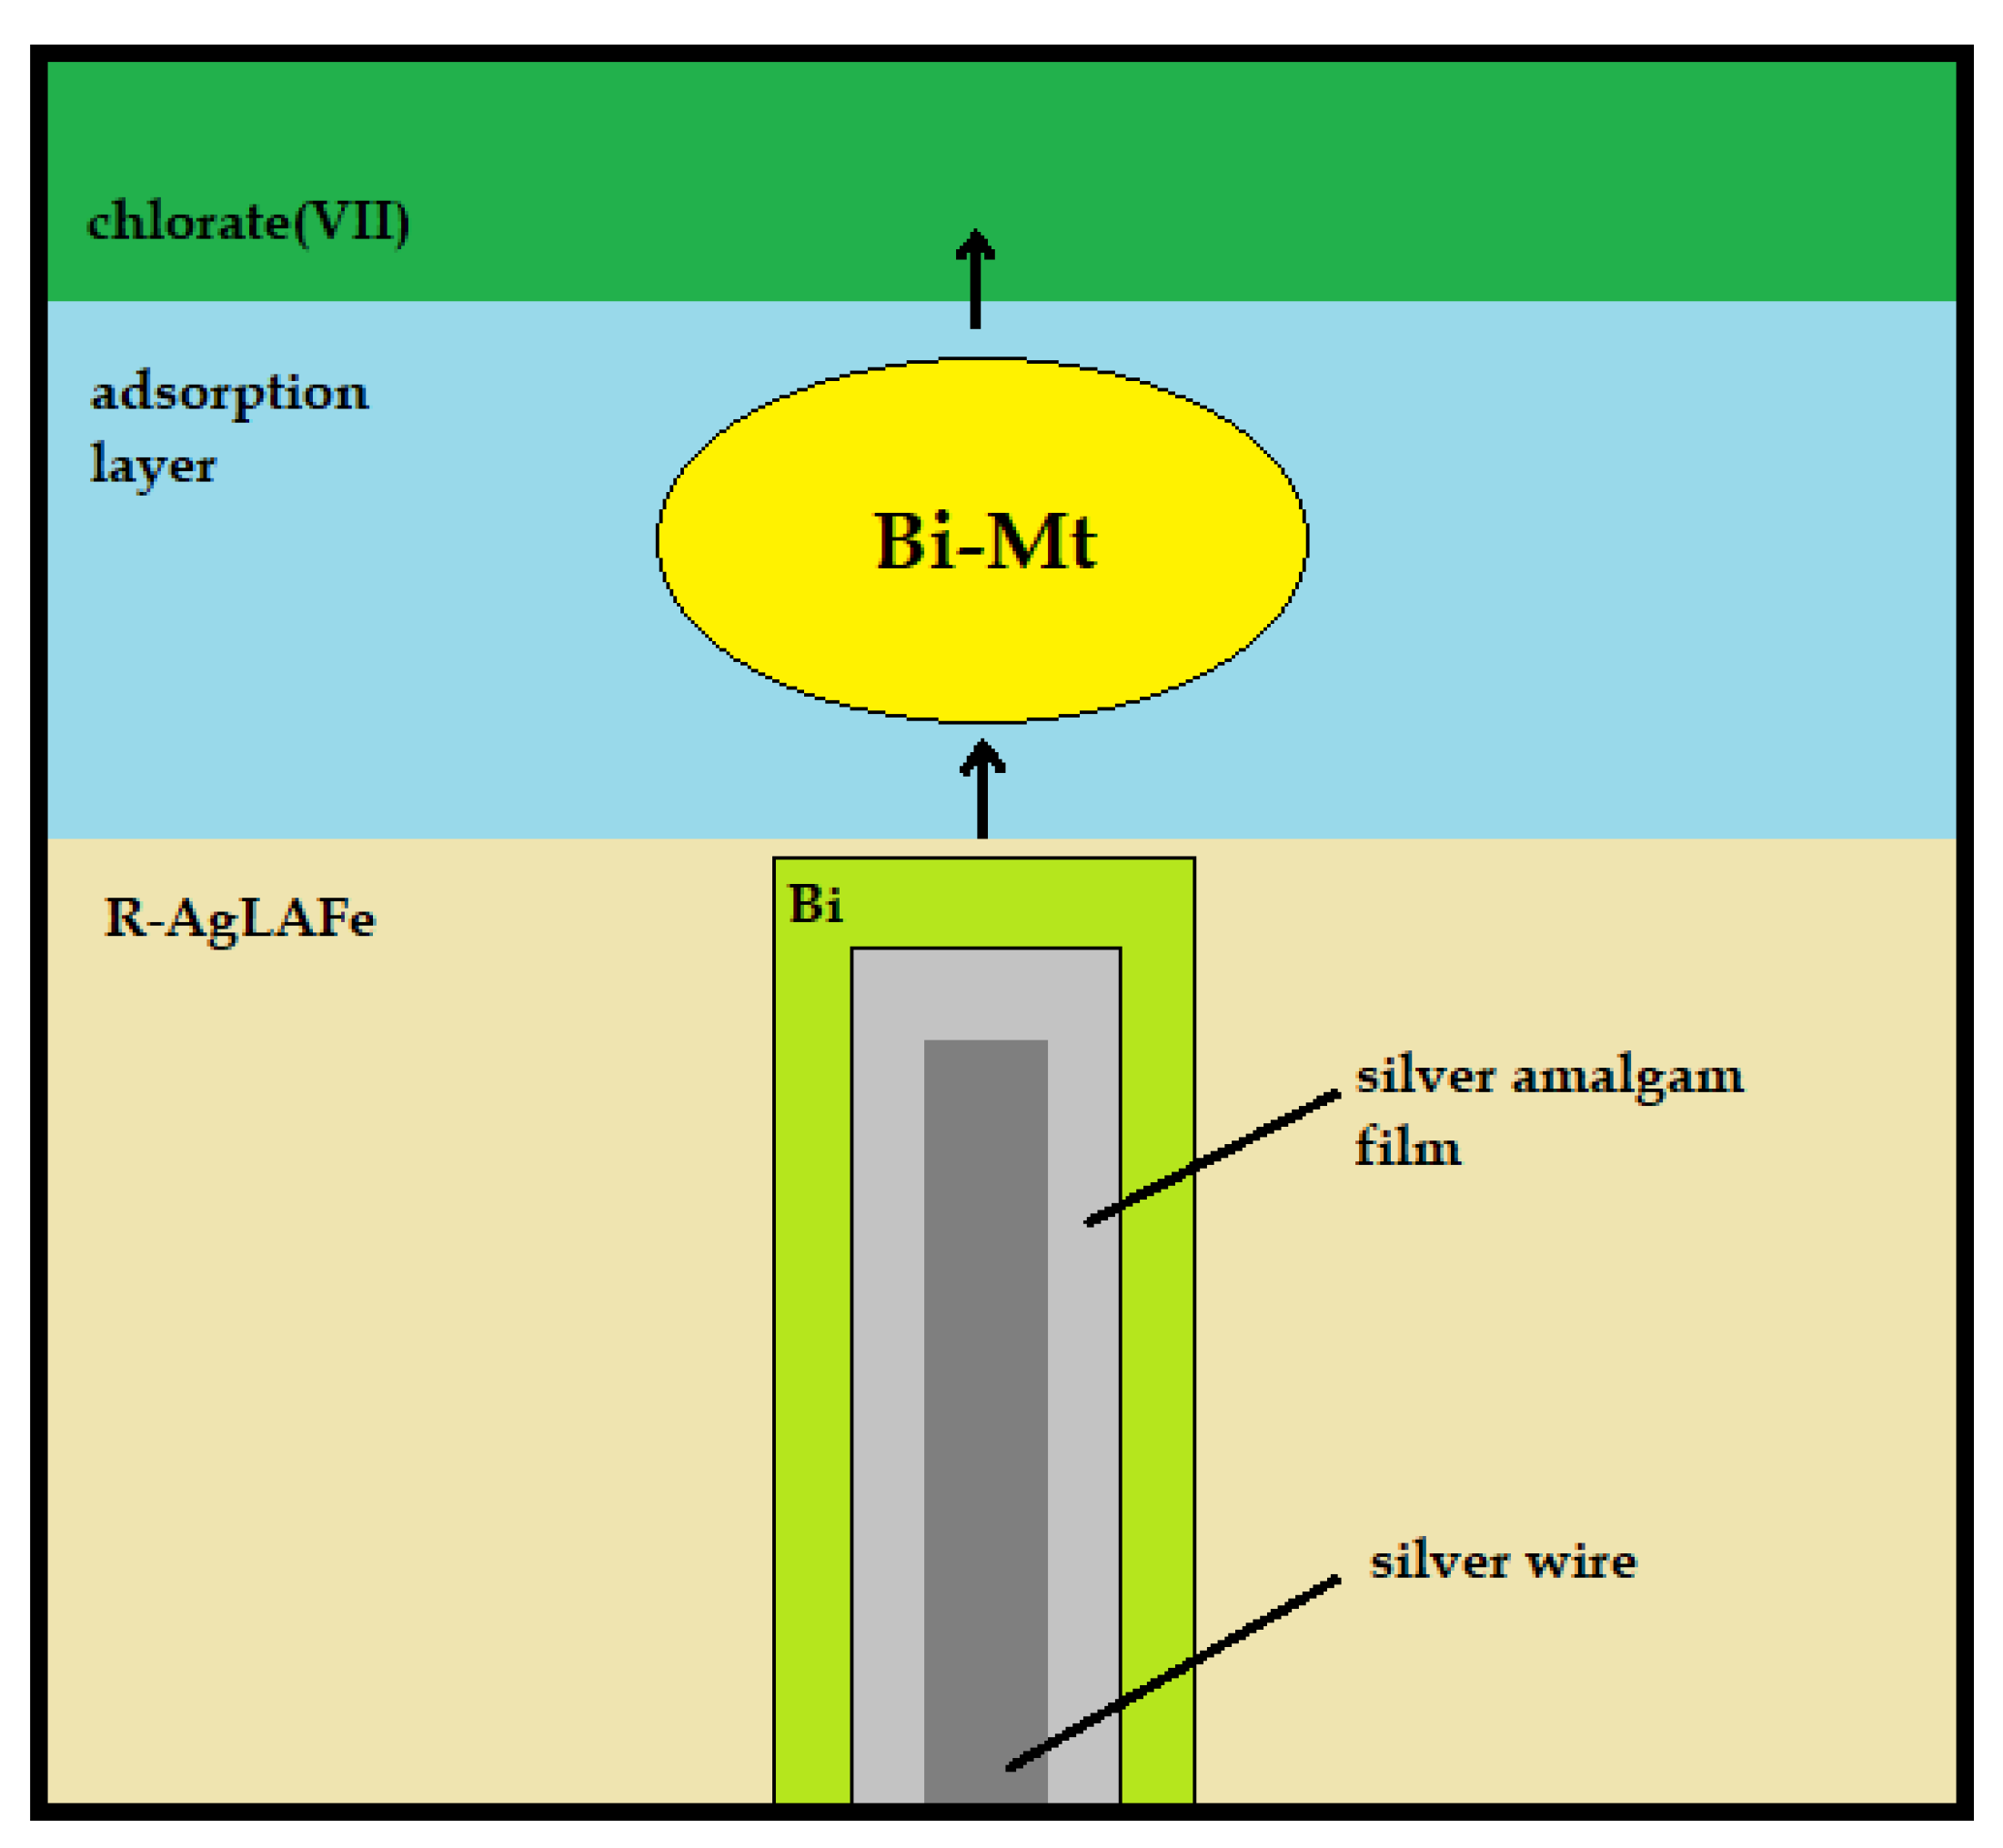
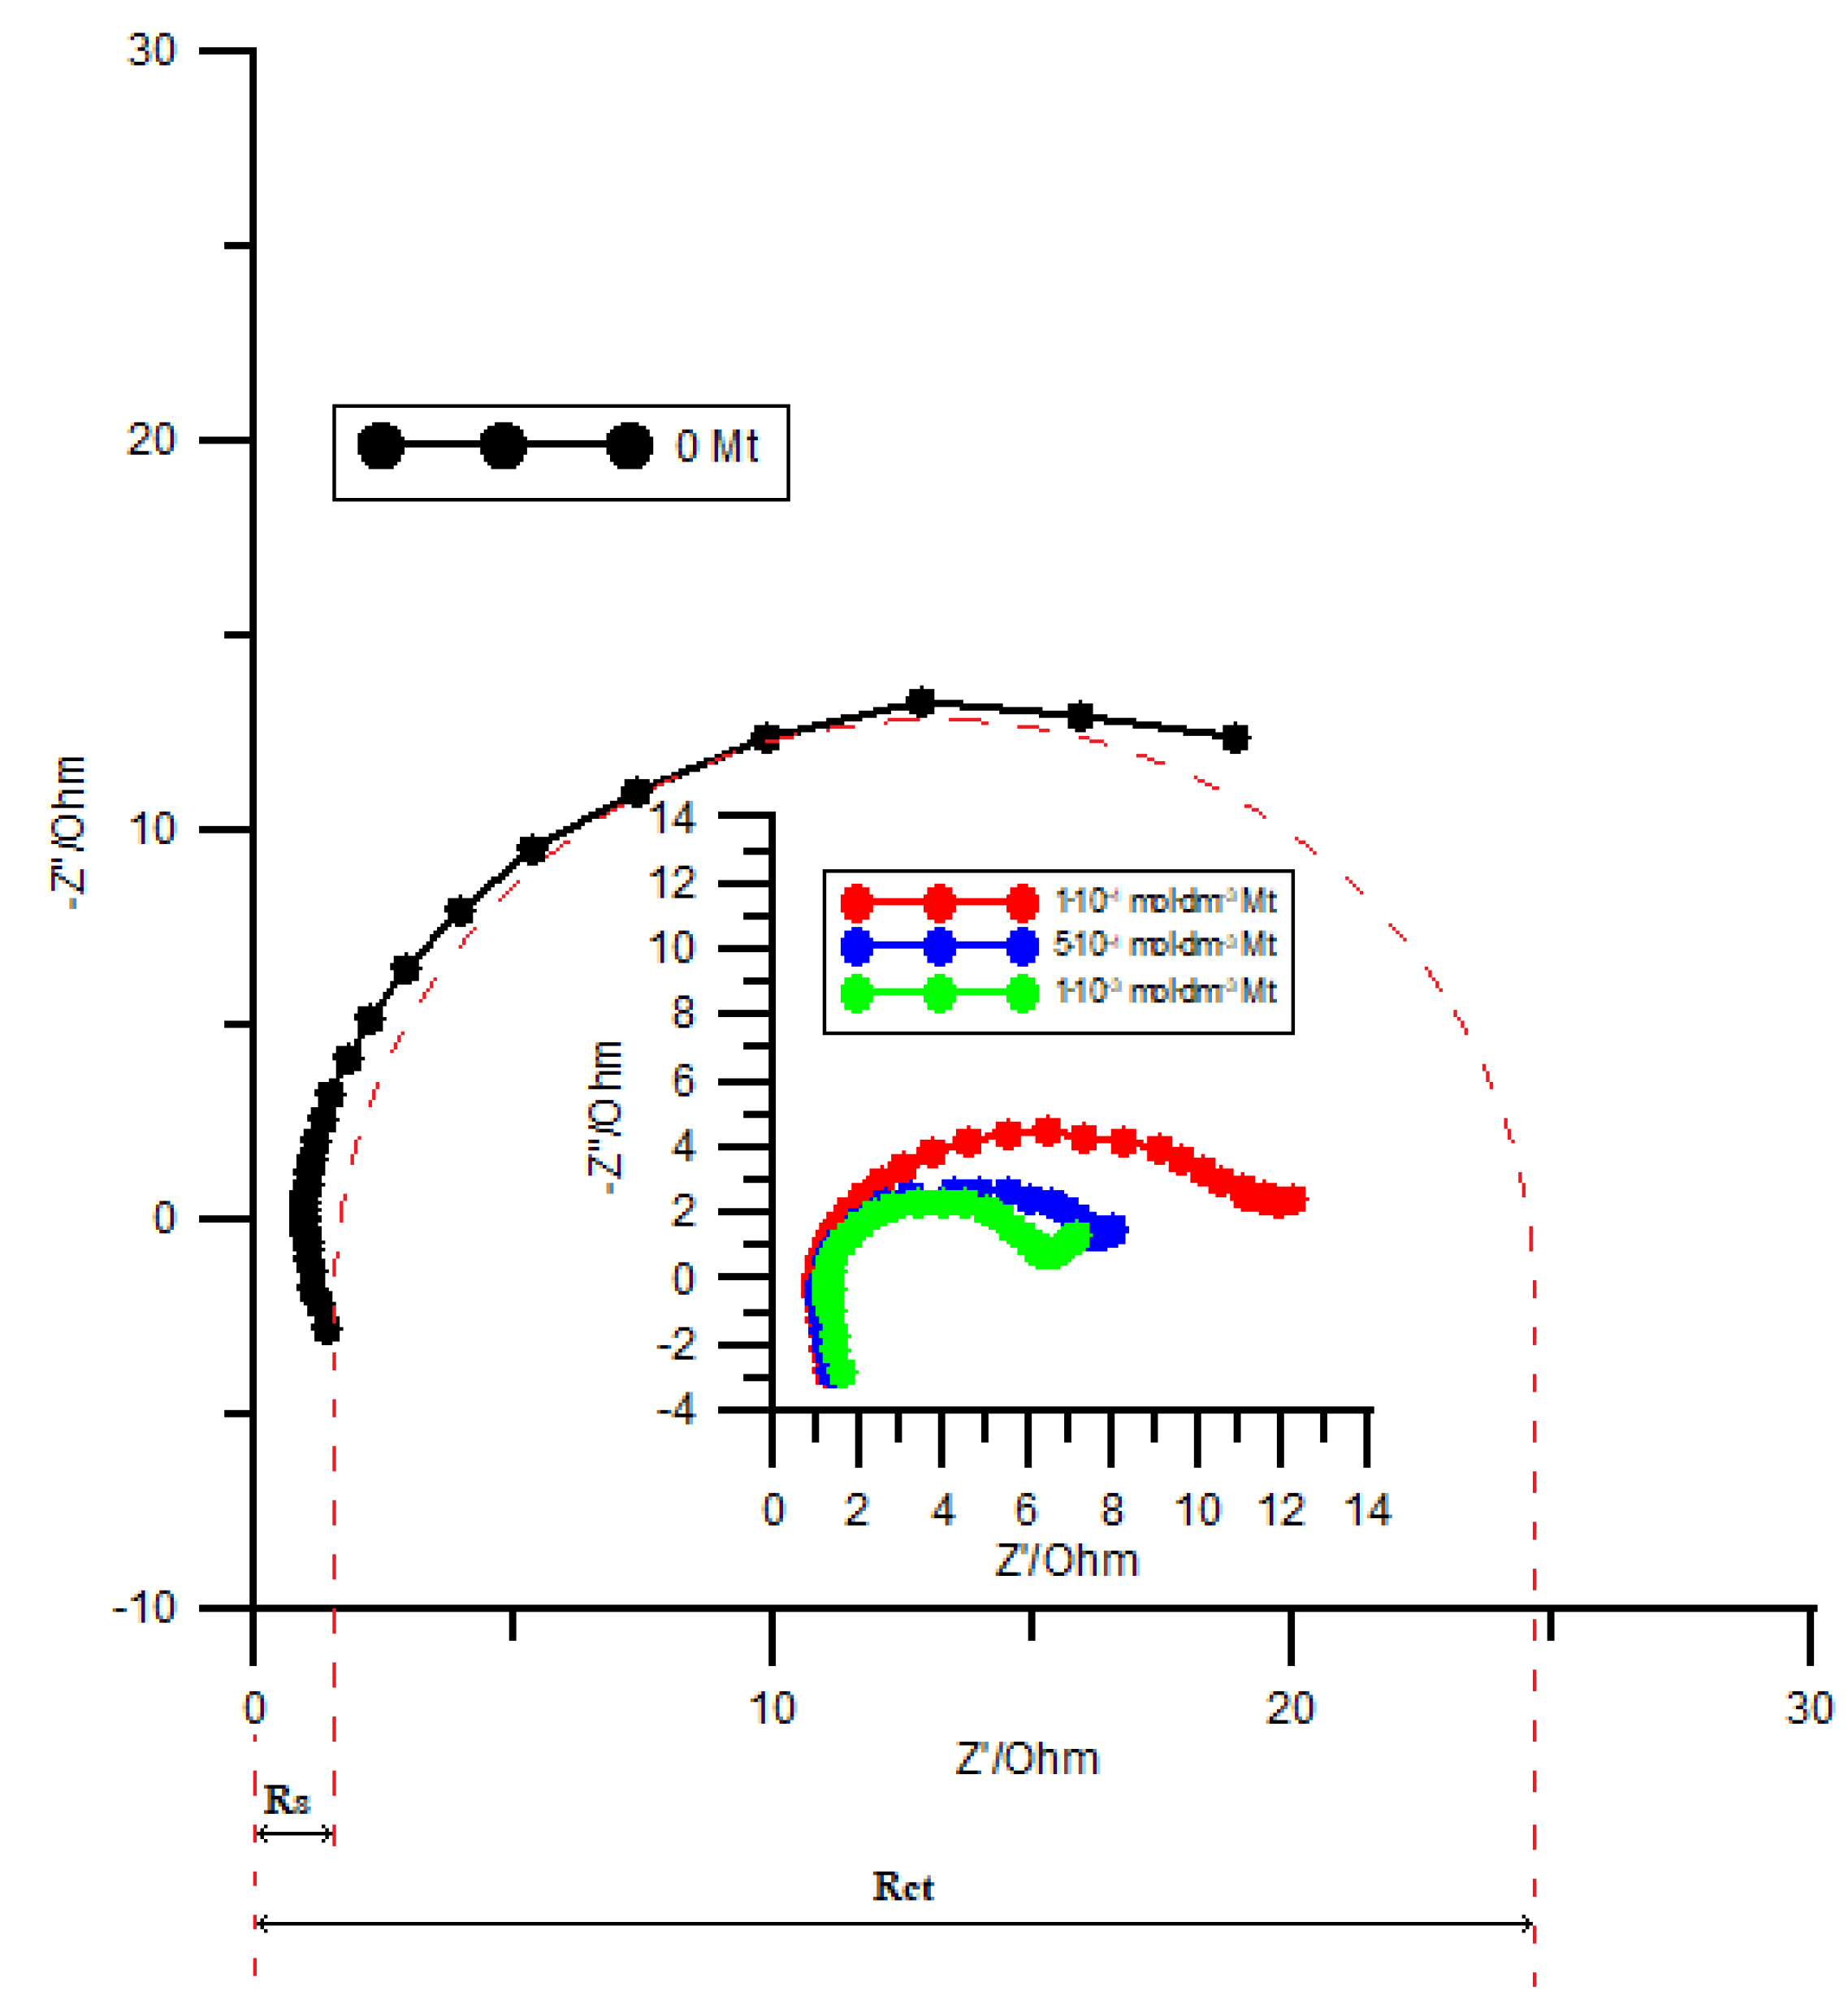
2.2. Kinetics and Electrode Mechanism at the R–AgLAFE Electrode
3. Experimental
3.1. Chemicals
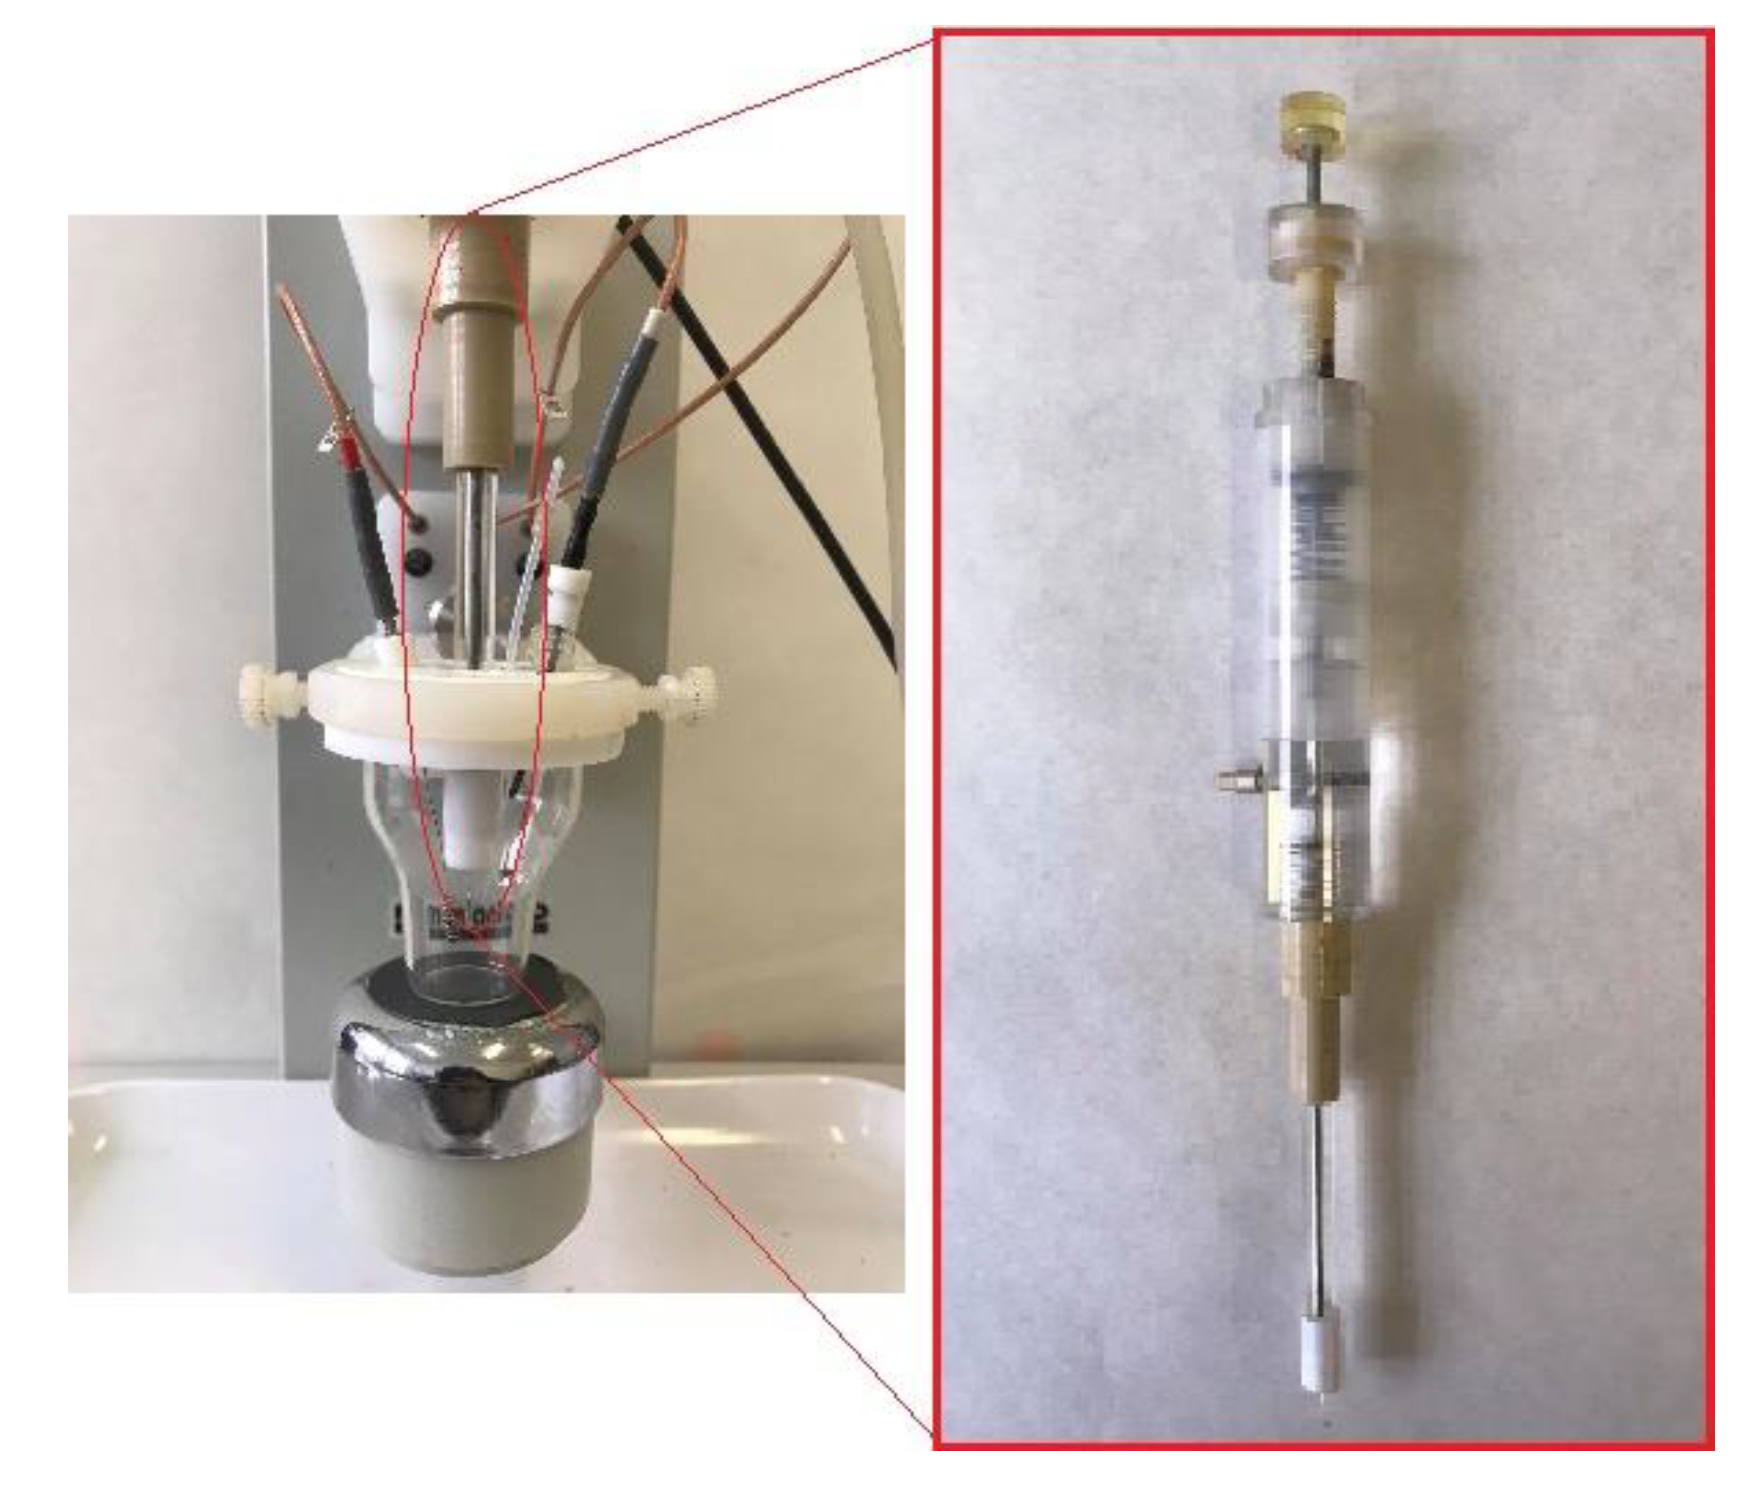
3.2. Apparatus
3.3. Measurement Procedures
3.3.1. Adsorption Procedure
Experimental Operating Conditions
3.3.2. Kinetic Procedure
Experimental Operating Conditions
Elaboration of Experimental Data
4. Conclusions
- partial dehydration of Bi(III) ions and formation of active complex (I)
- first electron transfer
- further dehydration and formation of active complex (II)
- second electron transfer
- dehydration of Bi(III) ions and formation of active complex (III)
- third electron transfer and amalgam formation
Author Contributions
Funding
Institutional Review Board Statement
Informed Consent Statement
Data Availability Statement
Conflicts of Interest
References
- Sykut, K.; Dalmata, G.; Nowicka, B.; Saba, J.J. Acceleration of electrode processes by organiccompounds—“cap-pair” effect. J. Electroanal. Chem. 1978, 90, 299–302. [Google Scholar] [CrossRef]
- Dalmata, D. Kinetics and Mechanism of Zn(II) Ions Electroreduction Catalyzed by Organic Compounds. Electroanalysis 2005, 17, 789–793. [Google Scholar] [CrossRef]
- Ajibade, P.A.; Andrew, F.P.; Botha, N.L.; Solomane, N. Synthesis, Crystal Structures and Anticancer Studies of Morpholinyldithiocarbamato Cu(II) and Zn(II) Complexes. Molecules 2020, 25, 3584. [Google Scholar] [CrossRef]
- Souto, R.M.; Sluyters-Rehbach, M.; Sluyters, J.H. On the Catalytic Effect of Thiourea on the Electrochemical Reduction of Cadmium(II) Ions at the DME from Aqueous 1 M KF Solutions. J. Electroanal. Chem. 1986, 201, 33–45. [Google Scholar] [CrossRef]
- Nosal-Wiercińska, A. Catalytic activity of thiourea and its selected derivatives on electroreduction of In(III) in chlorates(VII). Cent. Eur. J. Chem. 2010, 8, 1–11. [Google Scholar] [CrossRef]
- Nosal-Wiercińska, A. Intermolecular Interactions in Systems Containing Bi(III)–ClO4-–H2O–Selected Amino Acids in the Aspect of Catalysis of Bi(III) Electroreduction. Electroanalysis 2014, 26, 1013–1023. [Google Scholar] [CrossRef]
- Komorsky-Lovrič, S.; Lovrič, M.; Branica, M. Effect of Ionic Strength on Bi(III) Reduction from Perchlorate Medium. J. Electrochem. Soc. 1993, 140, 1850–1853. [Google Scholar] [CrossRef]
- Ikeda, O.; Watanabe, K.; Taniguchi, Y.; Tamura, H. Adsorption Effect of Highly Polarizable Organic Compounds on Electrode Kinetics. Bull. Chem. Soc. Jpn. 1984, 57, 3363–3367. [Google Scholar] [CrossRef]
- Komorsky-Lovrič, S.; Lovrič, M.; Branica, M. Coadsorption of Bi(III) and Cl− at a mercury electrode. J. Electroanal. Chem. 1988, 241, 329–341. [Google Scholar] [CrossRef]
- Baś, B.; Kowalski, Z. Preparation of Silver Surface for Mercury Film Electrode of Prolonged Analytical Application. Electroanalysis 2002, 14, 1067–1071. [Google Scholar] [CrossRef]
- Nosal-Wiercińska, A.; Grochowski, M.; Baś, B. Voltammetric Measurement System. Polish Patent No P. 433189, 10 March 2020. [Google Scholar]
- Srivastava, A. Micro–level Estimation of Methionine Using Inhibitory Kinetic Spectrophotometric Method. Biointerface Res. Appl. Chem. 2020, 11, 10654–10663. [Google Scholar]
- Mota-Martorell, N.; Jové, M.; Borrás, C.; Berdún, R.; Obis, È.; Sol, J.; Cabré, R.; Pradas, I.; Galo-Licona, D.J.; Puig, J.; et al. Methionine transsulfuration pathway is upregulated in long–lived humans. Free Radic. Biol. Med. 2021, 162, 38–52. [Google Scholar] [CrossRef]
- Gao, X.; Sanderson, S.M.; Dai, Z.; Reid, M.A.; Cooper, D.E.; Lu, M.; Richie, P.J., Jr.; Ciccarella, A.; Calcagnotto, A.; Mikhael, P.G.; et al. Dietary methionine influences therapy in Mouse cancer models and Walters human metabolism. Nature 2019, 572, 397–401. [Google Scholar] [CrossRef]
- Sorin, M.; Watkins, D.; Gilfix, B.M.; Rosenblatt, D.S. Methionine dependence in tumor cells: The potential role of cobalamin and MMACHC. Mol. Genet. Metab. Metab. 2021, 132, 155–161. [Google Scholar] [CrossRef] [PubMed]
- Sieńko, D.; Nieszporek, J.; Nieszporek, K.; Gugała, D.; Saba, J. Adsorption of Cytosine on a Mercury Electrode. Collect. Czech. Chem. Commun. 2006, 71, 1393–1406. [Google Scholar] [CrossRef]
- Jurkiewicz-Herbich, M.; Słojkowska, R.; Skompska, M. Adsorption of nicotinamide and nipecotamide from aqueous solutions at the Merkury electrode. J. Electroanal. Chem. 1995, 389, 191–196. [Google Scholar] [CrossRef]
- Nosal-Wiercińska, A.; Dalmata, G. Adsorption of methonine at mercury/aqueous solution of chlorate (VII) interface; dependence on the supporting electrolyte concentration. Electroanalysis 2010, 22, 2081–2086. [Google Scholar] [CrossRef]
- Baś, B.; Baś, S. Rapidly renewable silver amalgam annular band electrode for voltammetry and polarography. Electrochem. Commun. 2010, 12, 816–819. [Google Scholar] [CrossRef]
- Baś, B. Refreshable mercury film silver based electrode for determination of chromium(VI) using catalytic adsorptive stripping voltammetry. Anal. Chim. Acta 2006, 570, 195–201. [Google Scholar] [CrossRef]
- Gosser, D.K. Cyclic Voltammetry; Simulation and Analysis of Reaction Mechanisms; WILEY-VCH: New York, NY, USA, 1994. [Google Scholar]
- Skrzypek, S. Electrode mechanism and voltammetric determination of selected guanidino compounds. Cent. Eur. J. Chem. 2012, 10, 977–988. [Google Scholar] [CrossRef]
- Nosal-Wiercińska, A. The Kinetics and Mechanism of the Electroreduction of Bi(III) Ions from Chlorates(VII) with Varied Water Activity. Electrochim. Acta 2010, 55, 5917–5921. [Google Scholar] [CrossRef]
- Nosal-Wiercińska, A.; Dalmata, G. Studies of the Effect of Thiourea on the Electroreduction of In(III) Ions in Perchloric Acid. Electroanalysis 2002, 14, 1275–1280. [Google Scholar] [CrossRef]
- Lasia, A.; Conway, B.E.; Bockris, J.; White, R.E. Electrochemical Impedance Spectroscopy and Its Application, Modern Aspects of Electrochemistry; Kluwer Academic/Plenum Publishers: Boston, MA, USA, 1999. [Google Scholar]
- Sluyters-Rehbach, M.; Sluyters, J.H. Comprehensive Treatise of Electrochemistry. In YeagerE; Bockris, J.O., Conway, B.E., Sarangapani, S., Eds.; Plenum Press: New York, NY, USA, 1984. [Google Scholar]
- Andreu, R.; Sluyters–Rehbach, M.; Remijnse, A.G.; Sluyters, J.H. The mechanism of the reduction of Zn(II) from NaClO4 base electrolyte solutions at the DME. J. Electroanal. Chem. Interf. Electrochem. 1982, 134, 101–115. [Google Scholar] [CrossRef]
- Marcus, R.A. Dynamical effects in electron transfer reactions. J. Chem. Phys. 1965, 43, 679–701. [Google Scholar] [CrossRef]
- Galus, Z. Electroanalytical Methods of Determination of Physicochemical Constants; PWN: Warsaw, Poland, 1979. (In Polish) [Google Scholar]


| 103 CBi(III) + 104 CMt/mol dm−3 | ΔE/V | |||||||
|---|---|---|---|---|---|---|---|---|
| v/mV s−1 | ||||||||
| 5 | 10 | 20 | 50 | 100 | 200 | 500 | 1000 | |
| 0.00 | 0.098 | 0.097 | 0.100 | 0.102 | 0.110 | 0.126 | 0.148 | 0.171 |
| 1.00 | 0.059 | 0.058 | 0.060 | 0.065 | 0.071 | 0.078 | 0.103 | 0.147 |
| 5.00 | 0.056 | 0.056 | 0.057 | 0.058 | 0.068 | 0.070 | 0.082 | 0.125 |
| 8.00 | 0.055 | 0.054 | 0.053 | 0.052 | 0.060 | 0.067 | 0.096 | 0.113 |
| 10.0 | 0.048 | 0.049 | 0.050 | 0.051 | 0.058 | 0.061 | 0.090 | 0.110 |
| 15.0 | 0.040 | 0.041 | 0.044 | 0.045 | 0.052 | 0.055 | 0.082 | 0.093 |
| 103 CBi(III) + 104 CMt/mol dm−3 | 104ks/cm s−1 | |
|---|---|---|
| CV | EIS | |
| 0.00 | 0.35 | 0.40 |
| 1.00 | 4.23 | 4.30 |
| 5.00 | 6.74 | 6.30 |
| 8.00 | 8.19 | 8.60 |
| 10.0 | 9.46 | 9.20 |
| 50.0 | 10.3 | 11.6 |
Publisher’s Note: MDPI stays neutral with regard to jurisdictional claims in published maps and institutional affiliations. |
© 2021 by the authors. Licensee MDPI, Basel, Switzerland. This article is an open access article distributed under the terms and conditions of the Creative Commons Attribution (CC BY) license (https://creativecommons.org/licenses/by/4.0/).
Share and Cite
Nosal-Wiercińska, A.; Martyna, M.; Mirčeski, V.; Skrzypek, S. Electroreduction of Bi(III) Ions at a Cyclically Renewable Liquid Silver Amalgam Film Electrode in the Presence of Methionine. Molecules 2021, 26, 3972. https://doi.org/10.3390/molecules26133972
Nosal-Wiercińska A, Martyna M, Mirčeski V, Skrzypek S. Electroreduction of Bi(III) Ions at a Cyclically Renewable Liquid Silver Amalgam Film Electrode in the Presence of Methionine. Molecules. 2021; 26(13):3972. https://doi.org/10.3390/molecules26133972
Chicago/Turabian StyleNosal-Wiercińska, Agnieszka, Marlena Martyna, Valentin Mirčeski, and Sławomira Skrzypek. 2021. "Electroreduction of Bi(III) Ions at a Cyclically Renewable Liquid Silver Amalgam Film Electrode in the Presence of Methionine" Molecules 26, no. 13: 3972. https://doi.org/10.3390/molecules26133972