
The Effect of Fat Content and Fatty Acids Composition on Color and Textural Properties of Butter

Abstract
:1. Introduction
2. Materials and Methods
2.1. Physicochemical Analysis
2.2. Fatty Acid Analysis
2.3. Texture Parameter Analysis
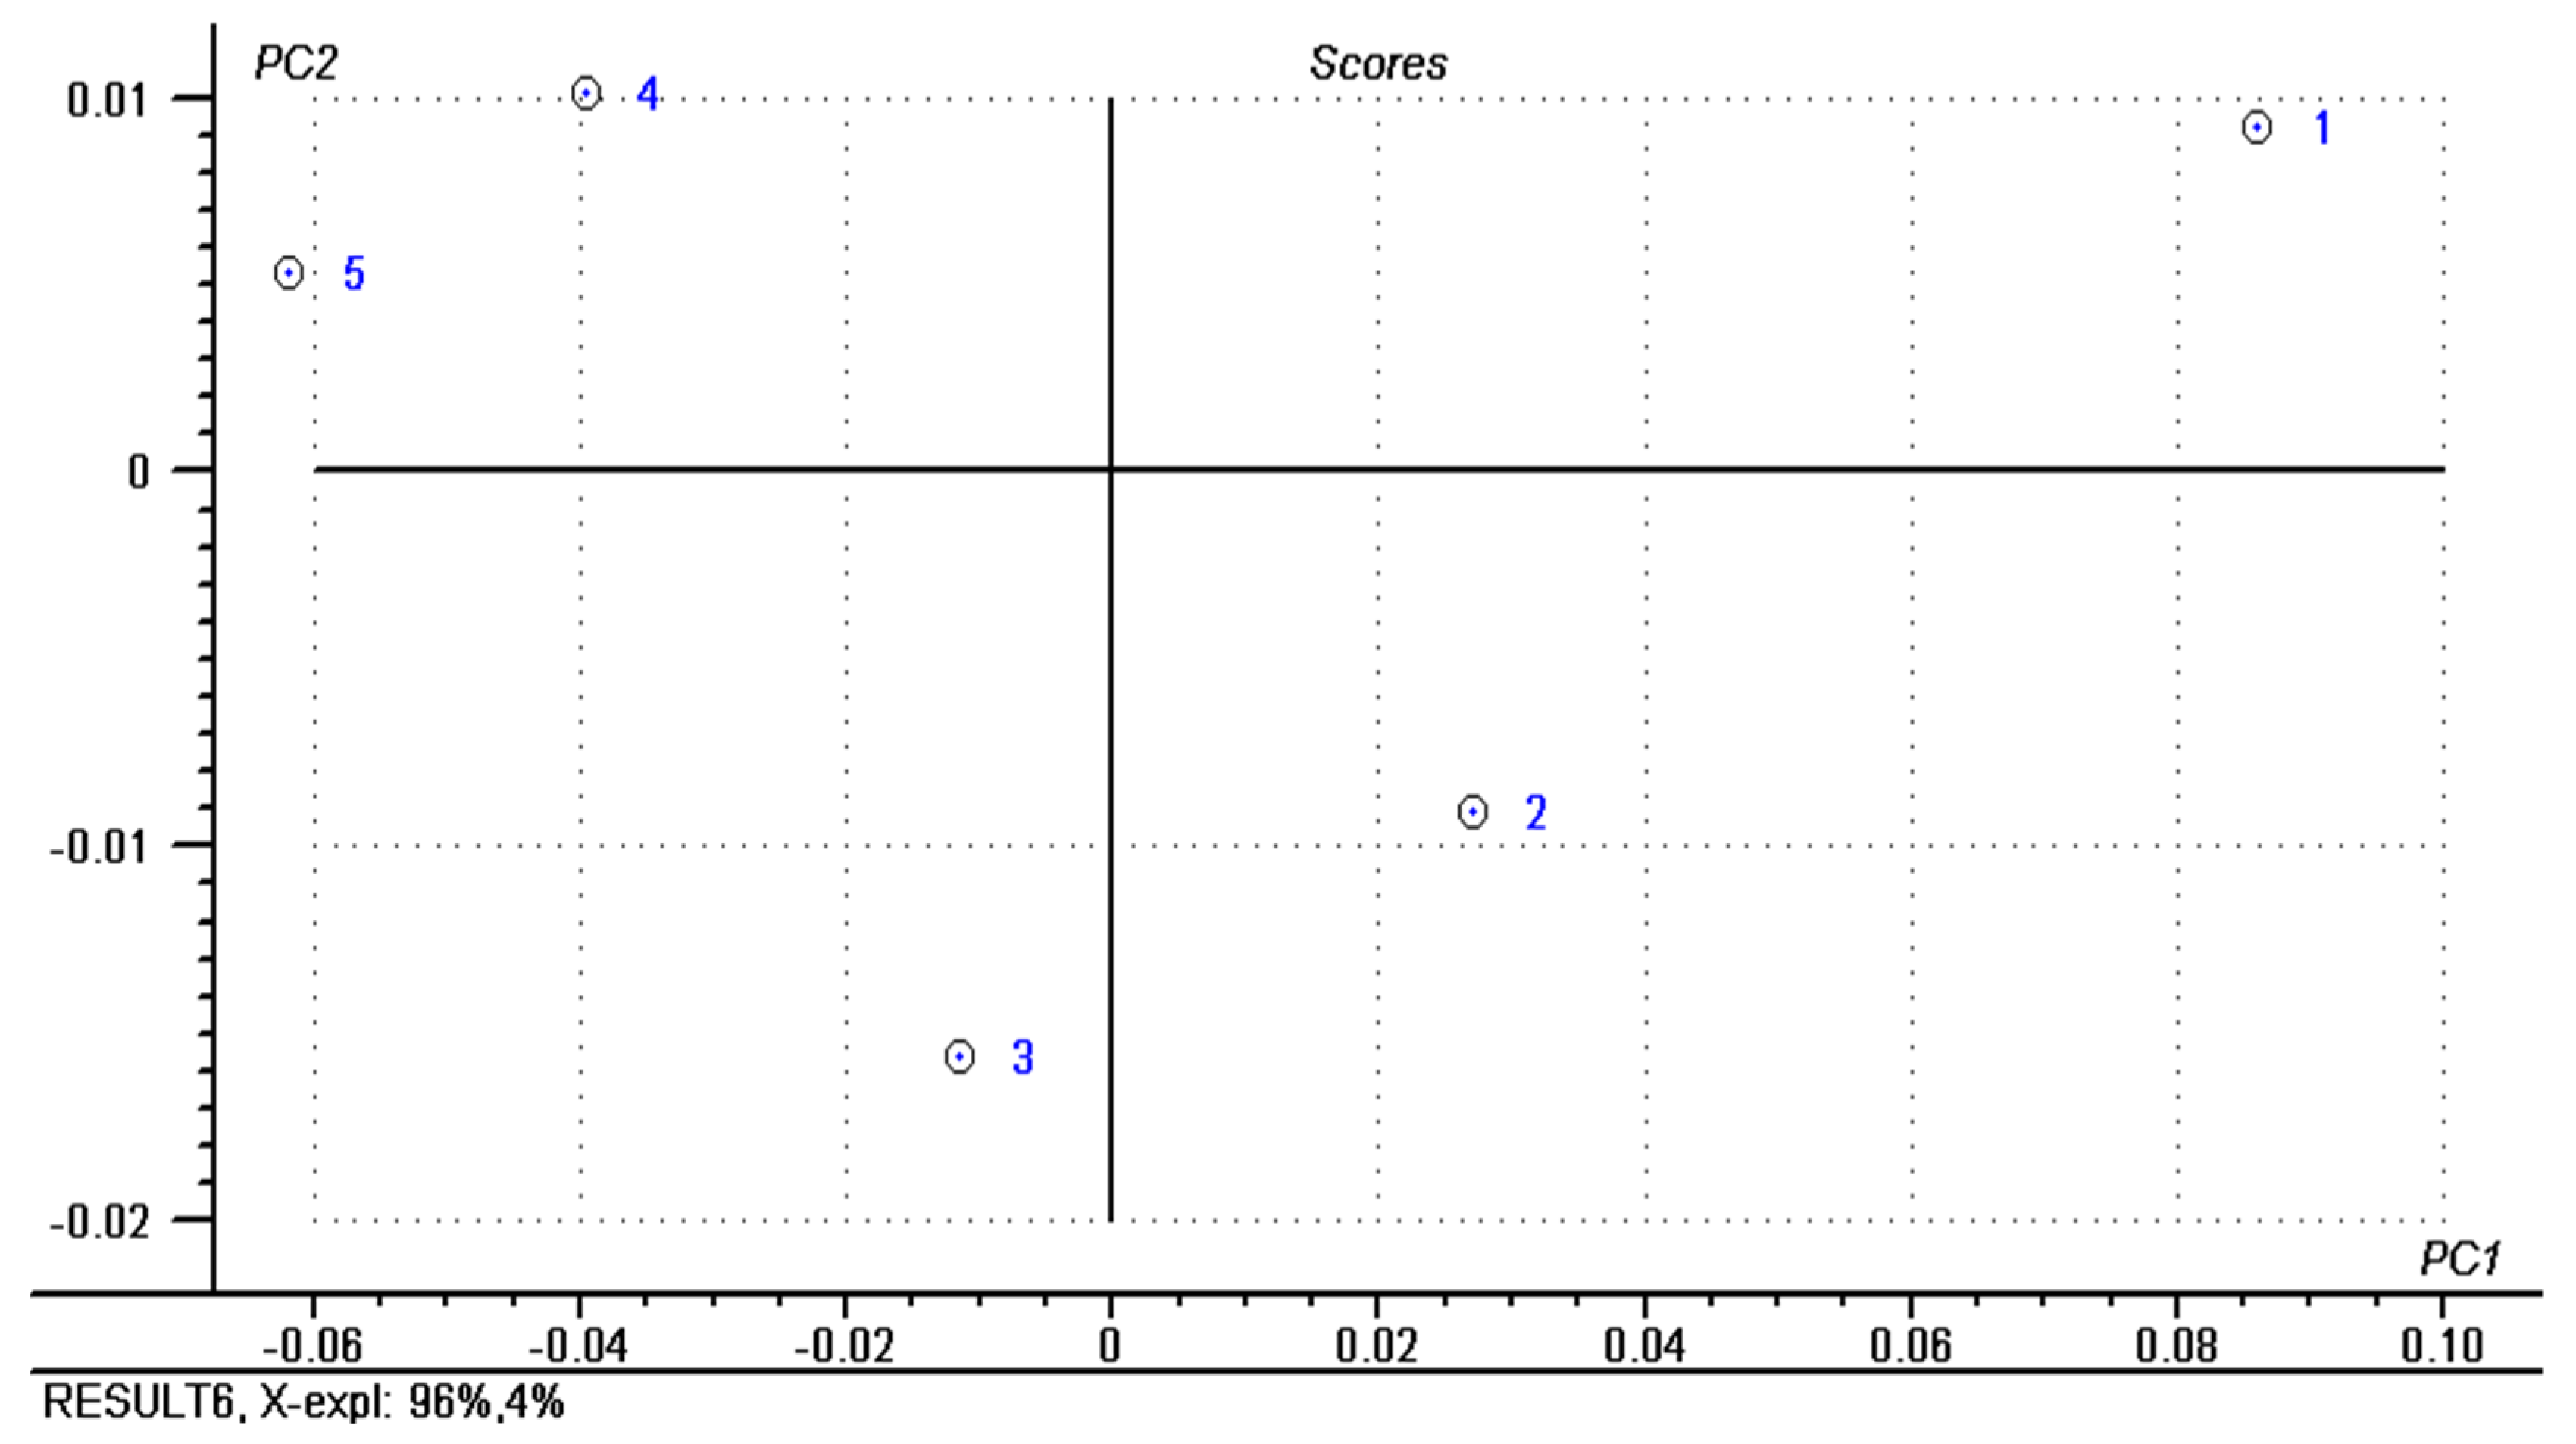
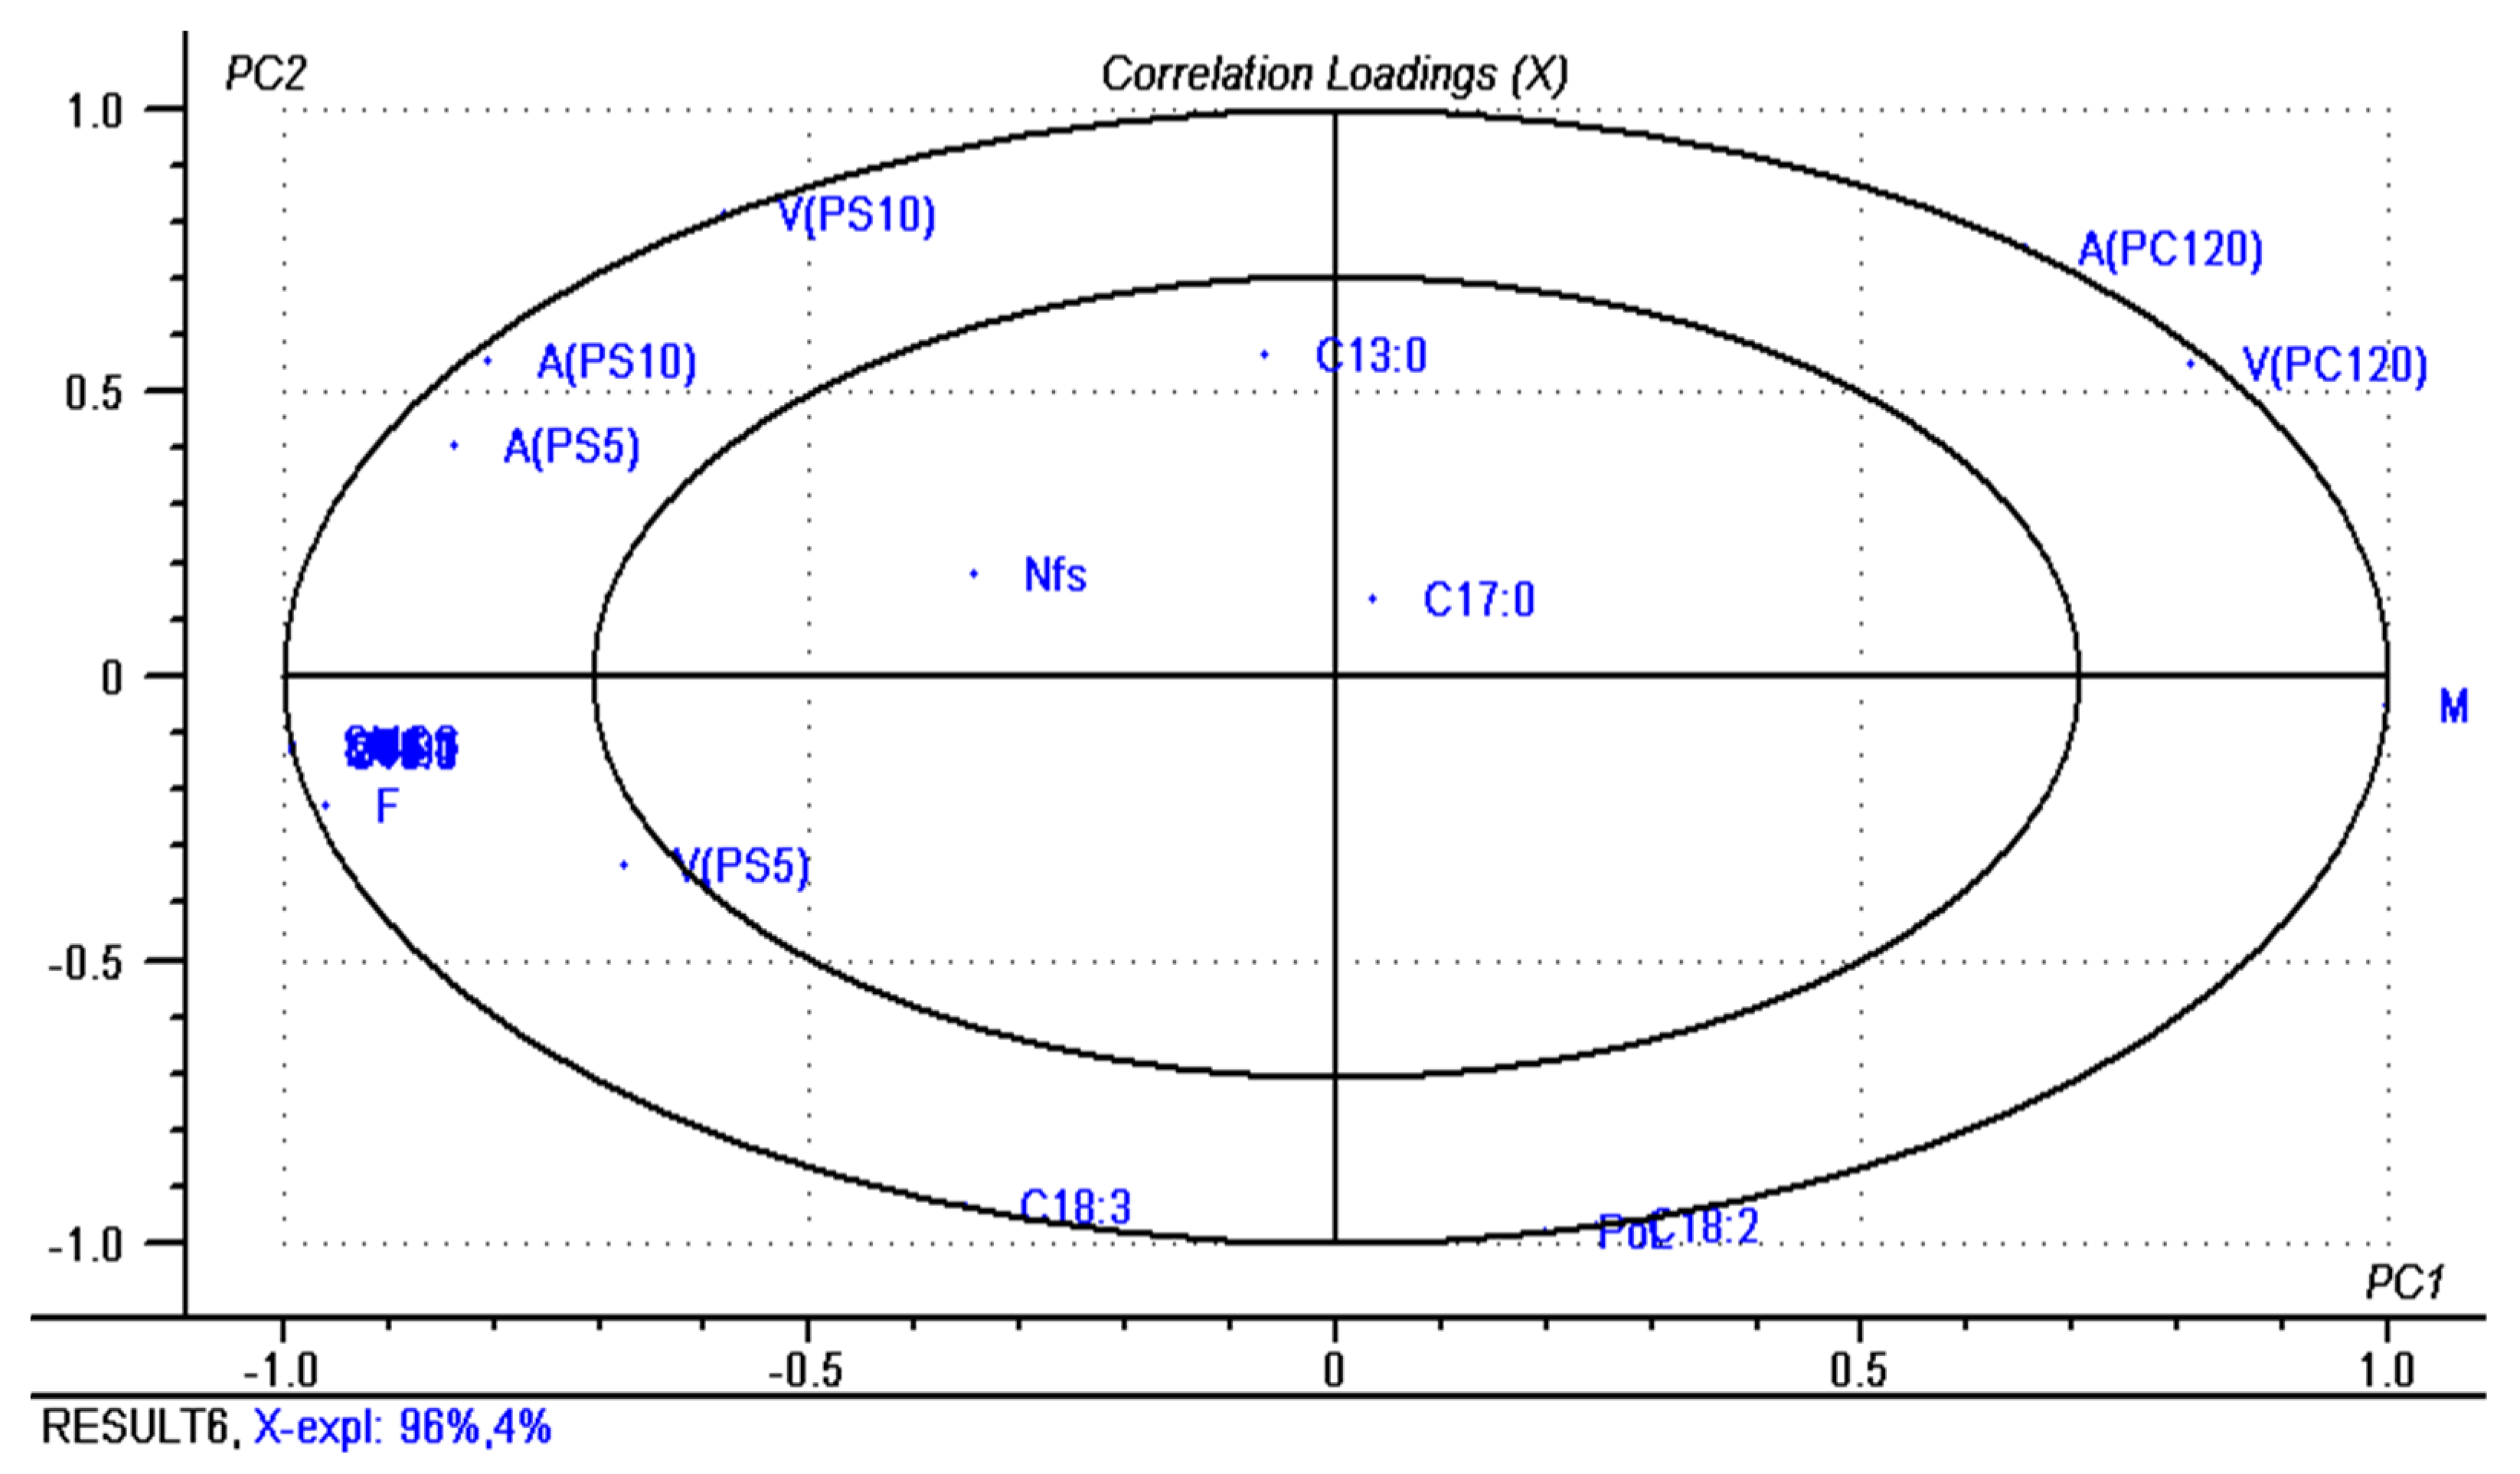
2.4. Statistical Analysis
3. Results and Discussion
3.1. Physicochemical and Color Evaluation
3.2. Fatty Acid Analysis
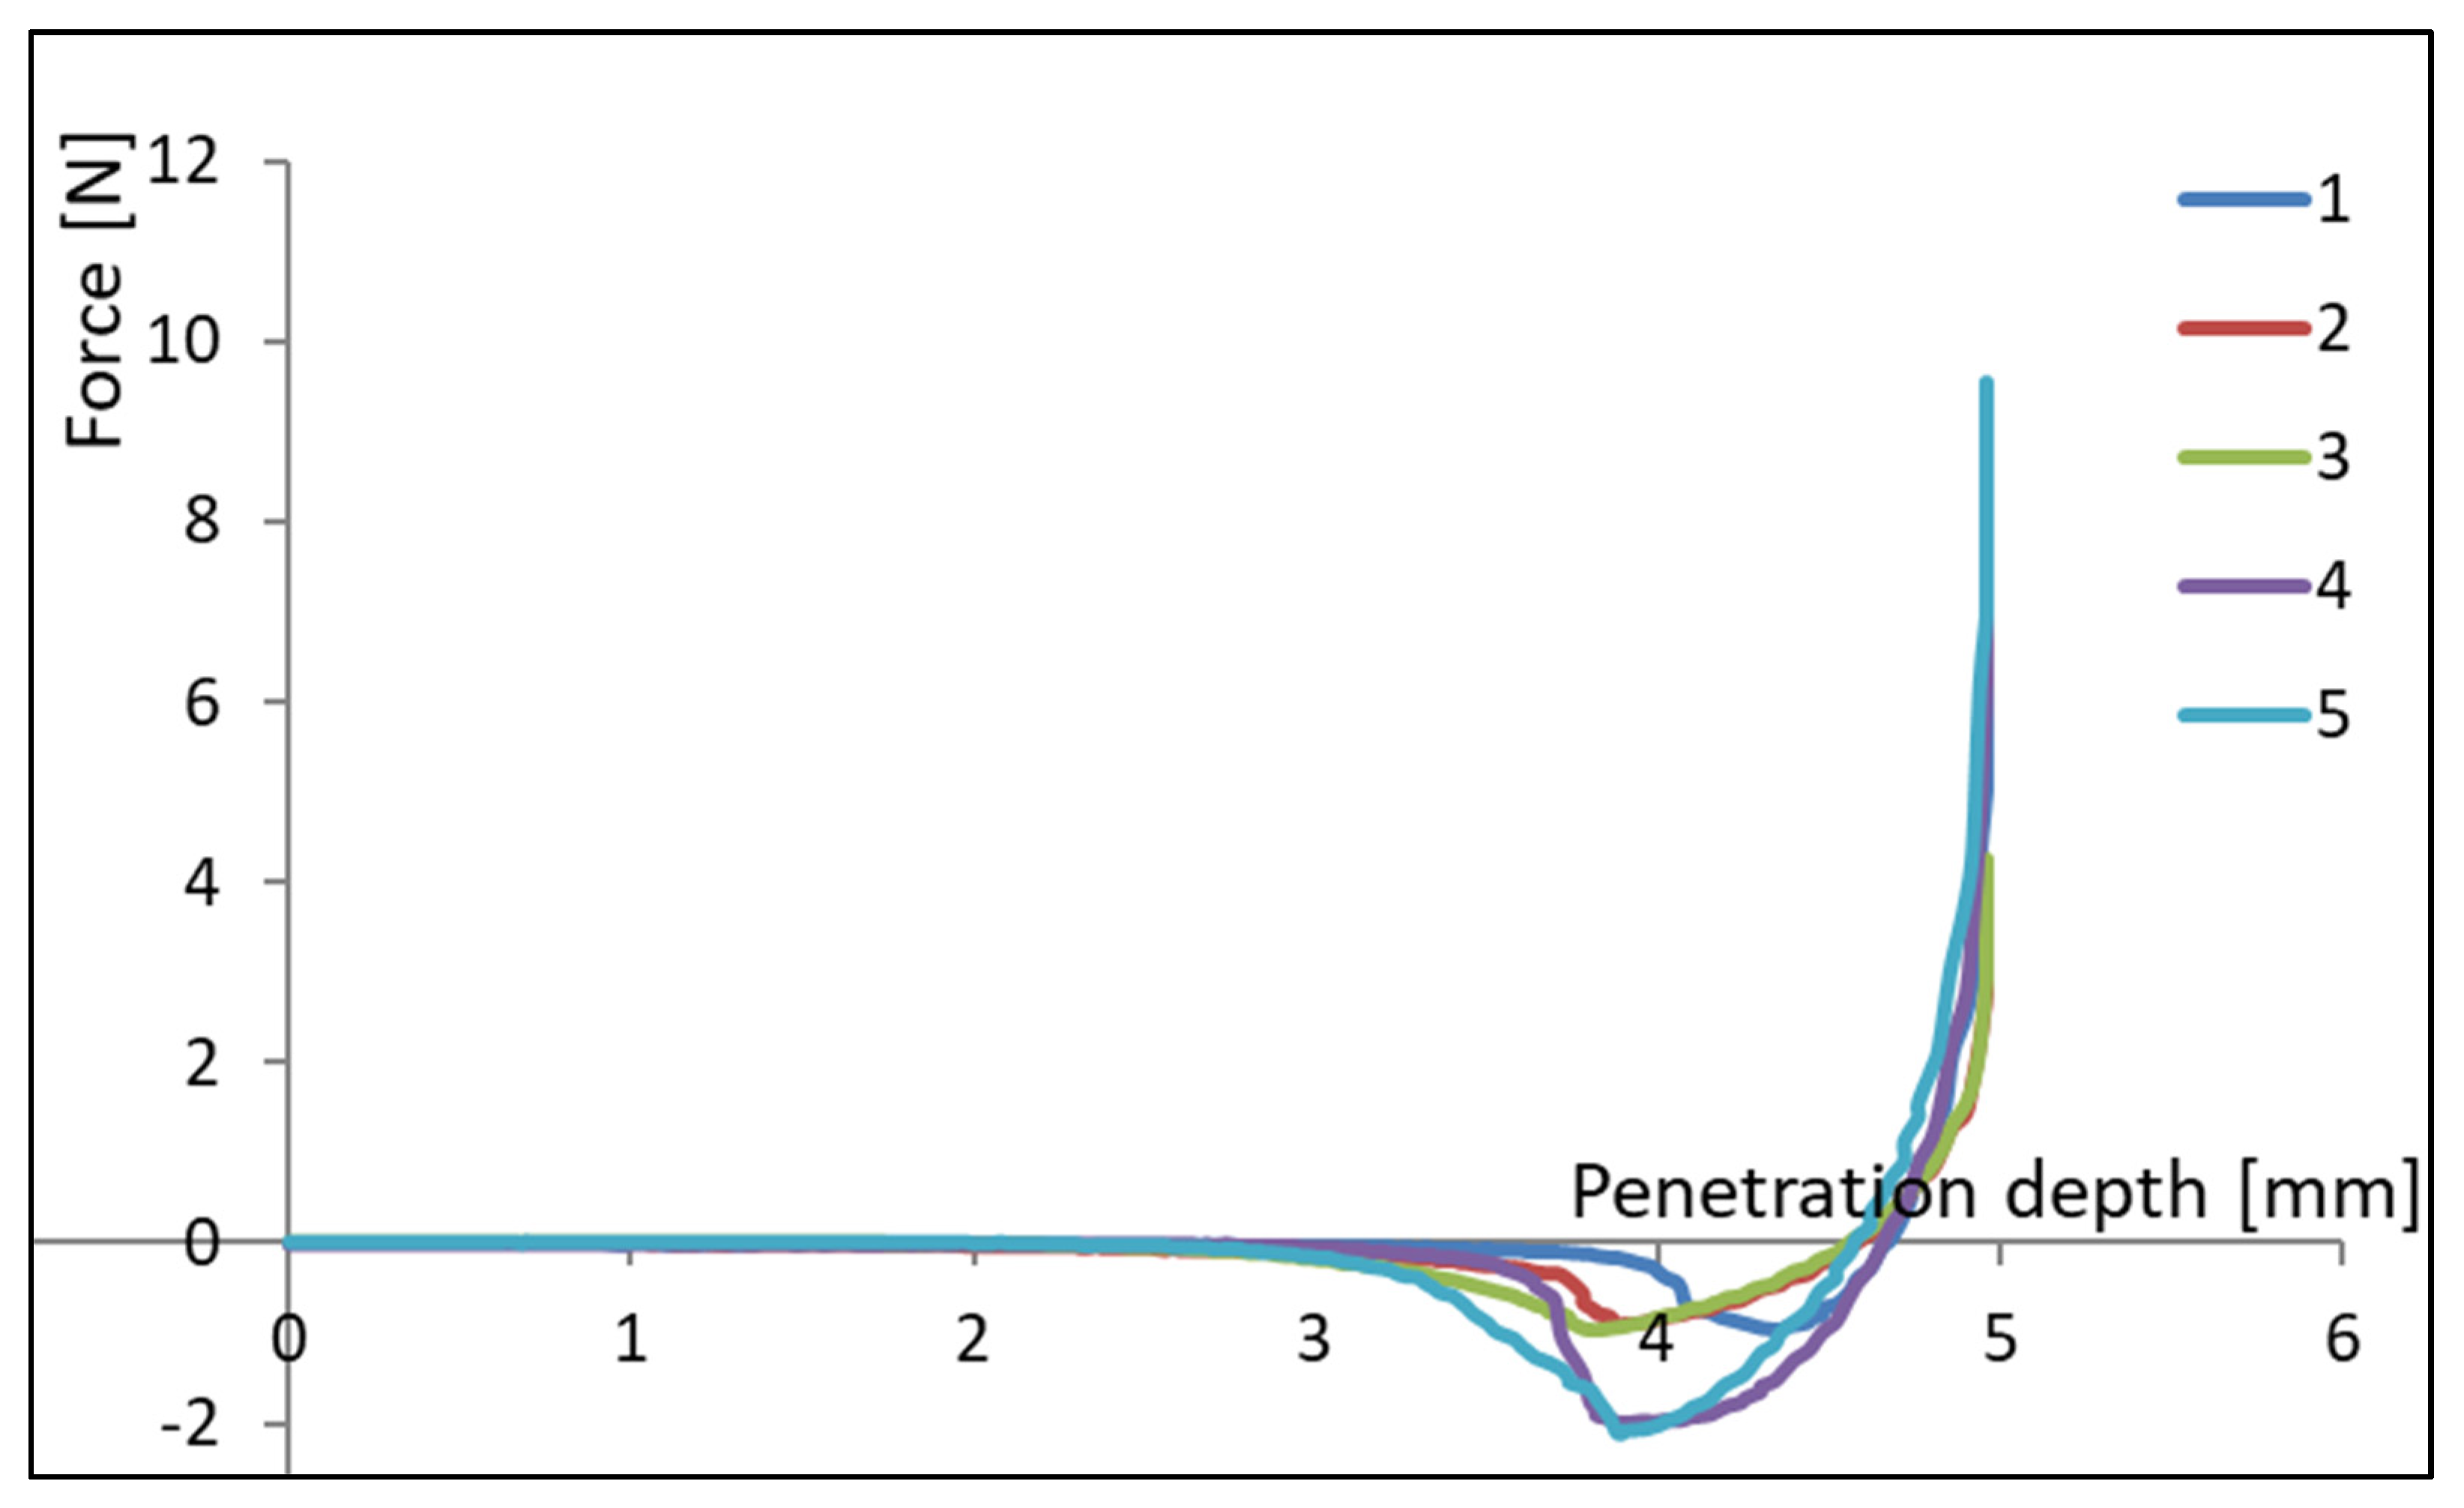
3.3. Textural Evaluation
4. Conclusions
Funding
Institutional Review Board Statement
Informed Consent Statement
Conflicts of Interest
References
- Lee, C.-L.; Liao, H.-L.; Lee, W.-C.; Hsu, C.-K.; Hsueh, F.-C.; Pan, J.-Q.; Chu, C.-H.; Wei, C.-T.; Chen, M.-J. Standards and labeling of milk fat and spread products in different countries. J. Food Drug Anal. 2018, 26, 469–480. [Google Scholar] [CrossRef] [PubMed] [Green Version]
- The Editors of Britannica Encyclopaedia. Butter; Encyclopedia Britannica: Scotland, UK, 2020; Available online: https://www.britannica.com/topic/butter (accessed on 25 January 2021).
- McClements, D.J. Food Emulsions: Principles, Practices, and Techniques, 3rd ed.; CRC Press: New York, NY, USA, 2015; pp. 1–26. [Google Scholar]
- Sikorski, Z.Z.; Kolakowska, A. Chemical and Functional Properties of Food Lipids; CRC Press: New York, NY, USA, 2010. [Google Scholar]
- Serdaroglu, M.; Öztürk, B.; Kara, A. An Overview of Food Emulsions: Description, Classification and Recent Potential Applications. Turk. J. Agric. Food Sci. Technol. 2015, 3, 430. [Google Scholar] [CrossRef] [Green Version]
- Jain, A.; Jain, R.; Jain, S. Basic Techniques in Biochemistry, Microbiology and Molecular Biology; Springer: New York, NY, USA, 2020; pp. 235–242. [Google Scholar]
- Queirós, M.S.; Grimaldi, R.; Gigante, M.L. Addition of olein from milk fat positively affects the firmness of butter. Food Res. Int. 2016, 84, 69–75. [Google Scholar] [CrossRef]
- Milovanovic, B.; Djekic, I.; Miocinovic, J.; Djordjevic, V.; Lorenzo, J.M.; Barba, F.J.; Mörlein, D.; Tomasevic, I. What Is the Color of Milk and Dairy Products and How Is It Measured? Foods 2020, 9, 1629. [Google Scholar] [CrossRef] [PubMed]
- Huppertz, T.; Kelly, A.L.; Fox, P.F. Milk lipids—Composition origin and properties. In Dairy Fats and Related Products; Tamime, A.Y., Ed.; Blackwell Publishing: Hoboken, NJ, USA, 2009; pp. 1–27. [Google Scholar]
- FAO; WHO. Standard for Butter CXS 279-1971, Formerly CODEX STAN A-1-1971; Adopted in 1971, Revised in 1999, Amended in 2003, 2006, 2010, 2018; FAO: Rome, Italy, 2018. [Google Scholar]
- European Union Council Regulation. (EC) No 1234/2007. Establishing a common organisation of agricultural markets and on specific provisions for certain agricultural products. Off. J. Eur. Commun. 2007, 299, 1–149. [Google Scholar]
- FAO; WHO. Standard for Fat Spreads and Blended Spreads; CODEX STAN 256; Food and Agriculture Organization of the United Nations: Rome, Italy, 2007. [Google Scholar]
- Grahl-Nielsen, O. Comment: Fatty acid signatures and classification trees: New tools for investigating the foraging ecology of seals. Can. J. Fish. Aquat. Sci. 1999, 56, 2219–2223. [Google Scholar] [CrossRef]
- Joensen, H.; Grahl-Nielsen, O. The redfish species Sebastes viviparus, Sebastes marinus and Sebastes mentella have different composition of their tissue fatty acids. Comp. Biochem. Physiol. Part B Biochem. Mol. Biol. 2001, 129, 73–85. [Google Scholar] [CrossRef]
- Vargas-Bello-Pérez, E.; Cancino-Padilla, N.; Geldsetzer-Mendoza, C.; Vyhmeister, S.; Morales, M.; Leskinen, H.; Romero, J.; Garnsworthy, P.; Ibáñez, R. Effect of Feeding Cows with Unsaturated Fatty Acid Sources on Milk Production, Milk Composition, Milk Fatty Acid Profile, and Physicochemical and Sensory Characteristics of Ice Cream. Animals 2019, 9, 568. [Google Scholar] [CrossRef] [Green Version]
- Blaško, J.; Kubinec, R.; Górová, R.; Fábry, I.; Lorenz, W.; Soják, L. Fatty acid composition of summer and winter cows’ milk and butter. J. Food Nutr. Res. 2010, 49, 169–177. [Google Scholar]
- Wright, A.J.; Scanlon, M.G.; Hartel, R.W.; Marangoni, A.G. Rheological properties of milkfat and butter. J. Food Sci. 2001, 66, 1056–1071. [Google Scholar] [CrossRef]
- Matuszek, T. Rheological Properties of Lipids. In Chemical and Functional Properties of Food Lipids; Sikorski, Z.Z., Kolakowska, A., Eds.; CRC Press: New York, NY, USA, 2010; pp. 61–79. [Google Scholar]
- ISO. Butter—Determination of Moisture, Non-Fat Solids and Fat Contents—Part 3: Calculation of Fat Content; ISO: Geneva, Switzerland, 2003; Volume 3727. [Google Scholar]
- ISO. Butter—Determination of Moisture, Non-Fat Solids and Fat Contents—Part 2: Determination of Non-Fat Solids Content; ISO: Geneva, Switzerland, 2003; Volume 3727. [Google Scholar]
- ISO. Butter—Determination of Moisture, Non-Fat Solids and Fat Contents—Part 1: Determination of Moisture Content; ISO: Geneva, Switzerland, 2003; Volume 3727. [Google Scholar]
- Zimbru, R.O.; Paduret, S.; Amariei, S. Effect of aeration on physicochemical, color and texture characteristics of confectionery foams. Ukr. Food J. 2020, 9, 99–110. [Google Scholar] [CrossRef]
- Zimbru, R.O.; Paduret, S.; Amariei, S. Physicochemical and color evaluation of confectionery mousses. Food Environ. Saf. J. 2020, 19, 228–236. [Google Scholar]
- ISO. Milk and Milk Products -Extraction Methods for Lipids and Liposoluble Compounds; ISO: Geneva, Switzerland, 2001; p. 14156. [Google Scholar]
- Kalinova, G.; Mladenova, D.; Mechkarova, P.; Daskalov, H. A modification of gas chromatography method for the determination of fatty acid composition of milk fat. Bulg. J. Agric. Sci. 2016, 22, 1014–1020. [Google Scholar]
- ISO. Milkfat—Preparation of Fatty Acid Methylesters; ISO: Geneva, Switzerland, 2002; p. 15884. [Google Scholar]
- Oroian, M.; Ursachi, F.; Dranca, F. Ultrasound-Assisted Extraction of Polyphenols from Crude Pollen. Antioxidants 2020, 9, 322. [Google Scholar] [CrossRef] [PubMed]
- Wee, M.S.M.; Goh, A.T.; Stieger, M.; Forde, C.G. Correlation of instrumental texture properties from textural profile analysis (TPA) with eating behaviours and macronutrient composition for a wide range of solid foods. Food Funct. 2018, 9, 5301–5312. [Google Scholar] [CrossRef]
- Liu, Y.X.; Cao, M.J.; Liu, G.M. Texture analyzers for food quality evaluation. In Evaluation Technologies for Food Quality; Zhong, J., Wang, X., Eds.; Woodhead Publishing: New York, NY, USA, 2019; pp. 441–463. [Google Scholar]
- Trinh, K.T.; Glasgow, S. On the texture profile analysis test. In Proceedings of the Quality of Life through Chemical Engineering, Wellington, New Zealand, 23–26 September 2012; p. 749. [Google Scholar]
- O’Callaghan, T.F.; Faulkner, H.; McAuliffe, S.; O’Sullivan, M.G.; Hennessy, D.; Dillon, P.; Kilcawley, K.N.; Stanton, C.; Ross, R.P. Quality characteristics, chemical composition, and sensory properties of butter from cows on pasture versus indoor feeding systems. J. Dairy Sci. 2016, 99, 9441–9460. [Google Scholar] [CrossRef] [PubMed] [Green Version]
- Kontkanen, H.; Rokka, S.; Kemppinen, A.; Miettinen, H.; Hellström, J.; Kruus, K.; Marnila, P.; Alatossava, T.; Korhonen, H. Enzymatic and physical modification of milk fat: A review. Int. Dairy J. 2011, 21, 3–13. [Google Scholar] [CrossRef]
- Bermúdez-Aguirre, D.; Mawson, R.; Versteeg, K.; Barbosa-Cánovas, G.V. Composition properties, physicochemical characteristics and shelf life of whole milk after thermal and thermo- sonication treatments. J. Food Qual. 2009, 32, 283–302. [Google Scholar] [CrossRef]
- Nyonje, W.A.; Schafleitner, R.; Abukutsa-Onyango, M.; Yang, R.Y.; Makokha, A.; Owino, W. Precision phenotyping and association between morphological traits and nutritional content in Vegetable Amaranth (Amaranthus spp.). J. Agric. Food Res. 2021, 5, 100165. [Google Scholar] [CrossRef]
- Quintanilla, P.; Beltrán, M.C.; Molina, A.; Escriche, I.; Molina, M.P. Characteristics of ripened Tronchón cheese from raw goat milk containing legally admissible amounts of antibiotics. J. Dairy Sci. 2019, 102, 2941–2953. [Google Scholar] [CrossRef] [PubMed] [Green Version]
- Rutkowska, J.; Adamska, A. Fatty Acid Composition of Butter Originated from North-Eastern Region of Poland. Pol. J. Food Nutr. Sci. 2011, 61, 187–193. [Google Scholar] [CrossRef] [Green Version]
- Ozcan, T.; Akpinar-Bayizit, A.; Yilmaz-Ersan, L.; Cetin, K.; Delikanli, B. Evaluation of Fatty Acid Profile of Trabzon Butter. Int. J. Chem. Eng. Appl. 2016, 7, 190–194. [Google Scholar] [CrossRef] [Green Version]
- Nair, M.K.M.; Joy, J.; Vasudevan, P.; Hinckley, L.; Hoagland, T.A.; Venkitanarayanan, K.S. Antibacterial Effect of Caprylic Acid and Monocaprylin on Major Bacterial Mastitis Pathogens. J. Dairy Sci. 2005, 88, 3488–3495. [Google Scholar] [CrossRef]
- Staniewski, B.; Ogrodowska, D.; Staniewska, K.; Kowalik, J. The effect of triacylglycerol and fatty acid composition on the rheological properties of butter. Int. Dairy J. 2021, 114, 104913. [Google Scholar] [CrossRef]
- Who, J.; Consultation, F.E. Diet, Nutrition and the Prevention of Chronic Diseases; WHO Technical Report Series; WHO: Geneva, Switzerland, 2002. [Google Scholar]
- Chen, J.; Liu, H. Nutritional indices for assessing fatty acids: A mini-review. Int. J. Mol. Sci. 2020, 21, 5695. [Google Scholar] [CrossRef] [PubMed]
- Burns-Whitmore, B.; Froyen, E.; Heskey, C.; Parker, T.; San Pablo, G. Alpha-Linolenic and Linoleic Fatty Acids in the Vegan Diet: Do They Require Dietary Reference Intake/Adequate Intake Special Consideration? Nutrients 2019, 11, 2365. [Google Scholar] [CrossRef] [PubMed] [Green Version]
- Ulbricht, T.L.V.; Southgate, D.A.T. Coronary heart disease: Seven dietary factors. Lancet 1991, 338, 985–992. [Google Scholar] [CrossRef]
- Yurchenko, S.; Sats, A.; Tatar, V.; Kaart, T.; Mootse, H.; Jõudu, I. Fatty acid profile of milk from Saanen and Swedish Landrace goats. Food Chem. 2018, 254, 326–332. [Google Scholar] [CrossRef]
- Kumar, M.; Kumari, P.; Trivedi, N.; Shukla, M.K.; Gupta, V.; Reddy, C.R.K.; Jha, B. Minerals, PUFAs and antioxidant properties of some tropical seaweeds from Saurashtra coast of India. J. Appl. Phycol. 2011, 23, 797–810. [Google Scholar] [CrossRef]
- Dellatorre, F.G.; Avaro, M.G.; Commendatore, M.G.; Arce, L.; de Vivar, M.E.D. The macroalgal ensemble of Golfo Nuevo (Patagonia, Argentina) as a potential source of valuable fatty acids for nutritional and nutraceutical purposes. Algal Res. 2020, 45, 101726. [Google Scholar] [CrossRef]
- Mir, N.A.; Tyagi, P.K.; Biswas, A.K.; Tyagi, P.K.; Mandal, A.B.; Kumar, F.; Sharma, D.; Biswas, A.; Verma, A.K. Inclusion of Flaxseed, Broken Rice, and Distillers Dried Grains with Solubles (DDGS) in Broiler Chicken Ration Alters the Fatty Acid Profile, Oxidative Stability, and Other Functional Properties of Meat. Eur. J. Lipid Sci. Technol. 2018, 120, 1700470. [Google Scholar] [CrossRef]
- Ghafari, H.; Rezaeian, M.; Sharifi, S.D.; Khadem, A.A.; Afzalzadeh, A. Effects of dietary sesame oil on growth performance and fatty acid composition of muscle and tail fat in fattening Chaal lambs. Anim. Feed Sci. Technol. 2016, 220, 216–225. [Google Scholar] [CrossRef]
- Vargas-Bello-Pérez, E.; Íñiguez González, G.; Fehrmann-Cartes, K.; Toro-Mujica, P.; Garnsworthy, P.C. Influence of fish oil alone or in combination with hydrogenated palm oil on sensory characteristics and fatty acid composition of bovine cheese. Anim. Feed Sci. Technol. 2015, 205, 60–68. [Google Scholar] [CrossRef]
- Bourne, M. Food Texture and Viscosity: Concept and Measurement, 2nd ed.; Academic Press Elsevier: New York, NY, USA, 2002; pp. 59–106. [Google Scholar]
- ISO. Sensory Analysis—Methodology—Texture Profile; ISO: Geneva, Switzerland, 2020; p. 11036. [Google Scholar]
- Hurtaud, C.; Peyraud, J.L. Effects of Feeding Camelina (Seeds or Meal) on Milk Fatty Acid Composition and Butter Spreadability. J. Dairy Sci. 2007, 90, 5134–5145. [Google Scholar] [CrossRef]
- Beitz, D.C. Texture of butter from cows with different milk fatty acid compositions. J. Dairy Sci. 2003, 86, 3122–3127. [Google Scholar]

| Sample | Fat (%) | Moisture (%) | Non-Fat Solids (%) |
|---|---|---|---|
| 1 | 43.95 (0.34) | 55.14 (0.68) | 0.78 (0.14) |
| 2 | 55.42 (0.82) | 43.52 (0.87) | 0.72 (0.29) |
| 3 | 65.72 (0.22) | 33.26 (0.56) | 0.98 (0.31) |
| 4 | 77.12 (0.33) | 21.87 (0.41) | 0.91 (0.23) |
| 5 | 84.60 (0.92) | 12.58 (0.48) | 1.42 (0.12) |
| Sample | Outside Color Parameters—Mean (SD) | ||||||
|---|---|---|---|---|---|---|---|
| L* | a * | b* | C | h0 | YI | WI | |
| 1 | 93.72 bB (0.36) | −7.11 cF (0.04) | 19.25 eG (0.07) | 20.52 eG (0.09) | 110.28 aA (0.05) | 29.34 eH (0.01) | 78.53 aA (0.02) |
| 2 | 91.70 cC (0.65) | −6.68 bD (0.03) | 25.78 cD (0.44) | 26.63 cD (0.42) | 104.53 dF (0.31) | 40.16 cE (0.40) | 72.09 cE (0.21) |
| 3 | 94.85 aA (0.17) | −6.62 abCD (0.02) | 24.44 dE (0.050 | 25.32 dE (0.04) | 105.16 bD (0.08) | 36.80 dF (0.15) | 74.16 bD (0.08) |
| 4 | 90.53 dD (0.06) | −7.29 dE (0.08) | 27.44 bC (0.92) | 28.39 bC (0.91) | 104.88 cE (0.31) | 43.30 bC (1.49) | 70.06 dG (0.89) |
| 5 | 92.19 cC (0.45) | −6.57 aBC (0.09) | 33.05 aA (0.17) | 33.69 aA (0.18) | 101.24 eG (0.10) | 51.21 aA (0.01) | 65.40 eI (0.07) |
| F-ratio | 109.60 | 148.88 | 683.60 | 645.47 | 1440.10 | 807.29 | 834.36 |
| p-value | p < 0.001 | p < 0.001 | p < 0.001 | p < 0.001 | p < 0.001 | p < 0.001 | p < 0.001 |
| inside color parameters—mean (SD) | |||||||
| 1 | 90.46 dD (1.36) | −6.48 aAB (0.10) | 18.84 eG (0.75) | 19.92 eH (0.74) | 109.00 aB (0.41) | 29.74 eH (0.73) | 77.88 aB (0.08) |
| 2 | 94.87 aA (0.39) | −6.94 cE (0.01) | 22.89 dF (0.29) | 23.91 dF (0.28) | 106.86 bC (0.20) | 34.47 dG (0.59) | 75.53 bC (0.36) |
| 3 | 93.53 bB (1.55) | −6.61 bCD (0.14) | 24.36 cE (0.33) | 25.24 cE (0.36) | 105.19 cD (0.12) | 37.20 cF (0.10) | 73.91 cD (0.03) |
| 4 | 91.74 cC (0.08) | −7.36 dE (0.04) | 27.20 bC (0.02) | 28.18 bC (0.01) | 105.13 cDE (0.09) | 42.36 bD (0.07) | 70.63 dF (0.03) |
| 5 | 92.30 cC (0.12) | −6.41 aA (0.02) | 31.81 aB (0.26) | 32.44 aB (0.25) | 101.39 dG (0.14) | 49.23 aB (0.48) | 66.65 eH (0.27) |
| F-ratio | 19.17 | 127.76 | 841.83 | 792.73 | 907.51 | 1483.95 | 2667.73 |
| p-value | p < 0.001 | p < 0.001 | p < 0.001 | p < 0.001 | p < 0.001 | p < 0.001 | p < 0.001 |
| Fout-ins-ratio | 5.04 | 123.16 | 676.81 | 639.56 | 1026.97 | 921.27 | 1084.46 |
| pout-ins-value | p < 0.01 | p < 0.001 | p < 0.001 | p < 0.001 | p < 0.001 | p < 0.001 | p < 0.001 |
| Sample | Outside | Inside | |||||||||
|---|---|---|---|---|---|---|---|---|---|---|---|
| 1 | 2 | 3 | 4 | 5 | 1 | 2 | 3 | 4 | 5 | ||
| 1 | outside | - | 7.23 | 5.71 | 9.16 | 13.89 | 3.35 | 4.19 | 5.53 | 8.58 | 13.05 |
| 2 | - | 3.43 | 2.11 | 7.28 | 6.56 | 4.30 | 2.32 | 1.57 | 6.06 | ||
| 3 | - | 5.30 | 9.01 | 6.73 | 1.58 | 1.32 | 4.23 | 7.80 | |||
| 4 | - | 5.88 | 8.14 | 6.29 | 4.35 | 1.23 | 4.79 | ||||
| 5 | - | 14.31 | 10.51 | 8.79 | 5.91 | 1.25 | |||||
| 1 | inside | - | 5.67 | 5.88 | 8.01 | 12.60 | |||||
| 2 | - | 2.01 | 5.34 | 9.29 | |||||||
| 3 | - | 3.44 | 7.55 | ||||||||
| 4 | - | 4.73 | |||||||||
| 5 | - | ||||||||||
| Fatty Acid Concentration (%) | ||||||||
|---|---|---|---|---|---|---|---|---|
| Name | Abbreviation | RT ± 0.5 min | Min | Max | Mean | SD | Total | |
| Short and middle-chain saturated | Butyric | C4:0 | 6.078 | 0.831 | 1.589 | 1.340 | 0.131 | 16.782 |
| Caproic | C6:0 | 7.910 | 1.657 | 3.183 | 2.600 | 0.609 | ||
| Caprylic | C8:0 | 10.824 | 1.301 | 2.367 | 2.037 | 0.424 | ||
| Capric | C10:0 | 14.251 | 3.206 | 5.512 | 4.772 | 0.950 | ||
| Lauric | C12:0 | 17.639 | 3.703 | 7.412 | 5.832 | 1.350 | ||
| Tridecanoic | C13:0 | 19.241 | 0.147 | 0.239 | 0.201 | 0.036 | ||
| Long-chain saturated | Myristic | C14:0 | 20.488 | 3.020 | 4.956 | 4.022 | 0.780 | 52.338 |
| Pentadecanoic | C15:0 | 22.310 | 1.389 | 1.967 | 1.705 | 0.254 | ||
| Palmitic | C16:0 | 23.961 | 29.761 | 34.767 | 32.592 | 1.888 | ||
| Heptadecanoic | C17:0 | 25.773 | 0.419 | 1.078 | 0.770 | 0.272 | ||
| Stearic | C18:0 | 27.919 | 12.322 | 14.198 | 13.249 | 0.708 | ||
| Monounsaturated | Myristoleic | C14:1 | 21.427 | 1.318 | 1.877 | 1.659 | 0.217 | 25.482 |
| cis-10-pentadecenoic | C15:1 | 23.002 | 0.072 | 1.386 | 0.499 | 0.146 | ||
| Palmitoleic | C16:1 | 24.518 | 2.178 | 2.861 | 2.593 | 0.283 | ||
| cis-10 Heptadecanoic | C17:1 | 26.438 | 0.000 | 0.094 | 0.040 | 0.009 | ||
| Oleic | C18:1cis (n9) | 28.563 | 18.890 | 23.494 | 20.691 | 1.872 | ||
| Polyunsaturated | Linoleic | C18:2 cis (n6) | 29.854 | 2.959 | 7.629 | 4.661 | 1.875 | 5.301 |
| Linolenic | C18:3 (n3) | 31.840 | 0.000 | 1.008 | 0.640 | 0.050 | ||
| Name | Abbreviation | Butter Samples | Anova | ||||
|---|---|---|---|---|---|---|---|
| 1 | 2 | 3 | 4 | 5 | |||
| Butyric | C4:0 | 1.528 c | 1.954 bc | 2.309 abc | 2.736 ab | 3.091 a | ** |
| Caproic | C6:0 | 2.963 c | 3.790 bc | 4.479 abc | 5.306 ab | 5.995 a | * |
| Caprylic | C8:0 | 2.313 d | 2.959 cd | 3.497 bc | 4.143 ab | 4.681 a | ** |
| Capric | C10:0 | 5.430 d | 6.946 cd | 8.209 bc | 9.724 ab | 10.987 a | ** |
| Lauric | C12:0 | 6.613 d | 8.459 cd | 9.997 bc | 11.843 ab | 13.381 a | ** |
| Tridecanoic | C13:0 | 0.289 cd | 0.226 d | 0.342 bc | 0.405 ab | 0.458 a | ** |
| Short- and middle-chain saturated | 19.136 | 24.334 | 28.833 | 34.157 | 38.593 | ** | |
| Myristic | C14:0 | 4.590 c | 5.871 b | 6.938 b | 8.219 a | 9.287 a | *** |
| Pentadecanoic | C15:0 | 1.926 d | 2.464 cd | 2.912 bc | 3.449 ab | 3.897 a | *** |
| Palmitic | C16:0 | 36.917 c | 47.219 b | 55.804 b | 66.107 a | 74.692 a | *** |
| Heptadecanoic | C17:0 | 0.993 a | 0.707 a | 1.230 a | 1.050 a | 1.663 a | NS |
| Stearic | C18:0 | 14.984 c | 19.166 b | 22.651 b | 26.833 a | 30.317 a | *** |
| Long-chain saturated | 59.41 | 75.427 | 89.535 | 105.658 | 119.856 | ** | |
| Myristoleic | C14:1 | 1.892 d | 2.420 cd | 2.861 bc | 3.389 ab | 3.829 a | *** |
| cis-10-pentadecenoic | C15:1 | 0.544 a | 0.695 a | 0.822 a | 0.973 a | 1.100 a | NS |
| Palmitoleic | C16:1 | 2.945 d | 3.767 cd | 4.451 bc | 5.273 ab | 5.958 a | *** |
| cis-10 Heptadecanoic | C17:1 | 0.043 a | 0.055 a | 0.065 a | 0.077 a | 0.087 a | NS |
| Oleic | C18:1cis (n9) | 23.255 c | 29.745 b | 35.153 b | 41.643 a | 47.051 a | *** |
| Monounsaturated | 28.679 | 36.682 | 43.352 | 51.355 | 58.025 | ** | |
| Linoleic | C18:2 cis (n6) | 5.180 a | 6.625 a | 7.830 a | 7.239 a | 8.352 a | NS |
| Linolenic | C18:3 (n3) | 0.730 a | 0.934 a | 1.104 a | 1.143 a | 1.306 a | NS |
| Polyunsaturated | 5.910 | 7.560 | 8.934 | 8.382 | 9.658 | NS | |
| Probe | PS10 | PC120 | PS5 | |||
|---|---|---|---|---|---|---|
| Sample | Viscosity | Adhesiveness | Viscosity | Adhesiveness | Viscosity | Adhesiveness |
| 1 | 0.96 (0.02) | 6.364 (0.49) | 1.78 (0.11) | 18.19 (0.68) | 0.24 (0.01) | 0.286 (0.08) |
| 2 | 0.92 (0.06) | 7.98 (0.25) | 1.28 (0.07) | 10.5 (0.26) | 0.28 (0.01) | 0.316 (0.08) |
| 3 | 0.98 (0.04) | 8.38 (0.21) | 1.18 (0.03) | 6.73 (0.19) | 0.44 (0.02) | 0.462 (0.10) |
| 4 | 1.98 (0.10) | 14.31 (0.39) | 1.64 (0.14) | 17.71 (0.67) | 0.46 (0.01) | 0.772 (0.18) |
| 5 | 2.12 (0.07) | 15.68 (0.26) | 1.74 (0.05) | 14.61 (0.72) | 0.48 (0.01) | 1.197 (0.16) |
Publisher’s Note: MDPI stays neutral with regard to jurisdictional claims in published maps and institutional affiliations. |
© 2021 by the author. Licensee MDPI, Basel, Switzerland. This article is an open access article distributed under the terms and conditions of the Creative Commons Attribution (CC BY) license (https://creativecommons.org/licenses/by/4.0/).
Share and Cite
Pădureţ, S. The Effect of Fat Content and Fatty Acids Composition on Color and Textural Properties of Butter. Molecules 2021, 26, 4565. https://doi.org/10.3390/molecules26154565
Pădureţ S. The Effect of Fat Content and Fatty Acids Composition on Color and Textural Properties of Butter. Molecules. 2021; 26(15):4565. https://doi.org/10.3390/molecules26154565
Chicago/Turabian StylePădureţ, Sergiu. 2021. "The Effect of Fat Content and Fatty Acids Composition on Color and Textural Properties of Butter" Molecules 26, no. 15: 4565. https://doi.org/10.3390/molecules26154565
APA StylePădureţ, S. (2021). The Effect of Fat Content and Fatty Acids Composition on Color and Textural Properties of Butter. Molecules, 26(15), 4565. https://doi.org/10.3390/molecules26154565