Article

Anharmonic DFT Study of Near-Infrared Spectra of Caffeine: Vibrational Analysis of the Second Overtones and Ternary Combinations

1
CCB—Center for Chemistry and Biomedicine, Institute of Analytical Chemistry and Radiochemistry, Leopold-Franzens University, Innrain 80/82, 6020 Innsbruck, Austria
2
School of Biological and Environmental Sciences, Kwansei Gakuin University, Sanda 669-1337, Hyogo, Japan
3
Toyota Physical and Chemical Research Institute, Yokomichi, Nagakute 480-1192, Aichi, Japan
*
Author to whom correspondence should be addressed.
Molecules 2021, 26(17), 5212; https://doi.org/10.3390/molecules26175212
Submission received: 28 July 2021 / Revised: 23 August 2021 / Accepted: 24 August 2021 / Published: 27 August 2021
(This article belongs to the Special Issue Perspectives in Near Infrared Spectroscopy and Related Techniques)

Abstract

:
Anharmonic quantum chemical calculations were employed to simulate and interpret a near-infrared (NIR) spectrum of caffeine. First and second overtones, as well as binary and ternary combination bands, were obtained, accurately reproducing the lineshape of the experimental spectrum in the region of 10,000–4000 cm−1 (1000–2500 nm). The calculations enabled performing a detailed analysis of NIR spectra of caffeine, including weak bands due to the second overtones and ternary combinations. A highly convoluted nature of NIR spectrum of caffeine was unveiled, with numerous overlapping bands found beneath the observed spectral lineshape. To properly reflect that intrinsic complexity, the band assignments were provided in the form of heat maps presenting the contributions to the NIR spectrum from various kinds of vibrational transitions. These contributions were also quantitatively assessed in terms of the integral intensities. It was found that the combination bands provide the decisively dominant contributions to the NIR spectrum of caffeine. The first overtones gain significant importance between 6500–5500 cm−1, while the second overtones are meaningful in the higher wavenumber regions, particularly in the 10,000–7000 cm−1 region. The obtained detailed band assignments enabled deep interpretation of the absorption regions of caffeine identified in the literature as meaningful for analytical applications of NIR spectroscopy focused on quantitative analysis of caffeine content in drugs and natural products.

1. Introduction

Near-infrared (NIR) spectroscopy is a potent and valued physicochemical technique of analysis [1,2,3]. This technique is primarily recognized in the applications to analytical chemistry [4] as a rapid, cost-efficient, simple, and non-destructive technique with nearly no sample preparation required, which appears to be a very attractive and useful alternative tool for qualitative and quantitative analyses in the agriculture [5,6], food [7,8], chemical [9,10], and pharmaceutical industries [11]. However, it is also met with an increasing importance in bioscience [12,13], medicine [14,15], and various applications related to hyperspectral imaging as well [16]. This method appears also useful in physical chemistry by delivering unique information on the molecular structure, hydrogen bonding, interactions, and dynamics [17,18,19].
The intrinsic complexity of NIR spectra, resulting from a large number of overlapping bands that create a strongly convoluted lineshape [2], makes them difficult for detailed interpretation, which remains a hindrance in a number of applications [20]. Extensive studies established characteristic vibrational frequency ranges and comprehensive band assignment tables for MIR or Raman spectra [21,22]. In contrast, the analogous information available for NIR spectroscopy remains fairly shallow [23]. Because of the anharmonicity, it is difficult to yield an exhaustive interpretation of NIR spectra by means of classical methods [24]. In recent years, significant progress in theoretical methods of calculation of anharmonic spectra was observed [25,26,27]. It was demonstrated that very accurate reproduction of NIR spectra of small- to medium-sized molecules in liquid phase and in solutions is possible [28,29,30], including very fine spectral details resulting from the conformational populations [31,32,33]. NIR spectra simulations were also performed for biologically-relevant molecules, e.g., short- [34,35], medium- [36], and long-chain fatty acids [37], amino acids [38,39] or nucleobases [40]. The theoretical calculations of the spectra were used to directly aid analytical applications of NIR spectroscopy, where the interpretation of the multivariate regression models and understanding of the instrumental difference between various benchtop and miniaturized NIR spectrometers has been made available this way. Relevant examples involved phytopharmaceutical compounds such rosmarinic acid [41], thymol [42], as well as a number of others compounds in scope of a given analytical application [43,44,45]. Furthermore, focused studies on the anharmonicity present in MIR and NIR spectra manifested in the band shifts, intensity variations, and the contributions of the specific types of vibrational transitions to the total intensity in the respective spectral regions [46,47].
The primary focus in the theoretical studies of NIR spectra was directed at the first overtones and binary combinations, as these bands are the most meaningful for shaping NIR spectra and are easier to calculate as well. Recent investigation of NIR and MIR spectra of melamine demonstrated that the simulation of NIR bands corresponding to three quanta excitations, i.e., second overtones and ternary combinations, offer an improved interpretation of the spectra [48]. However, limited attention has been given so far to the short-wavelength fragment of NIR spectra, i.e., above 7000 cm−1, which is solely populated by these higher order bands. That region encapsulates rich information on the sample and thus is often highly useful in practical applications, even more so given the popularity of Vis/SW-NIR sensors [49].
In this work we took on the aim to analyze in detail the NIR spectrum of caffeine (1,3,7-trimethylpurine-2,6-dione, C8H10N4O2), including the first and second overtones, as well as binary and ternary combination bands in a broad spectral region between 10,000–4000 cm−1. Caffeine serves a useful and interesting subject for such study as it reconciles interesting molecular structure for a fundamental study with practical importance in applications [50,51]. With respect to the first aspect, the presence of a purine ring and C = O, C-H, and N-H functional groups in the molecule of caffeine leads to the appearance of highly characteristic NIR absorption peaks. Next, other than coffee [52,53], caffeine occurs naturally in many kinds of plants, and is an important ingredient in many foodstuff and beverages, e.g., in tea [54,55], mate [56,57], cocoa [58], and beverages [59]. Caffeine is an important constituent of many drugs as well, given its broad scope of therapeutic properties [60,61,62]. Following its broad significance for agro-food and pharmaceutical sectors, rich literature on the chemical analysis of the samples containing caffeine analysis is available, e.g., using UV-VIS [63,64], HPLC [65], or NMR [66] modalities. Importantly, among the vibrational spectroscopic methods including MIR [67] and Raman [68,69] techniques, NIR spectroscopy is a particularly potent tool for the assessment of coffee quality characteristics [70,71,72,73]. In the analytical NIR spectroscopic studies, the characteristic absorption regions of caffeine have been discussed in relation to their accessibility resulting from overlapping with the regions where the signals from other constituents appear [51,74,75]. However, only limited anticipatory information on the physical origins of these absorption regions have been available so far [51]. One of the aims of the present investigation is to provide practical impact as well, by providing the interpretation of the wavenumber regions that have been found in the literature to be the most meaningful for the multivariate calibration models constructed for analysis of caffeine in various cases.
Finally, the second overtones and ternary combination bands provide a very useful source of structural information in physicochemical studies. The second overtones deliver important information on the anharmonicity constant, supplementing the one available from the analysis of the first overtones, yielding useful insights into intermolecular interactions and solvent effect [76,77]. The second overtone peaks are better separated and also appear clearly in the upper NIR region, free from the strong absorption from other bands. Further, the ternary combinations are particularly numerous types of transitions expressed in the spectra, as the number of the possible co-excitations is far greater than in the lower order combinations [78]. However, for this reason and the fact that these are very weak bands, their analysis is extremely difficult and, to our best knowledge, only few of our previous studies attempted to extract structural information from ternary combinations [33,48,79,80,81].

2. Results and Discussion

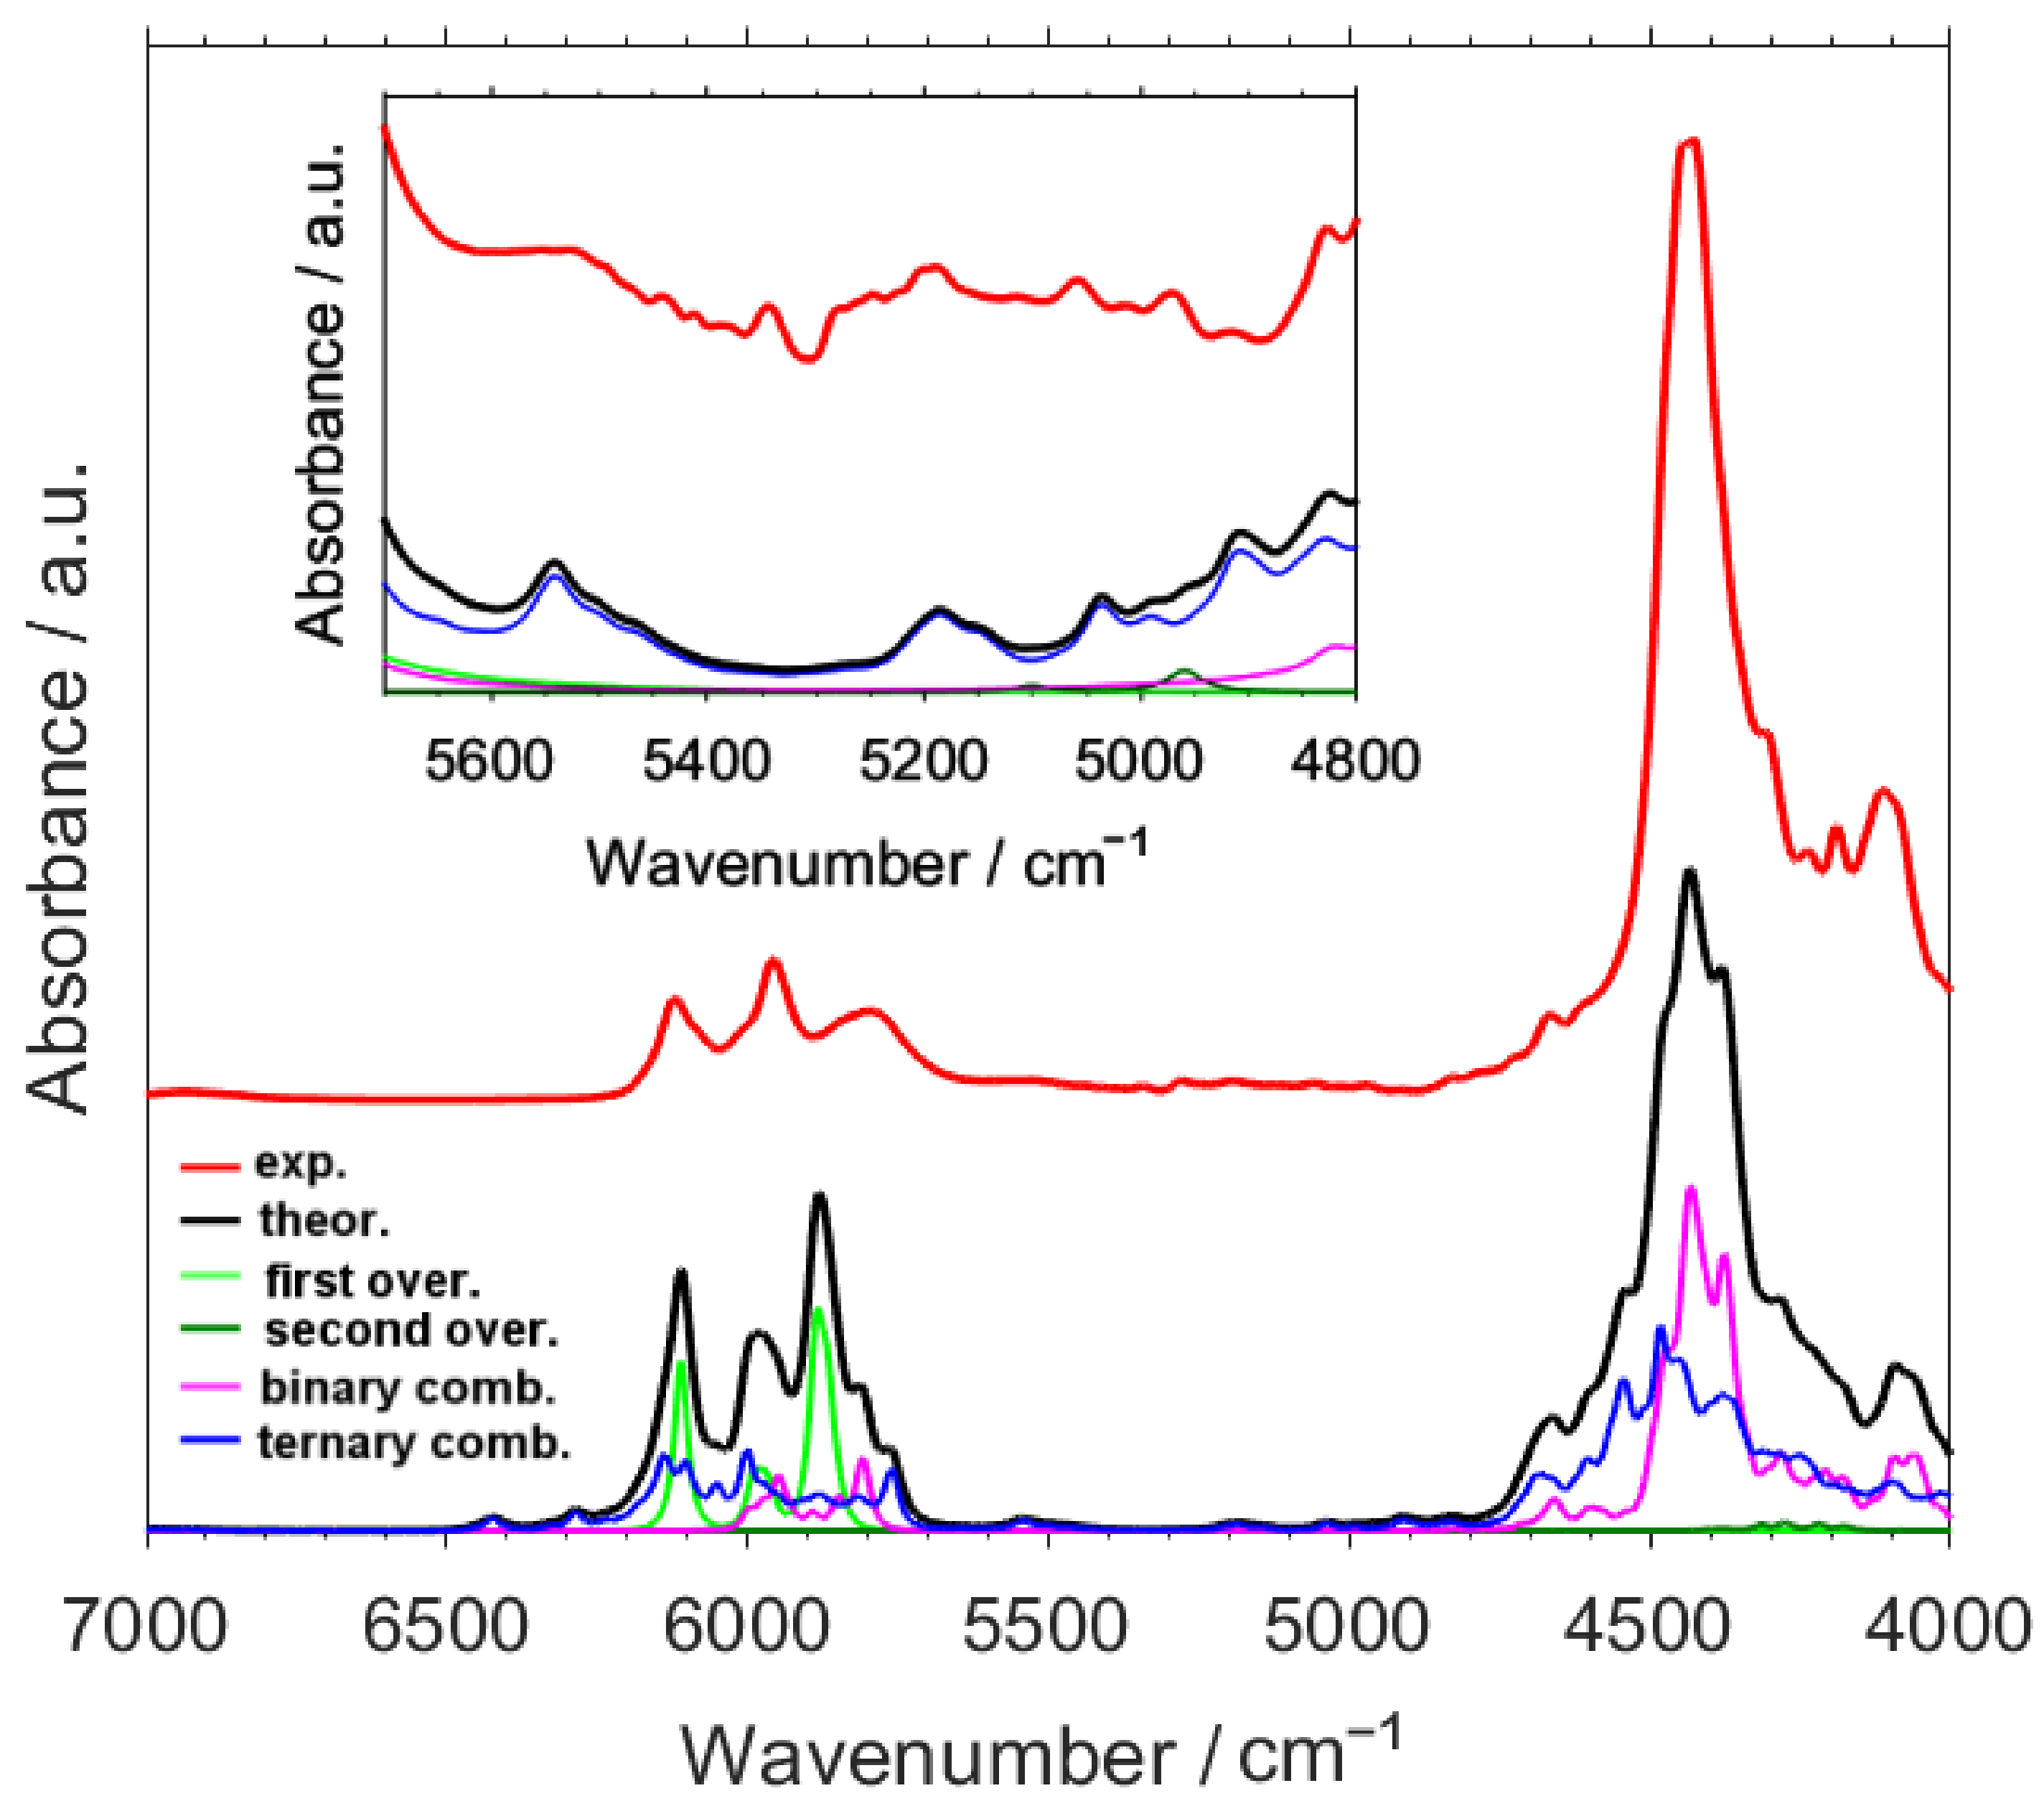
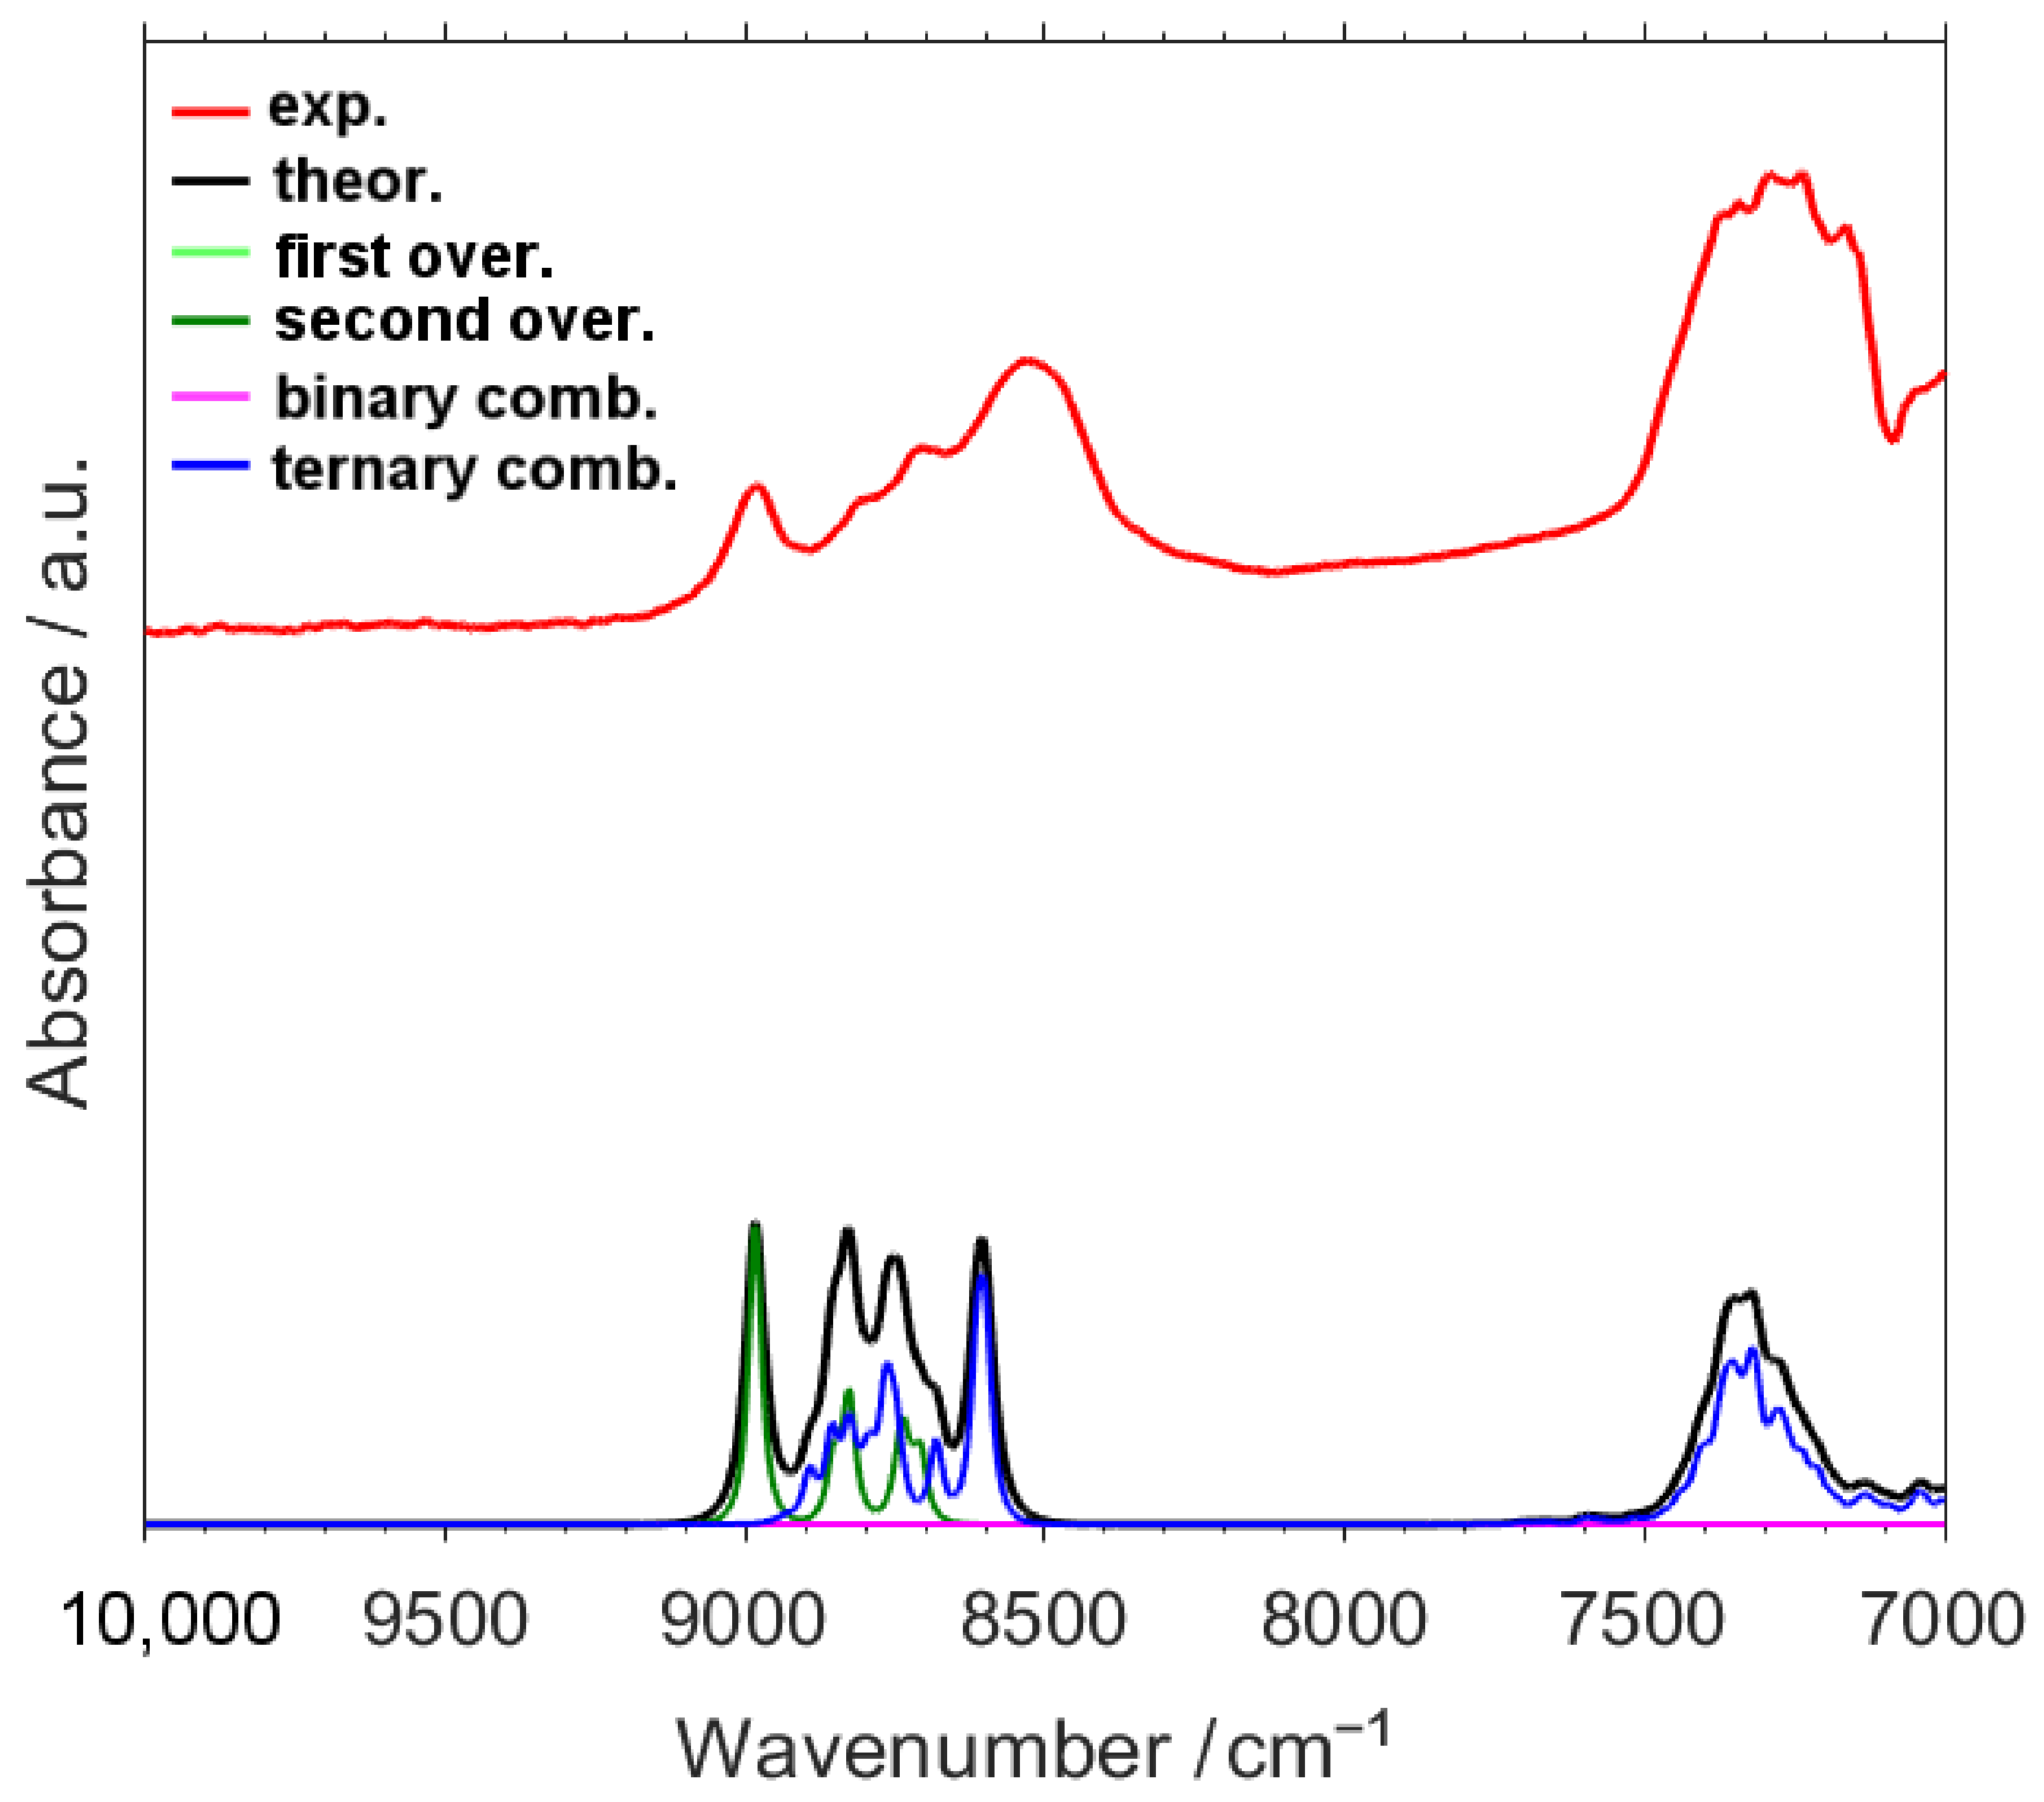
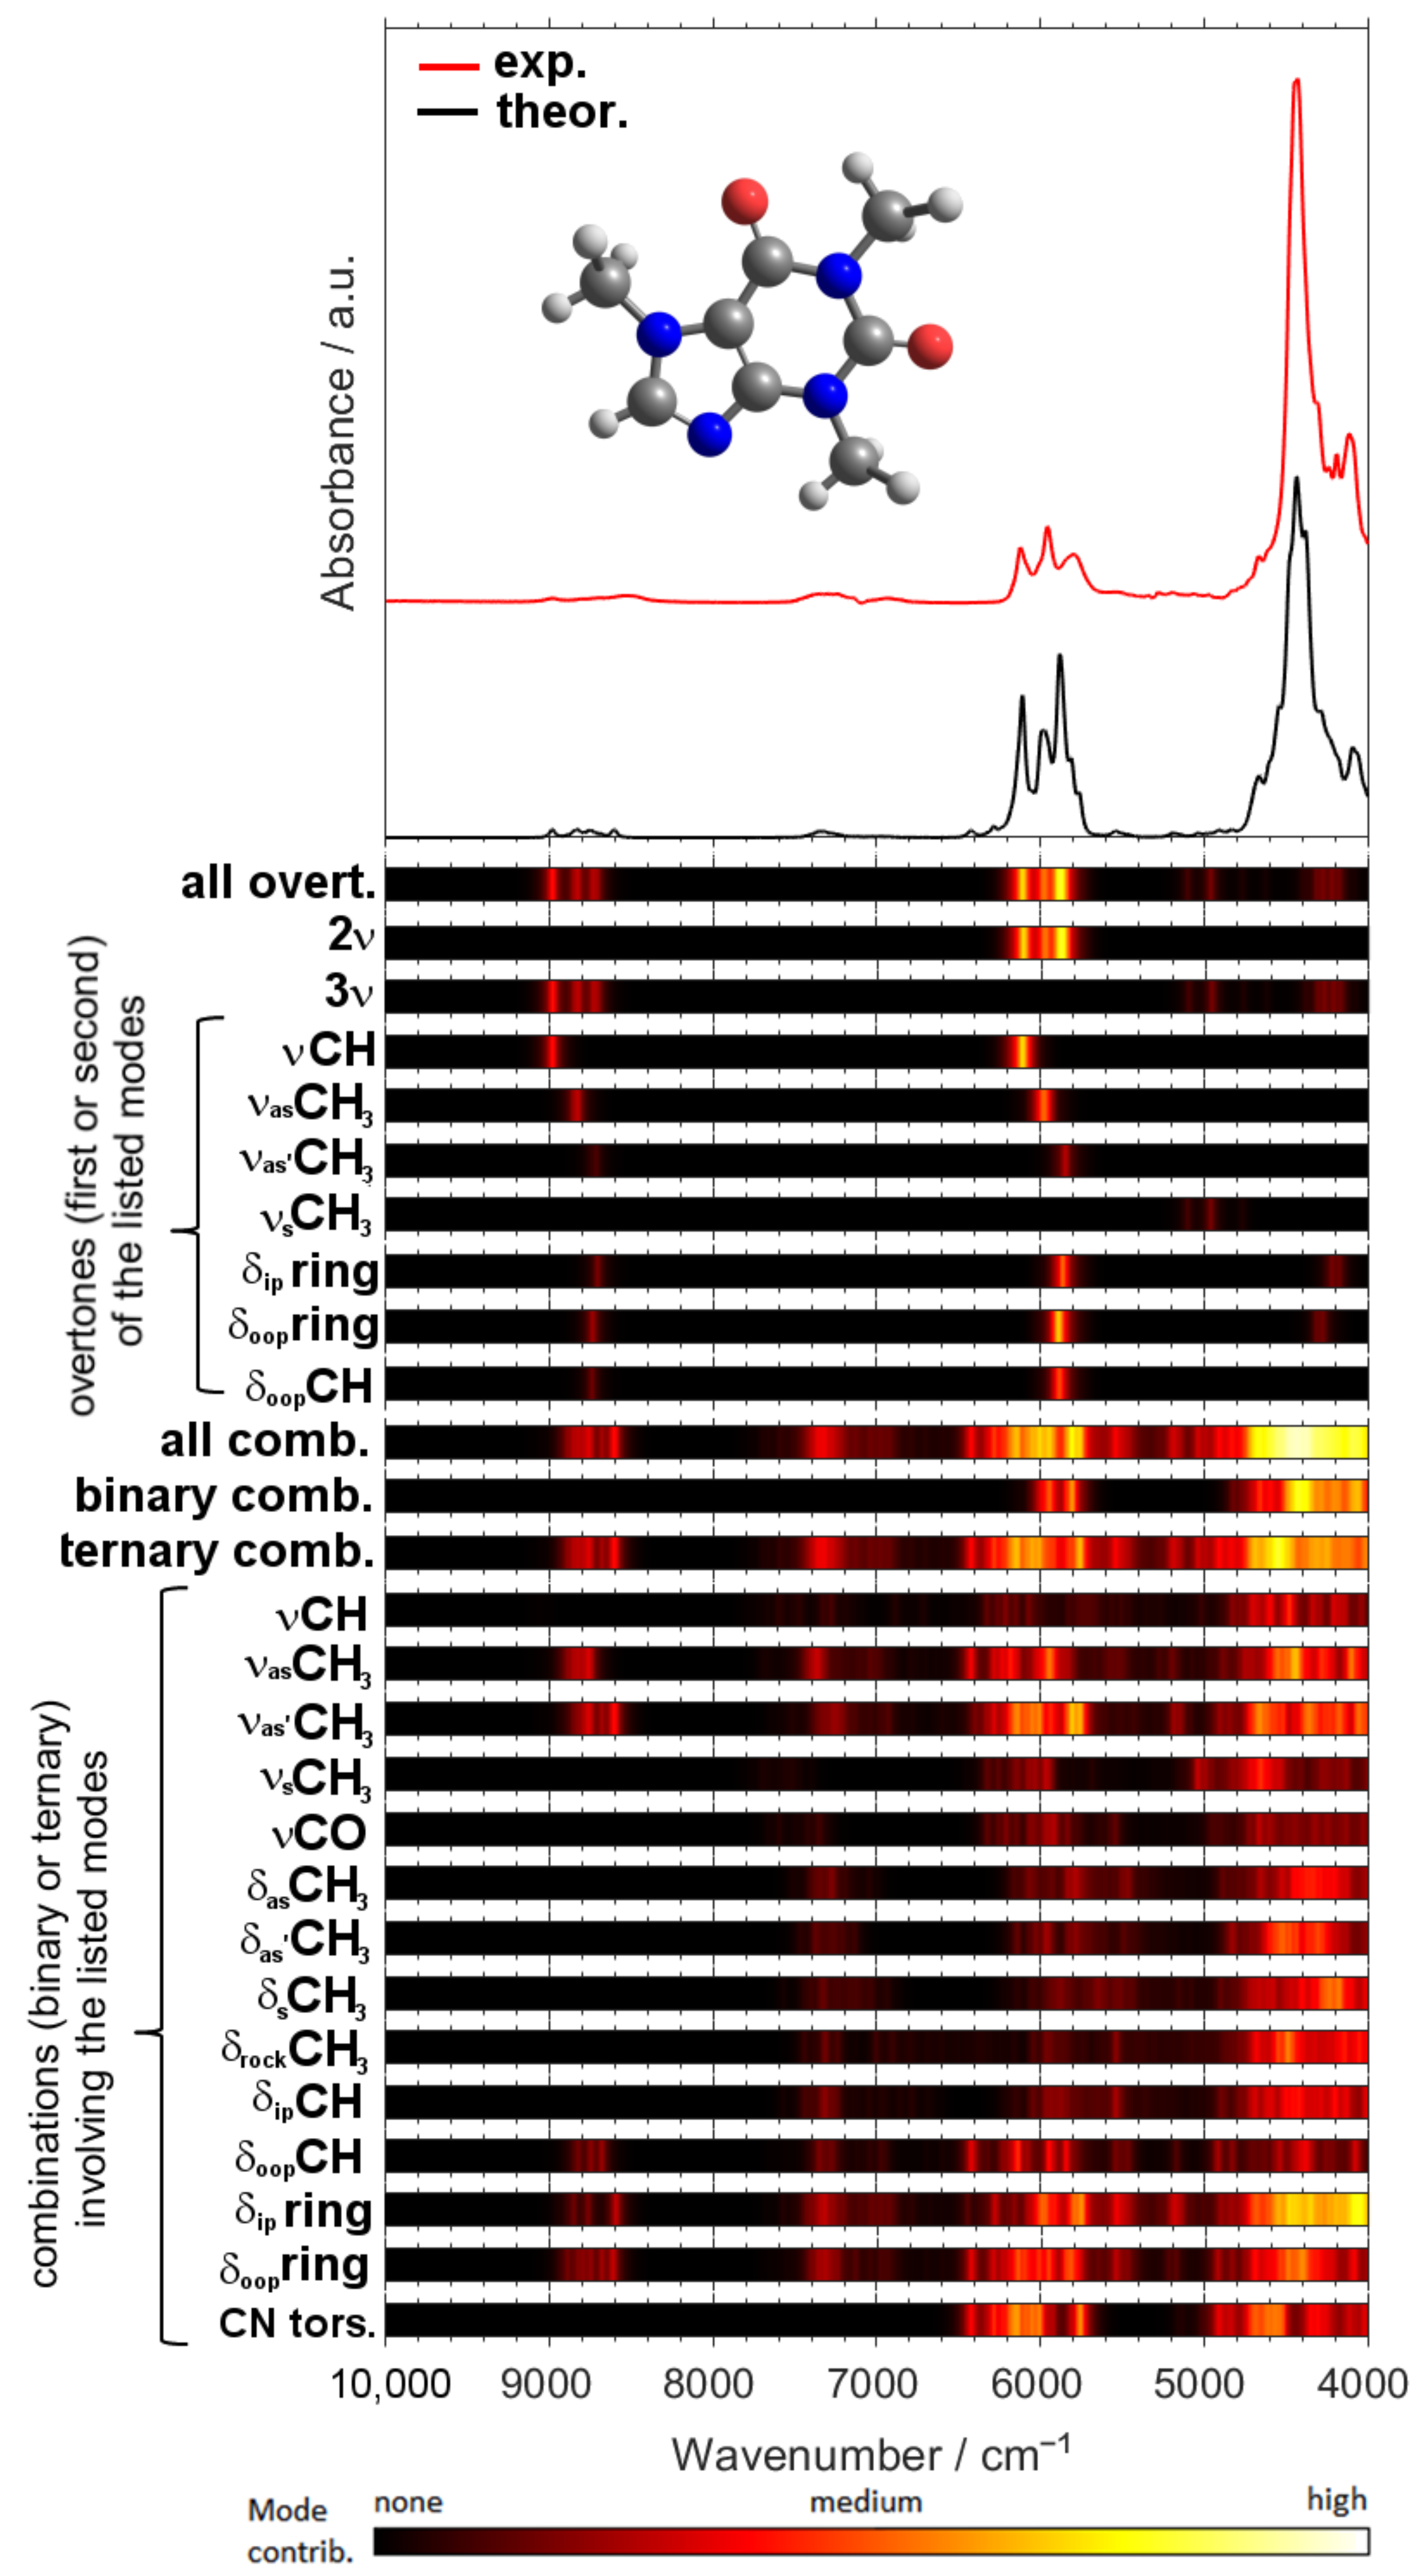
2.1. Analysis of a NIR Spectrum of Caffeine

As depicted in Figure 1, the calculated NIR spectrum of caffeine reproduces the experimental one very well, including fine absorption features visible near the shoulders of the major bands in 7000–4000 cm−1 region (Figure 2), as well as the weak peaks observed in 10,000–7000 cm−1 region (Figure 3). Thus, a detailed and reliable interpretation of the spectrum of caffeine is possible. An extensive level of band overlap is observed in the NIR spectrum, as presented in detail in Figure S1 in Supplementary Material. In Figure 2 and Figure 3 (and in Figures S2–S8), in addition to the theoretical lineshape, the contributing lineshapes corresponding to the different vibrational transitions, i.e., first and second overtones as well as binary and ternary combinations, are presented. This opens the opportunity to dissect the NIR lineshape with respect to the underlying bands and to elucidate their relationships with the structural features of caffeine.
The presence of the first overtone bands is primarily noticeable in the peaks appearing at 6200–5800 cm−1, albeit the contributions from both binary and ternary combinations are clearly visible there as well (Figure 2, Figure S5). The most evident manifestation of the second overtones is seen in the bands visible at ca. 9100–8500 cm−1 (Figure 3 and Figure S7). Throughout the entire spectrum, the contributions from combination bands is well recognized, e.g., within the main absorption features observed between ca. 4800–4000 cm−1 and 6100–5800 cm−1 (binary and ternary combinations; Figure 2, Figures S2 and S5) or ca. 7400–7000 cm−1 and 9100–8500 cm−1 (ternary combinations; Figure 3 and Figures S6–S8).
The relative significance of the different types of vibrational transitions in NIR spectrum of caffeine, with respect to a given wavenumber region of interest, may be quantitatively assessed by calculating the integral intensity for the simulated lineshapes (as presented in Figure 3 and Figure 4). These contributions are collected in Table 1. One should easily notice that in the NIR spectrum of caffeine, the overtones of either kind are significantly less meaningful than the combination bands (Table 1). The first overtones contribute only by 11.57% to the entire analyzed spectral region; furthermore, these bands are mostly limited to the 6500–5500 cm−1 region, as their contribution outside this narrow fragment of the spectrum is negligible. However, within that narrow wavenumber range (6500–5500 cm−1) the contribution of the first overtones is clearly articulated (40.5%).
In the case of second overtones, their presence in the spectrum is merely noticeable with slightly more than just 1% of the total contribution. Those transitions are only meaningful for the absorption in the region above 7000 cm−1 (26.78%). However, in the higher wavenumber region of NIR spectrum, between 9200–8400 cm−1, the second overtones are highly meaningful, with the calculated 42.3% of the contribution to the total integral intensity in that region. Noteworthy, the overtone bands of caffeine present a different picture to that of O-H or N-H group bearing molecules, which were very often examined by NIR spectroscopy [17,19,26,31,77,81]. The overtones of O-H and N-H stretching vibration often appear as strong, well-resolved peaks observed in narrow wavenumber regions. These features enabled them to be used as a useful source of information on the structure and interactions, especially hydrogen-bonding [17,19,82]. However, in the caffeine case, the first overtones overlap with combination bands (6500–5500 cm−1; Figure 2), and the second overtones mostly do as well (ca. 8900–8600 cm−1; Figure 3), with the exception of a relatively sharp second overtone of C-H stretching observed at 8980 cm−1 (Figure 3; Table 2). Therefore, in the cases such as the caffeine examined here it is necessary to perform a full simulation of NIR spectra, including both overtones and combinations, to successfully extract the structural information.
An interesting observation can be made in the case of the combination bands of caffeine. In contrast to the earlier studied compounds where the binary combinations were relatively more significant [79,83], in the present case the greatest contribution to the total intensity stems from the ternary combinations, with 50.24% calculated for the 10,000–4000 cm−1 region. This results from a significant presence of the ternary combinations in ca. the 5000–4000 cm−1 region of caffeine, which for the earlier investigated cases was far more decisively influenced by binary combinations [breakthrough]. Noteworthy, the ternary combination bands are solely responsible for the absorption of caffeine in 7700–7000 cm−1 region (99.95% of the total integral intensity).
As one should anticipate, the higher wavenumber NIR region of caffeine (10,000–7000 cm−1) is entirely populated by the second overtones and ternary combination bands. Interestingly, while the NIR spectrum of caffeine is decisively influenced by the combination modes, the importance of the overtones increases towards the higher wavenumbers, as shown in Table 1. Considering the upper narrow fragment of the NIR region, 9200–8400 cm−1, the contributions stemming from these two types of transitions tends to equalize with 42% and 58% attributed to the overtones and combinations, respectively. Hence, including these bands in the spectra simulation is essential to interpret the meaningful variables for the analysis of caffeine content, which have been reported to extend up to 9996 cm−1 [50] and 10,000 cm−1 [84].

2.2. Detailed Interpretation of NIR Bands of Caffeine

As the consequence of the highly convoluted nature of NIR spectra (Figures S1, S3, and S6 in Supplementary Material), the typical approach to present tabularized band assignments, as it is commonly done in MIR spectroscopy, is not feasible. Instead, the assignments given in the form of heat maps, corresponding to the extent of the contribution of a given transition, better represent the origin of NIR absorption (Figure 4). In this way of presentation, the ratio between the intensity of a given simulated individual band to the total intensity of the summarized theoretical lineshape is calculated for each spectral point (i.e., wavenumber). The resulting value is then coded using a colormap for ease-of-view, as presented in Figure 4. This way, the observed lineshape may be better understood, as it originates from numerous overlapping individual bands. However, for clarity, a table that summarizes the assignments for the major NIR peaks of caffeine is additionally provided (Table 2).
The region of the most intense bands, ca. 5000–4000 cm−1 features an extremely high extent of overlapping binary and ternary combination bands. Numerous individual modes can be involved in the bands observed there (Figure 4). Interestingly, the very weak second overtone bands contribute by miniscule but noticeable extent here, e.g., the second overtone of in-plane (3δipring) and out-of-plane ring deformation mode (3δoopring) in the 4400–4200 cm−1 or 3νsCH3 in 5200–4900 cm−1 region. Noteworthy, it is evident that the contributions to the NIR spectrum from the low-frequency δoopring mode becomes possible through the ternary combination transitions, as either the first overtones or binary combinations are located in MIR region.
The origin of the next distinguishable absorption of moderate intensity, between ca. 6200–5800 cm−1, can be firstly assigned to binary and ternary combinations, primarily with the ring deformation and methyl stretching modes involved: δoopring, δipring, νasCH3, and νas’CH3. Secondly, the first overtones of C-H stretching and ring deformation modes, i.e., 2νCH, 2νasCH3, 2νas’CH3, 2δipring, 2δoopring, and 2δoopCH, contribute in this region. The region of very weak intensity, between ca. 5800–5000 cm−1, mostly arises from the ternary combinations mostly constituting δipring and δoopring modes, among others.
In the 7400–6800 cm−1 region one can observe ternary combinations with δipring, δoopring and νasCH3, and νas’CH3, as well as lesser contributions from other deformation modes of CH3 group. The absorption in the upper NIR region, ca. upper 9100–8700 cm−1, consists of second overtones (mostly 3νCH, 3νasCH3, 3νas’CH3, 3δipring, 3δoopring, and 3δoopCH) and ternary combinations (primarily δipring, δoopring, δoopCH, νasCH3, and νas’CH3 modes involved).
A separate discussion should be developed around the overtones of νC=O mode, which have attracted attention in literature, with e.g., the C=O stretching second overtone identified as a relatively well-resolved peak observed in NIR spectra of acetone and 2-hexanone and poli-3-hydroxybutyrate [76,85]. The intensity of the second overtone of C=O stretching was found to be particularly strong in relation to the corresponding first overtone for these systems [76]. As investigated in the present study, the calculated intensity of 3νC=O transition is extremely weak. There are modes of caffeine, to which the C=O stretching internal coordinate contributes meaningfully. The respective fundamental transitions appear at 1694 and 1740 cm−1 calculated positions. The corresponding first overtones emerge in MIR region as well, at calculated 3409 and 3314 cm−1. Only the second overtones appear in the NIR region, at 5101 and 4960 cm−1.
Let’s evaluate the calculated intensities of the first and second C=O stretching overtones in relation to the respective fundamentals. The calculated peak positions and intensities are presented in Table 3. The first overtones of C=O stretching are over 286 and 84 times weaker than the corresponding fundamental bands. The second overtones are over 3000 times weaker than the respective fundamentals, and over 11 and 46 times weaker than the first overtones. Therefore, in the case of caffeine, most likely because of the symmetry of the molecule, the second overtones of C=O stretching do not appear as meaningful peaks that could be observed in the NIR spectrum (Figure S9 in Supplementary Materials).

2.3. Linking the Interpreted NIR Absorption Regions of Caffeine with Wavenumber Ranges Found to Be Meaningful in Quantitative Analytical Applications

Applied NIR spectroscopic studies related to coffee analysis and quality control, performed in combination with multivariate classification and/or regression analysis for either in pure or blend samples, have put considerable attention on the absorption features of caffeine. These studies noticed the relevance for the analytical performance of the characteristic NIR bands of caffeine confronted with the other chemical constituents abundant in the sample, e.g., lipids, carbohydrates theobromine, theophylline, chlorogenic acid, or trigonelline [86]. The importance of selecting the informational spectral ranges, representing the variables in multivariate models, for the performance of such analysis was reported by Pizarro’s group [84]. Barbin et al. [51] assembled a comprehensive table of the NIR absorption regions of caffeine altogether with the other relevant chemical constituents present in coffee. The importance of a proper variable selection during the analytical procedure of model calibration, which would minimize the overlap between the absorption bands of pure components was noted as keen for obtaining more reliable analysis [51].
With the results of the present work, it becomes possible to interpret these wavenumber regions of caffeine as meaningful to the performance of analytical applications, and link them with the molecular structural features. A short discussion can be provided confronting the unveiled picture with that commonly presented in the literature, where the absorption regions are often divided to the “first, second and third overtones” regions [51,74].
Estabean-Diez et al. [87] provided assignments for some NIR bands of caffeine. For instance, the peak at 1710 nm (5848 cm−1) was identified as the first overtone CH3 asym. stretching, which can be confirmed by the present results. It should be more precisely described as CH3 asym. stretching', according to Pulay’s convention. The meaningful peak at 1340 nm (7463 cm−1) was also identified correctly as 2νCH + δCH. However, the interpretation provided for the other variables, e.g., at 1154 nm (8667 cm−1), 1914–1916 nm (5225–5219 cm−1), and 2142–2150 nm (4469–4651 cm−1), each identified as second overtones, should be reconsidered. These features are rather ternary combinations, as the respective spectral regions solely originate from those transitions (Figure 3 and Figure 4).
Zhang et al. [86] used three methods, within which the variables meaningful for the analysis of caffeine content have been determined. The unveiled variables concentrated in four wavenumber regions, 4019–4196, 4412–5056, 5577–6106, and 6784–7706 cm−1. It was anticipated that the characteristic absorption peaks of caffeine appear there relatively less obstructed from the peaks of other constituents. However, no interpretation of these spectral regions was given. Here, we can associate these meaningful variables primarily with binary and ternary combinations of various modes, primarily νCH and δCH (4019–4196 cm−1 and 4412–5056 cm−1), first overtones of δring, δCH, and νasCH3 together with binary and ternary combinations of primarily νCH and δring (5577–6106 cm−1), and ternary combinations mostly involving νCH, δCH, and δring (6784–7706 cm−1).
Santos et al. [88] concluded from their analysis of the PLS regression coefficients for four calibrated models that the 5000–4000 cm−1 region is the most important for caffeine quantification. That spectral region was predominantly correctly associated with νCH and νCC combination bands. However, this interpretation should be extended to numerous other contributions from binary and ternary combination bands present in this strongly convoluted fragment of the spectrum.
Barabin et al. [51] has summarized the meaningful wavenumber regions for caffeine reported in the literature, as well as provided more generalized spectra-structure correlations. Interestingly, the absorption regions identified as meaningful for caffeine analysis by NIR spectroscopy include the weaker bands of this compound, e.g., in ca. the 5300–5000 cm−1 region elucidated as ternary combinations in this work. Additionally, the wavenumber regions meaningful for caffeine analysis that do not contain peaks of this compound may nevertheless carry the information correlated with caffeine content in the sample. The corresponding spectral signal may arise from the surrounding matrix molecules influenced by the interaction with caffeine.

3. Materials and Methods

3.1. Experimental

Caffeine standard (powder; ≥95%) was ordered from Extrasynthese (Genay, France). Carbon tetrachloride (CCl4, anhydrous, ≥99.5%) was purchased from Sigma Aldrich (St. Louis, MO, USA). Carbon tetrachloride was additionally distilled and stored over molecular sieves (5 Å, Sigma-Aldrich).
NIR spectra were measured on a Büchi NIRFlex N-500 Fourier Transform (FT) spectrometer based on a polarization interferometer. The instrument was equipped with the accessory for measuring liquid samples in transmission mode. The samples were placed in a quartz cuvette (Hellma QX) with the optical path of 10 mm. Spectra were obtained in the wavenumber range from 10,000 to 4000 cm−1, with a spectral resolution of 8 cm−1 further interpolated by the software controlling the spectrometer (Büchi NIR Ware 1.4.30010) to 4 cm−1, resulting in 1501 data points per spectrum. A total of 64 mean scans were collected for each spectrum. For further analysis, the spectrum of the cell filled with the solvent was subtracted from the spectra of the solution.
The spectrometer can stabilize the sample temperature during the measurements, in the range from room temperature to 338 K (65 °C). It was found that the solubility curve of caffeine in carbon tetrachloride changes noticeably with the temperature. Under normal conditions the solubility is low, resulting in a weak intensity of the measured NIR bands. To obtain better quality of the spectra, measurements of saturated solution were performed at increased temperatures up to the limit of the spectrometer of 333.15 K (60 °C), which remains at safe distance from the boiling point of carbon tetrachloride [349.85 K (76.7 °C)] as well as the temperature of decomposition of caffeine [558.15 K (285 °C)] [89]. The solubility of caffeine at that temperature increased significantly, yielding a much better resolved spectrum that enabled reliable analysis of weak bands such as those originating from the second overtones and ternary combinations.

3.2. Computational Details

For the purpose of theoretical simulation of the NIR vibrational bands, anharmonic calculations by means of Generalized Vibrational Second-Order Perturbation Theory (GVPT2) were performed [90,91]. Within this approach, a full treatment of vibrational resonances is performed, with the tightly coupled states being treated with variational procedure [91]. The anharmonic vibrational analysis yielded the transitions up to three quanta; i.e., the first (2ω) and second overtones (3ω), as well as binary (ωa + ωb) and ternary combinations of two kinds (ωa + ωb + ωc and 2ωa + ωb) were obtained. The vibrational calculations were preceded by the mandatory geometry optimization (i.e., energy minimization) step (Figure 5). The computations were carried out at Density Functional Theory (DFT) level of electronic theory, with Becke’s three-parameter exchange (B3) + Lee-Yang-Parr (LYP) density functional (i.e., B3LYP), and were additionally refined by applying Grimme’s third version of empirical correction for dispersion (GD3) [92]. A “spectroscopic” basis set of double-z quality (SNSD) developed by Barone’s group was used [93]. This combination of density functional and basis sets yielded very accurate yet reasonably time-extensive calculations of NIR bands in previous studies [31]. All quantum mechanical calculations were performed with Gaussian 16 Rev. B01 software [94]. The modeling of the spectral lineshape was carried out through parameterized band broadening. Lorentz-Gauss (Cauchy-Gauss) product function was used as the bandshape model [34,95]. The band identification and association to the vibrational modes was performed in accordance with Pulay et al. [96].

4. Conclusions

NIR spectrum of caffeine was successfully reproduced by anharmonic quantum chemical calculations. The calculated first and second overtones as well as binary and ternary combinations unveiled a strongly convoluted spectral lineshape. High contribution to the NIR spectrum of combination bands, including ternary combinations, was noticed in the entire studied spectral region, and between 7000–4000 cm−1 in particular. Noteworthy, the region between 5000–4000 cm−1 is dominated by the combination bands, but in the case of caffeine, significant input to the NIR spectral intensity in that region can be observed from both binary and ternary combination bands. The contributions from the overtones to the NIR spectrum of caffeine ranges widely depending on a particular fragment of the spectrum. The first overtones are mostly manifested in the 6500–5500 cm−1 region, while the second overtones dominate the upper wavenumber (i.e., shorter wavelength) region, between ca. 9200–8400 cm−1. The present study demonstrates theoretically that NIR spectra are highly region specific with respect to the first and second overtones as well as binary and ternary combination bands. Following a detailed analysis of vibrational transition and band assignments, the interpterion of the wavenumber regions meaningful for caffeine analysis by NIR spectroscopy was performed and discussed with the previous findings reported in literature, which were based on conventional methods of spectra analysis.

Supplementary Materials

The following are available online, Figure S1: Experimental and calculated NIR spectra of caffeine in region 7000–4000 cm−1. In addition to the theoretical lineshape, individual simulated bands are presented as well; Figure S2: Experimental and calculated NIR spectra of caffeine in region 5000–4000 cm−1. Theoretical lineshapes representing the summed bands of different origin are presented; Figure S3: Experimental and calculated NIR spectra of caffeine in region 4800–4000 cm−1. In addition to the theoretical lineshape, individual simulated bands are presented as well; Figure S4: Experimental and calculated NIR spectra of caffeine in region 5700–4800 cm−1. Theoretical lineshapes representing the summed bands of different origin are presented; Figure S5: Experimental and calculated NIR spectra of caffeine in region 7000–5000 cm−1. Theoretical lineshapes representing the summed bands of different origin are presented; Figure S6: Experimental and calculated NIR spectra of caffeine in region 7000–5000 cm−1. In addition to the theoretical lineshape, individual simulated bands are presented as well; Figure S7: Experimental and calculated NIR spectra of caffeine in region 9500–8000 cm−1. Theoretical lineshapes representing the summed bands of different origin are presented; Figure S8: Experimental and calculated NIR spectra of caffeine in region 9500–8000cm−1. In addition to the theoretical lineshape, individual simulated bands are presented as well; Figure S9: The calculated contributions to NIR spectrum of caffeine of C=O stretching transitions.

Author Contributions

Conceptualization, J.G.; methodology, J.G and K.B.B.; software, J.G. and K.B.B.; validation, J.G. and K.B.B.; formal analysis, J.G. and K.B.B.; investigation, J.G. and K.B.B.; resources, C.W.H.; data curation, J.G. and K.B.B.; writing—original draft preparation, J.G. and K.B.B.; writing—review and editing, J.G., K.B.B., Y.O., C.W.H.; visualization, J.G.; supervision, C.W.H.; project administration, C.W.H.; funding acquisition, C.W.H. All authors have read and agreed to the published version of the manuscript.

Funding

This work was supported by the Austrian Science Fund (FWF): P32004-N28.

Data Availability Statement

Not applicable.

Acknowledgments

Open Access Funding by the Austrian Science Fund (FWF). Calculations have been carried out in Wrocław Centre for Networking and Supercomputing (http://www.wcss.pl, accessed on 20 August 2021), under grant no. 375. Authors cordially acknowledge S. Mayr for her kind assistance with the measurements.

Conflicts of Interest

The authors declare no conflict of interest.

Sample Availability

Samples of the compounds in this article are not available from the authors.

References

  1. Ozaki, Y.; Morisawa, Y. Principles and characteristics of NIR spectroscopy. In Near-Infrared Spectroscopy; Ozaki, Y., Huck, C.W., Tsuchikawa, S., Engelsen, S.B., Eds.; Springer: Singapore, 2021; pp. 37–60. [Google Scholar] [CrossRef]
  2. Ozaki, Y.; Huck, C.W.; Beć, K.B. Near infrared spectroscopy and its applications. In Molecular and Laser Spectroscopy. Advances and Applications; Gupta, V.P., Ed.; Elsevier: San Diego, CA, USA, 2018; pp. 11–38. [Google Scholar] [CrossRef]
  3. Cozzolino, D. Infrared Spectroscopy: Theory, Developments and Applications; Nova Science Publishers: New York, NY, USA, 2014. [Google Scholar]
  4. Dorrepaal, R.; Gowen, A. Identification of magnesium oxychloride cement biomaterial heterogeneity using Raman chemical mapping and NIR hyperspectral chemical imaging. Sci. Rep. 2018, 8, 13034. [Google Scholar] [CrossRef] [PubMed]
  5. Baeten, V.; Dardenne, P. Application of NIR in agriculture. In Near-Infrared Spectroscopy; Ozaki, Y., Huck, C.W., Tsuchikawa, S., Engelsen, S.B., Eds.; Springer: Singapore, 2021; pp. 331–345. [Google Scholar] [CrossRef]
  6. Baeten, V.; Rogez, H.; Fernández Pierna, J.A.; Vermeulen, P.; Dardenne, P. Vibrational spectroscopy methods for the rapid control of agro-food products. In Handbook of Food Analysis, 3rd ed.; Toldra, F., Nollet, L.M.L., Eds.; CRC Press: Boca Raton, FL, USA, 2015; Volume 2, pp. 591–614. [Google Scholar]
  7. Manley, M.; Williams, P.J. Applications: Food Science. In Near-Infrared Spectroscopy; Ozaki, Y., Huck, C.W., Tsuchikawa, S., Engelsen, S.B., Eds.; Springer: Singapore, 2021; pp. 347–359. [Google Scholar] [CrossRef]
  8. Cozzolino, D. From consumers’ science to food functionality—Challenges and opportunities for vibrational spectroscopy. Adv. Food Nutr. Res. 2021, 97, 119–146. [Google Scholar] [CrossRef]
  9. Kessler, R.W.; Kessler, W. Inline and online process analytical technology with an outlook for the petrochemical industry. In Near-Infrared Spectroscopy; Ozaki, Y., Huck, C.W., Tsuchikawa, S., Engelsen, S.B., Eds.; Springer: Singapore, 2021; pp. 553–593. [Google Scholar] [CrossRef]
  10. Scherzer, T. Applications of NIR techniques in polymer coatings and synthetic textiles. In Near-Infrared Spectroscopy; Ozaki, Y., Huck, C.W., Tsuchikawa, S., Engelsen, S.B., Eds.; Springer: Singapore, 2021; pp. 475–516. [Google Scholar] [CrossRef]
  11. Igne, B.; Ciurczak, E.W. Near-infrared spectroscopy in the pharmaceutical industry. In Near-Infrared Spectroscopy; Ozaki, Y., Huck, C.W., Tsuchikawa, S., Engelsen, S.B., Eds.; Springer: Singapore, 2021; pp. 391–412. [Google Scholar] [CrossRef]
  12. Huck, C.W. Infrared spectroscopy in near-infrared/ infrared bioanalysis including imaging. In Encyclopedia of Analytical Chemistry: Applications, Theory and Instrumentation; Meyers, R.A., Ed.; John Wiley & Sons, Ltd.: New York, NY, USA, 2016. [Google Scholar] [CrossRef]
  13. Ishigaki, M.; Ozaki, Y. Near-infrared spectroscopy and imaging in protein research. In Vibrational Spectroscopy in Protein Research; Ozaki, Y., Baranska, M., Lednev, I.K., Wood, B.R., Eds.; Academic Press: London, UK, 2020; pp. 143–176. [Google Scholar]
  14. Ozaki, Y.; Huck, C.W.; Ishigaki, M.; Ishikawa, D.; Ikehata, A.; Shinzawa, H. Near-infrared spectroscopy in biological molecules and tissues. In Encyclopedia of Biophysics; Roberts, G., Watts, A., European Biophysical Societies, Eds.; Springer: Berlin/Heidelberg, Germany, 2018; pp. 1681–1780. [Google Scholar] [CrossRef]
  15. Heise, H.M. Medical applications of NIR spectroscopy. In Near-Infrared Spectroscopy; Ozaki, Y., Huck, C.W., Tsuchikawa, S., Engelsen, S.B., Eds.; Springer: Singapore, 2021; pp. 437–473. [Google Scholar] [CrossRef]
  16. Türker-Kaya, S.; Huck, C.W. A review of mid-infrared and near-infrared imaging: Principles, concepts and applications in plant tissue analysis. Molecules 2017, 22, 168. [Google Scholar] [CrossRef] [PubMed] [Green Version]
  17. Czarnecki, M.A.; Morisawa, Y.; Futami, Y.; Ozaki, Y. Advances in molecular structure and interaction studies using near-infrared spectroscopy. Chem. Rev. 2015, 115, 9707–9744. [Google Scholar] [CrossRef]
  18. Czarnecki, M.A. Frequency shift or intensity shift? The origin of spectral changes in vibrational spectra. Vib. Spectrosc. 2012, 58, 193–198. [Google Scholar] [CrossRef]
  19. Czarnecki, M.A.; Beć, K.B.; Grabska, J.; Hofer, T.S.; Ozaki, Y. Overview of application of NIR spectroscopy to physical chemistry. In Near-Infrared Spectroscopy; Ozaki, Y., Huck, C.W., Tsuchikawa, S., Engelsen, S.B., Eds.; Springer: Singapore, 2021; pp. 297–330. [Google Scholar] [CrossRef]
  20. Beć, K.B.; Grabska, J.; Huck, C.W. Near-infrared spectroscopy in bio-applications. Molecules 2020, 25, 2948. [Google Scholar] [CrossRef] [PubMed]
  21. Gilbert, A.S. IR spectral group frequencies of organic compounds. In Encyclopedia of Spectroscopy and Spectrometry, 2nd ed.; Lindon, J.C., Ed.; Academic Press: London, UK, 2010; pp. 1187–1198. [Google Scholar] [CrossRef]
  22. Larkin, P. IR and Raman spectra-structure correlations: Characteristic group frequencies. In Infrared and Raman Spectroscopy. Principles and Spectral Interpretation; Larkin, P., Ed.; Elsevier: San Diego, CA, USA, 2011; pp. 73–115. [Google Scholar] [CrossRef]
  23. Weyer, L.G.; Lo, S.C. Spectra-structure correlations in the near-infrared. In Handbook of Vibrational Spectroscopy; Chalmers, J.M., Griffiths, P.R., Eds.; John Wiley & Sons, Ltd.: Chichester, UK, 2006; Volume 3, pp. 1817–1837. [Google Scholar] [CrossRef]
  24. Barone, V.; Alessandrini, S.; Biczysko, M.; Cheeseman, J.R.; Clary, D.C.; McCoy, A.B.; DiRisio, R.J.; Neese, F.; Melosso, M.; Puzzarini, C. Computational molecular spectroscopy. Nat. Rev. Methods Primers 2021, 1, 38. [Google Scholar] [CrossRef]
  25. Bloino, J.; Baiardi, A.; Biczysko, M. Aiming at an accurate prediction of vibrational and electronic spectra for medium-to-large molecules: An overview. Int. J. Quantum Chem. 2016, 116, 1543–1574. [Google Scholar] [CrossRef] [Green Version]
  26. Beć, K.B.; Huck, C.W. Breakthrough potential in near-infrared spectroscopy: Spectra simulation. A review of recent developments. Front. Chem. 2019, 7, 48. [Google Scholar] [CrossRef] [Green Version]
  27. Beć, K.B.; Grabska, J.; Huck, C.W. Current and future research directions in computer-aided near-infrared spectroscopy: A perspective. Spectrochim. Acta A 2021, 254, 119625. [Google Scholar] [CrossRef]
  28. Paoloni, L.; Mazzeo, G.; Longhi, G.; Abbate, S.; Fusè, M.; Bloino, J.; Barone, V. Toward fully unsupervised anharmonic computations complementing experiment for robust and reliable assignment and interpretation of IR and VCD spectra from Mid-IR to NIR: The case of 2,3-butanediol and trans-1,2-cyclohexanediol. J. Phys. Chem. A 2020, 124, 1011–1024. [Google Scholar] [CrossRef]
  29. Beć, K.B.; Grabska, J.; Ozaki, Y. Advances in anharmonic methods and their applications to vibrational spectroscopies. In Frontiers of Quantum Chemistry; Wójcik, M.J., Nakatsuji, H., Kirtman, B., Ozaki, Y., Eds.; Springer: Singapore, 2017; pp. 438–512. [Google Scholar] [CrossRef]
  30. Beć, K.B.; Grabska, J.; Huck, C.W.; Ozaki, Y. Quantum mechanical simulation of near-infrared spectra. Applications in physical and analytical chemistry. In Molecular Spectroscopy: A Quantum Chemistry Approach; Ozaki, Y., Wójcik, M.J., Popp, J., Eds.; Wiley-VCH: Weinheim, Germany, 2019; Volume 2, pp. 353–388. [Google Scholar] [CrossRef]
  31. Beć, K.B.; Futami, Y.; Wójcik, M.J.; Ozaki, Y. A spectroscopic and theoretical study in the near-infrared region of low concentration aliphatic alcohols. Phys. Chem. Chem. Phys. 2016, 18, 13666–13682. [Google Scholar] [CrossRef]
  32. Grabska, J.; Beć, K.B.; Ozaki, Y.; Huck, C.W. Temperature drift of conformational equilibria of butyl alcohols studied by near-infrared spectroscopy and fully anharmonic DFT. J. Phys. Chem. A 2017, 121, 1950–1961. [Google Scholar] [CrossRef] [PubMed]
  33. Beć, K.B.; Grabska, J.; Huck, C.W.; Czarnecki, M.A. Effect of conformational isomerism on NIR spectra of ethanol isotopologues. Spectroscopic and anharmonic DFT study. J. Mol. Liq. 2020, 310, 113271. [Google Scholar] [CrossRef]
  34. Barone, V.; Biczysko, M.; Bloino, J.; Cimino, P.; Penocchio, E.; Puzzarini, C. CC/DFT route toward accurate structures and spectroscopic features for observed and elusive conformers of flexible molecules: Pyruvic acid as a case study. J. Chem. Theory Comput. 2015, 11, 4342–4363. [Google Scholar] [CrossRef] [Green Version]
  35. Grabska, J.; Ishigaki, M.; Beć, K.B.; Wójcik, M.J.; Ozaki, Y. Correlations between Structure and Near-Infrared Spectra of Saturated and Unsaturated Carboxylic Acids. Insight from Anharmonic Density Functional Theory Calculations. J. Phys. Chem. A 2017, 121, 3437–3451. [Google Scholar] [CrossRef]
  36. Grabska, J.; Beć, K.B.; Ishigaki, M.; Wójcik, M.J.; Ozaki, Y. Spectra-structure correlations of saturated and unsaturated medium-chain fatty acids. Near-infrared and anharmonic DFT study of hexanoic acid and sorbic acid. Spectrochim. Acta A 2017, 185, 35–44. [Google Scholar] [CrossRef] [PubMed]
  37. Grabska, J.; Beć, K.B.; Ishigaki, M.; Huck, C.W.; Ozaki, Y. NIR spectra simulations by anharmonic DFT-saturated and unsaturated long-chain fatty acids. J. Phys. Chem. B 2018, 122, 6931–6944. [Google Scholar] [CrossRef]
  38. Barone, V.; Biczyszko, M.; Bloino, J.; Puzzarini, C. Glycine conformers: A never-ending story? Phys. Chem. Chem. Phys. 2013, 15, 1358–1363. [Google Scholar] [CrossRef]
  39. Shu, C.; Jiang, Z.; Biczysko, M. Toward accurate prediction of amino acid derivatives structure and energetics from DFT: Glycine conformers and their interconversions. J. Mol. Model. 2020, 26, 129. [Google Scholar] [CrossRef]
  40. Beć, K.B.; Grabska, J.; Ozaki, Y.; Czarnecki, M.A.; Huck, C.W. Simulated NIR spectra as sensitive markers of the structure and interactions in nucleobases. Sci. Rep. 2019, 9, 17398. [Google Scholar] [CrossRef] [PubMed]
  41. Kirchler, C.G.; Pezzei, C.K.; Beć, K.B.; Mayr, S.; Ishigaki, M.; Ozaki, Y.; Huck, C.W. Critical evaluation of spectral information of benchtop vs. portable near-infrared spectrometers: Quantum chemistry and two-dimensional correlation spectroscopy for a better understanding of PLS regression models of the rosmarinic acid content in Rosmarini folium. Analyst 2017, 142, 455–464. [Google Scholar] [CrossRef] [PubMed]
  42. Beć, K.B.; Grabska, J.; Kirchler, C.G.; Huck, C.W. NIR spectra simulation of thymol for better understanding of the spectra forming factors, phase and concentration effects and PLS regression features. J. Mol. Liq. 2018, 268, 895–902. [Google Scholar] [CrossRef]
  43. Mayr, S.; Schmelzer, J.; Kirchler, C.G.; Pezzei, C.K.; Beć, K.B.; Grabska, J.; Huck, C.W. Theae nigrae folium: Comparing the analytical performance of benchtop and handheld near-infrared spectrometers. Talanta 2020, 221, 121165. [Google Scholar] [CrossRef]
  44. Mayr, S.; Beć, K.B.; Grabska, J.; Schneckenreiter, E.; Huck, C.W. Near-infrared spectroscopy in quality control of Piper nigrum: A Comparison of performance of benchtop and handheld spectrometers. Talanta 2020, 223, 121809. [Google Scholar] [CrossRef]
  45. Grabska, J.; Beć, K.B.; Mayr, S.; Huck, C.W. Theoretical simulation of near-infrared spectrum of piperine. Insight into band origins and the features of regression models. App. Spectrosc. 2021, 75, 1022–1032. [Google Scholar] [CrossRef]
  46. Singh, S.; Czarnecki, M.A. How much anharmonicity is in vibrational spectra of CH3I and CD3I? Spectrochim. Acta A 2021, 248, 119176. [Google Scholar] [CrossRef]
  47. Singh, S.; Szostak, R.; Czarnecki, M.A. Vibrational intensities and anharmonicity in MIR, NIR and Raman spectra of liquid CHCl3, CDCl3, CHBr3 and CDBr3: Spectroscopic and theoretical study. J. Mol. Liq. 2021, 336, 116277. [Google Scholar] [CrossRef]
  48. Grabska, J.; Beć, K.B.; Kirchler, C.G.; Ozaki, Y.; Huck, C.W. Distinct diference in sensitivity of NIR vs. IR bands of melamine to inter-molecular interactions with impact on analytical spectroscopy explained by anharmonic quantum mechanical study. Molecules 2019, 24, 1402. [Google Scholar] [CrossRef] [Green Version]
  49. Crocombe, R.A. Portable spectroscopy. Appl. Spectr. 2018, 72, 1701–1751. [Google Scholar] [CrossRef] [PubMed]
  50. Huck, C.W.; Guggenbichler, W.; Bonn, G.K. Analysis of caffeine, theobromine and theophylline in coffee by nearinfrared spectroscopy (NIRS) compared to high-performance liquidchromatography (HPLC) coupled to mass spectrometry. Anal. Chim. Acta 2005, 538, 195–203. [Google Scholar] [CrossRef]
  51. Barbin, D.F.; de Souza Madureira Felicio, A.L.; Sun, D.-W.; Nixdorf, S.L.; Hirooka, E.Y. Application of infrared spectral techniques on quality and compositional attributes of coffee: An overview. Food Res. Int. 2014, 61, 23–32. [Google Scholar] [CrossRef] [Green Version]
  52. Paradkar, M.M.; Irudayaraj, J. A rapid FTIR spectroscopic method for estimation of caffeine in soft drinks and total methylxanthines in tea and coffee. J. Food Sci. 2002, 67, 2507–2511. [Google Scholar] [CrossRef]
  53. Weldegebreal, B.; Redi-Abshiro, M.; Chandravanshi, B.S. Development of new analytical methods for the determination of caffeine content in aqueous solution of green coffee beans. Chem. Cent. J. 2017, 11, 126. [Google Scholar] [CrossRef] [Green Version]
  54. Sinija, V.R.; Mishra, H.N. FT-NIR spectroscopy for caffeine estimation in instant green tea powder and granules. LWT Food Sci. Technol. 2009, 42, 998–1002. [Google Scholar] [CrossRef]
  55. Wanyika, H.N.; Gatebe, E.G.; Gitu, L.M.; Ngumba, E.K.; Maritim, C.W. Determination of caffeine content of tea and instant coffee brands found in the Kenyan market. Afr. J. Food Sci. 2010, 4, 353–358. [Google Scholar]
  56. De Lima, G.G.; Zavattieri Ruiz, H.; Matos, M.; Helm, C.V.; de Liz, M.V.; Magalhães, W.L.E. Prediction of yerba mate caffeine content using near infrared spectroscopy. Spectrosc. Lett. 2019, 52, 282–287. [Google Scholar] [CrossRef]
  57. Oellig, C.; Schunck, J.; Schwack, W. Determination of caffeine, theobromine and theophylline in Mate beer and Mate soft drinks by high-performance thin-layer chromatography. J. Chromatogr. A 2018, 1533, 208–212. [Google Scholar] [CrossRef]
  58. Russo, M.; Dugo, P.; Fanali, C.; Dugo, L.; Zoccali, M.; Mondello, L.; De Gara, L. Use of an online extraction technique coupled to liquid chromatography for determination of caffeine in coffee, tea, and xocoa. Food Anal. Methods 2018, 11, 2637. [Google Scholar] [CrossRef]
  59. QiuChi, C.; Yan, C.; XiaoYun, S.; Chang, L.; Ke, W. Simultaneous determination of benzoic acid, sodium saccharin, acesulfame potassium and caffeine in cola soft drink by high performance liquid chromatography. J. Food Saf. Qual. 2016, 7, 617–622. [Google Scholar]
  60. Tavares, C.; Sakata, R.K. Caffeine in the treatment of pain. Rev. Bras. Anestesiol. 2012, 62, 387–401. [Google Scholar] [CrossRef] [Green Version]
  61. Dobson, N.R.; Hunt, C.E. Pharmacology review: Caffeine use in neonates: Indications, pharmacokinetics, clinical effects, outcomes. NeoReviews 2013, 14, 540–550. [Google Scholar] [CrossRef] [Green Version]
  62. Pohanka, M. The perspective of caffeine and caffeine derived compounds in therapy. Bratisl. Med. J. 2015, 116, 520–530. [Google Scholar] [CrossRef] [Green Version]
  63. Belay, A.; Ture, K.; Redi, M.; Asfaw, A. Measurement of caffeine in coffee beans with UV/vis spectrometer. Food Chem. 2008, 108, 310–315. [Google Scholar] [CrossRef]
  64. Atomssa, T.; Gholap, A.V. Characterization of caffeine and determination of caffeine in tea leaves using uv-visible spectrometer. Afr. J. Pure Appl. Chem. 2011, 5, 1–8. [Google Scholar]
  65. Franeta, J.F.; Agbaba, D.; Pavkov, S.E.; Aleksic, M.; Vladimirov, S. HPLC assay of acetylsalicylic acid, paracetamol, caffeine and phenobarbital in tablets. Il Farm. 2002, 57, 709–713. [Google Scholar] [CrossRef]
  66. Kent, J.E.; Bell, N.G.A. Molecular properties of caffeine explored by NMR: A benchtop NMR experiment for undergraduate physical-chemistry laboratories. J. Chem. Educ. 2019, 96, 786–791. [Google Scholar] [CrossRef]
  67. Woodcock, T.; Downey, G.; O’Donnell, C.P. Better quality food and beverages: The role of near infrared spectroscopy. J. Near Infrared Spectrosc. 2008, 16, 1–29. [Google Scholar] [CrossRef]
  68. Hédoux, A.; Decroix, A.A.; Guinet, Y.; Paccou, L.; Derollez, P.; Descamps, M. Low- and high-frequency Raman investigations on caffeine: Polymorphism, disorder and phase transformation. J. Phys. Chem. B. 2011, 115, 5746–5753. [Google Scholar] [CrossRef]
  69. Edwards, H.G.; Munshi, T.; Anstis, M. Raman spectroscopic characterisations and analytical discrimination between caffeine and demethylated analogues of pharmaceutical relevance. Spectrochim. Acta A 2005, 61, 1453–1459. [Google Scholar] [CrossRef] [PubMed]
  70. Downey, G.; Boussion, J. Authentication of coffee bean variety by near-infrared reflectance spectroscopy of dried extract. J. Sci. Food Agric. 1996, 71, 41–49. [Google Scholar] [CrossRef]
  71. Budiastra, I.W.; Sutrisno; Widyotomo, S.; Ayu, P.C. Prediction of caffeine content in java preanger coffee beans by NIR spectroscopy using PLS and MLR method. IOP Conf. Ser. Earth Environ. Sci. 2018, 147, 012004. [Google Scholar] [CrossRef] [Green Version]
  72. Ito, M.; Suzuki, T.; Yada, S.; Nakagami, H.; Teramoto, H.; Yonemochi, E.; Terada, K. Development of a method for nondestructive NIR transmittance spectroscopic analysis of acetaminophen and caffeine anhydrate in intact bilayer tablets. J. Pharm. Biomed. Anal. 2010, 53, 396–402. [Google Scholar] [CrossRef] [PubMed]
  73. Tugnolo, A.; Beghi, R.; Giovenzana, V.; Guidetti, R. Characterization of green, roasted beans, and ground coffee using near infrared spectroscopy: A comparison of two devices. J. Near Infrared Spectrosc. 2019, 27, 93–104. [Google Scholar] [CrossRef]
  74. Ribeiro, J.S.; Ferreira, M.M.C.; Salva, T.J.G. Chemometric models for the quantitative descriptive sensory analysis of Arabica coffee beverages using near infrared spectroscopy. Talanta 2011, 83, 1352–1358. [Google Scholar] [CrossRef] [Green Version]
  75. Osborne, B.G.; Fearn, T.; Hindle, P.H. Practical NIR Spectroscopy with Applications in Food and Beverages Analysis, 2nd ed.; Longman Scientific and Technical: Harlow, UK, 1993. [Google Scholar]
  76. Chen, Y.; Morisawa, Y.; Futami, Y.; Czarnecki, M.A.; Wang, H.-S.; Ozaki, Y. Combined IR/NIR and density functional theory calculations analysis of the solvent effects on frequencies and intensities of the fundamental and overtones of the C=O stretching vibrations of acetone and 2-hexanone. J. Phys. Chem. A 2014, 118, 2576–2583. [Google Scholar] [CrossRef] [PubMed]
  77. Schuler, M.J.; Hofer, T.S.; Morisawa, Y.; Futami, Y.; Huck, C.W.; Ozaki, Y. Solvation effects on wavenumbers and absorption intensities of the OH-stretch vibration in phenolic compounds—Electrical- and mechanical anharmonicity via a combined DFT/Numerov approach. Phys. Chem. Chem. Phys. 2020, 22, 13017–13029. [Google Scholar] [CrossRef]
  78. Beć, K.B.; Grabska, J.; Ozaki, Y.; Hawranek, J.P.; Huck, C.W. Influence of non-fundamental modes on mid-infrared spectra. Anharmonic DFT study of aliphatic ethers. J. Phys. Chem. A 2017, 121, 1412–1424. [Google Scholar] [CrossRef]
  79. Grabska, J.; Czarnecki, M.A.; Beć, K.B.; Ozaki, Y. Spectroscopic and quantum mechanical calculation study of the effect of isotopic substitution on NIR spectra of methanol. J. Phys. Chem. A 2017, 121, 7925–7936. [Google Scholar] [CrossRef]
  80. Beć, K.B.; Karczmit, D.; Kwaśniewicz, M.; Ozaki, Y.; Czarnecki, M.A. Overtones of νCN vibration as a probe of structure of liquid CH3CN, CD3CN, and CCl3CN: Combined infrared, near-infrared, and Raman spectroscopic studies with anharmonic density functional theory calculations. J. Phys. Chem. A 2019, 123, 4431–4442. [Google Scholar] [CrossRef]
  81. Gonjo, T.; Futami, Y.; Morisawa, Y.; Wojcik, M.J.; Ozaki, Y. Hydrogen bonding effects on the wavenumbers and absorption intensities of the OH fundamental and the first, second, and third overtones of phenol and 2,6-dihalogenated phenols studied by visible/near-infrared/infrared spectroscopy. J. Phys. Chem. A 2011, 115, 9845–9853. [Google Scholar] [CrossRef]
  82. Beć, K.B.; Futami, Y.; Wójcik, M.J.; Nakajima, T.; Ozaki, Y. Spectroscopic and computational study of acetic acid and its cyclic dimer in the near-infrared region. J. Phys. Chem. A 2016, 120, 6170–6183. [Google Scholar] [CrossRef]
  83. Beć, K.B.; Grabska, J.; Huck, C.W.; Czarnecki, M.A. Spectra–structure correlations in isotopomers of ethanol (CX3CX2OX.; X = H, D): Combined near-infrared and anharmonic computational study. Molecules 2019, 24, 2189. [Google Scholar] [CrossRef] [PubMed] [Green Version]
  84. Pizarro, C.; Esteban-Díez, I.; González-Sáiz, J.M. Mixture resolution according to the percentage of robusta variety in order to detect adulteration in roasted coffee by near infrared spectroscopy. Anal. Chim. Acta 2007, 585, 266–276. [Google Scholar] [CrossRef]
  85. Hu, Y.; Zhang, J.; Sato, H.; Futami, Y.; Noda, I.; Ozaki, Y. C-HO=C Hydrogen bonding and isothermal crystallization kinetics of poly(3-hydroxybutyrate) investigated by near-infrared spectroscopy. Macromolecules 2006, 39, 3841–3847. [Google Scholar] [CrossRef]
  86. Zhang, X.; Li, W.; Yin, B.; Chen, W.; Kelly, D.P.; Wang, X.; Zheng, K.; Du, Y. Improvement of near infrared spectroscopic (NIRS) analysis of caffeine in roasted Arabica coffee by variable selection method of stability competitive adaptive reweighted sampling (SCARS). Spectrochim. Acta A 2013, 114, 350–356. [Google Scholar] [CrossRef] [PubMed]
  87. Esteban-Díez, I.; González-Sáiz, J.M.; Pizarro, C. Prediction of sensory properties of espresso from roasted coffee samples by near-infrared spectroscopy. Anal. Chim. Acta 2004, 525, 171–182. [Google Scholar] [CrossRef]
  88. Santos, J.R.; Sarraguça, M.C.; Rangel, A.O.S.S.; Lopes, J.A. Evaluation of green coffee beans quality using near infrared spectroscopy: A quantitative approach. Food Chem. 2012, 135, 1828–1835. [Google Scholar] [CrossRef]
  89. Wang, R.; Xue, J.; Meng, L.; Lee, J.-W.; Zhao, Z.; Sun, P.; Cai, L.; Huang, T.; Wang, Z.; Wang, Z.-K.; et al. Caffeine improves the performance and thermal stability of perovskite solar cells. Joule 2019, 3, 1464–1477. [Google Scholar] [CrossRef]
  90. Barone, V. Anharmonic vibrational properties by a fully automated second-order perturbative approach. J. Chem. Phys. 2005, 122, 014108. [Google Scholar] [CrossRef]
  91. Piccardo, M.; Bloino, J.; Barone, V. Generalized vibrational perturbation theory for rotovibrational energies of linear, symmetric and asymmetric tops: Theory, approximations, and automated approaches to deal with medium-to-large molecular systems. Int. J. Quantum Chem. 2015, 115, 948–982. [Google Scholar] [CrossRef] [PubMed] [Green Version]
  92. Grimme, S.; Antony, J.; Ehrlich, S.; Krieg, H. A consistent and accurate ab initio parameterization of density functional dispersion correction (DFT-D) for the 94 elements H-Pu. J. Chem. Phys. 2010, 132, 154104. [Google Scholar] [CrossRef] [PubMed] [Green Version]
  93. Barone, V.; Biczysko, M.; Bloino, J. Fully anharmonic IR and Raman spectra of medium-size molecular systems: Accuracy and interpretation. Phys. Chem. Chem. Phys. 2014, 16, 1759–1787. [Google Scholar] [CrossRef] [PubMed]
  94. Frisch, M.J.; Trucks, G.W.; Schlegel, H.B.; Scuseria, G.E.; Robb, M.A.; Cheeseman, J.R.; Scalmani, G.; Barone, V.; Petersson, G.A.; Nakatsuji, H.; et al. Gaussian 16, Revision, B.01; Gaussian, Inc.: Wallingford, CT, USA, 2016. [Google Scholar]
  95. Bradley, M.S. Lineshapes in IR and Raman spectroscopy: A primer. Spectroscopy 2015, 30, 42–46. [Google Scholar]
  96. Pulay, P.; Forgasi, G.; Pang, F.; Boggs, J.E. Systematic ab initio gradient calculation of molecular geometries, force constants, and dipole moment derivatives. J. Am. Chem. Soc. 1979, 101, 2550–2560. [Google Scholar] [CrossRef]
Figure 1. Experimental and calculated NIR spectra of caffeine in the region of 10,000–4000 cm−1.
Molecules 26 05212 g001
Figure 2. Experimental and calculated NIR spectra of caffeine in the region of 7000–4000 cm−1. Theoretical lineshapes representing the summed bands of different origin are presented. Refer to Figures S2–S5 in Supplementary Material for better view of details.
Molecules 26 05212 g002
Figure 3. Experimental and calculated NIR spectra of caffeine in the region of 10,000–7000 cm−1. Theoretical lineshapes representing the summed bands of different origin are presented. Refer to Figures S6–S8 in Supplementary Material for a better view of details.
Molecules 26 05212 g003
Figure 4. Analysis of the contributions to NIR spectrum of caffeine based on the calculated spectrum (GVPT2//B3LYP-GD3BJ/SNSD).
Molecules 26 05212 g004
Figure 5. Molecular structure of caffeine optimized at B3LYP-D3/SNSD level of theory.
Molecules 26 05212 g005
Table 1. Vibrational contributions to NIR spectrum (in % of the integral intensity) of caffeine in selected wavenumber regions based on the calculated spectrum.
Region [cm−1]First Overt.Second Overt.Binary Comb.Ternary Comb.
10,000–400011.571.2836.9150.24
10,000–70000.0226.780.0073.20
7000–400011.850.6437.8349.67
5000–40000.010.8848.1051.01
6500–550040.520.0014.7744.70
7700–70000.050.000.0199.95
9200–84000.0042.270.0057.73
Table 2. Summarized the assignments for the major NIR peaks of caffeine based on GVPT2//B3LYP-GD3BJ/SNSD calculations.
Position [cm−1]Assignments
Exp.Calc.
40924062δrockCH3 + νsCH3; (δipring, δipCH, δrockCH3) + νasCH3
41124096δrockCH3 + νasCH3; CNtors + νasCH3
41834181ipCH, δipring) + νsCH3; CNtors + δipring + νCH
42364227ipring, δipCH) + νasCH3; δrockCH3 + νCH; δipring + νsCH3
43084282ipCH, δipring) + νsCH3; (δipCH, δipring) + νCH
44284376νas’CH3 + δsCH3; δasCH3 + νas’CH3; δsCH3 + νsCH3
44444434δsCH3 + νasCH3; νas’CH3 + δipring + δrockCH3; (δipring, δipCH) + νCH
57605761CNtors + νas’CH3 + νsCH3
58005815νas’CH3 + νsCH3
58405881asCH3
59565973νas’CH3 + νasCH3; CNtors + νas’CH3 + νsCH3
60085991as’CH3
612061112νCH
71407211νas’CH3 + δasCH3 + νsCH3
72367239νas’CH3 + δasCH3 + νsCH3
73007282δipCH, δipring + 2νCH
73447321as’CH3 + δasCH3
73727355δasCH3 + 3νasCH3; δsCH3 + 3νasCH3
85328610as’CH3 + vsCH3; νas’CH3 + 2νsCH3
87168752νas’CH3 + νsCH3 + νasCH3; νas’CH3 + νsCH3 + νCO; 3νas’CH3; νsCH3 + 2νasCH3
88128830asCH3
898089843νCH
Where: υ—stretching, δ—bending, tors—torsion, rock—rocking, oop—out-of-plane, ip—in-plane, s—symmetric, as—antisymmetric.
Table 3. Calculated (GVPT2//B3LYP-GD3BJ/SNSD) positions and intensities of the bands corresponding to two modes of caffeine, in which the C=O stretching coordinate is meaningful.
ν1C = O 1C = O 1C = O
Position [cm−1]Intensity
[km mol−1]
Position [cm−1]Intensity
[km mol−1]
Position [cm−1]Intensity
[km mol−1]
relative intensity1740206.43409.30.725100.90.064
1 0.0035 0.00031
1 0.089
ν2C = O 2C = O 2C = O
relative intensity169483.43313.60.994959.90.02127
1 0.011871 0.00026
1 0.021
Publisher’s Note: MDPI stays neutral with regard to jurisdictional claims in published maps and institutional affiliations.

