Article

Characterization of the Phenolic Fingerprint of Kolovi Extra Virgin Olive Oils from Lesvos with Regard to Altitude and Farming System Analyzed by UHPLC-QTOF-MS

by
Natasa P. Kalogiouri
,
Evangelia Kritikou
,
Ioannis C. Martakos
,
Constantina Lazarou
,
Michalis Pentogennis
and
Nikolaos S. Thomaidis
*
Laboratory of Analytical Chemistry, Department of Chemistry, National and Kapodistrian University of Athens, Panepistimiopolis Zographou, 15771 Athens, Greece
*
Author to whom correspondence should be addressed.
Molecules 2021, 26(18), 5634; https://doi.org/10.3390/molecules26185634
Submission received: 24 July 2021 / Revised: 1 September 2021 / Accepted: 13 September 2021 / Published: 17 September 2021
(This article belongs to the Special Issue Characterization of Olive Products from Greece)

Abstract

:
Extra virgin olive oil (EVOO) is recognized for its nutritional virtues and the beneficial health effects deriving from its hydrophilic fraction (phenolic acids, phenolic alcohols, flavonoids, and secoiridoids). The phenolic compounds of EVOOs possess multiple biological properties such as antioxidant, antimicrobial, anticarcinogenic, and anti-inflammatory properties, among others. Considering that EVOOs produced in Greece are recognized as high-quality products due to their rich phenolic content, it is imperative to characterize Greek monovarietal EVOOs and ensure that their uniqueness is closely linked to their botanical and territorial origin. In this work, an ultra-high-performance liquid chromatography–quadrupole time-of-flight tandem mass spectrometry (UHPLC-QTOF-MS) analytical method combined with target and suspect screening was used to characterize monovarietal EVOOs of the Kolovi variety from Lesvos, and thereby establish their phenolic fingerprint. Overall, 25 phenols were determined, and the total quantification and semi-quantification results ranged between 251 and 1230 mg/kg, highlighting the high phenolic content of the Kolovi variety from the island of Lesvos in the North Aegean.

Graphical Abstract

1. Introduction

Olive oil, the emblematic food of the Mediterranean diet, is recognized for its nutritional value and health benefits. Olive oil holds a powerful and special place at the base of the Mediterranean Diet Pyramid as the principal source of fat, consisting of low concentrations of saturated fat and high concentrations of monounsaturated and polyunsaturated fat, as well as a variety of other bioactive compounds [1,2]. Furthermore, numerous studies have associated olive oil consumption with lower mortality rates of cardiovascular disease and cancer indices, as well as eliminated risk for neurodegenerative diseases, among others, and better well-being [3,4,5,6,7,8].
The nutritional value, health properties, flavor, and taste have been associated with olive oil’s minor constituents of the polar phenolic fraction, phenolic compounds. However, the phenolic profile varies among cultivars and critically depends on the geographical origin [9,10,11], the type of farming [12,13], and the production system [14,15], among other factors, such as irrigation, fertilization practices, and pruning, in combination with several technological factors [16].
The olive tree Olea europaea L. has diverged naturally into many cultivars in the Mediterranean basin. A total of 69% of global olive oil production takes place in Spain, Italy, Greece, Portugal, France, Slovenia, Croatia, Cyprus, and Malta, while Spain, Italy, Greece, and Portugal together account for about 99% of the production in the E.U. [17]. As far as Greece is concerned, even though the total number of the olive cultivars is greater than 40, more than 90% of the territory is cultivated with 20 of them (Agouromanakolia, Adramytiani, Amigdalolia, Athinolia, Asprolia, Valanolia, Vasilikada, Gaidurelia, Dafnelia, Thiaki, Kalamon, Kalokerida, Karolia, Karidolia, Kothreiki, Kolompada, Konservolia, Koroneiki, Koutsourelia, Lianolia, Kerkiras, Kalamon, Kalokerida, Karolia, Karidolia, Kothreiki, Kolimpada, Konservolia, Koroneiki, Koutsourelia, Lianolia, Kerkiras, Mavrelia, Megaritiki, Mittolia, Strogilolia, Throumbolia, Tragolia) [18]. Greece holds a prominent place in the olive oil and table olives market. According to the International Olive Council (IOC), Greece occupies the first place in the consumption of olive oil per capita per year (16 kg), while at the same time it is ranked as the world’s leading exporter of Extra Virgin Olive Oil (EVOO) [19].
One of the largest cultivation territories of Greece is the island of Lesvos. EVOOs originating from Lesvos are allowed to market under Protected Geographical Indication (PGI) [EU No 1151/2012] [20]. In Lesvos, traditional Greek varieties such as Koroneiki and Ladoelia are cultivated alongside local varieties of Kolovi, Adramytiani, and Agrielia. Recent studies have revealed the high nutritional value of olive oils produced by olive fruits of the Kolovi variety. Even though the fingerprints of other Greek cultivars belonging to different varieties, such as Koroneiki [21,22], Kalamon [23] etc., have already been described, limited data are available about the Kolovi variety. A few reports are available concerning the determination of bioactive constituents, such as phenolic compounds, tocopherols, carotenoids, and squalene [24,25,26]. Still, there are no studies available presenting an in-depth study of the phenolic fraction of olive oils produced by Kolovi olive fruits.
Several works have been published for the determination of phenolic constituents in EVOOs with traditional analytical methodologies employing High Pressure Liquid Chromatography (HPLC) coupled to UV [27,28,29] or Diode Array Detection (DAD) [30,31,32]. Gas Chromatography (GC) [33,34] is not widely applied due to the low volatility of phenolic compounds. Nuclear Magnetic Resonance (NMR) methodologies enable the determination of a wide range of phenolic compounds [35,36,37]. The revolution of “omics” technologies, however, has introduced high-throughput analytical techniques in food profiling studies through target and non-target analysis. High-Resolution Mass Spectrometry (HRMS) enables the detection of a great number of features, following the “foodomics approaches” that can be grouped as “profiling”, analyzing target analytes, or “fingerprinting”, which is based on the analysis of the whole food metabolome [38]. Target screening is based on the determination of already known analytes with commercially available standards, and suspect screening is applied for the analysis of compounds that are expected to exist in the matrix, and can be screened using the exact mass of their molecular ions, and follow a specific flow chart with diagnostic criteria for their tentative identification [38,39,40]. In this respect, HRMS enables the analysis of analytes for which there are no available commercial standards, and thus they cannot be determined by traditional analytical methodologies. The use of ultra-high-performance liquid chromatography coupled to quadrupole time-of-flight mass spectrometry (UHPLC-QTOF-MS) enables the tentative identification of suspect phenolic compounds in EVOOs providing high mass accuracy, making possible to generate isotopic patterns, improving the accuracy of chemical formula prediction, and library matching. Considering that there are no available commercial analytical standards for several phenolic phytochemicals found in EVOOs, the latest analytical challenge is the determination of the EVOOs polar fraction, raised after the establishment of the health claim for EVOOs that contain 5 mg of hydroxytyrosol and derivatives (e.g., oleuropein complex and tyrosol) per 20 g oil, according to the EC Reg. 432/2012 [41]. Additionally, the bioactive profile is closely associated with the olive cultivar [42] and the geographical origin [43], along with the farming system (organic or conventional) [26], and several other processing factors [36,37], and thus it is worth evaluating the impact of such agronomical parameters on the total phenolic content of monovarietal EVOOs.
The purpose of this study was to investigate and highlight the phenolic profile of monovarietal EVOOs of the Kolovi variety by target and suspect UHPLC-QTOF-MS. Moreover, an investigation is carried out regarding the concentration levels of phenolic compounds and their changes with altitude, and the type of farming (organic or conventional) in monovarietal EVOOs produced by two-phase centrifugation systems, within a two-year study.

2. Results and Discussion

2.1. Phenolic Profiling and Fingerprinting Results

2.1.1. Target Screening Results

A target data-dependent method was employed to scan the presence of 14 target compounds (caffeic acid, ferulic acid, gallic acid, homovanillic acid, p-coumaric acid, syringic acid, hydroxytyrosol, tyrosol, vanillin, apigenin, epicatechin, luteolin, oleuropein, and pinoresinol) in real Kolovi EVOO samples. Five compounds were determined. These were tyrosol and hydroxytyrosol from the class of phenolic alcohols, apigenin and luteolin from the class of flavonoids, and pinoresinol from the class of lignans. The retention time (tR) shift was less than 0.04 min for all the detected compounds. The mass accuracy of the precursor and qualifier ions was lower than 2.5 mDa, compared to the standard solutions, and the isotopic fit was lower than 100 mSigma in all cases. The fragments were verified on the basis of MS/MS records in the literature [24,26]. The target screening results are presented in Table 1.
For the quantification of the target phenolic compounds, normalized calibration curves were constructed for hydroxytyrosol, tyrosol, apigenin, luteolin, and pinoresinol. Mixed standard working solutions were prepared before analysis by appropriate dilution of the stock solutions with methanol:water (80:20, v/v) in the concentration range 0.1–12 mg/L. For each concentration level (0.1, 1, 2, 4, 8 and 12 mg/L), the peak area of each standard was divided by the peak area of the internal standard (syringaldehyde 1.3 mg/L). Indicative normalized standard calibration curves of tyrosol, hydroxytyrosol, oleuropein, apigenin, luteolin and pinoresinol for one laboratory day, with r2 above 0.99, are presented in Table S1, in the Supplementary Information. The identified phenolic compounds were further quantified, and the target quantification results, expressed as mg/kg, are presented in Table S2.
Hydroxytyrosol and tyrosol are the main phenolic alcohols identified in olive oils, and were determined in the ranges 0.15–59.0 mg/kg and 0.36–46.5 mg/kg, respectively. Hydroxytyrosol exhibits antioxidant, anti-inflammatory, and chemopreventive properties, while tyrosol has antioxidant and anti-inflammatory action [44]. Furthermore, hydroxytyrosol has been indicated to have a radio-protective effect on human skin [45]. In addition, hydroxytyrosol has been shown to improve tumoral and cardiac diseases with effects similar to those of oleuropein, while it protects against atherosclerosis and against diabetic neuropathy, as well [46].
From the class of flavonoids, apigenin was determined in the range 0.14–13.9 mg/kg, and luteolin in the range 0.22–7.71 mg/kg. Both flavonoids exhibit strong antioxidant activity, protecting against cancer [47]. From the class of lignans, pinoresinol was determined in the range 0.45–11.5 mg/kg, and has been shown to exhibit strong antioxidant and anti-inflammatory properties [48].

2.1.2. Suspect Screening Results

A suspect list with 95 phenolic compounds, including all the possible secoiridoid derivatives of the oleuropein complex, previously published from our group [26], was used to scan their potential occurrence in the analyzed EVOOs. The initial suspect list is presented in Table S3. Overall, 20 phenolic compounds were tentatively identified in Kolovi EVOOs through suspect screening. The tR shift of the compounds did not exceed ±0.18 min, and was compared to the corresponding predicted tR of an in-house Quantitative Structure-Retention Relationship (QSRR), already published by our group [23]. Hydroxytyrosol acetate, decarboxymethyl lingstroside aglycone (oleocanthal), decarboxymethyl oleuropein aglycone (oleacein), 10-hydroxy-10-methyl oleuropein aglycone, 10-hydroxy-decarboxymethyl oleuropein aglycone, 10-hydroxy oleuropein aglycone, lingstroside aglycone, lingstroside aglycone monoaldehydic form, lingstroside aglycone dialdehydic form, oleokoronal, methyl oleuropein aglycone, oleuropein aglycone, oleuropein aglycone monoaldehydic form, oleuropein aglycone dialdehydic form, oleomissional, 1-acetoxypinoresinol, 1-hydroxypinoresinol, syringaresinol, elenolic acid and the hydroxylated form of elenolic acid were tentatively identified after examining the MS/MS spectra with Metfrag [49] and literature records [23,26,50]. Table 2 presents the suspect screening results, providing information about the MS/MS fragmentation of each compound, and the experimental tR.
The Extracted Ion Chromatograms (EICs) of lingstroside aglycone (Figure S1) and oleuropein aglycone (Figure S2) showed four different peaks. Lingstroside and oleuropein are stabilized by the presence of the lingstroside residue. The removal of the glucose exposes the labile hemiacetal carbon that undergoes ring opening resulting in a series of subsequent transformations [51,52].
Figure 1 presents a proposed series of reactions of oleuropein and lingstroside. Compound I (10-hydroxy oleuropein aglycone) was identified in all the analyzed samples. Compound (4) (oleuropein aglycone dialdehydic form) after reaction with the extracting solvent (methanol:water) transforms to 10-hydroxy-10-methyl oleuropein aglycone, which after dehydration converts to methyl oleuropein aglycone. Oleuropein aglycone, the enol form of oleuropein aglycone (also referred as oleuropendial or oleomissional [53]), the dialdehyde of oleuropein aglycone, and monoaldehyhydic oleuropein aglycone were tentatively identified, according to Kalogiouri et al. [26]. The MS/MS spectra with the characteristic m/zs explained are presented in Figure S3. The derivatives of lingstroside, i.e., lingstroside aglycone, the enol form of lingstroside aglycone (also referred as oleokoronal [53]), the dialdehyde of lingstroside aglycone, and the monoaldehydic lingstroside aglycone were tentatively identified, as well, as shown in Table 2. The compounds II and III—the cannizzaro product and its lactone, shown in Figure 1—were not identified in any of the analyzed EVOOs.
The suspect compounds were semi-quantified on the basis of the commercially available standards for each class. In this respect, the lignans 1-acetoxypinoresinol, 1-hydroxypinoresinol and syringaresinol were semi-quantified with the calibration curve of pinoresinol; hydroxytyrosol acetate, oleocanthal, oleacein, 10-hydroxy decarboxymethyl oleuropein aglycone, elenolic acid and the hydroxylated form of elenolic acid were quantified with the calibration curve of hydroxytyrosol; 10-hydoxy-10-methyl oleuropein aglycone, 10-hydroxy oleuropein aglycone, the four isomers of lingstroside aglycone, methyl oleuropein aglycone and the four isomers of oleuropein aglycone were quantified with the calibration curve of oleuropein. The semi-quantification of all the individual phenolic compounds determined in the analyzed EVOOs are presented in Table S4, expressed as mg/kg.
Oleuropein is the major secoiridoid in olives. It decreases during olive oil processing to form derivatives. The sum of oleuropein aglycone, oleuropein aglycone monoaldehydic form, oleuropein aglycone dialdehydic form, and oleomissional ranged between 6.49 and 732 mg/kg. This dominant phenolic substance of VOOs/EVOOs is gaining attention due to its valuable biological properties, such as antioxidative, anti-inflammatory, anti-breast-cancer, anti-Alzheimer’s-disease, anti-hyperglycemic-effect, and lipid-lowering properties. The second most abundant secoiridoid was lingstroside aglycone, ranging between 8.21 and 360 mg/kg. Lingstroside aglycone exhibits antioxidant activity and anticarcinogenic properties [5], and it was recently referred to in the literature as a novel nutraceutical against osteoarthritis [6]. Decarboxymethyl oleuropein aglycone (oleacein), which has been shown to exhibit hypotensive, antimicrobial and anti-inflammatory properties [7], offering skin protection and reduction of disorder due to metabolic syndrome [54], was determined in the range 0.89–55.1 mg/kg. Moreover, decarboxymethyl lingstroside aglycone (oleocanthal), which has attracted great interest after a recent study that reported its strong anti-inflammatory capacity, acting similarly to the non-steroidal anti-inflammatory drug ibuprofen [8], was determined in the range 3.27–31.9 mg/kg. High concentrations of oleuropein derivatives were determined, as well. The highest determined concentration of methyl oleuropein aglycone was 732 mg/kg, followed by 10-hydroxy-10-methyl oleuropein aglycone (up to 99.2 mg/kg), followed by 10-hydroxy-oleuropein aglycone (up to 33.3 mg/kg), and 10-hydroxy-decarboxymethyl-oleuropein aglycone (up to 5.04 mg/kg). Hydroxytyrosol acetate, a hydroxytyrosol derivative, ranged between 2.30 and 28.9 mg/kg. The highest concentration observed for elenolic acid was 7.16 mg/kg, while this was 0.57 mg/kg for hydroxylated elenolic acid. From the class of lignans, 1-hydroxypinoresinol ranged between 0.19–2.87 mg/kg, while higher concentrations were determined for acetoxypinoresinol and syringaresinol, 84.4 mg/kg and 289 mg/kg, respectively.
The identified secoiridoids demonstrate favorable health effects in relation to oxidative stress and antithrombotic profiles, cardiovascular risk factors, blood pressure and lipids profile, endothial dysfunction, postprandial hyperlipidemia, acting against chronic diseases such as cancer, obesity, and diabetes [55].
Even though the scientific issue concerning which compounds should be included in EC Reg. 432/2012 [41] is still under discussion, and no specific method has yet been adopted in the regulation for measuring olive oil polyphenols, Tsimidou et al. [56] recently proposed the quantification of tyrosol and hydroxytyrosol, in an attempt to clarify which compounds should be summed up to give the amount of free or in bound forms, with some groups supporting that individual phenolics should be summed up to give the amount of 250 mg per 1 kg of olive oil. According to this, tyrosol, hydroxytyrosol and their derivatives were summed up, and 76 out of the total 91 monovarietal Kolovi EVOOs, corresponding to 78% of the analyzed samples, were found to support the Health Claim, as graphically illustrated in Figure 2. The phenolic content supporting EC Reg. 432/2012 ranged between 130 and 1218 mg/kg, and 78% of the analyzed Kolovi EVOOs could be labeled as “contributing to the protection of blood lipids from oxidative stress”.

2.2. Phenolic Content and Agronomical Factors

Several factors interfere with the synthesis of phenolic compounds in EVOOs. Among them, the olive cultivar [42], the geographic origin [43], the climate [57], the degree of maturation [58], the crop season [59], postharvest storage, crushing, and malaxation, as well as after-production storage, affect the phenolic composition [36,37].
It is generally accepted that in monovarietal EVOOs of the same origin, the farming type and the altitude play a significant role. Even though the characterization of a large number of VOOs/EVOOs with reference to only one factor at a time is not an easy task, great effort was made to collect EVOOs harvested during the same period (between December and January) within a two-year study to detect any potential changes in the climate conditions. The collected samples were processed under similar conditions, i.e., produced with two-phase centrifugation systems, malaxation temperature up to 30 °C, and stored in glass bottles to facilitate the comparisons of their phenolic contents in terms of altitude and farming type (organic or conventional).

2.2.1. Altitude

The comparison of the quantification results of all the target analytes and the semi-quantification results of all the suspects in comparison with the altitude showed that the phenolic content was higher in EVOOs originating from medium and high altitudes for the two harvesting periods. Specifically, the average phenolic content of EVOOs originating from low altitudes (below 100 m) was equal to 361 mg/kg during the harvesting period 2016–2017, and 375 mg/kg during the harvesting period 2017–2018, respectively. The phenolic content of EVOOs originating from territories with medium (100–300 m) and high altitude (300–600 m), was higher compared to those originating from lower altitude, 454 mg/kg and 442 mg/kg during the harvesting period 2016–2017, respectively. The same applied for the phenolic content of the analyzed samples of the following harvesting period (2017–2018), with an average phenolic content of 562 mg/kg for those originating from territories with medium altitude, and 563 mg/kg for those originating from territories with high altitude. These results are in accordance with a recent work by Theodosi et al. [60], stating that the quality characteristics of olive oils change depending on the altitude, reporting that the total phenolic content augments with altitude level [60]. Obviously, there is a positive correlation between the climatic and geographic parameters and the production zones in the phenolic composition of the EVOOs. In contrast, another work by Mousa et al. [61] showed that the phenolic content was higher in EVOOs originating from territories lower than 100 m, compared to samples grown at 800 m. In this case, the disagreement with our results is perhaps due to the large differences in temperature in such high-altitude ranges, or the local pedoclimatic conditions, and rainfall, suggesting that altitude does not have a definitive influence, and may be counteracted by the effects of other geoclimatic factors, as well [43]. In agreement with Borges et al. [43] and Dabbou et al. [62], positive correlation was found between the concentration of polyphenols and altitude.
Figure 3 shows that the EVOOs produced during the harvesting period 2016–2017 in territories with low altitude presented a lower phenolic content on average (361 mg/kg). Moreover, the olive oils from medium and high altitude had a higher phenolic content on average (454 mg/kg and 442 mg/kg, respectively). Analysis of Variance (ANOVA) showed that there was a statistically significant difference between the EVOOs from territories with low and medium altitude of cultivation (p = 0.038). In other cases, the differences were not statistically significant (p-value < 0.05).
Figure 4 shows that the EVOOs produced during the harvesting period 2017–2018, originating from territories with low altitude presented a lower phenolic content on average (375 mg/kg). Moreover, the olive oils from medium and high altitude had a higher phenolic content on average (562 mg/kg and 563 mg/kg, respectively). ANOVA showed that the olive olives from locations with medium and high altitude of cultivation did not differ statistically (p = 0.99). On the other hand, the olive oils from locations at low altitude had a statistically significant difference compared to the olive oils from locations at medium and high altitude (p-value < 0.05).
Τhe average concentrations of the major target phenolic compounds, tyrosol and hydroxytyrosol, were also statistically analyzed to evaluate the concentration of the individual compounds was affected by altitude. During the crop year 2016–2017, the average concentration of hydroxytyrosol was equal to 17.2 mg/kg in EVOOs from low-altitude territories, 13.6 mg/kg in those originating from medium-altitude territories, and 22.0 mg/kg in EVOOs originating from cultivars at higher altitude. ANOVA showed that the concentration of hydroxytyrosol did not differ statistically between the analyzed EVOOs (p = 0.418). The average concentration of hydroxytyrosol during the crop year 2017–2018 was 2.29 mg/kg in EVOOs originating from low altitude, 3.00 mg/kg in EVOOs from medium-altitude cultivars, and 4.36 mg/kg in EVOOs originating from territories at high altitude, respectively. ANOVA showed that the concentration of hydroxytyrosol did not differ statistically between the EVOOs (p = 0.380). As for tyrosol, during 2016–2017, the average calculated concentrations were 9.67 mg/kg in EVOOs from low altitude, 10.7 mg/kg in those originating from medium altitude, and 15.2 mg/kg in EVOOs from higher altitude, respectively. The statistical analysis showed that the concentration of tyrosol did not differ significantly in EVOOs originating from cultivars from different altitudes. During 2017–2018, the average concentration of tyrosol was approximately the same for the three zones, specifically, 2.55 mg/kg in EVOOs from low altitude, 3.08 mg/kg in EVOOs from medium altitude, and 2.67 mg/kg in EVOOs from high altitude, and there were no statistically significant differences among the results (p = 0.780).

2.2.2. Farming Type

Different growing potentially affects the phenolic composition of olives, and consequently intervenes in the quality properties of the produced EVOOs [12]. According to the literature, the results are controversial [8]. Despite general perception of consumers that organic products are richer in nutrients [42,43], some works have reported differences in the concentration levels of individual phenols [17], and no significant differences in the average phenolic content [44], while others report higher phenolic concentration on olive oils from organic farming systems [43,45,46]. The effect of conventional and organic farming types on olive fruits and the produced EVOOs constitutes a major scientific issue and a critical topic of generalized discussion. For this reason, the phenolic content of the analyzed EVOOs was compared with respect to the type of farming.
According to Figure 5, the EVOOs produced during the harvesting period 2016–2017 had similar average phenolic content for both types of cultivar (417 mg/kg for organic and 429 mg/kg for conventional). In addition, the difference between organic and conventional cultivars was not statistically significant, as ANOVA showed a p-value > 0.05 (p = 0.78).
On the basis of Figure 6, the olive oils from the conventional cultivar had a slightly higher average phenolic content (538 mg/kg) compared to the olive oils from the organic cultivar (483 mg/kg) during the harvesting period 2017–2018. However, the results of ANOVA showed that there was no statistically significant difference between the two types of cultivar (p = 0.43).
The results of this work indicate no significant differences in the average phenolic content between EVOOs grown with organic and conventional farming. Specifically, the average phenolic content was equal to 417 mg/kg for organic, and 429 mg/kg for conventional EVOOs, respectively, harvested in 2016–2017. The average phenolic content in EVOOs produced in the following harvesting year, 2017–2018, did not present any significant differences, either (organic EVOOs: 483 mg/kg; and conventional EVOOs: 538 mg/kg).
Τhe p-value for the interaction between altitude and farming type with two-way ANOVA proved that there was no statistically significant interaction between the two factors and the phenolic content (p-value > 0.05).
The average quantification results of hydroxytyrosol and tyrosol were equal to 12.0 mg/kg and 11.0 mg/kg in organic cultivars during the crop year 2016–2017, and 3.88 mg/kg and 2.85 mg/kg during the crop year 2017–2018, respectively. As for conventional cultivars, the average concentration of tyrosol was equal to 11.5 mg/kg in EVOOs produced in 2016–2017, and 2.84 mg/kg in EVOOs produced 2017–2018. The average concentration of hydroxytyrosol was equal to 18.5 mg/kg during 2016–2017, and 3.04 mg/kg during 2017–2018. The ANOVA analysis showed that there was no statistically significant difference between the concentration of hydroxytyrosol and tyrosol and the type of farming for both crop years (p-value > 0.05, in all cases).
Overall, the total sum of all the target and suspect phenolic compounds ranged between 237 and 737 mg/kg, with an average value of 425 mg/kg for the EVOOs produced during 2016–2017, and between 151 and 1230 mg/kg for the EVOOs produced during 2017–2018, with an average value of 522 mg/kg. The increase in the average concentration and sum between the two crop years could be associated with changes in the weather conditions, and especially temperature and rainfall (since the analyzed samples were produced in cultivars that were naturally watered by rain) within the two crop years. These findings suggest that further analysis should be carried out to evaluate the effects of weather conditions on the phenolic content between different crop years.

3. Materials and Methods

3.1. Chemicals and Standards

Methanol (LC-MS grade) and sodium hydroxide (>99%) were acquired from Merck (Darmstadt, Germany). Ammonium acetate (≥99%) and formic acid (LC-MS Ultra) were purchased from Fluka (Buchs, Switzerland). Isopropanol was obtained from Fisher Scientific (Geel, Belgium). Ultrapure water was obtained using a Milli-Q purification system (Millipore Direct-Q UV, Bedford, MA, USA).
Syringic acid 95% was purchased from Extrasynthèse (Genay, France). Gallic acid 98%, ferulic acid 98%, epicatechin 97%, p-coumaric 98%, oleuropein 98%, homovanillic acid 97%, syringaldehyde 98%, and pinoresinol 95% were purchased from Sigma-Aldrich (Steinheim, Germany). Hydroxytyrosol 98% and luteolin 98% were acquired from Santa Cruz Biotechnologies. Caffeic acid 99%, vanillin 99%, apigenin 97%, and tyrosol 98% were purchased from Alfa Aesar (Karlsruhe, Germany). Stock standard solutions of each analyte (1000 mg/L) were solubilized in methanol and stored at −20 °C in dark brown glass bottles. Mixed standard working solutions were prepared every laboratory day by appropriate dilution of the stock solutions with methanol:water (80:20, v/v) in the concentration range of 0.1–12 mg/L.

3.2. Instrumentation

A UHPLC system with an HPG-3400 pump (Dionex UltiMate 3000 RSLC, Thermo Fisher Scientific, Germany) coupled to a QTOF mass spectrometer (Maxis Impact, Bruker Daltonics, Bremen, Germany) was used for the analysis. Separation was carried out using an Acclaim RSLC C18 column (2.1 × 100 mm, 2.2 μm) purchased from Thermo Fisher Scientific (Driesch, Germany) with an ACQUITY UPLC BEH C18 pre-column (1.7 μm, VanGuard precolumn, Waters, Ireland). The column temperature was set at 30 °C. The mobile phase consisted of (A) 90% water, 10% methanol and 5 mM CH3COONH4, (B) 100% methanol and 5 mM CH3COONH4. The following gradient program was used: starting with 1% of B and a flow rate of 0.2 mL/min for 1 min, gradually increasing to 39% in the next 2 min, and then increasing to 99.9% and a flow rate of 0.4 mL/min for the following 11 min. These conditions remained constant for 2 min (flow rate 0.48 mL/min) and then the initial conditions (99% A, 1% B) were restored within 0.1 min (the flow rate decreased to 0.2 mL/min) for re-equilibration of the column.
The QTOF MS system was equipped with an electrospray ionization (ESI) interface, operating in a negative mode with the following settings: capillary voltage of 3500 V, end plate offset of 500 V, nebulizer pressure of 2 bar (N2), drying gas flow rate of 8 L/min (N2) and drying temperature of 200 °C. External calibration was performed daily with a sodium formate cluster solution consisting of 10 mM sodium formate in a mixture of isopropanol:water (1:1, v/v). Additionally, the calibration solution was injected at the beginning of each run, and a segment (0.1–0.25 min) in every chromatogram was used for internal calibration. Full scan mass spectra were recorded in the range from 50 to 1000 m/z, with a scan rate of 2 Hz. MS/MS experiments were conducted using data dependent acquisition (AutoMS, otofControl, Bruker Daltonics, Bremen, Germany) mode based on the fragmentation of the five most abundant precursor ions per scan. The instrument provided a typical resolving power (full width at half maximum) between 36,000 and 40,000 at m/z 226.1593, 430.9137, and 702.8636.

3.3. Sampling

EVOOs of the Kolovi variety were collected from Lesvos island during the harvesting periods 2016–2017 (n = 35) and 2017–2018 (n = 62). The EVOOs were acquired from various locations of Lesvos, which are presented in Figure 7. The selected samples originated from cultivars that were not irrigated and no fertilizers were used, either. The altitudes at which the olive trees were cultivated and the types of farming (organic, conventional) were different among the samples, while all EVOOs were produced with a two-phase decanter, and stored in amber glass bottles at 4 °C until analysis. Table S5 presents more information about the EVOOs for the two harvest years (territory, altitude, type of farming).

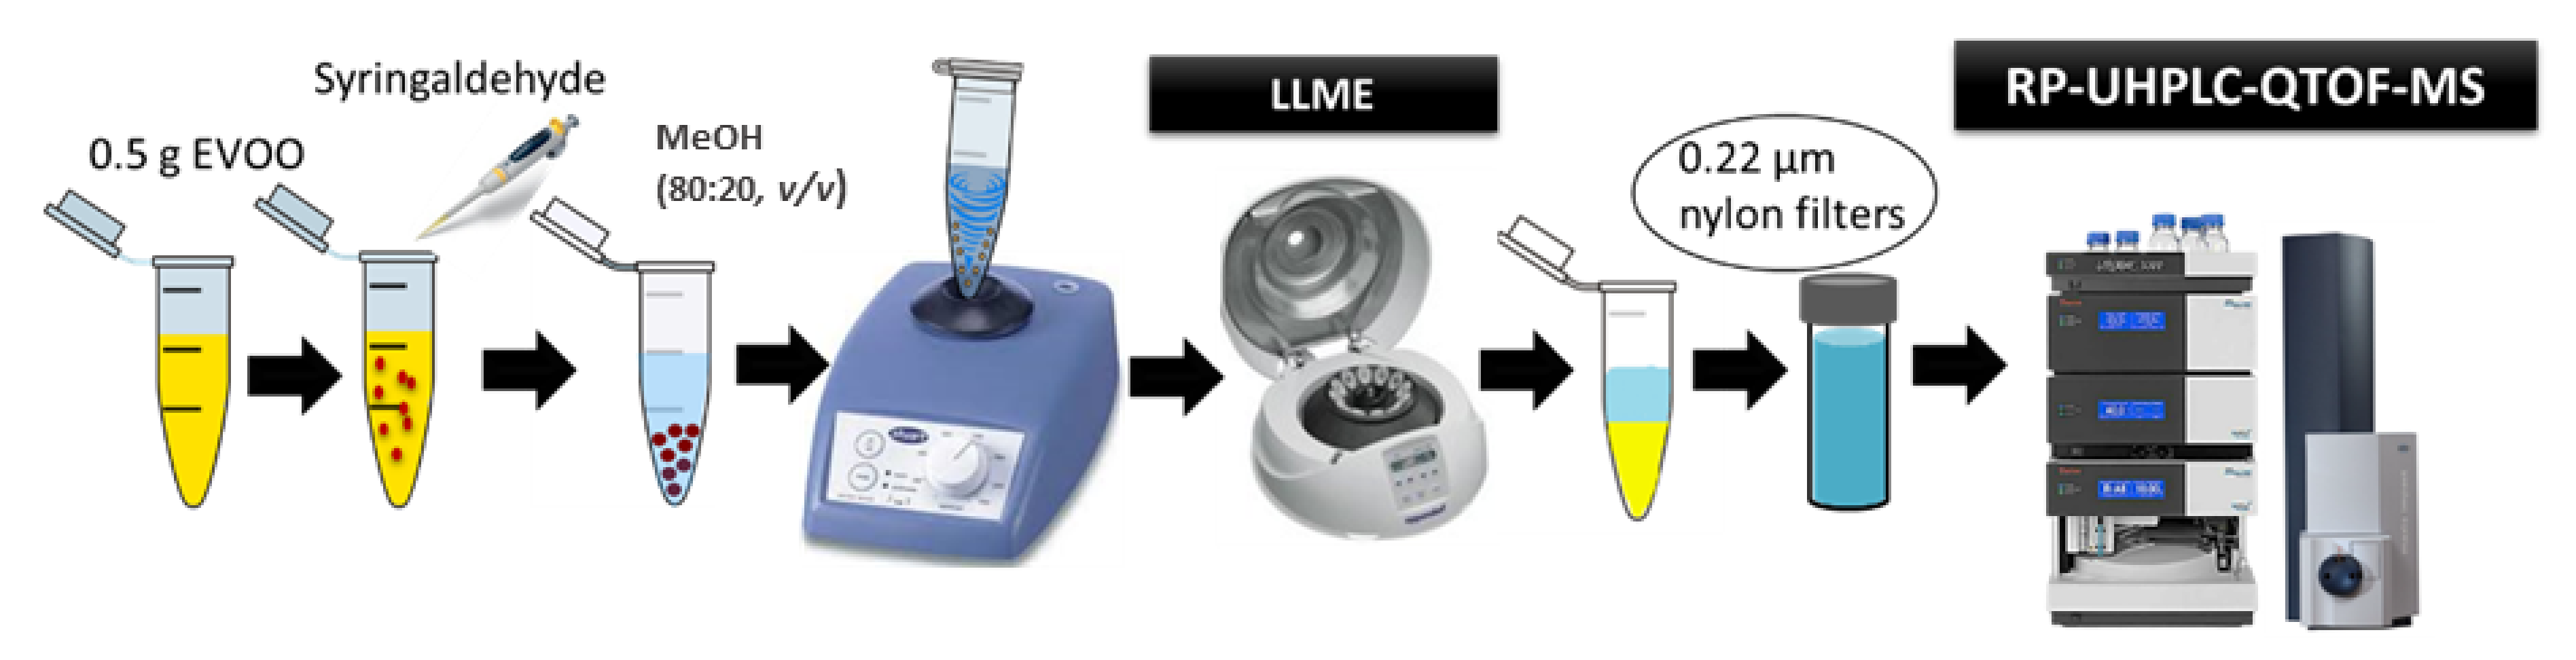
3.4. Sample Preparation

A liquid–liquid micro-extraction (LLME) method was used in order to isolate the phenolic compounds from the olive oil samples [26]. The LLME protocol applied in the analysis of EVOOs is schematically illustrated in Figure 8. In brief, 0.5 g (± 0.005) of sample was weighed in a 2 mL Eppendorf tube and spiked with 1.3 mg/L internal standard. For the extraction, 0.5 mL of methanol:water (80:20, v/v) was added. Then, the mixture was vortexed for 2 min and centrifuged for 5 min at 13,400 rpm. In the next step, the upper phase was collected and filtered through membrane syringe filter of regenerated cellulose (CHROMAFIL® RC) (15 mm diameter, 0.22 µm pore size, purchased from Macherey-Nagel, Düren, Germany). The extracts were stored at −80 °C prior to analysis. Finally, 5 µL of this solution was injected into the chromatographic system.

3.5. Quality Control

Quality control (QC) samples were used to ensure that the analytical system was stable during analysis. A QC sample was prepared by mixing aliquots of all samples according to Want et al. [63], and was spiked with a standard solution mixture (1 mg/L) that comprised apigenin, gallic acid, hydroxytyrosol, oleuropein, and tyrosol. The QC sample was used to stabilize the analytical system prior to the analysis of the main batch of samples and assess its performance. In the beginning of the analysis, the QC sample was injected 5 times for conditioning and then, it was injected every 10 sample injections throughout the analytical run to provide a set of data and inspect the performance of the analytical system. Procedural blanks were also prepared and processed in the chromatographic system to detect any potential contamination. The quality control results are presented in Table S6. The %RSD areas of the standard compounds ranged between 2.57–4.46% (n = 11). The tR shift was in the range 0.04–0.08% (n = 11), and the mass error was less than 0.16 mDa, confirming the good performance of the analytical system.

3.6. Fingerprinting Strategies

3.6.1. Target Screening

The applied RP-UHPLC-ESI-QTOF-MS/MS methodology has been previously validated and proved suitable for identification and quantification purposes [26]. For the identification of target analytes, a target screening workflow was applied. Target screening is based on the determination of analytes using standard solutions for confirmation [64]. A reference standard is necessary to compare and match the experimental tR and the MS/MS fragments. A target list was created from the literature including 14 significant phenolic compounds that have already been identified in VOOs/EVOOs. The list consisted of different classes of compounds, such as caffeic acid, ferulic acid, gallic acid, homovanillic acid, p-coumaric acid and syringic acid from the class of phenolic acids; hydroxytyrosol and tyrosol from phenolic alcohols; vanillin from the class of phenolic aldehydes; apigenin, epicatechin and luteolin from the class of flavonoids; oleuropein from the class of secoiridoids; and the lignan pinoresinol. The initial target list with the molecular formulas of the target compounds, their calculated molecular ions in negative ESI, and tRs can be found in Table S7.
Target screening was followed using Bruker software packages (Bruker Daltonics, Bremen, Germany) TASQ 1.4 and DataAnalysis 4.3 in combination with other tools available in these packages, such as SmartFormula Manually and Bruker Compass Isotope Pattern. EICs were obtained according to the following parameters: mass accuracy window up to 2.5 mDa, isotopic fit below or equal to 100 mSigma (mSigma value is a measure for the goodness of fit between measured and theoretical isotopic pattern), signal-to-noise (S/N) threshold was set at 3, minimum peak area threshold was set at 2000 and minimum ion intensity threshold was set at 500. Relative tolerance of the tR window was set lower than ±0.2 min. The target analytes were identified on the basis of mass accuracy, retention time, isotopic pattern and MS/MS fragments.

3.6.2. Suspect Screening

A suspect list generated from the literature including all the phenolic compounds that have already been identified in VOOs/EVOOs and different organs of Olea europaea L. in a previous study of our group [26], was used to scan the potential presence of 95 phenolic compounds in the analyzed samples. The suspect list is presented in Table S3. Similar to target screening, Bruker software packages (Bruker Daltonics, Bremen, Germany) TASQ 1.4 and DataAnalysis 4.3 were used for suspect analysis. The masses of the deprotonated ions were calculated based on their molecular formulas and EICs were created using the following parameters: mass accuracy threshold up to 2.5 mDa, isotopic fit below or equal to 100 mSigma, minimum peak area threshold was set to 3000 and minimum ion intensity threshold was set to 800. The suspect identification workflow incorporated strict filtering steps, interpretation of the MS/MS spectra and tR prediction, as rpeviosly described by Kalogiouri et al. [26,50]. The MS/MS fragments were interpreted using Metfrag and compared with the fragments and the experimental tRs reported in previous works of our group [24,26,50].

3.7. Statistical Analysis

Statistical analysis was performed using one-way ANOVA from Data Analysis tool of Microsoft Excel (Microsoft, WA, USA) at a 95% confidence level. In addition, two-way ANOVA was applied to evaluate if there were significant statistical differences between all factors (altitude and farming type) and the phenolic content of the analyzed samples, comparing the quantification and semi-quantification results at a 95% confidence level.

4. Conclusions

This study contributes to the field of olive oil authenticity and traceability with the introduction of a LLME-RP-UHPLC-QTOF-MS analytical methodology employing target and suspect screening. Ninety-seven monovarietal Kolovi EVOOs produced during the harvesting years 2016–2017 and 2017–2018 were analyzed and five phenolic compounds were identified with target screening, and 20 with suspect screening. The target analytes were quantified based on their commercially available reference standards, and the suspect compounds were semi-quantified on the basis of target compounds having similar structures.
The calculation of the olive oil polyphenols supporting the EC Reg. 432/2012 ranged between 130 and 1218 mg/kg, indicating that 78% of the analyzed monovarietal Kolovi EVOOs could be labeled with the Health Claim “contributing to the protection of blood lipids from oxidative stress”. The total sum of all the target and suspect phenolic compounds ranged between 237 and 737 mg/kg, with an average value of 425 mg/kg for the EVOOs produced during 2016–2017, and between 151 and 1230 mg/kg for the EVOOs produced during 2017–2018, with an average value of 522 mg/kg. The high phenolic content highlights the high nutritional value and several health-related properties related to the consumption of the Kolovi EVOOs. The identified phenolic compounds demonstrate favorable health effects in relation to oxidative stress and antithrombotic profiles, cardiovascular risk factors, acting against chronic diseases such as cancer, obesity, diabetes, acting against Alzheimer’s disease, exhibiting hypotensive, antimicrobial and anti-inflammatory properties. These findings strongly suggest that Kolovi EVOOs, beyond adequate nutrition, improve health and promots well-being.
Furthermore, the evaluation of the agronomical factors indicated that the phenolic content of the EVOOs is strongly dependent on the altitude. The Kolovi EVOOs originating from medium (100–300 m) and high altitude (300–600 m), exhibited a significantly higher phenolic content compared to those grown in territories below 100 m. Finally, the effect of the type of farming on the phenolic content was also evaluated, and the results indicated that there is not significant statistical difference in the phenolic concentration levels between organic and conventional EVOOs.

Supplementary Materials

The following are available online, Figure S1: EIC of lingstroside transformation to: lingstroside aglycone (1); lingstroside aglycone monoaldehydic form (2); lingstroside aglycone dialdehydic form (3); oleokoronal (4), Figure S2: EIC of οleuropein transformation to: oleuropein aglycone (1); oleuropein aglycone monoaldehydic form (2); oleuropein aglycone dialdehydic form (3); oleomissional (4), Figure S3: Characteristic spectra of: (a) oleuropein aglycone; (b) oleuropein aglycone monoaldehydic form; (c) oleuropein aglycone dialdehydic; (d) oleomissional, Table S1: Standard calibration curves, Table S2: Target screening quantification results (mg/kg), Table S3: Suspect list, Tables S4: Suspect screening quantification results (mg/kg), Table S5: Geographical region, altitude, type of farming and harvesting period of the Kolovi EVOOs, Table S6: Quality Control Results, Table S7: Target list.

Author Contributions

Conceptualization, N.S.T.; Analysis, N.P.K., E.K., I.C.M., C.L., Data curation, N.P.K., E.K., I.C.M., C.L.; Methodology, N.P.K. and E.K.; Project administration, N.P.K. and N.S.T.; Supervision, N.S.T. and N.P.K.; Writing—original draft, N.P.K., E.K., I.C.M.; Writing—review & editing, M.P. and N.S.T. All authors have read and agreed to the published version of the manuscript.

Funding

This research has been financed by the Region of the North Aegean through the program “Novel wide-scope research for the promotion of N. Aegean olive oil and olive products through the designation of their unique characteristics and bioactive content”.

Institutional Review Board Statement

Not applicable.

Informed Consent Statement

Not applicable.

Data Availability Statement

Not available.

Conflicts of Interest

The authors declare no conflict of interest.

Samples Availability

Samples of the compounds are not available from the authors.

References

  1. Mazzocchi, A.; Leone, L.; Agostoni, C.; Pali-Schöll, I. The secrets of the mediterranean diet. Does [only] olive oil matter? Nutrients 2019, 11, 2941. [Google Scholar] [CrossRef] [Green Version]
  2. Estruch, R.; Ros, E.; Salas-Salvadó, J.; Covas, M.-I.; Corella, D.; Arós, F.; Gómez-Gracia, E.; Ruiz-Gutiérrez, V.; Fiol, M.; Lapetra, J.; et al. Primary Prevention of Cardiovascular Disease with a Mediterranean Diet Supplemented with Extra-Virgin Olive Oil or Nuts. N. Engl. J. Med. 2018, 378, e34. [Google Scholar] [CrossRef]
  3. Arós, F.; Ph, D.; Gómez-gracia, E.; Ph, D.; Ruiz-gutiérrez, V.; Ph, D.; Fiol, M.; Ph, D.; Lapetra, J.; Ph, D.; et al. Primary prevention of cardiovascular disease with a mediterranean diet. Zeitschrift fur Gefassmedizin 2013, 10, 28. [Google Scholar]
  4. Barjol, J.-L. Hamdbook of Olive Oil: Analysis and Properties; Aparicio, R., Harwood, J., Eds.; Springer: New York, NY, USA,, 2013. [Google Scholar]
  5. Sotiroudis, T.G.; Kyrtopoulos, S.A. Anticarcinogenic compounds of olive oil and related biomarkers. Eur. J. Nutr. 2008, 47, 69–72. [Google Scholar] [CrossRef]
  6. Meiss, M.S.; Sanchez-Hidalgo, M.; González-Benjumea, A.; Fernández-Bolaños, J.M.; Alarcón-de-la-Lastra, C.; Oreffo, R.O.; de Andrés, M.C. Ligstroside aglycone as a novel nutraceutical in treatment of osteoarthritis. Osteoarthr. Cartil. 2020, 28, S477. [Google Scholar] [CrossRef]
  7. Cárdeno, A.; Sánchez-Hidalgo, M.; Alarcón-de-la-Lastra, C. An Up-date of Olive Oil Phenols in Inflammation and Cancer: Molecular Mechanisms and Clinical Implications. Curr. Med. Chem. 2013, 20, 4758–4776. [Google Scholar] [CrossRef] [PubMed]
  8. Beauchamp, G.K.; Keast, R.S.J.; Morel, D.; Lin, J.; Pika, J.; Han, Q.; Lee, C.H.; Smith, A.B.; Breslin, P.A.S. Ibuprofen-like activity in extra-virgin olive oil. Nature 2005, 437, 45–46. [Google Scholar] [CrossRef]
  9. Mastralexi, A.; Tsimidou, M.Z. Quality aspects of European virgin olive oils with registered geographical indications: Emphasis on nutrient and non-nutrient bioactives. Adv. Food Nutr. Res. 2021, 95, 257–293. [Google Scholar] [PubMed]
  10. Nenadis, N.; Mastralexi, A.; Tsimidou, M.Z. Physicochemical Characteristics and Antioxidant Potential of the Greek PDO and PGI Virgin Olive Oils (VOOs). Eur. J. Lipid Sci. Technol. 2019, 121, 1800172. [Google Scholar] [CrossRef]
  11. Lioupi, A.; Nenadis, N.; Theodoridis, G. Virgin olive oil metabolomics: A review. J. Chromatogr. B Anal. Technol. Biomed. Life Sci. 2020, 1150, 122161. [Google Scholar] [CrossRef]
  12. Lanza, B.; Ninfali, P. Antioxidants in extra virgin olive oil and table olives: Connections between agriculture and processing for health choices. Antioxidants 2020, 9, 41. [Google Scholar] [CrossRef] [Green Version]
  13. Jurado-Campos, N.; García-Nicolás, M.; Pastor-Belda, M.; Bußmann, T.; Arroyo-Manzanares, N.; Jiménez, B.; Viñas, P.; Arce, L. Exploration of the potential of different analytical techniques to authenticate organic vs. conventional olives and olive oils from two varieties using untargeted fingerprinting approaches. Food Control 2021, 124, 107828. [Google Scholar] [CrossRef]
  14. Pascale, R.; Bianco, G.; Cataldi, T.R.I.; Buchicchio, A.; Losito, I.; Altieri, G.; Genovese, F.; Tauriello, A.; Di Renzo, G.C.; Lafiosca, M.C. Investigation of the Effects of Virgin Olive Oil Cleaning Systems on the Secoiridoid Aglycone Content Using High Performance Liquid Chromatography—Mass Spectrometry. J. Am. Oil Chem. Soc. 2018, 95, 665–671. [Google Scholar] [CrossRef]
  15. Kalogeropoulos, N.; Kaliora, A.C.; Artemiou, A.; Giogios, I. Composition, volatile profiles and functional properties of virgin olive oils produced by two-phase vs three-phase centrifugal decanters. LWT - Food Sci. Technol. 2014, 58, 272–279. [Google Scholar] [CrossRef]
  16. Malheiro, R.; Rodrigues, N.; Pereira, J.A. Olive Oil Phenolic Composition as Affected by Geographic Origin, and Cultivation Systems. In Olive and Olive Oil Bioactive Constituents; Boskou, D., Ed.; AOCS Press: Urbana, IL, USA, 2015; pp. 93–121. [Google Scholar]
  17. International Olive Oil Council (IOC), Mission Statement. Available online: https://ec.europa.eu/info/news/producing-69-worlds-production-eu-largest-producer-olive-oil-2020-feb-04_en2020 (accessed on 20 April 2021).
  18. Kalogeropoulos, N.; Tsimidou, M.Z. Antioxidants in greek virgin olive oils. Antioxidants 2014, 3, 387–413. [Google Scholar] [CrossRef] [Green Version]
  19. International Olive Oil Council (IOC), General Description of Olive Growing in Greece. Available online: https://www.internationaloliveoil.org/wp-content/uploads/2019/11/ENGLISH_POLICY_GREECE-2012_OK.pdf (accessed on 24 April 2021).
  20. Comission Regulation (EU) No 1151/2012, of the european parliament and of the council, on quality schemes of agricultural products and foodstuffs. Off. J. Eur. Union 2012, L343, 1–29.
  21. Tarapoulouzi, M.; Skiada, V.; Agriopoulou, S.; Psomiadis, D.; Rébufa, C.; Roussos, S.; Theocharis, C.R.; Katsaris, P.; Varzakas, T. Chemometric discrimination of the geographical origin of three greek cultivars of olive oils by stable isotope ratio analysis. Foods 2021, 10, 336. [Google Scholar] [CrossRef]
  22. Nikou, T.; Witt, M.; Stathopoulos, P.; Barsch, A.; Halabalaki, M. Olive Oil Quality and Authenticity Assessment Aspects Employing FIA-MRMS and LC-Orbitrap MS Metabolomic Approaches. Front. Public Health 2020, 8, 1–20. [Google Scholar] [CrossRef]
  23. Kalogiouri, N.P.; Aalizadeh, R.; Dasenaki, M.E.; Thomaidis, N.S. Authentication of Greek PDO kalamata table olives: A novel non-target high resolution mass spectrometric approach. Molecules 2020, 25, 2919. [Google Scholar] [CrossRef]
  24. Kritikou, E.; Kalogiouri, N.P.; Kolyvira, L.; Thomaidis, N.S. Target and Suspect HRMS Metabolomics for the 13 Varieties of Olive Leaves and Drupes from Greece. Molecules 2020, 25, 4889. [Google Scholar] [CrossRef]
  25. Kalogiouri, N.P.; Aalizadeh, R.; Dasenaki, M.E.; Thomaidis, N.S. Application of High Resolution Mass Spectrometric Methods coupled with Chemometric Techniques in Olive Oil Authenticity Studies—A Review. Anal. Chim. Acta 2020, 1134, 150–173. [Google Scholar] [CrossRef]
  26. Kalogiouri, N.P.; Aalizadeh, R.; Thomaidis, N.S. Investigating the organic and conventional production type of olive oil with target and suspect screening by LC-QTOF-MS, a novel semi-quantification method using chemical similarity and advanced chemometrics. Anal. Bioanal. Chem. 2017, 409, 5413–5426. [Google Scholar] [CrossRef]
  27. Guerfel, M.; Ouni, Y.; Taamalli, A.; Boujnah, D.; Stefanoudaki, E.; Zarrouk, M. Effect of location on virgin olive oils of the two main Tunisian olive cultivars. Eur. J. Lipid Sci. Technol. 2009, 111, 926–932. [Google Scholar] [CrossRef]
  28. Cecchi, L.; Migliorini, M.; Zanoni, B.; Breschi, C.; Mulinacci, N. An effective HPLC-based approach for the evaluation of the content of total phenolic compounds transferred from olives to virgin olive oil during the olive milling process. J. Sci. Food Agric. 2018, 98, 3636–3643. [Google Scholar] [CrossRef]
  29. GóMez-Rico, A.; Inarejos-García, A.M.; Salvador, M.D.; Fregapane, G. Effect of malaxation conditions on phenol and volatile profiles in olive paste and the corresponding virgin olive oils (Olea europaea L. Cv. cornicabra). J. Agric. Food Chem. 2009, 57, 3587–3595. [Google Scholar] [CrossRef]
  30. Tasioula-Margari, M.; Tsabolatidou, E. Extraction, separation, and identification of phenolic compounds in virgin olive oil by HPLC-DAD and HPLC-MS. Antioxidants 2015, 4, 548–562. [Google Scholar] [CrossRef]
  31. Antonini, E.; Farina, A.; Leone, A.; Mazzara, E.; Urbani, S.; Selvaggini, R.; Servili, M.; Ninfali, P. Phenolic compounds and quality parameters of family farming versus protected designation of origin (PDO) extra-virgin olive oils. J. Food Compos. Anal. 2015, 43, 75–81. [Google Scholar] [CrossRef]
  32. Agalias, A.; Melliou, E.; Magiatis, P.; Mitaku, S.; Gikas, E.; Tsarbopoulos, A. Quantitation of oleuropein and related metabolites in decoctions of Olea europaea leaves from ten greek cultivated varieties by HPLC with diode array detection (HPLC-DAD). J. Liq. Chromatogr. Relat. Technol. 2005, 28, 1557–1571. [Google Scholar] [CrossRef]
  33. Ríos, J.J.; Gil, M.J.; Gutiérrez-Rosales, F. Solid-phase extraction gas chromatography-ion trap-mass spectrometry qualitative method for evaluation of phenolic compounds in virgin olive oil and structural confirmation of oleuropein and ligstroside aglycons and their oxidation products. J. Chromatogr. A 2005, 1093, 167–176. [Google Scholar] [CrossRef]
  34. Saitta, M.; Curto, S.L.; Salvo, F.; Di Bella, G.; Dugo, G. Gas chromatographic-tandem mass spectrometric identification of phenolic compounds in Sicilian olive oils. Anal. Chim. Acta 2002, 466, 335–344. [Google Scholar] [CrossRef]
  35. Rosati, A.; Cafiero, C.; Paoletti, A.; Alfei, B.; Caporali, S.; Casciani, L.; Valentini, M. Effect of agronomical practices on carpology, fruit and oil composition, and oil sensory properties, in olive (Olea europaea L.). Food Chem. 2014, 159, 236–243. [Google Scholar] [CrossRef]
  36. Karkoula, E.; Skantzari, A.; Melliou, E.; Magiatis, P. Quantitative measurement of major secoiridoid derivatives in olive oil using qNMR. Proof of the artificial formation of aldehydic oleuropein and ligstroside aglycon isomers. J. Agric. Food Chem. 2014, 62, 600–607. [Google Scholar] [CrossRef]
  37. López-Yerena, A.; Lozano-Castellón, J.; Olmo-Cunillera, A.; Tresserra-Rimbau, A.; Quifer-Rada, P.; Jiménez, B.; Pérez, M.; Vallverdú-Queralt, A. Effects of organic and conventional growing systems on the phenolic profile of extra-virgin olive oil. Molecules 2019, 24, 1986. [Google Scholar] [CrossRef] [Green Version]
  38. Cuadros-Rodríguez, L.; Ruiz-Samblás, C.; Valverde-Som, L.; Pérez-Castaño, E.; González-Casado, A. Chromatographic fingerprinting: An innovative approach for food “identitation” and food authentication—A tutorial. Anal. Chim. Acta 2016, 909, 9–23. [Google Scholar] [CrossRef]
  39. Vallverdú-Queralt, A.; Lamuela-Raventós, R.M. Foodomics: A new tool to differentiate between organic and conventional foods. Electrophoresis 2016, 37, 1784–1794. [Google Scholar] [CrossRef] [PubMed]
  40. Gago-Ferrero, P.; Schymanski, E.L.; Bletsou, A.A.; Aalizadeh, R.; Hollender, J.; Thomaidis, N.S. Extended Suspect and Non-Target Strategies to Characterize Emerging Polar Organic Contaminants in Raw Wastewater with LC-HRMS/MS. Environ. Sci. Technol. 2015, 49, 12333–12341. [Google Scholar] [CrossRef] [Green Version]
  41. Comission Regulation (EC) No 432/2012, Establishing a list of permitted health claims made on foods, other than those referring to the reduction of disease risk and to children’s development and health. Off. J. Eur. Union 2012, L-136, 1–40.
  42. Kalogiouri, N.P.; Aalizadeh, R.; Thomaidis, N.S. Application of an advanced and wide scope non-target screening workflow with LC-ESI-QTOF-MS and chemometrics for the classification of the Greek olive oil varieties. Food Chem. 2018, 256, 53–61. [Google Scholar] [CrossRef]
  43. Borges, T.H.; López, L.C.; Pereira, J.A.; Cabrera-Vique, C.; Seiquer, I. Comparative analysis of minor bioactive constituents (CoQ10, tocopherols and phenolic compounds) in Arbequina extra virgin olive oils from Brazil and Spain. J. Food Compos. Anal. 2017, 63, 47–54. [Google Scholar] [CrossRef]
  44. Tripoli, E.; Giammanco, M.; Tabacchi, G.; Di Majo, D.; Giammanco, S.; La Guardia, M. The phenolic compounds of olive oil: Structure, biological activity and beneficial effects on human health. Nutr. Res. Rev. 2005, 18, 98–112. [Google Scholar] [CrossRef] [PubMed]
  45. Kishikawa, A.; Ashour, A.; Zhu, Q.; Yasuda, M.; Ishikawa, H.; Shimizu, K. Multiple biological effects of olive oil by-products such as leaves, stems, flowers, olive milled waste, fruit pulp, and seeds of the olive plant on skin. Phyther. Res. 2015, 29, 877–886. [Google Scholar] [CrossRef] [PubMed]
  46. El, S.N.; Karakaya, S. Olive tree (Olea europaea) leaves: Potential beneficial effects on human health. Nutr. Rev. 2009, 67, 632–638. [Google Scholar] [CrossRef] [PubMed]
  47. Quirantes-Piné, R.; Zurek, G.; Barrajón-Catalán, E.; Bäßmann, C.; Micol, V.; Segura-Carretero, A.; Fernández-Gutiérrez, A. A metabolite-profiling approach to assess the uptake and metabolism of phenolic compounds from olive leaves in SKBR3 cells by HPLC-ESI-QTOF-MS. J. Pharm. Biomed. Anal. 2013, 72, 121–126. [Google Scholar] [CrossRef] [PubMed]
  48. During, A.; Debouche, C.; Raas, T.; Larondelle, Y. Among plant lignans, pinoresinol has the strongest antiinammatory properties in human intestinal Caco-2 cells. J. Nutr. 2012, 142, 1798–1805. [Google Scholar] [CrossRef] [PubMed] [Green Version]
  49. Wolf, S.; Schmidt, S.; Müller-Hannemann, M.; Neumann, S. In silico fragmentation for computer assisted identification of metabolite mass spectra. BMC Bioinform. 2010, 11, 1–12. [Google Scholar] [CrossRef] [Green Version]
  50. Kalogiouri, N.P.; Alygizakis, N.A.; Aalizadeh, R.; Thomaidis, N.S. Olive oil authenticity studies by target and nontarget LC–QTOF-MS combined with advanced chemometric techniques. Anal. Bioanal. Chem. 2016, 408, 7955–7970. [Google Scholar] [CrossRef] [PubMed]
  51. Obied, H.K.; Bedgood, D.R.; Prenzler, P.D.; Robards, K. Chemical screening of olive biophenol extracts by hyphenated liquid chromatography. Anal. Chim. Acta 2007, 603, 176–189. [Google Scholar] [CrossRef]
  52. Adhami, H.R.; Zehl, M.; Dangl, C.; Dorfmeister, D.; Stadler, M.; Urban, E.; Hewitson, P.; Ignatova, S.; Krenn, L. Preparative isolation of oleocanthal, tyrosol, and hydroxytyrosol from olive oil by HPCCC. Food Chem. 2015, 170, 154–159. [Google Scholar] [CrossRef]
  53. Diamantakos, P.; Velkou, A.; Killday, K.B.; Gimisis, T.; Melliou, E.; Magiatis, P. Oleokoronal and Oleomissional: New major phenolic ingredients of extra virgin olive oil. Olivae 2015, 122, 22–32. [Google Scholar]
  54. Bajoub, A.; Hurtado-Fernández, E.; Ajal, E.A.; Ouazzani, N.; Fernández-Gutiérrez, A.; Carrasco-Pancorbo, A. Comprehensive 3-year study of the phenolic profile of Moroccan monovarietal virgin olive oils from the meknès region. J. Agric. Food Chem. 2015, 63, 4376–4385. [Google Scholar] [CrossRef]
  55. Lozano-Sánchez, J.; Segura-Carretero, A.; Menendez, J.A.; Oliveras-Ferraros, C.; Cerretani, L.; Fernández-Gutiérrez, A. Prediction of extra virgin olive oil varieties through their phenolic profile. potential cytotoxic activity against human breast cancer cells. J. Agric. Food Chem. 2010, 58, 9942–9955. [Google Scholar] [CrossRef] [PubMed]
  56. Tsimidou, M.Z.; Nenadis, N.; Servili, M.; García Gonzáles, D.L.; Gallina Toschi, T. Why Tyrosol Derivatives Have to Be Quantified in the Calculation of “Olive Oil Polyphenols” Content to Support the Health Claim Provisioned in the EC Reg. 432/2012. Eur. J. Lipid Sci. Technol. 2018, 120, 1–6. [Google Scholar] [CrossRef] [Green Version]
  57. Servili, M.; Esposto, S.; Fabiani, R.; Urbani, S.; Taticchi, A.; Mariucci, F.; Selvaggini, R.; Montedoro, G.F. Phenolic compounds in olive oil: Antioxidant, health and organoleptic activities according to their chemical structure. Inflammopharmacology 2009, 17, 76–84. [Google Scholar] [CrossRef]
  58. Anastasopoulos, E.; Kalogeropoulos, N.; Kaliora, A.C.; Kountouri, A.; Andrikopoulos, N.K. The influence of ripening and crop year on quality indices, polyphenols, terpenic acids, squalene, fatty acid profile, and sterols in virgin olive oil (Koroneiki cv.) produced by organic versus non-organic cultivation method. Int. J. Food Sci. Technol. 2011, 46, 170–178. [Google Scholar] [CrossRef]
  59. Bajoub, A.; Hurtado-Fernández, E.; Ajal, E.A.; Fernández-Gutiérrez, A.; Carrasco-Pancorbo, A.; Ouazzani, N. Quality and chemical profiles of monovarietal north Moroccan olive oils from “picholine Marocaine” cultivar: Registration database development and geographical discrimination. Food Chem. 2015, 179, 127–136. [Google Scholar] [CrossRef]
  60. Theodosi, S.; Kosma, I.S.; Badeka, A.V. Quality characteristics of Koroneiki olive oil from Zakynthos island (Greece) and differentiation depending on the altitude level. Eur. Food Res. Technol. 2021, 247, 1235–1248. [Google Scholar] [CrossRef]
  61. Mousa, Y.M.; Gerasopoulos, D.; Metzidakis, I.; Kiritsakis, A. Effect of altitude on fruit and oil quality characteristics of “Mastoides” olives. J. Sci. Food Agric. 1996, 71, 345–350. [Google Scholar] [CrossRef]
  62. Dabbou, S.; Issaoui, M.; Esposto, S.; Sifi, S.; Taticchi, A.; Servili, M.; Montedorob, G.F.; Hammamia, M. Cultivar and growing area effects on minor compounds of olive oil from autochthonous and European introduced cultivars in Tunisia. J. Sci. Food Agric. 2009, 89, 1314–1325. [Google Scholar] [CrossRef]
  63. Want, E.J.; Wilson, I.D.; Gika, H.; Theodoridis, G.; Plumb, R.S.; Shockcor, J.; Holmes, E.; Nicholson, J.K. Global metabolic profiling procedures for urine using UPLC-MS. Nat. Protoc. 2010, 5, 1005–1018. [Google Scholar] [CrossRef] [PubMed]
  64. Bletsou, A.A.; Jeon, J.; Hollender, J.; Archontaki, E.; Thomaidis, N.S. Targeted and non-targeted liquid chromatography-mass spectrometric workflows for identification of transformation products of emerging pollutants in the aquatic environment. TrAC - Trends Anal. Chem. 2015, 66, 32–44. [Google Scholar] [CrossRef] [Green Version]
Figure 1. Biotransformation pathway of oleuropein and lingstroside.
Molecules 26 05634 g001
Figure 2. Phenolic content (mg/kg) of Kolovi EVOOs from Lesvos.
Molecules 26 05634 g002
Figure 3. Phenolic content of the analyzed EVOOs produced in 2016–2017 with respect to the altitude.
Molecules 26 05634 g003
Figure 4. Phenolic content of the analyzed EVOOs produced in 2017–2018 with respect to altitude.
Molecules 26 05634 g004
Figure 5. Phenolic content of the analyzed EVOOs produced in 2016–2017 in comparison with the farming type (organic or conventional).
Molecules 26 05634 g005
Figure 6. Phenolic content of the analyzed EVOOs produced in 2017–2018 in comparison with the farming type (organic or conventional).
Molecules 26 05634 g006
Figure 7. Geographical origin of EVOOs from the two harvesting seasons 2016–2017 and 2017–2018.
Molecules 26 05634 g007
Figure 8. Schematic representation of the LLME-RP-UHPLC-QTOF-MS methodology applied in the analysis of EVOOs.
Molecules 26 05634 g008
Table 1. Target screening results.
CompoundMolecular Formula[M–H] m/z Theoretical[M–H] m/z ExperimentaltR Standard (min)ΔtR (min)
Phenolic alcohols
HydroxytyrosolC8H10O3153.0557153.05573.53−0.01
TyrosolC8H10O2137.0608137.06084.07+0.02
Flavonoids
ApigeninC15H10O5269.0455269.04558.24−0.03
LuteolinC15H10O6285.0404285.04057.55−0.04
Lignans
PinoresinolC20H22O6357.1343357.13416.49+0.01
Table 2. Suspect screening results.
CompoundMolecular Formula[M–H] m/z Calculated[M–H] m/z ExperimentalFragments
m/z
Elemental
Formula
tR
(min)
Hydroxytyrosol acetateC10H12O4195.0663195.0663134.0373
149.0608
161.0246
C8H6O2
C9H9O2
C9H5O3
6.70
Decarboxymethyl lingstroside aglycone (Oleocanthal)C17H20O5303.1237303.1236124.0532
137.0605
147.0450
165.0551
183.0662
C7H8O2
C8H10O2
C9H7O2
C9H9O3
C9H11O4
6.43
Decarboxymethyl oleuropein aglycone (Oleacein)C17H20O6319.1187319.118569.0342
95.0501
123.0448
139.0602
165.0556
183.0660
195.0656
C4H5O
C6H7O
C7H7O2
C8H11O2
C9H9O3
C9H11O4
C10H11O4
5.60
10-Hydroxy-10-methyl
oleuropein aglycone
C20H24O9407.1347407.134799.0453
111.0087
121.0295
135.0453
137.0243
149.0245
163.0402
179.0351
195.0665
241.0871
C5H7O2
C5H3O3
C7H5O2
C8H7O2
C7H5O3
C8H5O3
C9H7O3
C9H7O4
C10H11O4
C15H13O3
6.71
10-Hydroxy-decarboxymethyl oleuropein aglyconeC17H20O7335.1136335.113559.0139
85.0296
121.0292
151.0401
153.0557
155.0716
199.0613
C2H3O2
C4H5O2
C7H5O2
C8H7O3
C8H9O3
C8H11O3
C9H11O5
4.30
10-Hydroxy oleuropein
aglycone
C19H22O9393.1191393.1190137.0244
181.0502
C7H5O3
C9H9O4
4.82
Lingstroside aglycone
C19H22O7361.1291361.1291259.0975
291.0875
C15H15O4
C15H15O6
6.63
Lingstroside aglycone
monoaldehydic form
C19H22O7361.1291361.1291137.0608
241.0718
C8H9O2
C11H13O6
7.84
Lingstroside aglycone
dialdehydic form
C19H22O7361.1291361.129169.0346
101.0244
259.0976
C4H5O
C4H5O3
C15H15O4
8.15
OleokoronalC19H22O7361.1291361.1291195.0663
291.0874
C10H11O4
C15H15O6
8.34
Methyl oleuropein aglyconeC20H24O8391.1398391.139659.0140
67.0192
99.0456
111.0086
137.0608
291.0875
C2H3O2
C4H3O
C5H7O2
C5H3O3
C8H9O2
C16H15O6
7.49
Oleuropein aglyconeC19H22O8377.1241377.1242111.0088
149.0244
195.0645
275.0918
307.0823
C5H3O3
C8H5O3
C10H11O4
C15H15O5
C15H15O7
7.30
Oleuropein aglycone
monoaldehydic form
C19H22O8377.1241377.124269.0345
99.0088
121.0294
127.0400
C4H5O
C4H3O3
C7H5O2
C6H7O3
7.43
Oleuropein aglycone
dialdehydic form
C19H22O8377.1241377.124259.0139
67.0187
95.0138
123.0453
128.0478
153.0558
195.0662
C2H3O2
C4H3O
C5H3O2
C7H7O2
C6H8O3
C8H9O3
C10H11O4
7.62
OleomissionalC19H22O8377.1241377.1242101.0245
163.0400
C4H5O3
C9H7O3
7.76
1-AcetoxypinoresinolC22H24O8415.1398415.1397151.0402
280.0951
343.1188
C8H7O3
C14H16O6
C19H19O6
6.40
1-HydroxypinoresinolC20H22O7373.1292373.1290121.0294
151.0401
163.0402
C7H5O2
C8H7O3
C9H7O3
6.38
SyringaresinolC22H26O8417.1554417.1557127.0406
181.0505
C6H7O3
C9H9O4
6.19
Elenolic acidC11H14O6241.0717241.071659.0137
95.0496
127.0400
151.0402
171.0300
C2H3O2
C6H7O
C6H7O3
C8H7O3
C7H7O5
4.51
Hydroxylated form of elenolic acidC11H14O7257.0667257.066359.0104
137.0603
181.0535
C2H3O2
C8H9O2
C9H9O4
1.37
Publisher’s Note: MDPI stays neutral with regard to jurisdictional claims in published maps and institutional affiliations.

