Article

A QuEChERS-HPLC-MS/MS Method with Matrix Matching Calibration Strategy for Determination of Imidacloprid and Its Metabolites in Procambarus clarkii (Crayfish) Tissues

1
Yangtze River Fisheries Research Institute, Chinese Academy of Fishery Sciences, Wuhan 430223, China
2
Chinese Academy of Fishery Sciences, Key Laboratory of Control of Quality and Safety for Aquatic Products, Ministry of Agriculture, Beijing 100141, China
*
Authors to whom correspondence should be addressed.
Molecules 2021, 26(2), 274; https://doi.org/10.3390/molecules26020274
Submission received: 14 December 2020 / Revised: 1 January 2021 / Accepted: 4 January 2021 / Published: 7 January 2021
(This article belongs to the Special Issue Methods in Food Analysis)

Abstract

:
We developed a method for determination of imidacloprid and its metabolites 5-hydroxy imidacloprid, olefin imidacloprid, imidacloprid urea and 6-chloronicotinic acid in Procambarus clarkii (crayfish) tissues using quick, easy, cheap, effective, rugged, and safe (QuEChERS) and high-performance liquid chromatography-triple quadrupole mass spectrometry. Samples (plasma, cephalothorax, hepatopancrea, gill, intestine, and muscle) were extracted with acetonitrile containing 0.1% acetic acid and cleaned up using a neutral alumina column containing a primary secondary amine. The prepared samples were separated using reverse phase chromatography and scanned in the positive and negative ion multiple reaction-monitoring modes. Under the optimum experimental conditions, spiked recoveries for these compounds in P. clarkii samples ranged from 80.6 to 112.7% with relative standard deviations of 4.2 to 12.6%. The limits of detection were 0.02–0.5 μg·L−1, the limits of quantification were 0.05–2.0 μg·L−1 and the method of quantification was 0.05–2.0 μg·kg−1. The method is rapid, simple, sensitive and suitable for rapid determination and analysis of imidacloprid and its metabolites in P. clarkii tissues.

1. Introduction

Procambarus clarkii is a species of freshwater crayfish native to northern Mexico and the southern and southeastern United States and has been introduced into many areas of China [1]. P. clarkii production has increased to over one million tons in 2018 leading to a commercial value of approximately RMB 369 billion total industrial output value in China [2]. In China, P. clarkii are primarily raised through integration into rice fields that makes their production more cost effective. However, this mode of cultivation also exposes these animals to pesticides and fertilizers used for rice cultivation and these types of effects have not been investigated [3].
Imidacloprid (1-6-chloro-3-pyridylmethyl-N-nitroimidazol-2-ylideneamine) is a neurotoxic insecticide of the neonicotinoid family class. It has high activity, broad insecticidal spectrum, good system physical properties and field stability. This compound is the current pesticide of choice to control sucking insect pests on rice, cotton, wheat, vegetables and fruit trees [4,5,6,7,8]. However, these pesticides are particularly dangerous because they are also toxic to beneficial insects such as honeybees [9,10]. Imidacloprid contains nitromethylene, nitroguanidine, cyanamidine and other pharma-codynamic groups. The neurotoxic substituent of imidacloprid is its nitroimine group [11,12,13]. The primary biodegradation products of imidacloprid include 5-hydroxy imidacloprid, olefin imidacloprid, imidacloprid urea and 6-chloronicotinic acid [3,14]. These bioconversions also alter the toxicity and olefin imidacloprid are 10–16 times more toxic than the parent compound [15]. These metabolites also retain insecticidal activity and metabolites derived through imidacloprid and olefin imidacloprid hydroxylation of nitroimine substituents are toxic to bees [16]. However, the toxicity to aquatic animals is unknown.
As a model breeding industry with an output revenue valued over RMB 100 billion, there was only one quality standard for crayfish in China at this time, which only stipulated seven kinds of veterinary drugs and one kind of heavy metal. With the increase of new pollutants, the change of cultivation mode and the upgrading of agricultural and veterinary drugs, these eight indicators are far from meeting the actual demand [17,18]. Therefore, to ensure the safety of crayfish used as human food, a detection method for imidacloprid and its metabolites must be established for P. clarkii.
Numerous detection methods have been established for imidacloprid and its metabolites in animal and plant tissues [14,19,20,21,22]. These have included measuring levels of imidacloprid in bees and honey products, pistachio nuts and green tea [12,16]. Interestingly, detection methods for imidacloprid and its metabolites in aquatic products have not been reported.
In the current study, we established an extraction and detection system to identify imidacloprid and its metabolites in P. clarkii tissues using QuEChERS (quick, easy, cheap, effective, rugged, and safe) and LC-MS (liquid chromatography-mass spectrometry). We then examined retail P. clarkii samples for the presence of imidacloprid and its metabolites.

2. Results and Discussion

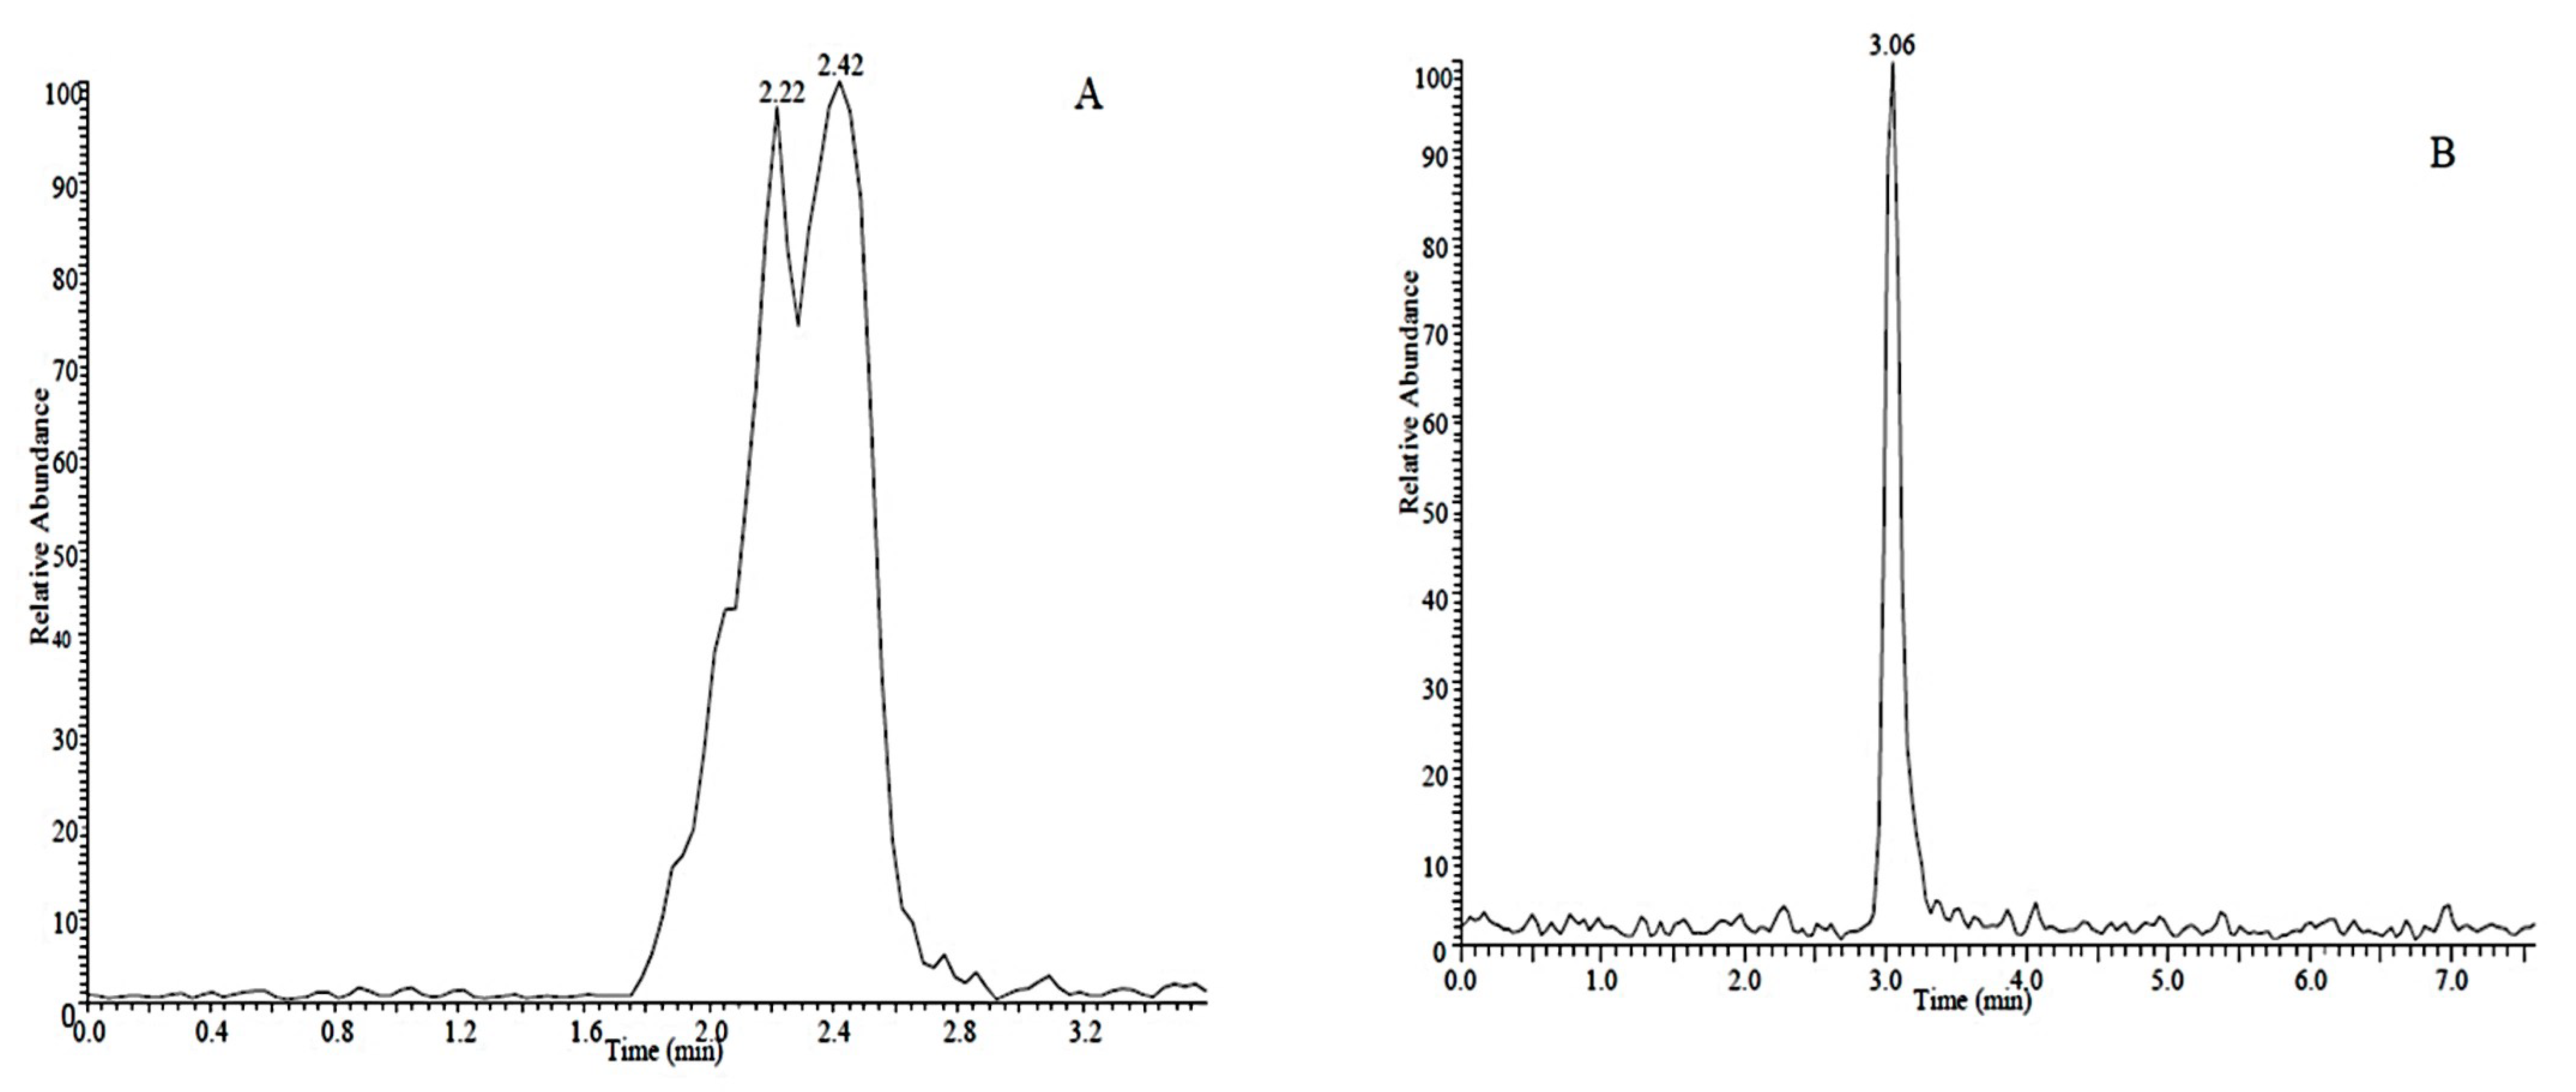
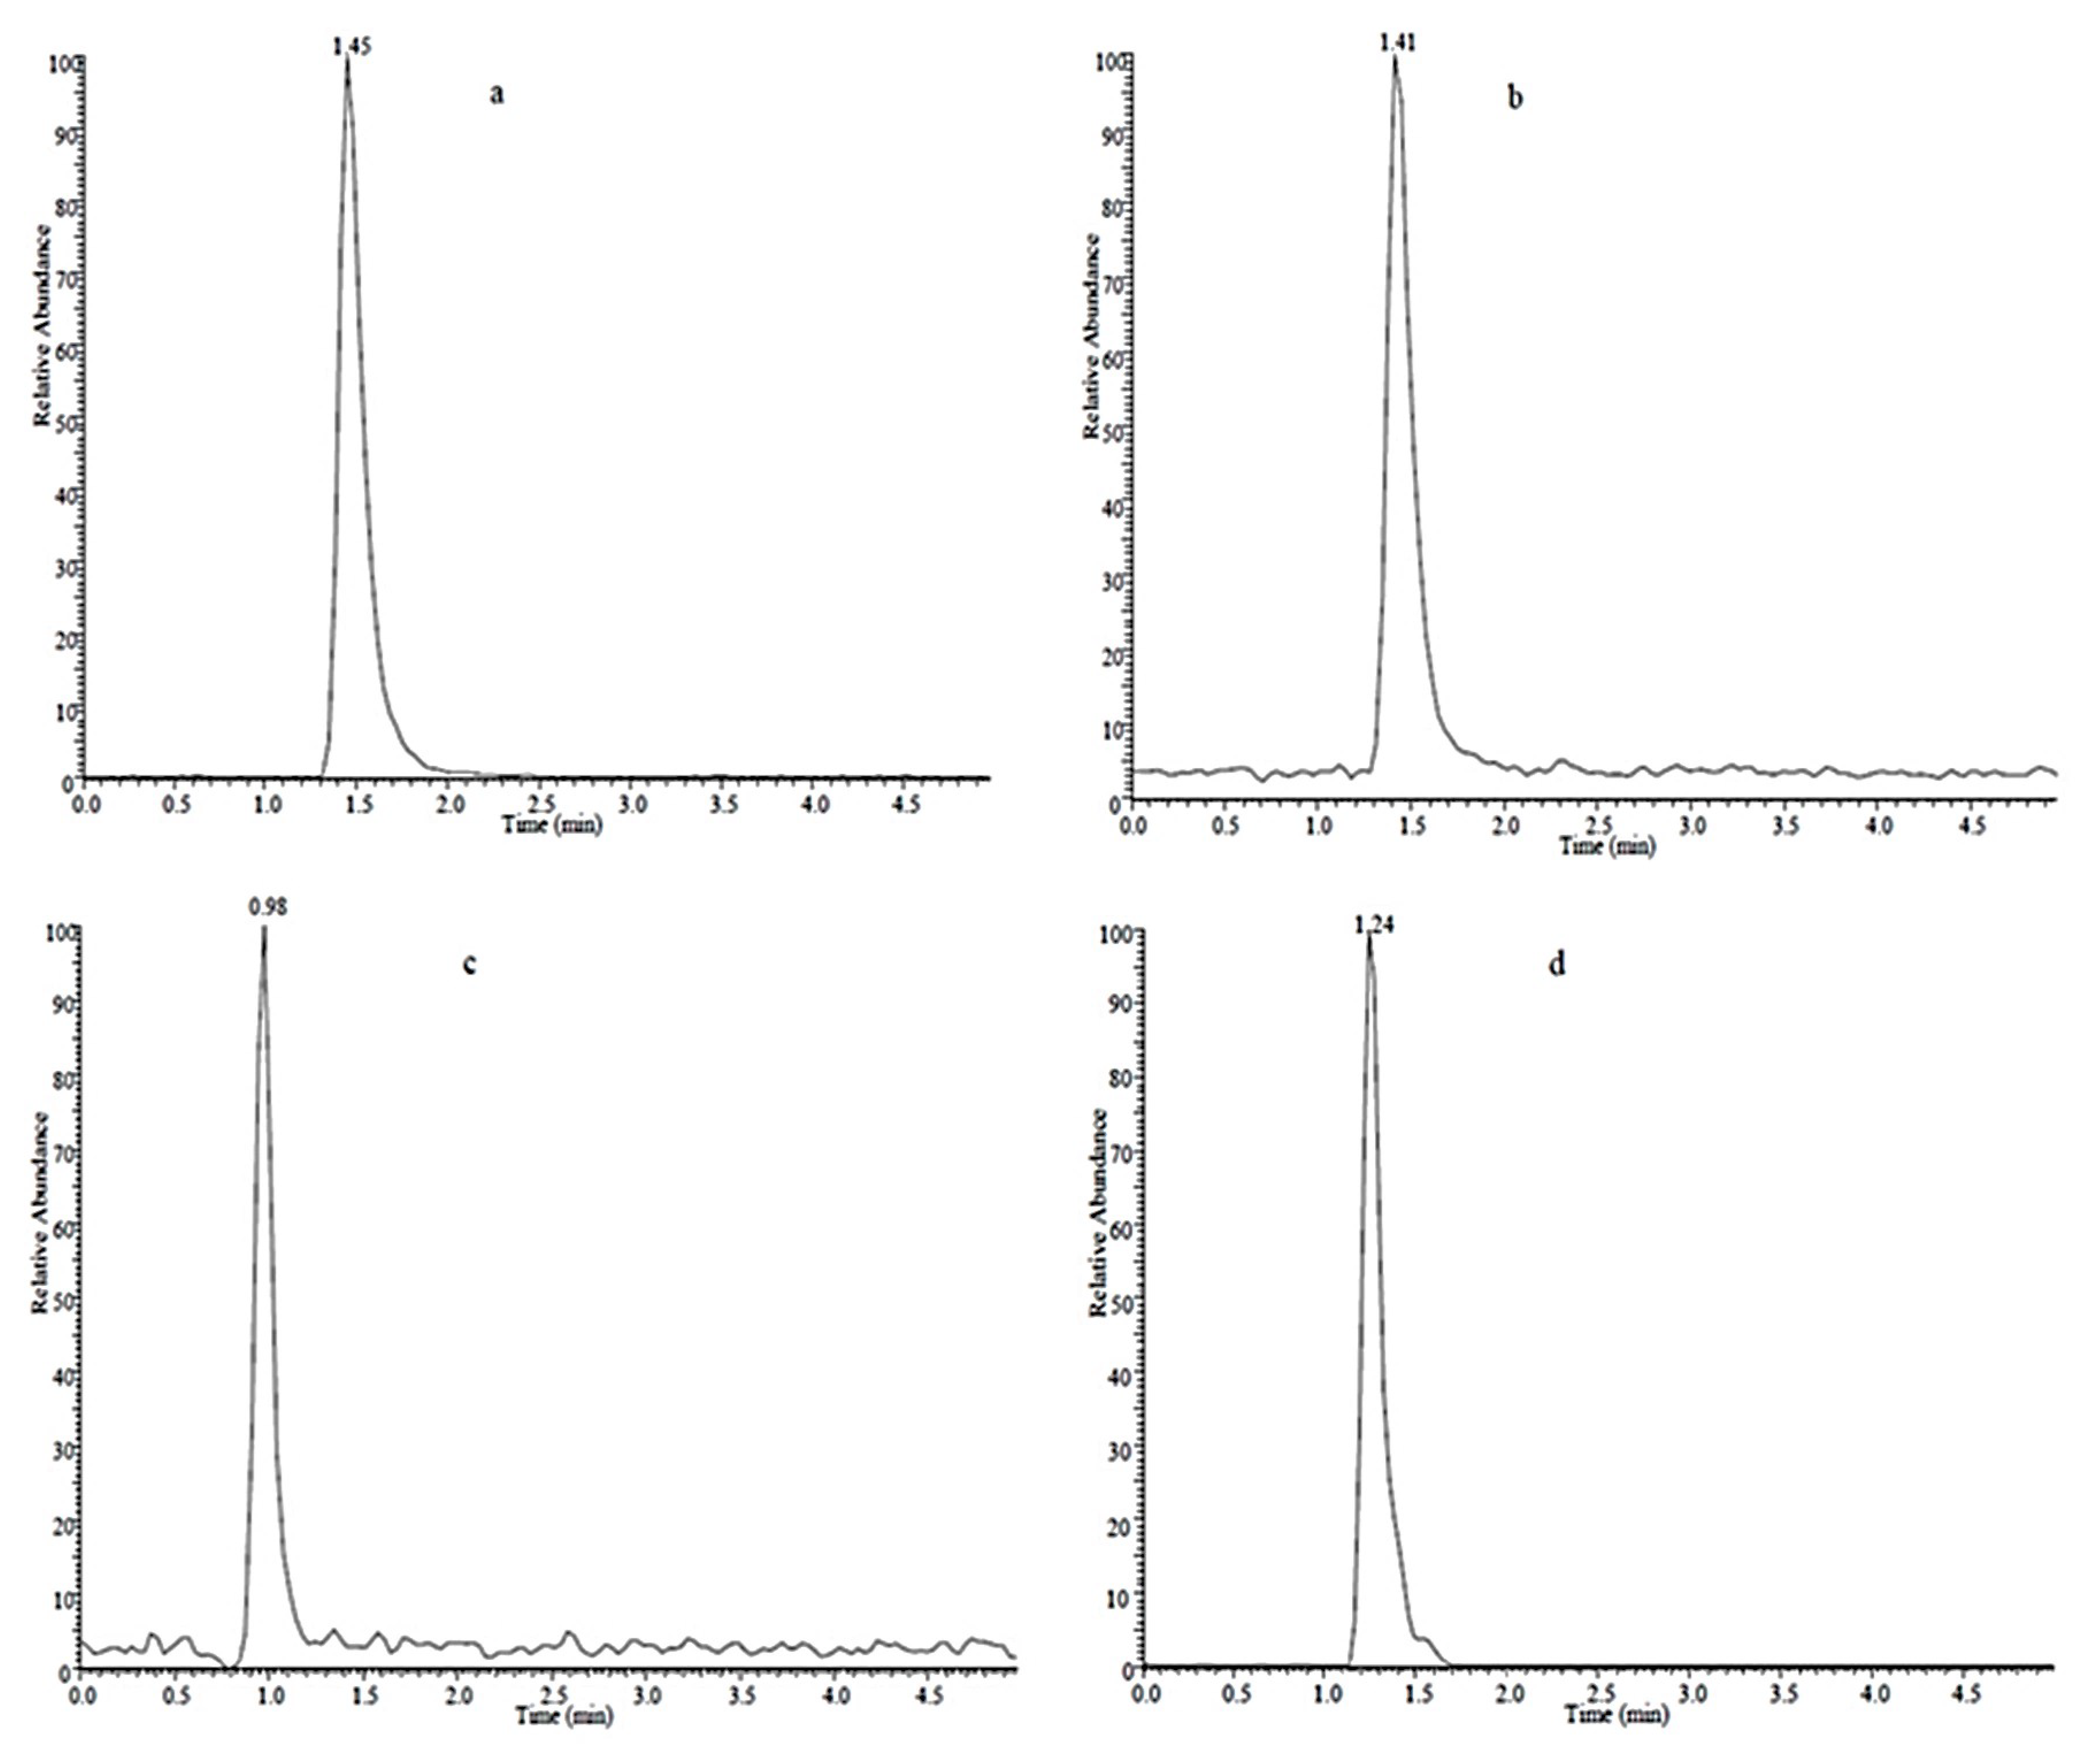
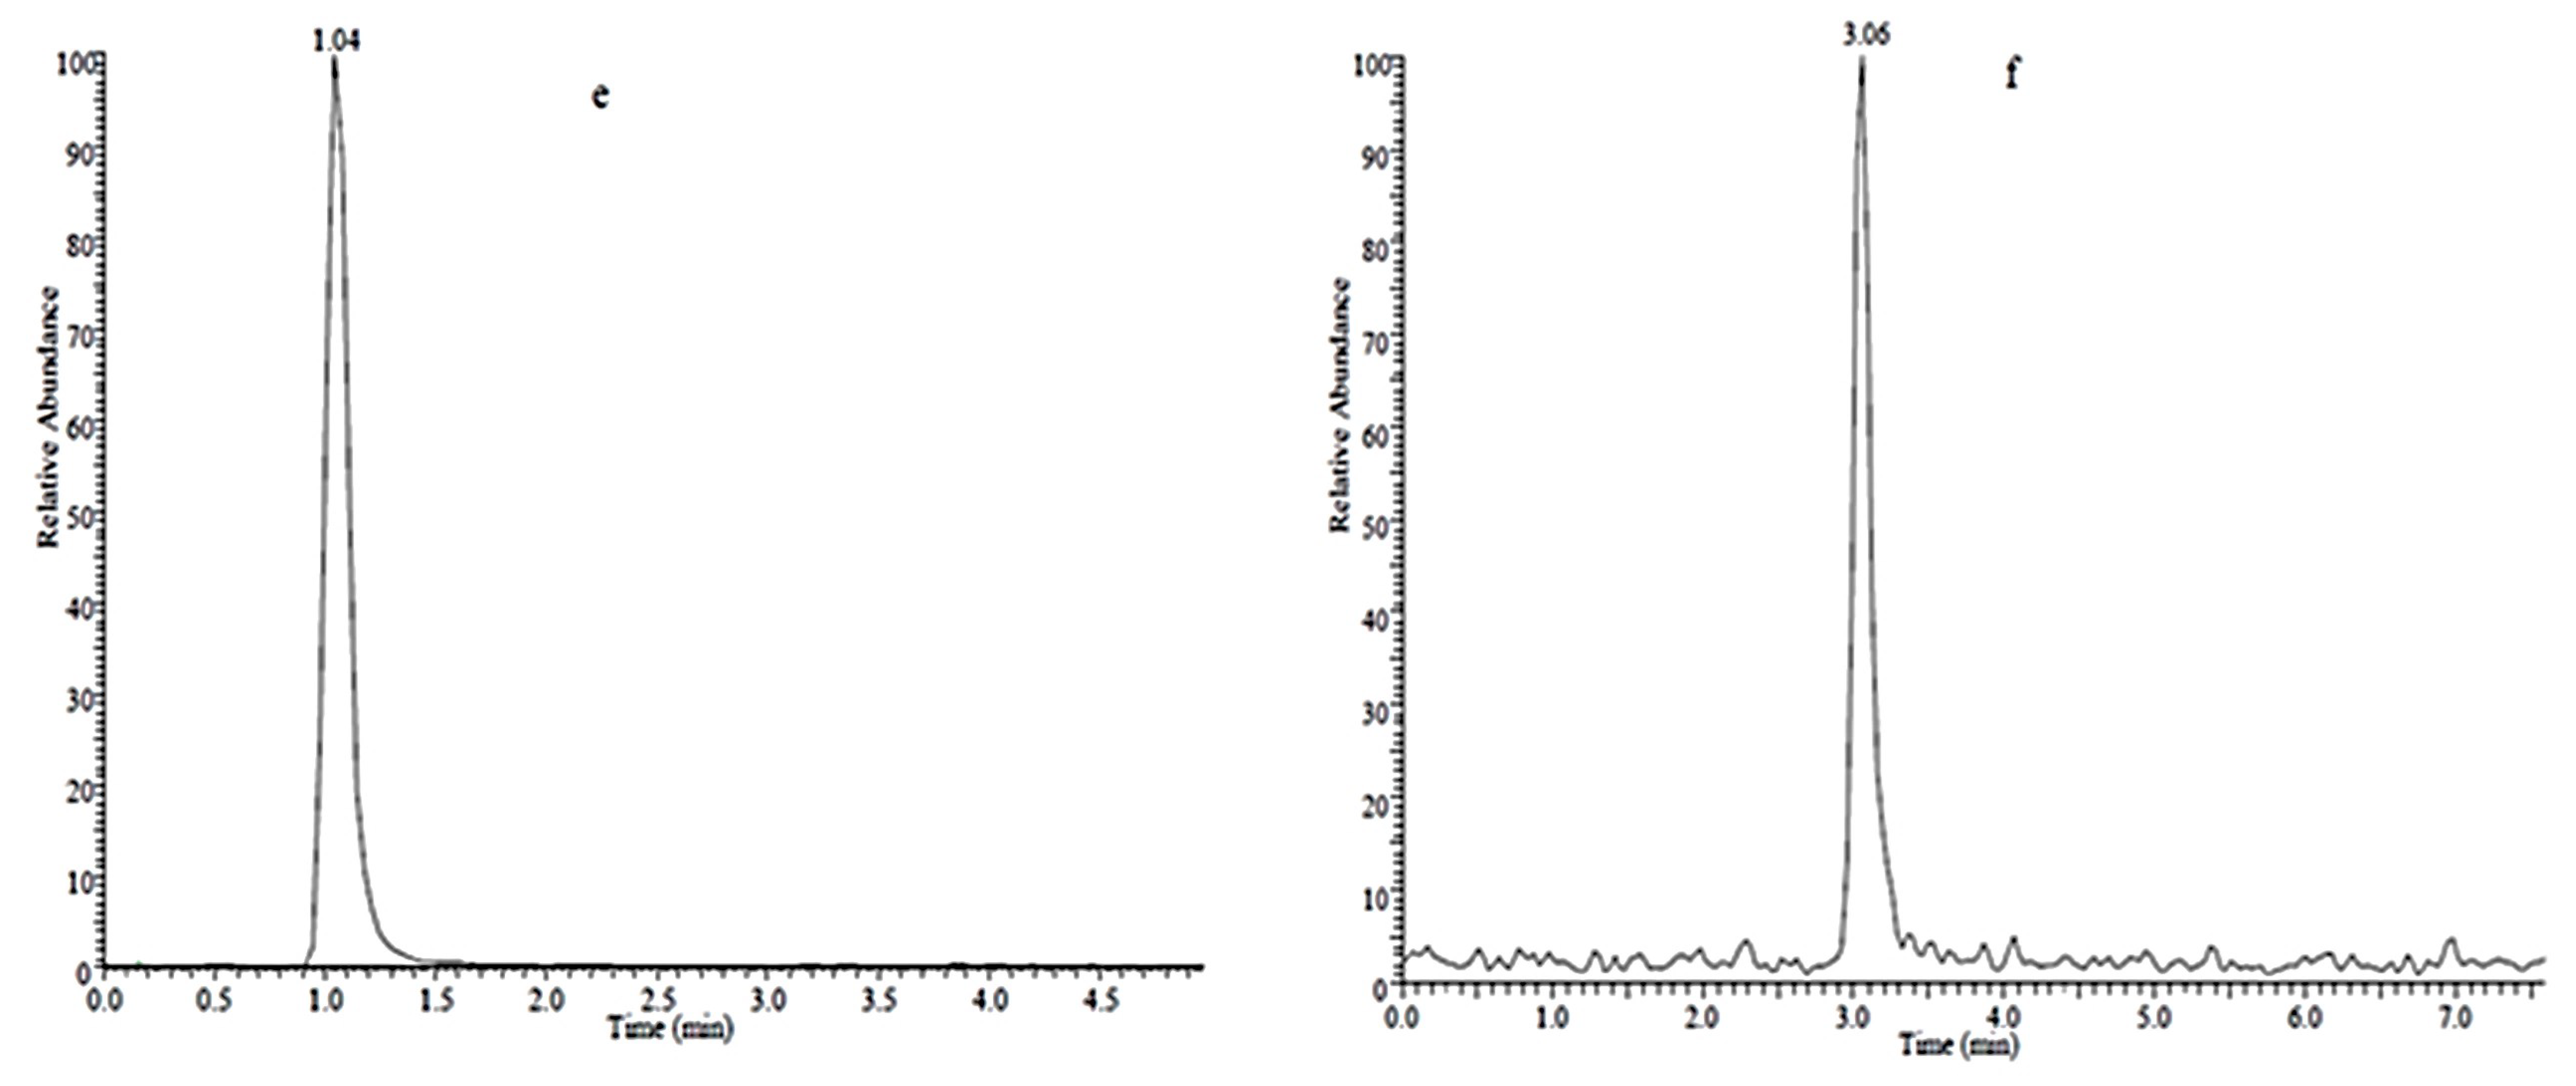
2.1. Analyte Separation and Identification

We first optimized mass spectroscopic parameters for each individual target compound in positive and negative modes. Stock solutions (1 μg·mL−1) were injected into the ESI (electrospray ionization) source at a flow rate of 25 μL·min−1 and [M + H]+ molecular ion peaks for imidacloprid, imidacloprid-D4, 5-hydroxy imidacloprid and imidacloprid urea were established. In negative ion mode, the [M − H] molecular ion peaks were suitable for all compounds except 6-chloronicotinic acid that displayed a weak signal under these conditions. In order to improve the signal strength of 6-chloronicotinic acid, we connected a three-way valve to the ESI source, one side was into the standard solution, the other was into the mobile phase, which could adjust the pH and alter the signal strength. In the end, we found 6-chloronicotinic acid showed a better peak with an acidic mobile phase. Therefore, we acidified the solutions with 0.1% acetic acid to ensure 6-chloronicotinic acid eluted as one sharp peak in the LC chromatograms (Figure 1).
Olefin imidacloprid displayed high level detector responses in positive modes but the [M − H] molecular ion peak was greater and more symmetric in the negative ion mode (Figure 2).
We then optimized the chromatographic separations of imidacloprid and its target metabolites that were initially conducted using reverse phase chromatography with a methanol and water mobile phase in the presence and absence of 0.1% acetic acid as counterion. The inclusion of the counterion generated the most symmetrical peak shapes for these standards and was used for the remainder of the analytical separations (Figure 3).

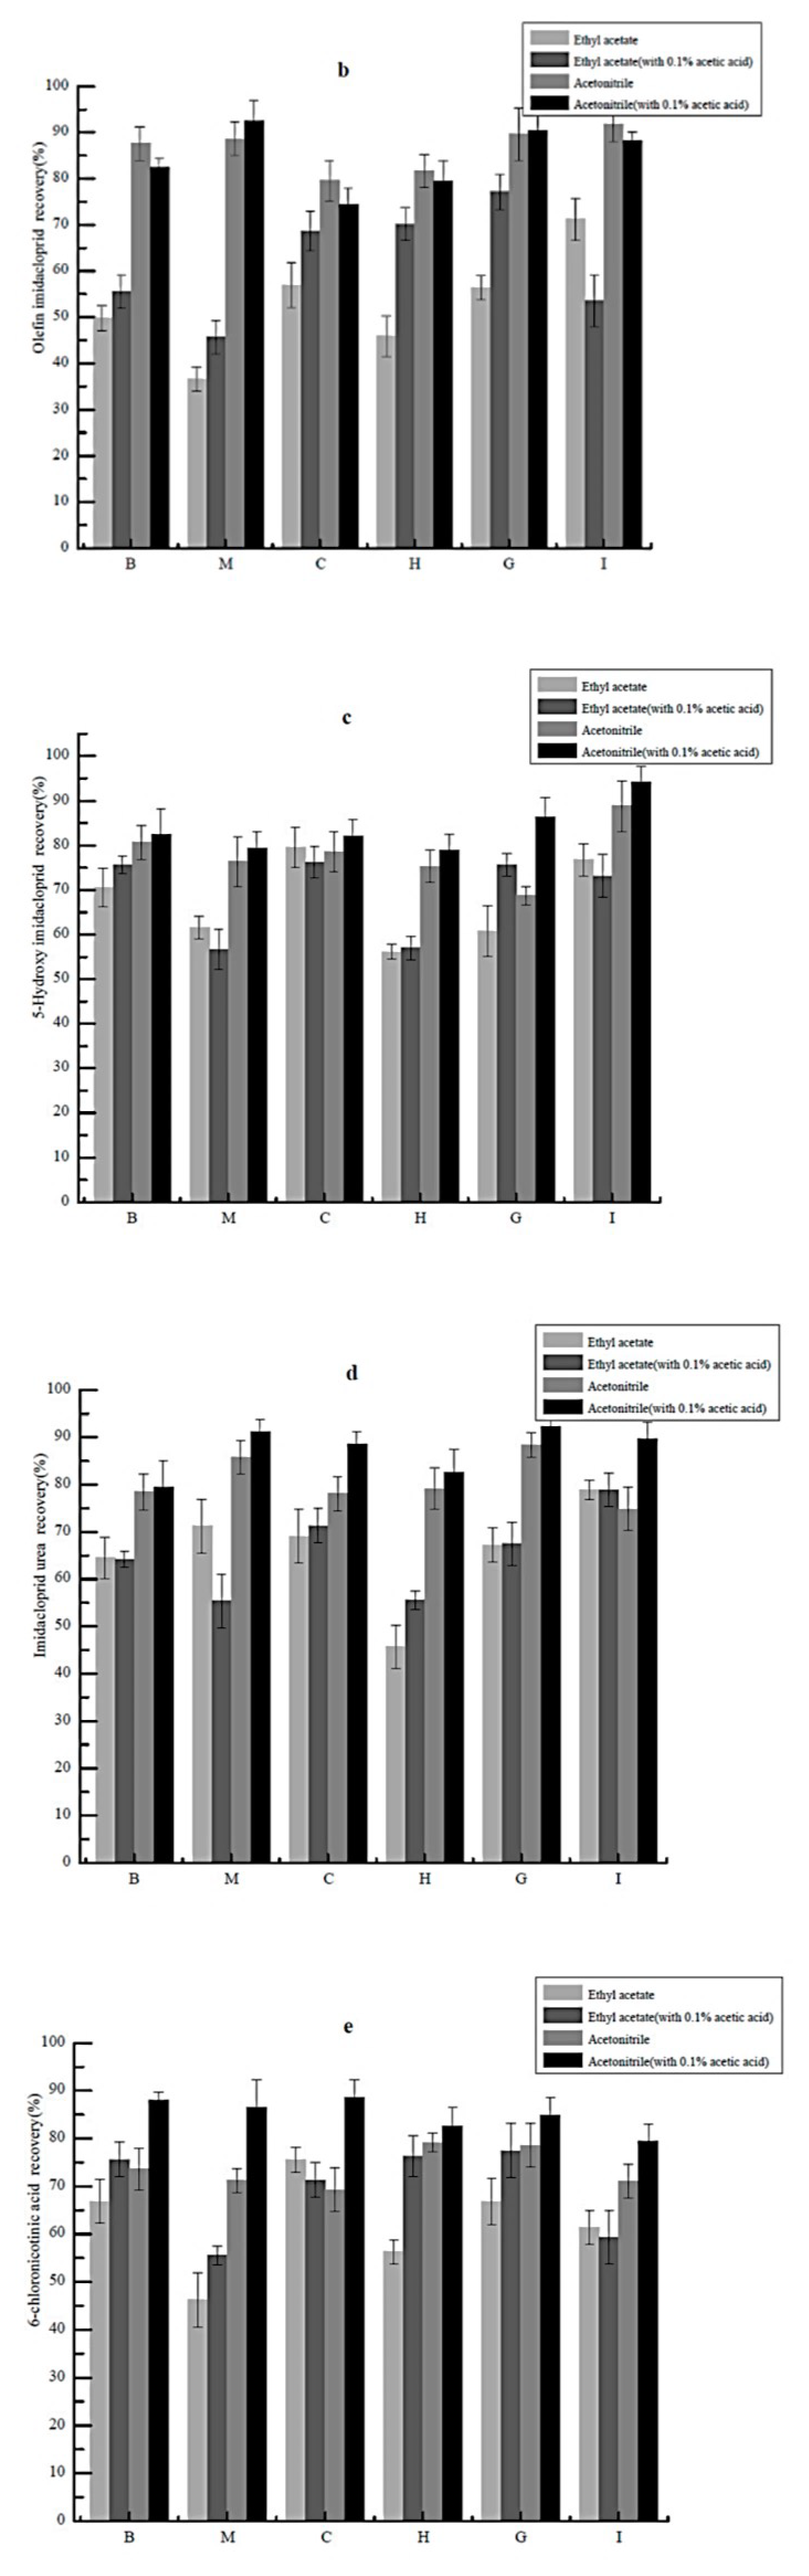
2.2. Selection of Extraction Solvent

In order to improve the extraction efficiency and minimize matrix interference, the extraction solvent should have a polarity similar to the target compound [23]. Previous studies have indicated that acetonitrile and ethyl acetate possessed polarities similar to our target compounds and generated better recoveries, less interference from fats and proteins and less co-extracted matrix components [7,8,24,25]. Thus, we chose acetonitrile and ethyl acetate as the primary extraction solvents and examined extraction in the presence and absence of 1% acetic acid in P. clarkii tissue matrices. Overall, ethyl acetate gave lower recoveries than with acetonitrile and this was independent of acidification. The yields of 5-hydroxy imidacloprid, imidacloprid urea and 6-chloronicotinic acid in acetonitrile with 0.1% acetic acid solvents were >80% (Figure 4). Thus, acetonitrile containing 0.1% acetic acid was chosen as the extraction solvent. The addition of anhydrous MgSO4 and NaCl increased recoveries to 80–100%. The inclusion of these compounds most likely reduced the water phase and promoted partitioning of the pesticides into the organic layer as has been previously documented [26,27].

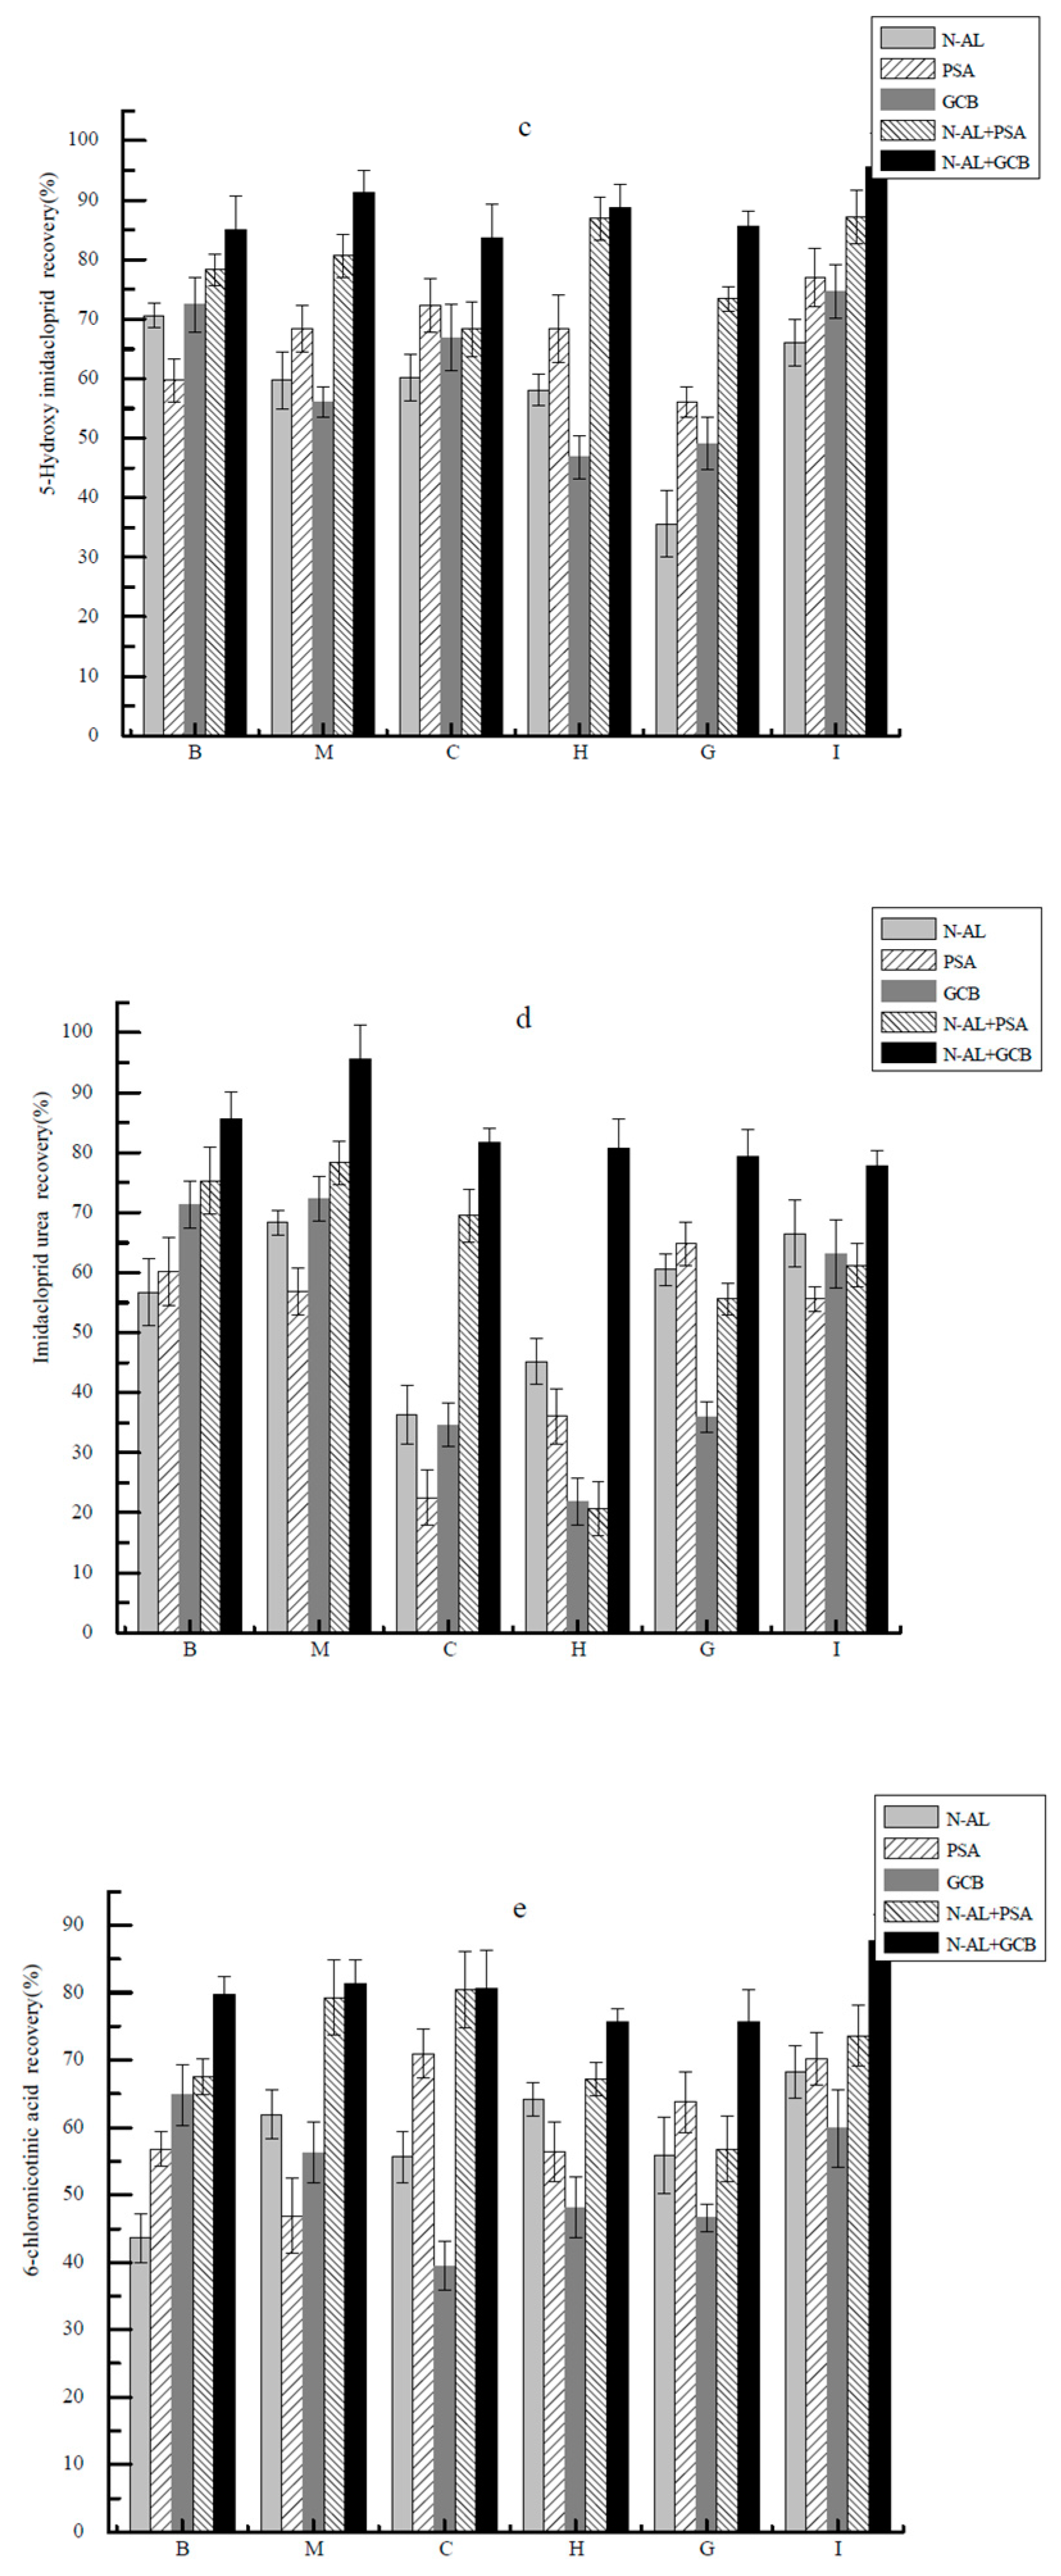
2.3. Optimization of Purification Conditions

P. clarkii tissues represent a complex matrix and contain fats, protein, pigments and other substances [28]. We, therefore, developed a clean-up step using common chromatographic sorbents prior to LC injection. We examined the highly-polar neutral alumina that possesses properties close to silica gels that are commonly used to remove aromatic and aliphatic compounds [29,30]. PSA (primary secondary amine) is a weak anion exchanger that can remove fatty acids, sugars and other components that can form hydrogen bonds [31]. GCB (graphitized carbon black) can efficiently remove pigments especially chlorophyll [32,33]. Recoveries for imidacloprid, 5-hydroxy imidacloprid, olefin imidacloprid, imidacloprid urea and 6-chloronicotinic acid were all >80% for the neutral alumina column compared with the others. Moreover, this column extracted more interfering substances and achieved the best effect (Figure 5). GCB can effectively remove astaxanthin present in P. clarkii. As a result, the neutral alumina column combined with GCB was used for purification.

2.4. Linear Range, Matrix Effects, Detection Limits, Recoveries and RSD

Using the optimized conditions for separation and detection of imidacloprid and its metabolites, we performed a complete analysis of our test compounds using a series of standard solutions. All calibration curves showed adequate linearity in the appropriate concentration ranges with correlation coefficients >0.99 for each target compounds. The limits of detection (LODs) for these compounds were 0.02–0.5 μg·L−1 and the LOQs were 0.05–2.00 μg·L−1. The precision of method was calculated and expressed as inter-day RSD (relative standard deviation) and intraday RSD. The inter-day RSD and intraday RSD were calculated by comparing standard deviation of the peak area of standard solutions on three different days and on the same day. The inter-day RSD and intraday RSD were 3.3–7.7% and 4.4–7.5%, respectively (Table 1).
Blank matrices were spiked with standard solutions at low and high concentrations and included the d4 internal standard that was added to every sample. We then calculated the matrix factor effects to obtain IS-N MF (Internal standard normalized matrix factor) and CV (coefficient of variations) values that could be directly compared (Table 2). We found that a significant ion enhancement for imidacloprid in for cephalothorax, olefin imidacloprid in hepatopancrea, imidacloprid urea in muscle and 6-chloronicotinic acid in cephalothorax, hepatopancrea, intestine and muscle. A significant ion suppression for imidacloprid in hepatopancrea and muscle, 5-hydroxy imidacloprid in hepatopancrea, gills and intestine and olefin imidacloprid in cephalothorax, gills, intestine and muscle, imidacloprid urea in hepatopancrea and intestine. Matrix effects of all other compounds were in the normal range (0.85–1.15). Matrix matched calibration was selected for quantification of samples (Table 3).
The inter-day RSD and intraday RSD for all these analytes were calculated by comparing standard deviation of the recovery percentages of the spiked samples on three different days and the same day, respectively. The inter-day RSD and intraday RSD were all <15%. The recoveries from the P. clarkii matrices were all in the range of 80–112.7% (Table 4).

3. Real Sample Analysis

In order to determine the effectiveness of our extraction and separation method and its suitability in routine analysis, we collected 169 samples of crayfish from Qianjiang, Xiantao, Jingzhou and Xiaogan in Hubei province, and we detected imidacloprid and its metabolites. We found imidacloprid in 132 samples, 5-hydroxy imidacloprid in 12, olefin imidacloprid in 19, imidacloprid urea in 19 and 69 samples contained 6-chloronicotinic acid. These results indicated that although the parent compound imidacloprid was detected in 78% of the samples, its metabolites were also detected in 7 to 40% of these commercial P. clarkii samples.

4. Experimental

4.1. Reagents

Analytical standards of purity grade imidacloprid (99.8%), imidacloprid-D4 (95%), imidacloprid urea (99.7%), olefin imidacloprid (98.7%), and 6-chloronicotinic acid (99.2%) were obtained from Dr. Ehrenstorfer GmbH (Augsburg, Germany) and 5-hydroxyimidacloprid (98.0%) was obtained from Toronto Research Chemicals (Ontario, Canada). The following were obtained from the listed sources: florisil neutral alumina column (1 g/3 mL, CNW Technologies, Shanghai, China); acetic acid, acetonitrile, methanol, and ethyl acetate (Tedia, Fairfield, OH, USA); anhydrous MgSO4 and NaCl (Sinopharm Chemical Reagent, Beijing, China); primary secondary amine (PSA) (40–60 μm, analytical grade), C18, graphitized carbon black (GCB) (40–60 μm, analytical grade) and alumina-N sorbent (40–60 μm, analytical grade), (Bonna-Agela Technologies, Tianjin, China). Ultrapure water with a resistivity of 18.2 MΩ·cm was obtained from a Millipore filtering system (Burlington, MA, USA).

4.2. Standard Solutions

Imidacloprid, 5-hydroxy imidacloprid, olefin imidacloprid, imidacloprid urea and 6-chloronicotinic acid stocks were prepared in methanol at 500 mg·mL−1 and stored at −18 °C protected from light. Working standards were prepared the day of use in methanol/water/acetic acid (8:20:0.1) at 1, 2, 5, 10, and 20 μg·L−1. Imidacloprid-D4 (imidazolidin-4,4,5,5-d4) was used as isotope-labelled internal standard (IS) as previously described [34] and all standards and samples contained 2.0 ng·mL−1. Stock and working standard solutions were prepared every 3 and 1 month, respectively. The working standard solutions were used to prepare matrix-matched standards and spiked samples for validation studies.

4.3. Sample Preparation

P. clarkii plasma was extracted by inserting a 1 mL micro-injector into the heart. Animals were dissected after removal of the head. The shell was removed by lateral excisions and the remainder was defined as the cephalothorax. The yellow/brown region between the gills was removed (hepatopancreas) and the gills were then excised. The intestines were removed from the tail and the muscles were removed. All solid tissues were cut into 0.5 cm cubes and homogenized in a blender at high speed. All the samples were stored at −18 °C until analysis.

4.4. Sample Extraction

Tissue sample homogenates (2 g) and plasma (2 mL) were used for extraction as follows; samples were thawed at room temperature and placed in 10 mL centrifuge tubes containing 2 μL Imidacloprid-D4 internal standard solution (100 μg·L−1) and 3 mL acetonitrile/ 0.1% acetic acid. The tube was vortexed for 1 min and 3 mL of distilled water was added and briefly vortexed. MgSO4 (1.0 g) and NaCl (0.5 g) were added and the samples were immediately vortexed for 2 min. The sample was centrifuged at 5000 rpm for 5 min and the supernatant was transferred to a clean 10 mL tube. The samples were extracted again and the supernatants were combined. The combined supernatants were then passed through a neutral alumina column that was prepared by adding 0.01 g of PSA powder and 0.1 g MgSO4. The eluates were dried under a stream of nitrogen gas and the residue was reconstituted in 1 mL methanol: water: acetic acid (8:20:0.1) and filtered through a 0.22 μm membrane.

4.5. Analyte Identification

The combined high performance liquid chromatography (HPLC)—triple quadrupole mass spectrometer (MS) system TSQ Quantum Access Max equipped with LCQUAN 2.6 software (Thermo Fisher Scientific, Pittsburg, PA, USA) was used for analyte identification. Chromatographic separations utilized a Symmetry C18 column (100 × 2.1 mm, 3.5 μm) column (Waters, Burlington, MA, USA) at 35 °C. The mobile phase Component A was methanol containing 0.1% acetic acid and Component B was water containing 0.1% acetic acid. Analytes were eluted with a gradient as follows: A:B 50:50 for 2 min then 80:20 until 4 min and return to initial conditions using a flow rate of 0.3 mL·min−1 and an injection volume of 10 μL.
Mass spectrometry for analyte identification used a heating atmospheric electrospray ion (HESI) source in the scan mode with select response monitoring (SRM). The spray voltage was 3500 with an evaporation temperature of 250 °C. The sheath and auxiliary gases were high purity nitrogen supplied with an average pressure of 10 bar. The collision gas was high purity argon supplied at 1.5 mTorr. The temperature for the ion transfer capillary was 300 °C. The half peak width for one pole mass spectrometry scanning (Q1) was 0.7 Da and for tripolar mass spectrometry (Q3) was 0.7 Da (Table 5).

4.6. Validation of the Analytical Method

The validation of the HPLC-MS method was performed using the conditions recommended in the guidelines of the EU Commission Decision 2002/657/EC. After sample preparation and the detection of imidacloprid and its metabolites by HPLC-MS/MS, samples that tested pesticide-free was selected as blank matrix samples and used to construct standard curves at five concentrations. Standard curves were examined using linear regression of the ratios of chromatographic peak areas and concentration.
Matrix effects (ME) were examined by the post-extraction spiking of samples. Blank matrices were extracted from different tissues, and concentrated and dissolved with 1 mL methanol/water/acetic acid (8:20:0.1) and then spiked with analyte standard solutions. Internal standard (Imidacloprid-D4, 0.1 μg·kg−1) was also added per sample. The samples were analyzed and the area of the quantitative ion was compared with that obtained for the standards in solution at the same concentration levels. The specific method of calculation [35] was as follows:
Matrix factoranalytes = peak areapost-extracted/peak areapure solution
Matrix factorIS = peak areapost-extracted/peak areapure solution
IS normalized matrix factor = matrix factoranalytes/matrix factorIS
The limit of detection (LOD) was determined as the concentration that produced a peak area of the signal 3 × baseline and the limit of quantification (LOQ) was the concentration that produced a signal to noise ratio of 10. The detection limit of the method (MOD) refers to the lowest concentration that the signal generated by the detected substance that could be distinguished from the blank sample with 99% confidence after processing and determination including sample preparation.
Recoveries were calculated by comparing the peak areas of blank samples spiked before preparation with that of blank samples spiked after preparation in six replicates at low, middle and high concentration levels. To evaluate precision of the method, the intraday RSD values were calculated by analyzing fortified samples on the same day with the same instrument and operator. The inter-day RSD results were obtained using the identical method on three separate days with the same instrument and operator (Ning Xu et al., 2018).

5. Conclusions

We developed a novel modified QuEChERS-based LC-MS/MS method for the determination of pesticides in P. clarkii. The method provided efficient extraction and rapid cleanup of imidacloprid and its metabolites from P. clarkii tissues. The proposed LC-MS/MS method displayed good linearity, high sensitivity, satisfactory recoveries and precision. This method has the advantages of being fast, easy and environmentally friendly, which consumes only small quantities of reagents. The establishment of this method not only fills the blank of the standard of imidacloprid in crayfish, but also provides a theoretical basis for the control of typical pesticides in the integrated cultivation mode of rice and crayfish. Therefore, it provides reference suggestions for ensuring the consumption safety of P. clarkii.

Author Contributions

Conceptualization, Q.Y. and X.A.; methodology, Q.Y. and Y.Y.; data curation, Y.L.; writing—original draft preparation, Q.Y.; writing—review and editing, J.D. and S.Z.; visualization, N.X.; funding acquisition, Q.Y. All authors have read and agreed to the published version of the manuscript.

Funding

This study was funded by the Hubei Province Technical Innovation Special Assignment (Major Projects) Fund (Project Number 2019ABA077), as well as the Central Public-interest Scientific Institution Basal Research Fund, Chinese Academy of Fishery Sciences (Project Number 2018HY-ZD0606).

Institutional Review Board Statement

Not applicable.

Informed Consent Statement

Not applicable.

Data Availability Statement

The data presented in this study are available on request from the corresponding author.

Acknowledgments

The authors sincerely thank the individuals who helped during the research and especially Geng Leng (School of Resources and Environment, University of Electronic Science and Technology of China) and Kan Cao (Jiangxi Environmental Monitoring Center Station) for their suggestions and help.

Compliance with Ethical Standards

All animal experiments in this study adhered to Yangtze River Fisheries Research Institute, Chinese Academy of Fishery Sciences guidelines and were approved by the Animal Ethics Committee.

Conflicts of Interest

None of the listed authors have declared any conflicts of interest.

Sample Availability

Samples of the compounds are available from the authors.

References

  1. Kang, P.; Mao, B.; Fan, C.; Wang, Y. Transcriptomic information from the ovaries of red swamp crayfish (Procambarus clarkii) provides new insights into development of ovaries and embryos. Aquaculture 2019, 505, 333–343. [Google Scholar] [CrossRef]
  2. Qian, X.; Zhu, F. Hesperetin protects crayfish Procambarus clarkii against white spot syndrome virus infection. Fish Shellfish Immunol. 2019, 93, 116–123. [Google Scholar] [CrossRef] [PubMed]
  3. Yang, Q.; Liu, H.; Li, S.; Xu, N.; Liu, Y.; Ai, X. Determination of imidacloprid residues in water, sediment and Procambarus clarkii samples by high performance liquid chromatography-tandem mass spectrometry. Agrochemicals 2018, 57, 427–430. [Google Scholar]
  4. Chen, L.; Li, B. Determination of imidacloprid in rice by molecularly imprinted-matrix solid-phase dispersion with liquid chromatography tandem mass spectrometry. J. Chromatogr. B 2012, 897, 32–36. [Google Scholar] [CrossRef]
  5. Pandiselvi, S.; Sathiyanarayanan, S.; Ramesh, A. Determination of spirotetramat and imidacloprid residues in cotton seed, lint, oil and soil by HPLC UV method and their dissipation in cotton plant. Pestic. Res. J. 2010, 22, 168–173. [Google Scholar]
  6. Sajid, I.; Riaz, U.; Sumayya, S.; Mubarik, A.; Muhammad, A.; Sahar, A. Extraction, cleanup, and chromatographic determination of imidacloprid residues in wheat. Bull Env. Contam. Toxicol. 2012, 88, 555–558. [Google Scholar]
  7. Li, Y.; Yang, L.; Yan, H.; Zhang, M.; Ge, J.; Yu, X.i. Uptake, translocation and accumulation of imidacloprid in six leafy vegetables at three growth stages. Ecotoxicol. Environ. Saf. 2018, 164, 690–695. [Google Scholar] [CrossRef]
  8. Kapoor, U.; Srivastava, M.K.; Srivastava, A.K.; Patel, D.K.; Garg, V.; Srivastava, L.P. Analysis of imidacloprid residues in fruits, vegetables, cereals, fruit juices, and baby foods, and daily intake estimation in and around Lucknow, India. Environ. Toxicol. Chem. 2013, 32, 723–727. [Google Scholar] [CrossRef]
  9. Stokstad, E. Field research on bees raises concern about low-dose pesticides. Science 2012, 335, 1555. [Google Scholar] [CrossRef] [Green Version]
  10. Whitehorn, P.R.; O’Connor, S.; Wackers, F.L.; Goulson, D. Neonicotinoid pesticide reduces bumble bee colony growth and queen production. Science 2012, 336, 351–352. [Google Scholar] [CrossRef] [Green Version]
  11. Michlig, M.P.; Merke, J.; Pacini, A.C.; Orellano, E.M.; Beldoménico, H.R.; Repetti, M.R. Determination of imidacloprid in beehive samples by UHPLC-MS/MS. Microchem. J. 2018, 143, 72–81. [Google Scholar] [CrossRef]
  12. Faraji, M.; Noorbakhsh, R.; Shafieyan, H.; Ramezani, M. Determination of acetamiprid, imidacloprid, and spirotetramat and their relevant metabolites in pistachio using modified QuEChERS combined with liquid chromatography-tandem mass spectrometry. Food Chem. 2018, 240, 634–641. [Google Scholar] [CrossRef] [PubMed]
  13. Huang, M.; Qin, X.; Luo, X.; Yu, W.; Yang, G.; Zhang, K.; Hu, D. A liquid chromatography with tandem mass spectrometry method to simultaneously determinate chlorpyrifos, imidacloprid and imidacloprid metabolites in wheat. J. Sep. Sci. 2019, 42, 1210–1221. [Google Scholar] [CrossRef] [PubMed]
  14. Rancan, M.; Sabatini, A.G.; Achilli, G.; Galletti, G.C. Determination of Imidacloprid and metabolites by liquid chromatography with an electrochemical detector and post column photochemical reactor. Anal. Chim. Acta 2006, 555, 20–24. [Google Scholar] [CrossRef]
  15. Fan, Y.; Shi, X.; Gao, X. Research progresses on the metabolism of neonicotinoids imidacloprid and thiamethoxam. Chin. J. Pestic. Sci. 2012, 14, 587–596. [Google Scholar]
  16. Liang, X.; Wang, X.; Xue, X.; Qi, P.; Liu, Z.; Liu, Z.; Zhou, L.; Wang, X.; Wang, Q. Determination of imidacloprid and its three metabolites in honey and bee pollen by liquid chromatography-tandem mass spectrometry. Chin. J. Anal. Chem. 2017, 45, 553–559. [Google Scholar]
  17. Deng, T.; Gao, Y.; Chen, X. Mechanisms for selective action of neonicotinoid insecticides. J. Henan Inst. Sci. Technol. 2010, 38, 23–26. [Google Scholar]
  18. Xia, Z.; Zhang, J.; Zhou, Y.; Peng, L.; Zheng, D.; Zhang, X.; Hu, X.; Xia, H. Status of the Quality and Safety Standards for Crayfish in China: A Review. Mod. Food Sci. Technol. 2020, 36, 310–318. [Google Scholar]
  19. Kiljanek, T.; Niewiadowska, A.; Semeniuk, S.; Gaweł, M.; Borzęcka, M.; Posyniak, A. Multi-residue method for the determination of pesticides and pesticide metabolites in honeybees by liquid and gas chromatography coupled with tandem mass spectrometry-Honeybee poisoning incidents. J. Chromatogr. A 2016, 1435, 100–114. [Google Scholar] [CrossRef]
  20. Ko, A.-Y.; Rahman, M.M.; Abd El-Aty, A.M.; Jang, J.; Park, J.-H.; Cho, S.-K.; Shim, J.-H. Development of a simple extraction and oxidation procedure for the residue analysis of imidacloprid and its metabolites in lettuce using gas chromatography. Food Chem. 2014, 148, 402–409. [Google Scholar] [CrossRef]
  21. Amelin, V.G.; Bol’shakov, D.S.; Tretiakov, A.V. Identification and determination of synthetic pyrethroids, chlorpyriphos, and neonicotinoids in water by gas and liquid chromatography. J. Anal. Chem. 2012, 67, 354–359. [Google Scholar] [CrossRef]
  22. Rossi, S.; Sabatini, A.G.; Cenciarini, R.; Ghini, S.; Girotti, S. Use of High-performance liquid chromatography-UV and gas chromatography-mass spectrometry for determination of the imidacloprid content of honeybees, pollen, paper filters, grass, and flowers. Chromatographia 2005, 61, 189–195. [Google Scholar] [CrossRef]
  23. Huang, Y.; Shi, T.; Luo, X.; Xiong, H.; Min, F.; Chen, Y.; Nie, S.; Xie, M. Determination of multi-pesticide residues in green tea with a modified QuEChERS protocol coupled to HPLC-MS/MS. Food Chem. 2018. [Google Scholar] [CrossRef] [PubMed]
  24. Kumar, A.; Bhattacharyya, A.; Shinde, R.; Dhanshetty, M.; Elliott, C.T.; Banerjee, K. Development and validation of a multiresidue method for pesticides and selected veterinary drugs in animal feed using liquid- and gas chromatography with tandem mass spectrometry. J. Chromatogr. A 2020, 1627, 461416. [Google Scholar] [CrossRef] [PubMed]
  25. Pagani, A.P.; Ibañez, G.A. Pesticide residues in fruits and vegetables: High-order calibration based on spectrofluorimetric/pH data. Microchem. J. 2019, 149, 104042. [Google Scholar] [CrossRef]
  26. He, J.; Zhang, B.; Zhang, H.; Hao, L.; Ma, T.; Wang, J.; Han, S. Monitoring of 49 Pesticides and 17 Mycotoxins in Wine by QuEChERS and UHPLC–MS/MS Analysis. J. Food Sci. 2019, 84, 2688–2697. [Google Scholar] [CrossRef] [PubMed]
  27. Kang, H.; Kim, M.; Kim, E.; Choe, W. Determination of 66 pesticide residues in livestock products using QuEChERS and GC–MS/MS. Food Sci Biotechnol. 2020, 29, 1573–1586. [Google Scholar] [CrossRef] [PubMed]
  28. Yang, Q.; Ai, X.; Li, S.; Liu, H.; Liu, Y. Determination of pendimethalin in water, sediment, and Procambarus clarkii by high performance liquid chromatography-triple quadrupole mass spectrometry. Environ. Monit. Assess. 2019, 191, 621. [Google Scholar] [CrossRef]
  29. Maestroni, B.; Besil, N.; Bojorge, A.; Gérez, N.; Pérez-Parada, A.; Cannavan, A.; Heinzen, H.; Cesio, M.V. Optimization and validation of a single method for the determination of pesticide residues in Peumus boldus Molina leaves using GC-MSD, GC-MS/MS and LC-MS/MS. J. Appl. Res. Med. Aromat. Plants 2020, 18, 100254. [Google Scholar] [CrossRef]
  30. Shelepchikov, A.A.; Ovcharenko, V.V.; Kozhushkevich, A.I.; Brodskii, E.S.; Komarov, A.A.; Turbabina, K.A.; Kalantaenko, A.M. A new method for purifying fat-containing extracts in the determination of polybrominated diphenyl ethers. J. Anal. Chem. 2019, 74, 574–583. [Google Scholar] [CrossRef]
  31. Caban, M.; Lis, H.; Kobylis, P.; Stepnowski, P. The triple-sorbents solid-phase extraction for pharmaceuticals and estrogens determination in wastewater samples. Microchem. J. 2019, 149, 103965. [Google Scholar] [CrossRef]
  32. Jiang, C.; Dai, J.; Han, H.; Wang, C.; Zhu, L.; Lu, C.; Chen, H. Determination of thirteen acidic phytohormones and their analogues in tea (Camellia sinensis) leaves using ultra high performance liquid chromatography tandem mass spectrometry. J. Chromatogr. B 2020, 1149, 122144. [Google Scholar] [CrossRef] [PubMed]
  33. Tian, F.; Qiao, C.; Luo, J.; Guo, L.; Pang, T.; Pang, R.; Li, J.; Wang, C.; Wang, R.; Xie, H. Development of a fast multi-residue method for the determination of succinate dehydrogenase inhibitor fungicides in cereals, vegetables and fruits by modified QuEChERS and UHPLC-MS/MS. J. Chromatogr. B 2020, 1152, 122261. [Google Scholar] [CrossRef] [PubMed]
  34. Hao, C.; Noestheden, M.R.; Zhao, X.; Morse, D. Liquid chromatography tandem mass spectrometry analysis of neonicotinoid pesticides and 6-chloronicotinic acid in environmental water with direct aqueous injection. Anal. Chim. Acta 2016, 925, 43–50. [Google Scholar] [CrossRef]
  35. Xu, N.; Dong, J.; Yang, Y. Development of a liquid chromatography–tandem mass spectrometry method with modified QuEChERS extraction for the quantification of mebendazole and its metabolites, albendazole and its metabolites, and levamisole in edible tissues of aquatic animals. Food Chem. 2018, 269, 442–449. [Google Scholar] [CrossRef]
Figure 1. Chromatograms of 6-chloronicotinic acid using reverse phase LC and detection in negative ion mode in the (A) absence and (B) presence of 0.1% acetic acid as counterion.
Molecules 26 00274 g001
Figure 2. Olefin imidacloprid detection in (A) positive and (B) negative ion modes.
Molecules 26 00274 g002
Figure 3. LC reverse phase separation of standard solutions of imidacloprid (a), imidacloprid-D4 (b), 5-hydroxy imidacloprid (c), olefin imidacloprid (d), imidacloprid urea (e) and 6-chloronicotinic acid (f).
Molecules 26 00274 g003aMolecules 26 00274 g003b
Figure 4. Recoveries of extractions of imidacloprid (a), olefin imidacloprid (b), 5-hydroxy imidacloprid (c), imidacloprid urea (d) and 6-chloronicotinic acid (e) using ethyl acetate and acetonitrile in the presence and absence of 0.1% acetic acid as indicated from the following Procambarus clarkii matrices: B, blood; M, muscle; C, cephalothorax; H, hepatopancrea; G, gills; I, intestine.
Molecules 26 00274 g004aMolecules 26 00274 g004b
Figure 5. Effects of different purification materials on the recoveries of imidacloprid (a), olefin imidacloprid (b), 5-hydroxy imidacloprid (c), imidacloprid urea (d) and 6-chloronicotinic acid (e) from P. clarkii homogenates. PSA, primary secondary amine; GCB, graphitized carbon black; N-AL + PSA, neutral alumina and primary secondary amine; N-AL + GCB, neutral alumina and graphitized carbon black. See Figure 4 for abbreviations.
Molecules 26 00274 g005aMolecules 26 00274 g005b
Table 1. Analytical performance for imidacloprid and its metabolites in solution.
CompoundLinear Range
(μg·L−1)
Regression
Equation a
Correlation Coefficient
(R2)
LOD b (μg·L−1)LOQ c (μg·L−1)RSD (%, N = 3)
Inter-DayIntraday
IMI0.05–2.00Y = 0.874X + 0.0790.99220.020.054.35.7
5-Hydroxy IMI1.00–20.00Y = 0.134X + 0.0700.99470.501.006.84.4
olefin IMI2.00–100.00Y = 0.298X + 0.0340.99810.502.005.25.6
IMI urea0.10–10.00Y = 1.631X + 0.4640.99480.030.107.16.1
6-Chloronicotinic acid1.00–50.00Y = 0.436X − 0.8560.99960.501.003.37.5
a X = concentration (ng/mL), Y = counts (peak area); b Instrument detection limit (IUPAC (International Union of Pure and Applied Chemistry)criterion); c IUPAC criterion.
Table 2. Matrix effects of imidacloprid and metabolites in different matrixes.
CompoundSpike Level
(μg·L−1)
PlasmaCephalothoraxHepatopancreaGillIntestineMuscle
IS-N MFCVIS-N MFCVIS-N MFCVIS-N MFCVIS-N MFCVIS-N MFCV
IMI 0.11.0550.091.7520.050.6950.081.0230.051.1030.060.3590.06
5.00.9870.111.5680.070.7120.130.9680.080.9880.080.4750.08
5-Hydroxy IMI2.00.9230.080.8970.130.5660.110.5820.10.7230.131.1250.11
100.00.8970.070.9740.070.6910.080.6370.080.6320.060.9690.12
olefin IMI5.00.9470.110.3640.051.4540.120.5810.120.3450.110.4570.15
200.00.9630.120.4510.041.3870.060.4480.090.4210.070.6110.13
IMI urea0.20.9960.050.8650.10.5030.070.9990.040.5380.051.3250.13
10.00.8970.090.9050.120.4870.110.8960.090.4760.081.4510.14
6-CNA 2.00.8690.061.4710.091.4170.090.8940.111.3080.071.3260.06
100.00.8570.141.3020.061.3490.051.0570.141.4110.071.2590.15
Imidacloprid (IMI), 6-chloronicotinic acid (6-CNA).
Table 3. Analytical performance of imidacloprid and its metabolites in matrix-matched solutions.
CompoundIndexPlasmaCephalothoraxHepatopancreaGillIntestineMuscle
IMI Linear range (μg·L−1)0.1–5.00.1–5.00.1–5.00.1–5.00.1–5.00.1–5.0
Regression equation dy = 0.937x + 0.395y = 0.370x + 0.691y = 1.478x − 0.284y = 0.633x + 0.121y = 0.882x + 0.109y = 0.902x + 0.251
Correlation coefficient (R2)0.99310.99780.99690.99350.99040.9937
MOQ e (μg·L−1 or μg·kg−1)0.050.050.050.050.050.05
5-Hydroxy IMILinear range (μg·L−1)2.0–100.02.0–100.02.0–100.02.0–100.02.0–100.02.0–100.0
Regression equation dy = 0.119x + 0.396y = 0.137x − 0.275y = 0.116x + 0.703y = 0.096x + 0.439y = 0.082x + 0.123y = 0.090x − 0.096
Correlation coefficient (R2)0.99770.99160.99010.99470.99960.9914
MOQ e (μg·L−1 or μg·kg−1)1.01.01.01.01.01.0
olefin IMILinear range (μg·L−1)5.0–200.05.0–200.05.0–200.05.0–200.05.0–200.05.0–200.0
Regression equation dy = 0.272x − 0.259y = 0.150x − 0.043y = 0.056x − 0.305y = 0.400x − 2.774y = 0.147x + 0.610y = 0.076x + 0.090
Correlation coefficient (R2)0.99460.99480.99730.99420.99820.9965
MOQ e (μg·L−1 or μg·kg−1)2.02.02.02.02.02.0
IMI ureaLinear range (μg·L−1)0.2–10.00.2–10.00.2–10.00.2–10.00.2–10.00.2–10.0
Regression equation dy = 1.593x + 0.058y = 2.058x + 0.194y = 1.567x + 0.922y = 0.723x + 4.432y = 1.570x + 0.956y = 0.754x + 0.948
Correlation coefficient (R2)0.99790.99510.99200.99840.99680.9927
MOQ e (μg·L−1 or μg·kg−1)0.10.10.10.10.10.1
6-CNA Linear range (μg·L−1)2.0–100.02.0–100.02.0–100.02.0–100.02.0–100.02.0–100.0
Regression equation dy = 0.225x + 1.364y = 0.528x + 0.576y = 0.571x + 0.143y = 0.236x + 1.269y = 0.417x + 2.456y = 0.542x + 0.954
Correlation coefficient (R2)0.99340.99470.99630.99810.99760.9935
MOQ e (μg·L−1 or μg·kg−1)1.01.01.01.01.01.0
Imidacloprid (IMI), 6 chloro-nicotinic acid (6-CNA); d x = concentration (ng/mL), y = counts (peak area); e EURACHEM (Europe chemical organisation) criterion (RSD 10%).
Table 4. Recoveries and RSDs from spiked samples .
CompoundSpike level
(μg kg−1)
PlasmaCephalothoraxHepatopancreaGillIntestineMuscle
Recovery
(%)
Intraday RSDInter-days RSDRecovery
(%)
Intraday RSDInter-days RSDRecovery
(%)
Intraday RSDInter-days RSDRecovery
(%)
Intraday RSDInter-days RSDRecovery
(%)
Intraday RSDInter-days RSDRecovery
(%)
Intraday RSDInter-days RSD
IMI0.189.67.25.696.36.36.8102.29.66.591.69.86.4100.58.110.5106.34.68.0
197.29.56.987.45.57.897.67.35.986.47.77.596.85.98.6110.48.67.7
5102.34.38.2106.79.89.498.35.28.188.96.18.694.14.29.4112.79.16.4
5-Hydroxy IMI2.089.66.05.4107.68.110.489.66.86.397.65.09.1103.86.87.994.67.65.2
2085.18.56.399.89.512.383.46.18.496.39.111.085.69.95.784.15.49.3
10097.79.78.0110.711.58.491.27.89.5102.66.57.3107.610.56.186.96.94.6
olefin IMI5.088.710.64.697.27.67.685.29.57.3110.14.66.996.88.68.988.77.68.2
50.090.35.87.688.76.89.486.86.46.995.48.68..894.67.49.994.29.39.4
200.0100.56.46.895.48.38.391.63.79.586.39.29.182.69.96.890.58.27.6
IMI urea0.298.67.27.786.79.49.486.77.910.991.57.710.686.45.812.5101.48.69.5
2.091.89.18.089.86.66.381.15.112.686.88.58.389.16.87.890.67.24.3
10.081.58.89.692.511.88.580.65.29.497.14.99.1102.27.19.380.46.89.8
6-CNA 2.087.16.95.1103.310.610.597.69.88.295.68.27.687.68.68.699.69.48.6
20.080.98.38.588.69.111.999.78.87.385.65.812.191.79.810.089.412.65.5
100.089.711.25.897.48.310.6105.97.310.697.711.95.590.512.29.3100.411.36.7
6-Chloro-nicotinic acid (6-CNA); n = 6.
Table 5. MS parameters for imidacloprid and its metabolites.
AnalyteIonization ModePrecursor Ion
(m/z)
Product Ion
(m/z)
Collision Energy
(eV)
Imidaclopridpositive256.0208.8/174.916/19
Imidacloprid-D4positive260179/21319/19
5-Hydroxy Imidaclopridpositive272.0225/226.114/9
Olefin imidaclopridnegative251.9204.9/81.114/10
Imidacloprid ureapositive212.0126/12824/18
6-Chloronicotinic acidnegative156.1112/35.113/26
Publisher’s Note: MDPI stays neutral with regard to jurisdictional claims in published maps and institutional affiliations.

