Abstract
Fagonia indica is a rich source of pharmacologically active compounds. The variation in the metabolites of interest is one of the major issues in wild plants due to different environmental factors. The addition of chemical elicitors is one of the effective strategies to trigger the biosynthetic pathways for the release of a higher quantity of bioactive compounds. Therefore, this study was designed to investigate the effects of chemical elicitors, aluminum chloride (AlCl3) and cadmium chloride (CdCl2), on the biosynthesis of secondary metabolites, biomass, and the antioxidant system in callus cultures of F. indica. Among various treatments applied, AlCl3 (0.1 mM concentration) improved the highest in biomass accumulation (fresh weight (FW): 404.72 g/L) as compared to the control (FW: 269.85 g/L). The exposure of cultures to AlCl3 (0.01 mM) enhanced the accumulation of secondary metabolites, and the total phenolic contents (TPCs: 7.74 mg/g DW) and total flavonoid contents (TFCs: 1.07 mg/g DW) were higher than those of cultures exposed to CdCl2 (0.01 mM) with content levels (TPC: 5.60 and TFC: 0.97 mg/g) as compared to the control (TPC: 4.16 and TFC: 0.42 mg/g DW). Likewise, AlCl3 and CdCl2 also promoted the free radical scavenging activity (FRSA; 89.4% and 90%, respectively) at a concentration of 0.01 mM, as compared to the control (65.48%). For instance, the quantification of metabolites via high-performance liquid chromatography (HPLC) revealed an optimum production of myricetin (1.20 mg/g), apigenin (0.83 mg/g), isorhamnetin (0.70 mg/g), and kaempferol (0.64 mg/g). Cultures grown in the presence of AlCl3 triggered higher quantities of secondary metabolites than those grown in the presence of CdCl2 (0.79, 0.74, 0.57, and 0.67 mg/g). Moreover, AlCl3 at 0.1 mM enhanced the biosynthesis of superoxide dismutase (SOD: 0.08 nM/min/mg-FW) and peroxidase enzymes (POD: 2.37 nM/min/mg-FW), while CdCl2 resulted in an SOD activity up to 0.06 nM/min/mg-FW and POD: 2.72 nM/min/mg-FW. From these results, it is clear that AlCl3 is a better elicitor in terms of a higher and uniform productivity of biomass, secondary cell products, and antioxidant enzymes compared to CdCl2 and the control. It is possible to scale the current strategy to a bioreactor for a higher productivity of metabolites of interest for various pharmaceutical industries.
1. Introduction
Plant-based products have piqued the interest of many nutraceutical and pharmaceutical companies, who prefer them to synthetic medications [1]. Fagonia indica is one of the most important medicinal plants that belong to the family Zygophyllaceae with restricted global distribution and can be found in several parts of the world, including Pakistan, India, and Afghanistan [2]. F. indica has been investigated extensively, and its therapeutic properties are well documented. Saponins, alkaloids, terpenoids, sterols, flavonoids, and trace elements are among the bioactive chemicals that give this plant its therapeutic effects [3]. Its multiple therapeutic properties include anti-inflammatory [4], hepato-protective [5], anticancer [6], anti-diabetic [7], antimicrobial [8], antioxidant [9], antihemorrhagic, anthelminthic, and thrombolytic features [10].
Due to the medical value of F. indica, there has been a significant increase in market demand for the plant in recent years. The natural supply of this valuable herb is insufficient to meet the rising demand. Alternative approaches for balancing the supply and demand chain should be pursued [11]. Plant cell factories have the advantage of establishing plant in vitro cultures for the production of continuous, consistent, and healthy plant material with long-term metabolite profiles [12]. The plant has been studied in vitro to generate essential phytochemicals using various culture systems, to increase the production of medicinally relevant secondary metabolites [11,13,14]. Elicitation in plant cell cultures has proven to be one of the most effective ways for increasing medicinal chemical production, and it has commercial implications [15,16]. In plant cell cultures, elicitors tend to trigger multiple physiological events that eventually lead to the activation of a cascade of reactions that include the expression of defense-related genes, the production of reactive oxygen species (ROS), and the accumulation of important secondary metabolites such as polyphenolics [17,18]. There are many different types of elicitors divided into two categories based on their nature or origin: biotic and abiotic elicitors [19].
Previously, elicitors were used to optimize the synthesis of medicinally important phytochemicals in numerous in vitro cultures, including callus and adventitious root cultures of F. indica [19,20,21]. In vitro cultures of F. indica have been used to activate the production of health-promoting secondary metabolites by adding elicitors or plant growth regulators such as methyl jasmonate (Me-J), polyacrylic acid (PAA), and melatonin [11,20]. In addition, in callus cultures, changes in carbohydrate supply and fungal-derived chitosan elicitors have been successfully used to elicit secondary metabolites in F. indica [19,20]. In addition to biotic elicitors, abiotic elicitors such as light, temperature, air, ultraviolet radiation (UV), pH variations, and heavy metal salts have been used to generate optimal metabolite concentrations in plant cell cultures over the last few decades [22,23].
Heavy metals among abiotic elicitors have been extensively utilized in several plant species to boost growth, phytochemicals accumulation, and antioxidant potential [24,25,26,27]. Previously, the salts of cadmium (Cd2+) (generally applied as cadmium chloride (CdCl2)) and aluminum chloride (AlCl3) have been reported for the improved production of compounds in the callus culture of Rauvolfia serpentina [28], suspension culture of Melissa officinalis L. [29], and cell culture of Vitis vinifera [30]. However, heavy metals are seen to possess toxicity in their application to plant cells under controlled conditions. Furthermore, plants have a powerful antioxidant defense system that produce higher quantities of phenolic compounds that, in turn, chelate metal ions and thus help in their sequestration [31].
AlCl3 has been shown to promote growth and stimulate secondary metabolites in plant cultures, as well as cope with reactive oxygen species (ROS) by promoting the production of antioxidative enzyme genes such as glutathione S-transferase, peroxidase (POD), and superoxide dismutase (SOD) [32,33,34].
However, no previous studies on the impact of heavy metal salts on the generation of medicinal substances in F. indica callus culture have been published. As a result, the current study was designed to show how AlCl3 and CdCl2 affect cellular biomass, secondary cell products, and the antioxidant system in F. indica callus cultures. In addition, the treated cultures were measured using high-performance liquid chromatography to determine the bioactive metabolites.
2. Results and Discussion
2.1. Abiotic Elicitors-Induced Variation in Cellular Biomass in Calli Cultures of F. indica
Stem-derived callus cultures of F. indica optimized previously by our research group were analyzed for AlCl3 and CdCl2 salts’ effects on biomass accumulation. Our investigations showed that lower concentrations of both elicitors had growth-promoting effects (Figure 1). The maximum biomass fresh weight (FW: 404.7 g/L) and dry weight (DW: 14.5 g/l) was recorded in cultures inoculated on MS media augmented with AlCl3 (0.1 mM) as compared to the control (269.85 g/L). The biomass decreased with the concentration of AlCl3 (Figure 2). It is interesting to note that our results are in agreement with the previous reports [28,35], where lower concentrations of these elicitors are superior in inducing higher cellular biomass in plant cell cultures. Similarly, the maximum biomass accumulation induced by CdCl2 (0.01 mM) in terms of fresh weight (FW: 378.9 g/L) and dry weight (DW: 14.3 g/L) was comparatively lowered than AlCl3, and likely, the minimum cellular biomass accumulation (64.3 g/L-FW and 2.21 g/L-DW) was recorded when cultures were exposed to 5.0 mM of CdCl2 (Figure 3). Furthermore, the callus cultures were also investigated for morphological features under AlCl3 and CdCl2 inoculations.
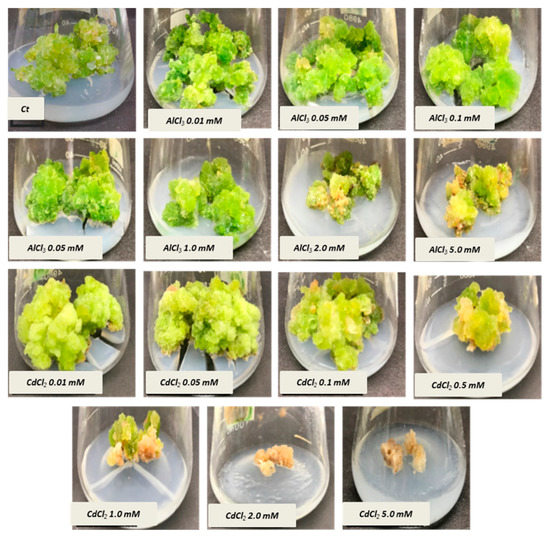
Figure 1.
Morphological characteristics of calli incubated for 35 days under different concentrations of aluminum chloride (AlCl3) and cadmium chloride CdCl2 (color, texture, and morphology).
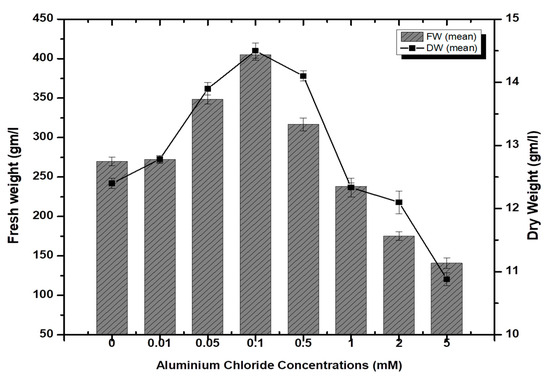
Figure 2.
Aluminum chloride-elicited biomass accumulation (fresh and dry weight) in callus culture of F. indica under seven different concentrations along with control. All the values are mean ± SE.
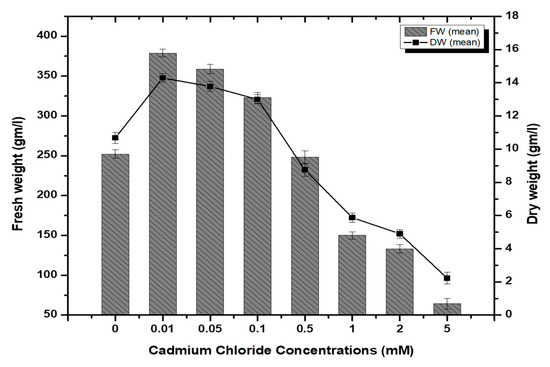
Figure 3.
Cadmium chloride-elicited biomass accumulation (fresh and dry weight) in callus culture of F. indica under seven different concentrations along with control. All the values are mean ± SE.
The callus cultures grown on both elicitors were observed to be compact and green at lower concentrations while friable and brown at the highest concentrations (Figure 1). This could be possibly due to the hypersensitivity induced by higher concentrations, i.e., leading to cell death [36,37]. In previous investigations, lower concentrations of CdCl2 resulted in increased biomass accumulation. In contrast, higher concentrations decreased several growth indices in plant cultures such as Vigna radiata, i.e., mung bean [38], Vitis vinifera cv. Cell suspension cultures [39], sugar cane callus cultures [40], hairy root cultures of Brugmansia candida [41], and roots of Atropa belladonna [23], and a marked decline in cell viability in Nicotiana tabacum L cells [42]. Many investigators have demonstrated inhibitory effects of heavy metals on plant growth by measuring various growth parameters such as root elongation, protein concentration, phenolic biosynthesis, and fresh and dry cellular biomass [43,44,45].
2.2. Effect of Elicitation on Total Phenolic and Flavonoid Biosynthesis
High doses of elicitor have been shown to cause hypersensitivity and cell death, whereas a moderate level was required for optimal secondary metabolite induction [36,37]. Inorganic salts/chemicals such as AgNO3, CdCl2, AlCl3, and HgCl2 have been employed widely in various plant species to trigger and increase the production of bioactive molecules by altering secondary metabolism [27]. Callus cultures of F. indica elicited with different concentrations of AlCl3 and CdCl2 showed a varying effect on total phenolics accumulation. Cultures added with AlCl3 showed a maximum elicitation of total phenolic content (TPC) (7.74 mg/g DW) and (7.64 mg/g DW) at 0.01 and 0.05 mM of AlCl3, respectively, as compared with the control (4.159 mg/g DW) (Figure 4). Maximum levels for total flavonoid content (TFC) (1.069 mg/g DW), (1.014 mg/g DW), and (0.998 mg/g DW) were recorded at 0.1, 0.05, and 0.01 mM of AlCl3, respectively, while a further increase in AlCl3 resulted in a decrease in flavonoid productions as compared with the control (0.4225 mg/g DW) (Figure 5). Furthermore, for cultures elicited with AlCl3, maximum values for total flavonoid production (22.11 mg/L) and (18.6 mg/L) were observed at 0.01 and 0.1 mM of AlCl3, respectively (Figure 5). In a similar study on root cultures of Gloriosa superba, AlCl3 greatly enhanced the phenolic and flavonoid content, as well as the production of colchicine [35]. An increase in reserpine content in response to low doses of AlCl3 has also been reported [28].
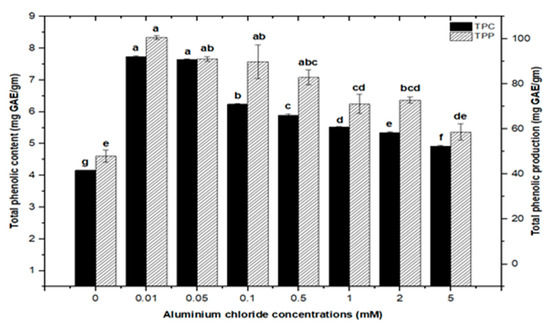
Figure 4.
Total phenolic contents and phenolic production of F. indica calli elicited with seven different concentrations of aluminum chloride and control. All the values are mean ± SE. Bars labeled with different letters (LSD values) exhibit significant variation (α < 0.05).
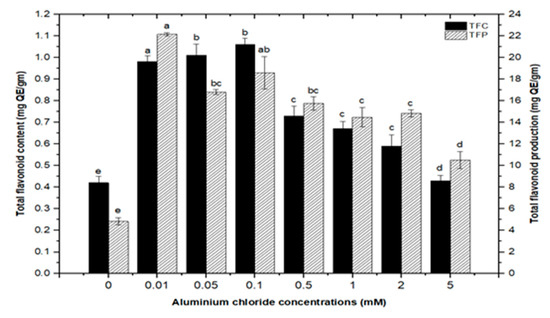
Figure 5.
Total flavonoids contents and flavonoids production of F. indica calli elicited with seven different concentrations of aluminum chloride and control. All the values are mean ± SE. Bars labeled with different letters (LSD values) exhibit significant variation (α < 0.05).
Similarly, callus cultures subjected to CdCl2 treatment had maximum total phenolic contents of (5.590 mg/g DW) and (5.501 mg/g DW) at 0.01 and 0.05 mM, respectively, with a similar maximum value (5.156 mg/g DW) at 0.1 mM of CdCl2. CdCl2 demonstrated a substantial inhibitory impact at higher concentrations, with the lowest total phenolic content (1.104 mg/g DW) detected at 5.0 mM, compared to total phenolic content (1.792 mg/g DW) and (1.762 mg/g DW) at 1.0 and 2.0 mM, respectively. The total phenolic synthesis in callus cultures was triggered with CdCl2 doses, with the highest value (81.911 mg/L) seen at 0.01 mM of CdCl2, followed by a similar maximum value (77.94 mg/L) at 0.05 mM of CdCl2 (Figure 6).
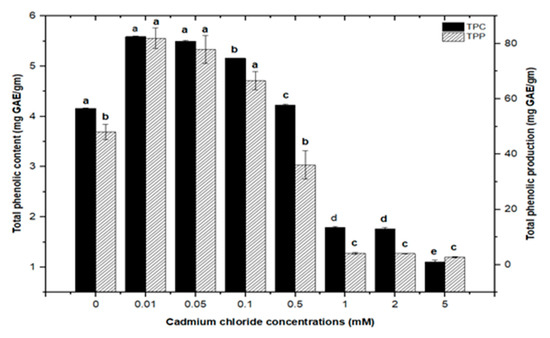
Figure 6.
Total phenolic contents and phenolic production of F. indica calli elicited with seven different concentrations of cadmium chloride and control. All the values are mean ± SE. Bars labeled with different letters (LSD values) exhibit significant variation (α < 0.05).
Furthermore, adding greater concentrations of CdCl2 to callus cultures (0.5, 0.1, 2.0, and 5 mM) caused evident toxicity and a decrease in total phenolic synthesis. Maximum comparable values for total flavonoid contents (1.062 mg/g DW), (1.010 mg/g DW), and (0.976 mg/g DW) were found at respective treatments of 0.1, 0.05, and 0.01 mM of CdCl2, as compared with the control. The higher concentrations of CdCl2 (0.5, 1.0, and 2.0 mM of CdCl2) resulted in maximum possible flavonoids accumulations (0.730 mg/g DW), (0.672 mg/g DW), and (0.591 mg/g DW), respectively. However, CdCl2 at 5.0 mM resulted in the least value for total flavonoid content (0.432 mg/g DW), closely similar to that of the control with (0.4225 mg/g DW) of total flavonoid content (Figure 7). For total flavonoid production in CdCl2-treated calli, maximum values for total flavonoid production (14.322 mg/L), (14.306 mg/L), and (13.715 mg/L) were observed at 0.01, 0.05, and 0.1 mM of CdCl2. Previously, many studies have shown CdCl2 as an effective elicitor for optimum phytochemicals production in in vitro cultures of Salvia miltiorrhiza [18], Catharanthus roseus [46], and Datura stramonium [47]. Similar results were also reported by [30,39].
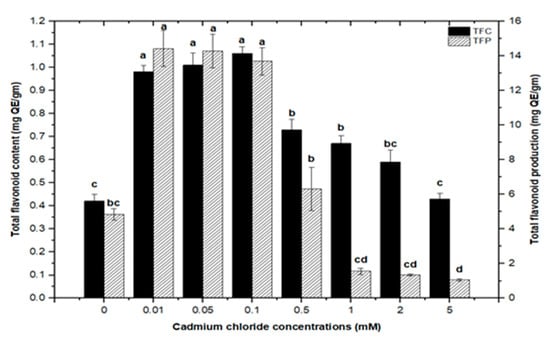
Figure 7.
Total flavonoids contents and flavonoids production of F. indica calli elicited with seven different concentrations of cadmium chloride and control. All the values are mean ± SE. Bars labeled with different letters (LSD values) exhibit significant variation (α < 0.05).
2.3. Correlation of Total Phenolics and Flavonoids Content with Radical Scavenging Activity
Natural antioxidants are vital substances that can protect organisms from damage caused by oxidative stress generated by free radicals [48]. As a result, plants have evolved a variety of defense measures (antioxidant system) to scavenge the harmful radicals created during oxidative stress, allowing them to survive [13,28,30,49,50]. Variable antioxidant activity in response to heavy metals (AlCl3 and CdCl2) was examined to understand better the influence of heavy metal elicitors on antioxidant activity. Calli elicited with AlCl3 and CdCl2 significantly enhanced the radical scavenging activity by approximately 30% with respect to control cultures (Figure 8). The addition of lower concentrations of AlCl3 to the incubation medium caused a significant increase in antioxidant activity. It showed maximum activities of 89.40%, 88.60%, 87.40%, and 86.10% at 0.01, 0.05, 0.1, and 0.5 mM of AlCl3, respectively, as compared to the control (65.30%).
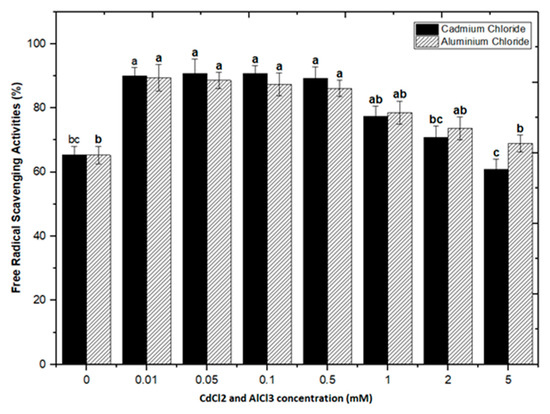
Figure 8.
DPPH free radicals scavenging activity of F. indica calli elicited with seven different concentrations of cadmium chloride and aluminum chloride and control. All the values are mean ± SE. Bars labeled with different letters (LSD values) exhibit significant variation (α < 0.05).
Lower doses of CdCl2 resulted in maximum activities of 90.0%, 90.8%, 90.8% and 89.2% in cultures, respectively, at 0.01, 0.05, 0.1, and 0.5 mM of CdCl2. Higher AlCl3 and CdCl2 concentrations (1, 2, and 5 mM) increased the antioxidant activity less or not at all compared to the control (Figure 8). The radical scavenging activity of both AlCl3 and CdCl2 was found to be strongly correlated with the increase in phenolic and flavonoid contents (Figure 9 and Figure 10). The plants either use antioxidant enzymes to scavenge the toxic products of ROS or the synthesis of compounds to combat stress conditions. Currently, the addition of AlCl3 and CdCl2 induced stress conditions. Therefore, the plant cell activated the defense system and released polyphenolics, especially phenolics and flavonoids that protect the plant cells from damaging agents. Thus, these salts are directly correlated with the defense system of plants and activate it to produce phenolics to protect plant cells.
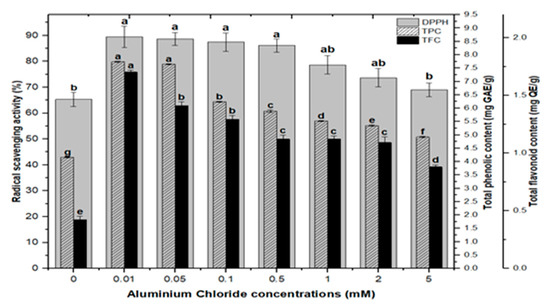
Figure 9.
Radical scavenging activity (DPPH %) in comparison with total phenolic contents (TPCs) and total flavonoid contents (TFCs) (correlation ‘r’ DPPH vs. TPC = 0.815 and DPPH vs. TFC = 0.838) in F. indica callus culture elicited with seven different concentrations of aluminum chloride along with control. Bars labeled with different letters (LSD values) exhibit significant variation (α < 0.05).
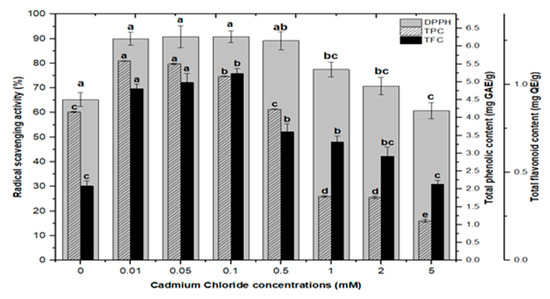
Figure 10.
Radical scavenging activity (DPPH %) in comparison with total phenolic contents (TPCs) and total flavonoid contents (TFCs) (correlation ‘r’ DPPH vs. TPC = 0.727 and DPPH vs. TFC = 0.925) in F. indica callus cultures elicited with seven different concentrations of cadmium chloride along with control. Bars labeled with different letters (LSD values) exhibit significant variation (α < 0.05).
2.4. Effect of AlCl3 and CdCl2 on Antioxidant Enzyme Activities
Cellular membranes, nucleic acids, proteins, lipids, and chlorophyll can be damaged by reactive oxygen species (ROS). As four principal active oxygen species formed in plant tissues, the most common ROSs are O2 (superoxide radical), H2O2 (hydrogen peroxide), OH (hydroxyl radical), and singlet oxygen [30,51,52]. Plants have evolved a well-organized anti-oxidative enzymatic system to deal with stress and damage caused by ROS, with superoxide dismutase (SOD) and peroxidase (POD) serving as the first line of defense [43,45,53]. In this study, the activities of SOD and POD were measured in callus cultures of F. indica to assess their role in heavy metal (AlCl3 and CdCl2) salt stress. Our research revealed that callus cultures had stronger superoxide dismutase (SOD) and peroxidase (POD) activities than control cultures did.
Highest superoxide dismutase (SOD: 0.088 nM/min/mg FW) and peroxidase enzyme activities (POD: 2.372 nM/min/mg FW) were recorded in culture with AlCl3 elicitation (concentrations of 0.1 mM), respectively, in comparison with the control: SOD: 0.025 and POD: 1.69 nM/min/mg FW (Figure 11). Similarly, the antioxidant enzyme activities for cultures inoculated with CdCl2 were SOD (0.058 nM/min/mg FW) and POD (2.721 nM/min/mg FW) with CdCl2 elicitation at a 0.1 mM concentration and CdCl2 (0.5 mM) respectively, when compared to the control (Figure 12). The increased enzymatic activities in cultures provoked with heavy metal salts have been previously proved to be due to inducing ROSs that further increase the expression levels of several genes encoding antioxidative enzymes such as glutathione S-transferase and peroxidase, and superoxide dismutase [45,54,55].
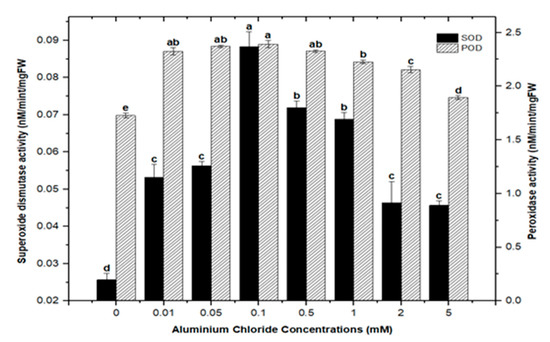
Figure 11.
Superoxide dismutase and peroxidase activity of F. indica calli elicited with seven different concentrations of aluminum chloride along with the control. Bars labeled with different letters (LSD values) exhibit significant variation (α < 0.05).
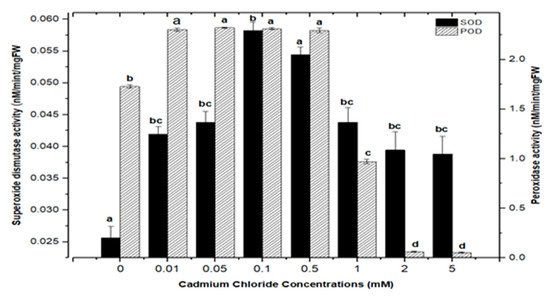
Figure 12.
Superoxide dismutase and peroxidase activity of F. indica calli elicited with seven different concentrations of cadmium chloride along with control. Bars labeled with different letters (LSD values) exhibit significant variation (α < 0.05).
Moreover, the least activities observed were (SOD: 0.045 nM/min/mg FW and POD: 1.895 nM/min/mg FW) in AlCl3 and (SOD: 0.038 nM/min/mg FW and POD: 0.053 nM/min/mg FW) with CdCl2 recorded at a concentration of (5.0 mM) of both elicitors (Figure 11 and Figure 12). Overall, lower doses of both metals as elicitors resulted in increased activities, whereas higher concentrations inhibited the lowest SOD and POD activities. Inactivation of the enzymes due to overproduction of ROS or inactivation of the enzyme by H2O2 in various compartments could explain the reduction in enzymes at higher metal concentrations [56]. Similar results have been reported in different plants where a specific level of Cd produces increases in SOD and POD activities, with higher increases causing a drop in enzymatic activities [52,55,57,58,59,60].
2.5. Quantification of the Main Phytochemicalsin-Treated Callus Cultures of F. indica
HPLC is an essential tool for evaluating secondary metabolites that provide a robust fingerprint analysis of plant therapeutic compounds [11]. This study used HPLC analysis to look into 11 different phenolic compounds in F. indica callus cultures provoked with AlCl3 and CdCl2 heavy metal salts (Table A1). In response to all AlCl3 concentrations, there was a significant increase in myricetin content. In reaction to 0.05 mM, the maximum enhancement (1.70-fold) was reported (Figure 13). Apigenin was enhanced similarly (1.37-fold, compared to control). Higher AlCl3 concentrations raised kaempferol levels (1.48-fold, compared to control). Isorhamnetin levels rose in response to reduced AlCl3 concentrations (1.33-fold, compared to control) (Figure 13). The content of kaempferol and apigenin was significantly increased at all CdCl2 doses. At 0.05, the maximum enhancement for kaempferol (1.31-fold compared to control) was reached, whereas, at 2 mM, the maximum enhancement for apigenin (1.41-fold compared to control) was achieved. The content of myricetin was marginally enhanced when the CdCl2 concentration was raised (1.13-fold, compared to control). Higher concentrations of CdCl2 increased isorhamnetin levels, although only to a lesser extent (1.08-fold, compared to control) (Figure 14). These four phenolics are all polyphenols, which are also known as flavonoids. The rest of the phenolics (simple phenols), also known as phenolic acids, showed no significant rise or decrease in response to the heavy metal amounts studied. These results show that AlCl3 and CdCl2 have enhancing effects on flavonoids. In diverse cancer cell lines, phenolic substances such as myricetin, apigenin, catechin, kaempferol, and isorhamnetin decrease oncogenes, reduce antioxidative stress, induce apoptosis, and stop the cell cycle [13].
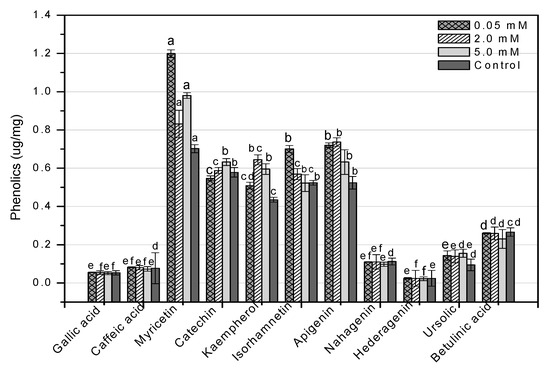
Figure 13.
HPLC-based quantification of phenolic compounds in F. indica calli elicited with seven different concentrations of aluminum chloride along with control. Mean values with standard errors (± SE) and bars labeled with different letters (LSD values) exhibit significant variation (α < 0.05).
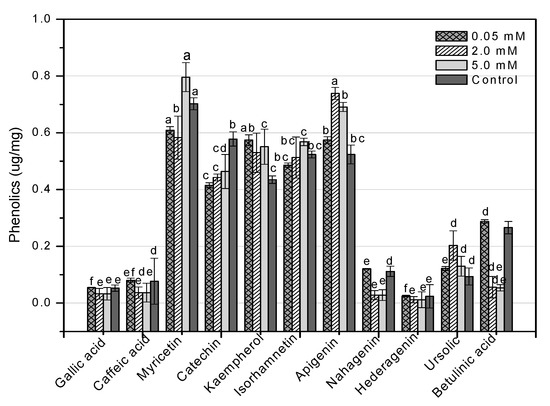
Figure 14.
HPLC-based quantification of phenolic compounds in F. indica calli elicited with seven different concentrations of cadmium chloride along with control. Mean values with standard errors (± SE) and bars labeled with different letters (LSD values) exhibit significant variation (α < 0.05).
3. Materials and Methods
3.1. Elicitation of Callus Culture with AlCl3 and CdCl2
Stems from one-month-old in vitro-germinated plantlets grown on solid MS (Murashige and Skoog 1962) medium (hormone-free) were selected as an explant source for callogenesis, as described by [13]. The explants were collected and aseptically cultured on an MS medium containing 3% sucrose and 0.8% agar, and augmented with 1.0 mg/L of thidiazuron (TDZ) at pH level 5.6 to induce callus formation. The medium was autoclaved at 121 °C for 20 min. The cultures were maintained at a 25 ± 2 °C temperature with a 70% relative humidity and a 16/8 h (light/dark) photoperiod providing an average illumination of 40 μmol/m2/s (Philips TLD 35 white light tubes). Fresh calli (0.5 g FW) were obtained and grown on MS media supplemented with AlCl3 and CdCl2 at 7 different doses (0.01, 0.05, 0.1, 0.5, 1.0, 2.0, and 5.0 mM) along with 1.0 mg/L of TDZ. The calli on the same MS medium fortified with TDZ (1.0 mg/L) only were used as the control group. The cultures were placed at 25 ± 2 °C in a growth room having a 16/8 h photoperiod, light intensity of 40 μmol/m2/s, and approximately 70% relative humidity. After 35 days of growth, the calli were harvested and gently kept on filter paper to detach media or normalize water content before fresh weight determination. After that, calli were oven-dried for dry weight determination and subsequently ground for further phytochemical analysis.
3.2. Determination of Total Phenolic Content (TPC) and Flavonoid Content (TFC)
The sample extraction for phytochemical analysis, i.e., total phenolic contents (TPCs) and total flavonoid contents (TFCs), was performed according to the protocol described by [61]. Dried samples (50 mg) were ground into powder, immersed in 500 µL of MeOH (Sigma Aldrich, Saint Quentin Fallavier, France), and sonicated for 60 min at 25 °C with a 45 kHz ultrasonic frequency (ElmaTM E plus 40H, Elma Schmidbauer GmbH, Singen, Germany). Vortexing for 5 min was used to collect extract, followed by centrifugation at 10,000 rpm for 15 min (SpectrafugeTM 24D microcentrifuge, Labnet international, Edison, NJ, USA). The supernatant was filtered using a syringe and decanted into sterile storage tubes (1.5 mL Eppendorf tubes) at 4 °C.
The Folin–Ciocalteu reagent method (FCRM) was used for the assessment of total phenolic contents (TPCs), as per the method of [62]. For TPC determination, 90 μL of the Folin–Ciocalteu reagent (10× diluted in deionized distilled water) was added to each well of 96-well microplates containing 20 μL of the samples and allowed to react. This was followed by adding 90 μL of sodium carbonate (6 g/100 mL of distilled water) to each sample mixture, swirled gently, and finally allowed to stand for 90 min at room temperature. After incubation, the absorbance of the reaction mixture was measured spectrophotometrically at 630 nm using a microplate reader (ELx800BioTek, BioTek Instruments, Colmar, France). To plot the calibration curve (R2 = 0.967), gallic acid (0–50 μg/mL) was employed as standard. TPC was expressed as gallic acid equivalent (mg GAE/g) of DW.
Total phenolic production was calculated by using the following formula and expressed in mg/L.
Total phenolic production (mg∕L) = DW (g∕L) × TPC (mg∕g)
Total flavonoids content was determined according to the aluminum chloride colorimetric method described by [63]. Briefly, 10 μL of aluminum trichloride solution (10 g/L of distilled water) and 10 μL (1 M) of potassium acetate (98.15 g/L of distilled water) were added to the reaction wells of a 96-well plate, containing 20 μL of the samples. The final reaction volume was raised to 200 μL by adding 160 μL of distilled water and incubated for 30 min at room temperature. The solution was mixed well, and finally, the change in absorbance was recorded at 415 nm with a microplate reader (ELx800BioTek, BioTek Instruments, Colmar, France). To plot the graph, quercetin (0–50 µg/mL) was used for standardized calibration (R2 = 0.967). TFC was taken as quercetin equivalents (mg QE)/g for expression of DW.
Total flavonoid production was calculated by using the following formula and expressed in mg/L.
Total flavonoid production (mg∕L) = DW (g∕L) × TFC (mg∕g)
3.3. Determination of SOD and POD Activities
Extraction from a fresh sample was performed using the protocol of [64]. Briefly, fresh callus samples (0.1 g) were grounded in a mortar and pestle with 1 mL of extracting K-buffer (50 mM, pH 7) containing 1% polyvinylpyrrolidone (PVP). Acquired extracts were homogenized and subsequently centrifuged at 14,000 rpm for 30 min to separate the supernatant from cell debris. The supernatant was carefully removed with a micropipette and transferred into a new Eppendorf tube, and the remaining pellet was discarded. The supernatant fraction collected after centrifugation was then analyzed for analysis of POD and SOD.
Peroxidase (OD) assay was assessed by using the protocol of [65] with slight modifications. The reaction mixture of 200 μL was prepared by mixing 40 μL (50 mM) of K-phosphate buffer (pH 7), 20 μL of (100 mM) guaiacol (10×), 100 μL of distilled water, and 20 μL (27.5 mM) of H2O2 (10×), along with 20 μL of enzyme extract. An equal amount of all reagents was used as a control, excluding sample extract. After that, absorbance activity was determined spectrophotometrically at 470 nm with a 20 s gap using a microplate reader (ELx800BioTek, BioTek Instruments, Colmar, France). The enzymatic activity was measured using the formula given below:
where A = absorbance, E = extinction coefficient (6.39 mM−1 cm−1), L = length of each wall (0.25 cm), C = concentration of enzyme (value of C measured in mM/min/mg-FW), and FW = fresh weight of the sample.
A = ELC,
Superoxide dismutase activity (SOD) was carried out using Giannoplolitis and Ries’ protocol [66]. The reaction mixture of 200 μL was prepared in a 96-well microplate containing all the required reagents that include 78 μL (50 mM) of phosphate buffer of pH 7, 20 μL (1 mM) of EDTA, 20 μL (130 mM) of methionine, 20 μL (0.75 mM) of NBT, and 2 μL (0.02 mM) of riboflavin, along with 60 μL of enzyme extract. Similarly, a blank was also prepared by mixing these chemicals, excluding fresh sample extract. This reaction mixture was exposed to fluorescent light for 7 min followed by OD measurement at 660 nm using a microplate reader (ELx800BioTek, BioTek Instruments, Colmar, France). The Equation (3) was opted for measuring enzymatic activity.
3.4. Determination of Free Radical Scavenging Assay (DPPH)
Free radical scavenging activity (FRSA) was measured using 2,2-diphenyl-1-picrylhydrazyl (DPPH) for the determination of antioxidant potential, as described by [67]. The stock reagent solution was prepared by dissolving 3.2 mg of DPPH in 100 mL of methanol and stored in a refrigerator until use. Briefly, 180 μL of 2,2-diphenyl-1-picrylhydrazyl (DPPH) reagent was added to the entire row of wells containing 20 μL of the samples to obtain the final concentrations of 200 μL. The OD was recorded at 517 nm using a microplate reader (ELx800BioTek, BioTek Instruments, Colmar, France) after 1 h of incubation in the dark at room temperature. The antioxidant potential of each biological sample was calculated as % DPPH discoloration, calculated by the following formula:
where Abc = absorbance of the control and Abs = absorbance of the sample
% scavenging = (Abc − Abs/Abc) × 100
3.5. HPLC Quantification
High-performance liquid chromatography (HPLC) was employed to quantify the presence of pharmaceutically important phenolic and flavonoid compounds in calli cultures of F. indica. The powdered calli samples, harvested at week 5, were analyzed through HPLC. An extract of dried material was prepared in 80% v/v (20 mL) methanol (aqueous). Then, extraction was carried out in an ultrasonic bath, USC 1200TH (Prolabo Prolabo, Fontenay-sous-Bois, France) with inner dimension: 300 mm × 240 mm × 200 mm, equipped with an electrical power of 400 W (i.e., acoustic power of 1 W/ cm2), a maximal heating power of 400 W and variable frequencies, equipped with a digital timer, and a frequency and a temperature controller having a 30 kHz frequency for 1 h at 25 ± 2 °C. Following extraction, centrifugation of the samples was performed, and the supernatant was filtered with a 0.45 μm syringe filter (Millipore) before HPLC analysis. Phytochemical analysis was carried out using a Varian liquid chromatographic system (Varian, Les Ulis, France) composed of a Varian Prostar 230 pump, Metachem Degasit, Varian Prostar 410 autosampler, and Varian Prostar 335 Photodiode Array Detector (PAD), and it was controlled by Galaxie version 1.9.3.2 software. The reference standards used were gallic acid, caffeic acid, myricetin, catechin, kaempferol, isorhamnetin, apigenin, nahagenin, hederagenin, ursolic acid, and betulinic acid, purchased from Sigma Company, USA. A Purospher (Merck Chemical, Saint-Quentin Fallavier, France) RP-18 column (250 mm × 4.0 mm. id; 5 μm) was utilized for separation, and separation was performed at 35 °C. The mobile phase consisted of two solvents, solvent A (0.2% acetic acid in water) and solvent B (methanol). For mobile phase variation, a nonlinear gradient was applied with a flow rate of 0.8 mL/min as follows: from 0 to 40 min of A–B: 90:10 (v/v) to 30:70 (v/v), from 41 to 50 min of A–B: 30:70 (v/v) to 0:100 (v/v), and A–B: 0:100 (v/v) from 51 to 60 min. A UV-Vis spectrophotometer performed detection at 260 nm for simple phenolics, 360 nm for flavonoids, and 210 nm for saponins (Figure 15). The phenolic compounds were identified based on their comparison with the retention time and UV spectra to reliable reference standards. Quantification was performed using 5-points calibration curves of each standard with a correlation coefficient of at least 0.998. The quantifications were recorded using calibration curves and retention times of corresponding reference standards. All the samples were assayed in triplicate, and the results were expressed as micrograms per milligram of DW of the sample.
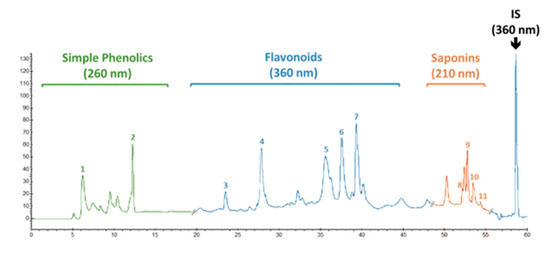
Figure 15.
Typical HPLC chromatogram showing the presence of simple phenolics (gallic acid (1) and caffeic acid (2) recorded at 260 nm), flavonoids (catechin (3), myricetin (4), kaempferol (5), isorhamnetin (6), and apigenin (7) recorded at 360 nm), and saponins (hederagenin (8), betulinic acid (9), ursolic acid (10), and nahagenin (11) recorded at 210 nm) in in vitro (callus) culture of F. indica. 5-methoxyflavone (0.2 µg/mL) was used as an internal standard (detection set at 360 nm).
3.6. Experimental Design and Data Analysis
To investigate the effect of AlCl3 and CdCl2 elicitors on callus culture, seven concentrations of each elicitor and two controls as treatments were adopted under a randomized complete block design. All experimental results were means of three independent replicates. One-way ANOVA was used to test statistical differences, followed by Tukey’s HSD for post hoc analysis (Minitab statistical package 17, State College, PA, USA). Differences were considered significant at p < 0.05. Data were also evaluated using Pearson’s correlation coefficients to identify relationships between phenolic contents and selected antioxidant activities of F. indica calli. All the figures were made using the Origin Pro 2017 package (OriginLab, Northampton, MA, USA). All the data were represented as mean with standard error.
4. Conclusions
This study aimed to develop an effective elicitation technique for inducing biomass and metabolite biosynthesis in F. indica callus cultures. Heavy metal salts AlCl3 and CdCl2 were discovered to have considerable effects on biomass and phytochemicals, as well as antioxidative enzyme activity. Overall, AlCl3 produced the maximum amount of fresh weight biomass, phenolics, and flavonoids. HPLC examination revealed that AlCl3-mediated cultures accumulated the most chemicals compared to CdCl2 and control cultures. Similarly, AlCl3 was found to produce more free radical scavenging activities and antioxidant enzyme activities (SOD and POD) than cadmium chloride. Higher quantities of both elicitors, on the other hand, were found to have inhibitory effects on practically all of the parameters studied. As a result of this study’s practical approach, instead of direct extraction from the wild, key phytochemicals can be produced, reducing the risk of extinction for this species. To remove hazardous metals, chemical precipitation or filtering is currently employed in industry. As a result, we anticipate that if industrial use is desired, these techniques will be able to remove residues of metals in the extracts. However, further high-throughput investigations are needed to decode the molecular mechanisms that increase metabolite synthesis when heavy metals are elicited.
Author Contributions
Conceptualization: H.K., T.K. (Tariq Khan), N.A., C.H. and B.H.A.; methodology: T.K. (Tariq Khan), G.Z., Z.H., W.A. and S.D.; software: W.A., S.B. and N.A.; validation: N.A., H.K., Z.H. and G.Z.; formal analysis: T.K. (Taimoor Khan) and N.A.; investigation: H.K., Z.H., W.A. and S.D. data curation: H.K. and W.A.; writing—review and editing: H.K., T.K. (Tariq Khan), S.B. and W.A.; supervision: C.H. and B.H.A. All authors have read and agreed to the published version of the manuscript.
Funding
This research was supported by Cosmetosciences, a global training and research program dedicated to the cosmetic industry. Located in the heart of the Cosmetic Valley, this program led by the University of Orléans is funded by the Région Centre-Val de Loire (VALBIOCOSM and INNOCOSM).
Institutional Review Board Statement
Not applicable.
Informed Consent Statement
Not applicable.
Data Availability Statement
All the data are included in the present study.
Acknowledgments
B.H.A. and C.H. acknowledge the research fellowship of Le Studium-Institute for Advanced Studies, Loire Valley, Orléans, France. S.D. acknowledges research fellowships of Loire Valley Region.
Conflicts of Interest
The authors declare no conflict of interest.
Appendix A

Table A1.
HPLC-based quantification of pharmacologically important phenolic compounds in F. indica.
Table A1.
HPLC-based quantification of pharmacologically important phenolic compounds in F. indica.
| Compounds Quantified (µg/mg-DW) | 0.01 mM | 0.05 mM | 0.1 mM | 0.5 mM | 1.0 mM | 2.0 mM | 5.0 mM | 0mM | |||||||
|---|---|---|---|---|---|---|---|---|---|---|---|---|---|---|---|
| AlCl3 | CdCl2 | AlCl3 | CdCl2 | AlCl3 | CdCl2 | AlCl3 | CdCl2 | AlCl3 | CdCl2 | AlCl3 | CdCl2 | AlCl3 | CdCl2 | Control | |
| GALLIC ACID | 0.062 ± 0.022 | 0.061 ± 0.005 | 0.055 ± 0.001 | 0.055 ± 0.001 | 0.056 ± 003 | 0.062 ± 0.001 | 0.056 ± 0.017 | 0.044 ± 0.0012 | 0.057 ± 0.023 | 0.035 ± 0.001 | 0.054 ± 0.009 | 0.033 ± 0.019 | 0.051 ± 0.008 | 0.033 ± 0.022 | 0.053 ± 0.011 |
| CAFFEIC ACID | 0.097 ± 0.012 | 0.094 ± 0.008 | 0.082 ± 0.002 | 0.081 ± 0.007 | 0.084 ± 0.010 | 0.095 ± 0.001 | 0.083 ± 0.0057 | 0.059 ± 0.0064 | 0.086 ± 0.028 | 0.040 ± 0.032 | 0.080 ± 0.011 | 0.037 ± 0.020 | 0.073 ± 0.012 | 0.037 ± 0.033 | 0.077 ± 0.081 |
| MYRICETIN | 0.655 ± 0.014 | 0.799 ± 0.023 | 1.199 ± 0.020 | 0.609 ± 0.013 | 0.827 ± 0.019 | 0.771 ± 0.002 | 1.129 ± 0.017 | 0.777 ± 0.0058 | 0.662 ± 0.034 | 0.725 ± 0.009 | 0.831 ± 0.072 | 0.583 ± 0.076 | 0.980 ± 0.015 | 0.796 ± 0.051 | 0.702 ± 0.021 |
| CATECHIN | 0.522 ± 0.09 | 0.476 ± 0.013 | 0.547 ± 0.013 | 0.415 ± 0.009 | 0.623 ± 0.023 | 0.444 ± 0.0023 | 0.533 ± 0.021 | 0.566 ± 0.0031 | 0.589 ± 0.017 | 0.560 ± 0.051 | 0.588 ± 0.016 | 0.443 ± 0.012 | 0.632 ± 0.018 | 0.464 ± 0.060 | 0.578 ± 0.025 |
| KAEMPHEROL | 0.560 ± 0.016 | 0.476 ± 0.019 | 0.509 ± 0.017 | 0.574 ± 0.019 | 0.456 ± 0.021 | 0.481 ± 0.0038 | 0.605 ± 0.0057 | 0.528 ± 0.0018 | 0.626 ± 0.011 | 0.523 ± 0.068 | 0.644 ± 0.026 | 0.530 ± 0.069 | 0.595 ± 0.028 | 0.551 ± 0.062 | 0.435 ± 0.013 |
| ISORHAMNETIN | 0.674 ± 0.08 | 0.422 ± 0.011 | 0.701 ± 0.018 | 0.486 ± 0.008 | 0.567 ± 0.031 | 0.408 ± 0.0013 | 0.641 ± 0.0036 | 0.662 ± 0.0017 | 0.499 ± 0.026 | 0.670 ± 0.015 | 0.569 ± 0.029 | 0.513 ± 0.072 | 0.522 ± 0.044 | 0.568 ± 0.013 | 0.524 ± 0.012 |
| APIGENIN | 0.883 ± 0.010 | 0.601 ± 0.015 | 0.720 ± 0.013 | 0.574 ± 0.012 | 0.660 ± 0.002 | 0.626 ± 0.0028 | 0.804 ± 0.011 | 0.681 ± 0.0015 | 0.626 ± 0.034 | 0.670 ± 0.018 | 0.737 ± 0.022 | 0.739 ± 0.021 | 0.632 ± 0.065 | 0.691 ± 0.016 | 0.524 ± 0.033 |
| NAHAGENIN | 0.142 ± 0.020 | 0.146 ± 0.029 | 0.110 ± 0.001 | 0.121 ± 0.001 | 0.118 ± 0.005 | 0.145 ± 0.0023 | 0.120 ± 0.024 | 0.065 ± 0.0019 | 0.127 ± 0.051 | 0.031 ± 0.027 | 0.110 ± 0.038 | 0.028 ± 0.016 | 0.098 ± 0.011 | 0.028 ± 0.019 | 0.112 ± 0.018 |
| HEDERAGENIN | 0.028 ± 0.017 | 0.028 ± 0.002 | 0.024 ± 0.004 | 0.025 ± 0.003 | 0.025 ± 0.009 | 0.028 ± 0.0015 | 0.025 ± 0.023 | 0.018 ± 0.0040 | 0.026 ± 0.011 | 0.013 ± 0.025 | 0.024 ± 0.041 | 0.012 ± 0.011 | 0.022 ± 0.010 | 0.012 ± 0.028 | 0.024 ± 0.041 |
| URSOLIC ACID | 0.201 ± 0.001 | 0.114 ± 0.010 | 0.143 ± 0.025 | 0.122 ± 0.007 | 0.148 ± 0.011 | 0.135 ± 0.0017 | 0.134 ± 0.031 | 0.173 ± 0.0034 | 0.087 ± 0.026 | 0.195 ± 0.022 | 0.139 ± 0.034 | 0.203 ± 0.052 | 0.155 ± 0.021 | 0.130 ± 0.035 | 0.094 ± 0.030 |
| BETULINIC ACID | 0.338 ± 0.005 | 0.349 ± 0.003 | 0.260 ± 0.003 | 0.288 ± 0.006 | 0.280 ± 0.009 | 0.348 ± 0.0011 | 0.286 ± 0.0057 | 0.146 ± 0.0011 | 0.304 ± 0.0173 | 0.061 ± 0.020 | 0.259 ± 0.033 | 0.056 ± 0.038 | 0.230 ± 0.049 | 0.054 ± 0.011 | 0.266 ± 0.022 |
References
- Ahmad, M.; Qureshi, R.; Arshad, M.; Khan, M.A.; Zafar, M. Traditional herbal remedies used for the treatment of diabetes from district Attock (Pakistan). Pak. J. Bot. 2009, 41, 2777–2782. [Google Scholar]
- Rathore, M.K.; Sharma, M.C.; Goyal, M.; Singh, G.; Nagori, B. Pharmacognostical Studies on Stem of Fagonia schweinfurthii Hadidi. Res. J. Pharmacogn. Phytochem. 2012, 4, 7–10. [Google Scholar]
- Anil, P.; Nikhil, B.; Manoj, G.; Prakash, N. Phytochemicals and biological activities of Fagonia indica. Int. Res. J. Pharm. 2012, 3, 56–59. [Google Scholar]
- Alqasoumi, S.I.; Yusufoglu, H.S.; Alam, A. Anti-inflammatory and wound healing activity of Fagonia schweinfurthii alcoholic extract herbal gel on albino rats. Afr. J. Pharm. Pharmacol. 2011, 5, 1996–2001. [Google Scholar]
- Bagban, I.; Roy, S.; Chaudhary, A.; Das, S.; Gohil, K.; Bhandari, K. Hepatoprotective activity of the methanolic extract of Fagonia indica Burm in carbon tetra chloride induced hepatotoxicity in albino rats. Asian Pac. J. Trop. Biomed. 2012, 2, S1457–S1460. [Google Scholar] [CrossRef]
- Waheed, A.; Barker, J.; Barton, S.J.; Owen, C.P.; Ahmed, S.; Carew, M.A. A novel steroidal saponin glycoside from Fagonia indica induces cell-selective apoptosis or necrosis in cancer cells. Eur. J. Pharm. Sci. 2012, 47, 464–473. [Google Scholar] [CrossRef] [PubMed]
- Saleem, S.; Jafri, L.; ul Haq, I.; Chang, L.C.; Calderwood, D.; Green, B.D.; Mirza, B. Plants Fagonia cretica L. and Hedera nepalensis K. Koch contain natural compounds with potent dipeptidyl peptidase-4 (DPP-4) inhibitory activity. J. Ethnopharmacol. 2014, 156, 26–32. [Google Scholar] [CrossRef]
- Rasool, S.; Ali, S.; Mughal, T.A. Antimicrobial and synergistic studies of Ranunculus muricatus L. against some indigenous bacteria. Pak. J. Bot. 2014, 46, 345–352. [Google Scholar]
- Pareek, A.; Godavarthi, A.; Issarani, R.; Nagori, B.P. Antioxidant and hepatoprotective activity of Fagonia schweinfurthii (Hadidi) Hadidi extract in carbon tetrachloride induced hepatotoxicity in HepG2 cell line and rats. J. Ethnopharmacol. 2013, 150, 973–981. [Google Scholar] [CrossRef]
- Shehab, N.G.; Mahdy, A.; Khan, S.; Noureddin, S. Chemical constituents and biological activities of Fagonia indica Burm F. Res. J. Med. Plant 2011, 5, 531–546. [Google Scholar] [CrossRef][Green Version]
- Khan, T.; Abbasi, B.H.; Khan, M.A.; Azeem, M. Production of biomass and useful compounds through elicitation in adventitious root cultures of Fagonia indica. Ind. Crop. Prod. 2017, 108, 451–457. [Google Scholar] [CrossRef]
- Khan, M.A.; Abbasi, B.H.; Ahmed, N.; Ali, H. Effects of light regimes on in vitro seed germination and silymarin content in Silybum marianum. Ind. Crop. Prod. 2013, 46, 105–110. [Google Scholar] [CrossRef]
- Khan, T.; Abbasi, B.H.; Khan, M.A.; Shinwari, Z.K. Differential effects of thidiazuron on production of anticancer phenolic compounds in callus cultures of Fagonia indica. Appl. Biochem. Biotechnol. 2016, 179, 46–58. [Google Scholar] [CrossRef]
- Ebrahimi, M.A.; Payan, A. Induction of callus and somatic embryogenesis from cotyledon explants of Fagonia indica Burm. J. Med. Plants By-Prod. 2013, 2, 209–214. [Google Scholar]
- Yang, L.; Stöckigt, J. Trends for diverse production strategies of plant medicinal alkaloids. Nat. Prod. Rep. 2010, 27, 1469–1479. [Google Scholar] [CrossRef] [PubMed]
- Yue, W.; Ming, Q.-l.; Lin, B.; Rahman, K.; Zheng, C.-J.; Han, T.; Qin, L.-p. Medicinal plant cell suspension cultures: Pharmaceutical applications and high-yielding strategies for the desired secondary metabolites. Crit. Rev. Biotechnol. 2016, 36, 215–232. [Google Scholar] [CrossRef]
- Zhang, B.; Zheng, L.P.; Wang, J.W. Nitric oxide elicitation for secondary metabolite production in cultured plant cells. Appl. Microbiol. Biotechnol. 2012, 93, 455–466. [Google Scholar] [CrossRef]
- Zhao, J.-L.; Zhou, L.-G.; Wu, J.-Y. Effects of biotic and abiotic elicitors on cell growth and tanshinone accumulation in Salvia miltiorrhiza cell cultures. Appl. Microbiol. Biotechnol. 2010, 87, 137–144. [Google Scholar] [CrossRef]
- Khan, T.; Khan, T.; Hano, C.; Abbasi, B.H. Effects of chitosan and salicylic acid on the production of pharmacologically attractive secondary metabolites in callus cultures of Fagonia indica. Ind. Crop. Prod. 2019, 129, 525–535. [Google Scholar] [CrossRef]
- Khan, T.; Ullah, M.A.; Garros, L.; Hano, C.; Abbasi, B.H. Synergistic effects of melatonin and distinct spectral lights for enhanced production of anti-cancerous compounds in callus cultures of Fagonia indica. J. Photochem. Photobiol. B Biol. 2019, 190, 163–171. [Google Scholar] [CrossRef] [PubMed]
- Saeed, S.; Ali, H.; Khan, T.; Kayani, W.; Khan, M.A. Impacts of methyl jasmonate and phenyl acetic acid on biomass accumulation and antioxidant potential in adventitious roots of Ajuga bracteosa Wall ex Benth., a high valued endangered medicinal plant. Physiol. Mol. Biol. Plants 2017, 23, 229–237. [Google Scholar] [CrossRef]
- Trejo-Espino, J.L.; Rodriguez-Monroy, M.; Vernon-Carter, E.; Cruz-Sosa, F. Establishment and characterization of Prosopis laevigata (Humb. & Bonpl. ex Willd) MC Johnst. cell suspension culture: A biotechnology approach for mesquite gum production. Acta Physiol. Plant 2011, 33, 1687–1695. [Google Scholar]
- Lee, K.-T.; Yamakawa, T.; Kodama, T.; Shimomura, K. Effects of chemicals on alkaloid production by transformed roots of belladonna. Phytochemistry 1998, 49, 2343–2347. [Google Scholar] [CrossRef]
- Black, M.; Bewley, J.D. Seed Technology and Its Biological Basis; CRC Press: Boca Raton, FL, USA, 2000. [Google Scholar]
- Umnajkitikorn, K.; Faiyue, B.; Saengnil, K. Enhancing antioxidant properties of germinated Thai rice (Oryza sativa L.) cv. Kum Doi Saket with salinity. Rice Res. Open Access 2013, 1, 103. [Google Scholar] [CrossRef]
- Kovács, P.; Csaba, G.; Pállinger, É.; Czaker, R. Effects of taxol treatment on the microtubular system and mitochondria of Tetrahymena. Cell Biol. Int. 2007, 31, 724–732. [Google Scholar] [CrossRef]
- Verpoorte, R.; Contin, A.; Memelink, J. Biotechnology for the production of plant secondary metabolites. Phytochem. Rev. 2002, 1, 13–25. [Google Scholar] [CrossRef]
- Zafar, N.; Mujib, A.; Ali, M.; Tonk, D.; Gulzar, B. Aluminum chloride elicitation (amendment) improves callus biomass growth and reserpine yield in Rauvolfia serpentina leaf callus. Plant. Cell Tissue Organ Cult. (PCTOC) 2017, 130, 357–368. [Google Scholar] [CrossRef]
- Urdová, J.; Rexová, M.; Mučaji, P.; Balažová, A. Elicitation—A tool to improve secondary metabolites production in Melissa officinalis L. suspension cultures. Acta Fac. Pharm. Univ. Comen. 2015, 62 (Suppl. SIX), 46–50. [Google Scholar]
- Cai, Z.; Kastell, A.; Speiser, C.; Smetanska, I. Enhanced resveratrol production in Vitis vinifera cell suspension cultures by heavy metals without loss of cell viability. Appl. Biochem. Biotechnol. 2013, 171, 330–340. [Google Scholar] [CrossRef] [PubMed]
- Singh, S.; Parihar, P.; Singh, R.; Singh, V.P.; Prasad, S.M. Heavy Metal Tolerance in Plants: Role of Transcriptomics, Proteomics, Metabolomics, and Ionomics. Front. Plant Sci. 2016, 6, 1143. [Google Scholar] [CrossRef]
- Panda, S.; Singha, L.; Khan, M. Does aluminium phytotoxicity induce oxidative stress in greengram (Vigna radiata). Bulg. J. Plant Physiol. 2003, 29, 77–86. [Google Scholar]
- Sivanandhan, G.; Arun, M.; Mayavan, S.; Rajesh, M.; Mariashibu, T.; Manickavasagam, M.; Selvaraj, N.; Ganapathi, A. Chitosan enhances withanolides production in adventitious root cultures of Withania somnifera (L.) Dunal. Ind. Crop. Prod. 2012, 37, 124–129. [Google Scholar] [CrossRef]
- Yamamoto, Y.; Kobayashi, Y.; Devi, S.R.; Rikiishi, S.; Matsumoto, H. Aluminum toxicity is associated with mitochondrial dysfunction and the production of reactive oxygen species in plant cells. Plant Physiol. 2002, 128, 63–72. [Google Scholar] [CrossRef] [PubMed]
- Ghosh, S.; Ghosh, B.; Jha, S. Aluminium chloride enhances colchicine production in root cultures of Gloriosa superba. Biotechnol. Lett. 2006, 28, 497–503. [Google Scholar] [CrossRef]
- Namdeo, A. Plant cell elicitation for production of secondary metabolites: A review. Pharm. Rev. 2007, 1, 69–79. [Google Scholar]
- Akula, R.; Ravishankar, G.A. Influence of abiotic stress signals on secondary metabolites in plants. Plant Signal. Behav. 2011, 6, 1720–1731. [Google Scholar] [CrossRef]
- Roychoudhury, A.; Ghosh, S. Physiological and biochemical responses of mungbean (Vigna radiata L. Wilczek) to varying concentrations of cadmium chloride or sodium chloride. Unique J. Pharm. Biol. Sci. 2013, 1, 11–21. [Google Scholar]
- Cetin, E.S.; Babalik, Z.; Hallac-Turk, F.; Gokturk-Baydar, N. The effects of cadmium chloride on secondary metabolite production in Vitis vinifera cv. cell suspension cultures. Biol. Res. 2014, 47, 1–6. [Google Scholar] [CrossRef]
- Fornazier, R.F.; Ferreira, R.R.; Pereira, G.J.; Molina, S.M.; Smith, R.J.; Lea, P.J.; Azevedo, R.A. Cadmium stress in sugar cane callus cultures: Effect on antioxidant enzymes. Plant Cell Tissue Organ Cult. 2002, 71, 125–131. [Google Scholar] [CrossRef]
- Pitta–Alvarez, S.I.; Spollansky, T.C.; Giulietti, A.M. The influence of different biotic and abiotic elicitors on the production and profile of tropane alkaloids in hairy root cultures of Brugmansia candida. Enzym. Microb. Technol. 2000, 26, 252–258. [Google Scholar] [CrossRef]
- Kuthanová, A.; Gemperlová, L.; Zelenková, S.; Eder, J.; Macháčková, I.; Opatrný, Z.; Cvikrová, M. Cytological changes and alterations in polyamine contents induced by cadmium in tobacco BY-2 cells. Plant Physiol. Biochem. 2004, 42, 149–156. [Google Scholar] [CrossRef]
- Mishra, B.; Sangwan, R.S.; Mishra, S.; Jadaun, J.S.; Sabir, F.; Sangwan, N.S. Effect of cadmium stress on inductive enzymatic and nonenzymatic responses of ROS and sugar metabolism in multiple shoot cultures of Ashwagandha (Withania somnifera Dunal). Protoplasma 2014, 251, 1031–1045. [Google Scholar] [CrossRef]
- Aidid, S.B.; Okamoto, H. Responses of elongation growth rate, turgor pressure and cell wall extensibility of stem cells of Impatiens balsamina to lead, cadmium and zinc. Biometals 1993, 6, 245–249. [Google Scholar] [CrossRef]
- Panda, S.K.; Baluška, F.; Matsumoto, H. Aluminum stress signaling in plants. Plant Signal. Behav. 2009, 4, 592–597. [Google Scholar] [CrossRef] [PubMed]
- Zheng, Z.; Wu, M. Cadmium treatment enhances the production of alkaloid secondary metabolites in Catharanthus roseus. Plant Sci. 2004, 166, 507–514. [Google Scholar] [CrossRef]
- Furze, J.M.; Rhodes, M.J.; Parr, A.J.; Robins, R.J.; Withehead, I.M.; Threlfall, D.R. Abiotic factors elicit sesquiterpenoid phytoalexin production but not alkaloid production in transformed root cultures of Datura stramonium. Plant Cell Rep. 1991, 10, 111–114. [Google Scholar] [CrossRef] [PubMed]
- Canadanovic-Brunet, J.M.; Djilas, S.M.; Cetkovic, G.S.; Tumbas, V.T. Free-radical scavenging activity of wormwood (Artemisia absinthium L.) extracts. J. Sci. Food Agric. 2005, 85, 265–272. [Google Scholar] [CrossRef]
- Haribabu, T.; Sudha, P. Effect of heavy metals copper and cadmium exposure on the antioxidant properties of the plant Cleome gynandra. Int. J. Plant Anim. Environ. Sci. 2011, 1, 80–87. [Google Scholar]
- Dazy, M.; Masfaraud, J.-F.; Férard, J.-F. Induction of oxidative stress biomarkers associated with heavy metal stress in Fontinalis antipyretica Hedw. Chemosphere 2009, 75, 297–302. [Google Scholar] [CrossRef] [PubMed]
- Michalak, A. Phenolic compounds and their antioxidant activity in plants growing under heavy metal stress. Pol. J. Environ. Stud. 2006, 15, 523–530. [Google Scholar]
- Gallego, S.M.; Benavides, M.P.; Tomaro, M.L. Effect of heavy metal ion excess on sunflower leaves: Evidence for involvement of oxidative stress. Plant Sci. 1996, 121, 151–159. [Google Scholar] [CrossRef]
- Wang, J.W.; Wu, J.Y. Effective elicitors and process strategies for enhancement of secondary metabolite production in hairy root cultures. Biotechnol. Hairy Root Syst. 2013, 134, 55–89. [Google Scholar]
- Bowler, C.; Montagu, M.v.; Inze, D. Superoxide dismutase and stress tolerance. Annu. Rev. Plant Biol. 1992, 43, 83–116. [Google Scholar] [CrossRef]
- Zhang, S.; Zhang, H.; Qin, R.; Jiang, W.; Liu, D. Cadmium induction of lipid peroxidation and effects on root tip cells and antioxidant enzyme activities in Vicia faba L. Ecotoxicology 2009, 18, 814–823. [Google Scholar] [CrossRef] [PubMed]
- Panda, S.K.; Khan, M.H. Changes in growth and superoxide dismutase activity in Hydrilla verticillata L. under abiotic stress. Braz. J. Plant Physiol. 2004, 16, 115–118. [Google Scholar] [CrossRef]
- Namjooyan, S.; Khavarinejad, R.; Bernard, F.; Namdjoyan, S.; Piri, H. The effect of cadmium on growth and antioxidant responses in the safflower (Carthamus tinctorius L.) callus. Turk. J. Agric. For. 2012, 36, 145–152. [Google Scholar]
- Shekhawat, M.S.; Shekhawat, N. Micropropagation of Arnebia hispidissima (Lehm). DC. and production of alkannin from callus and cell suspension culture. Acta Physiol. Plant 2011, 33, 1445–1450. [Google Scholar] [CrossRef]
- Hsu, Y.T.; Kao, C.H. Cadmium toxicity is reduced by nitric oxide in rice leaves. Plant Growth Regul. 2004, 42, 227–238. [Google Scholar] [CrossRef]
- Ding, B.; Shi, G.; Xu, Y.; Hu, J.; Xu, Q. Physiological responses of Alternanthera philoxeroides (Mart.) Griseb leaves to cadmium stress. Environ. Pollut. 2007, 147, 800–803. [Google Scholar] [CrossRef]
- Ali, M.; Abbasi, B.H. Production of commercially important secondary metabolites and antioxidant activity in cell suspension cultures of Artemisia absinthium L. Ind. Crop. Prod. 2013, 49, 400–406. [Google Scholar] [CrossRef]
- Velioglu, Y.; Mazza, G.; Gao, L.; Oomah, B. Antioxidant activity and total phenolics in selected fruits, vegetables, and grain products. J. Agric. Food Chem. 1998, 46, 4113–4117. [Google Scholar] [CrossRef]
- Shahriar, M.; Akhter, S.; Hossain, M.I.; Haque, M.A.; Bhuiyan, M.A. Evaluation of in vitro antioxidant activity of bark extracts of Terminalia arjuna. J. Med. Plants Res. 2012, 6, 5286–5298. [Google Scholar]
- Nayyar, H.; Gupta, D. Differential sensitivity of C3 and C4 plants to water deficit stress: Association with oxidative stress and antioxidants. Environ. Exp. Bot. 2006, 58, 106–113. [Google Scholar] [CrossRef]
- Lagrimini, L. Plant peroxidases: Under-and over-expression in transgenic plants and physiological consequences. Plant Peroxidases 1980, 1990, 59–69. [Google Scholar]
- Giannopolitis, C.N.; Ries, S.K. Superoxide dismutases: I. Occurrence in higher plants. Plant Physiol. 1977, 59, 309–314. [Google Scholar] [CrossRef] [PubMed]
- Lee, S.K.; Mbwambo, Z.; Chung, H.; Luyengi, L.; Gamez, E.; Mehta, R.; Kinghorn, A.; Pezzuto, J. Evaluation of the antioxidant potential of natural products. Comb. Chem. High Throughput Screen. 1998, 1, 35–46. [Google Scholar] [PubMed]


Publisher’s Note: MDPI stays neutral with regard to jurisdictional claims in published maps and institutional affiliations. |
© 2021 by the authors. Licensee MDPI, Basel, Switzerland. This article is an open access article distributed under the terms and conditions of the Creative Commons Attribution (CC BY) license (https://creativecommons.org/licenses/by/4.0/).